bill french - eve - version 2
TRANSCRIPT

Case Study: BILL FRENCH
Joanne LazaretoJudy LiuEvelyn Rose LumbisLarissa Nepomuceno
February 4, 2012

OUTLINE
Case BackgroundStatement of the ProblemObjective of the CaseQuestion and AnswerConclusionRecommendation

Duo-Products Corporation – manufacturing company
Bill French – newly hired staff accountant for six months- doing routine types of analytical work- a business school graduate- considered by his associates to be quite capable and unusually
conscientious
CASE BACKGROUND
CASE BACKGROUND
“The company must be able at least to sell a sufficient volume of goods so that it will cover all the variable costs of producing and selling the goods. Further, it will not make a profit unless it covers the fixed costs as well. The level of operation at which total costs are just covered is the break-even volume. This should be the lower limit in all our planning.”
– Bill French
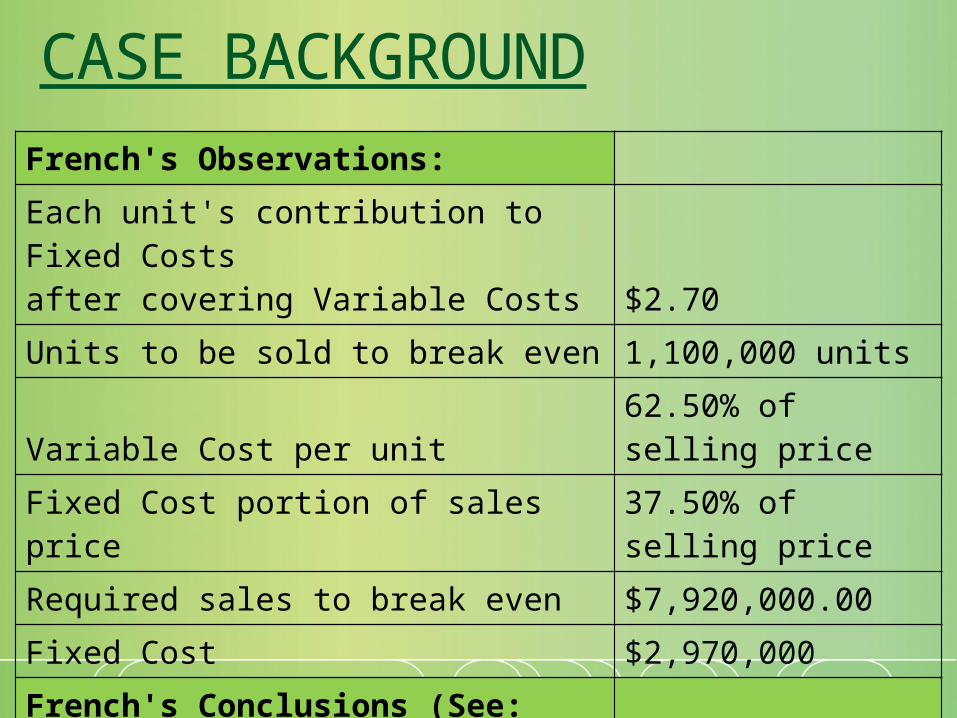
French's Observations:
Each unit's contribution to Fixed Costsafter covering Variable Costs $2.70Units to be sold to break even 1,100,000 unitsVariable Cost per unit 62.50% of selling priceFixed Cost portion of sales price 37.50% of selling priceRequired sales to break even $7,920,000.00Fixed Cost $2,970,000French's Conclusions (See: Exhibit 1) The firm was operating at a fair margin above break even
Pre-tax profits increased rapidly as volume increased
CASE BACKGROUND
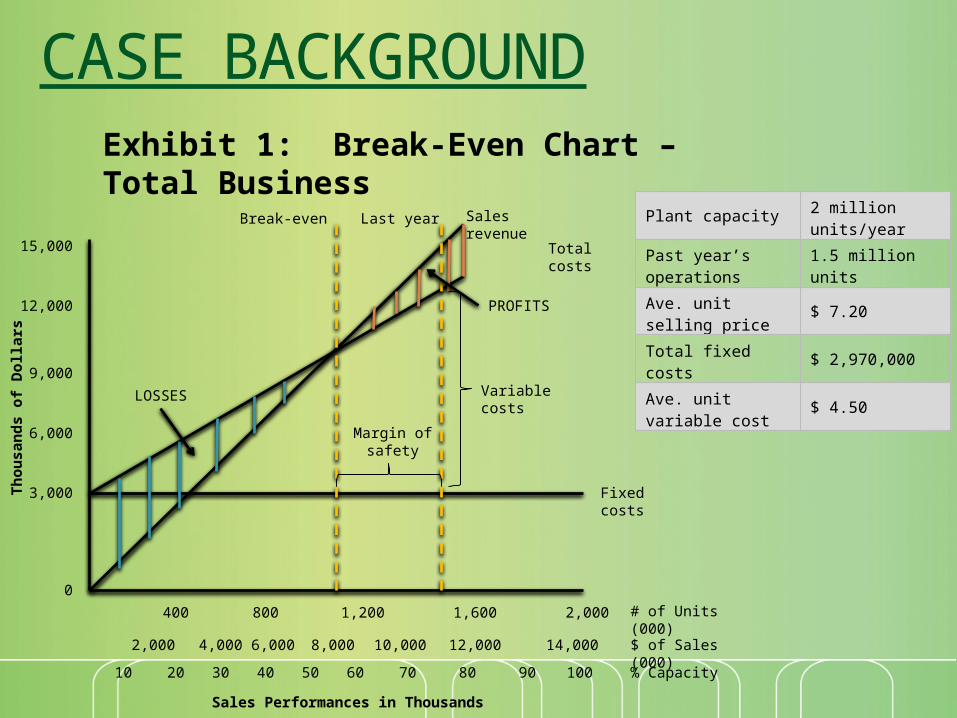
CASE BACKGROUNDExhibit 1: Break-Even Chart – Total Business
3,000
0
6,000
9,000
12,000
15,000
400 800 1,200 1,600 2,000
LOSSES
Break-even Last year Sales revenue
Total costs
PROFITS
Variable costs
Fixed costs
Margin of safety
# of Units (000)
2,000 4,000 6,000 8,000 10,000 12,000 14,000 $ of Sales (000)
10 20 30 40 50 60 70 80 90 100 % Capacity
Sales Performances in Thousands
Thou
sand
s of
Dol
lars
Plant capacity 2 million units/year
Past year’s operations 1.5 million units
Ave. unit selling price $ 7.20
Total fixed costs $ 2,970,000
Ave. unit variable cost $ 4.50

CASE BACKGROUNDMeeting in Duo-Products Corporation:
Exhibit 2: Meeting Participants
Bill French Staff Accountant
Wes Davidson Controller
John Cooper Production Control
Fred Williams Manufacturing
Ray Bradshaw Assistant Sales Manager
Arnie Winetki General Sales Manager
Anne Fraser Administrative Assistant to the President

CASE BACKGROUNDExhibit 3: Product Class Cost Analysis Normal Year
Aggregate “A” “B” “C”
Sales at full capacity (units) 2,000,000
Actual sales volume (units) 1,500,000 600,000 400,000 500,000
Unit sales price $ 7.20 $ 10.00 $ 9.00 $ 2.40
Total sales revenue 10,800,000 6,000,000 3,600,000 1,200,000
Variable cost per unit 4.50 7.50 3.75 1.50
Total variable cost 6,750,000 4,500,000 1,500,000 750,000
Fixed costs 2,970,000 960,000 1,560,000 450,000
Profit 1,080,000 540,000 540,000 0
Ratios: Variable cost to sales Unit contribution to sales Utilization of capacity
0.6250.375
75%
0.750.2530%
0.420.5820%
0.6250.375
25%
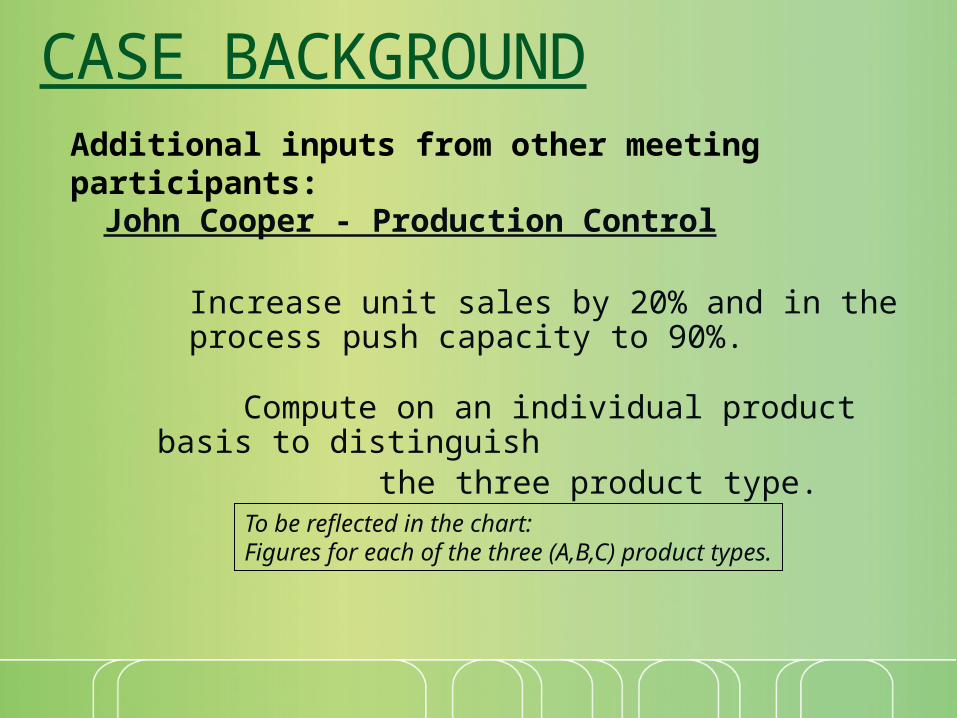
CASE BACKGROUNDAdditional inputs from other meeting participants:
John Cooper - Production Control
Increase unit sales by 20% and in the process push capacity to 90%.
Compute on an individual product basis to distinguish
the three product type. To be reflected in the chart:Figures for each of the three (A,B,C) product types.

CASE BACKGROUNDAdditional inputs from other meeting participants:
Fred Williams - Manufacturing
Manufacturing got an approved additional investments increasing fixed costs by at least $60,000 a month ($ 720,000 per year). Pushing plant capacity to 90% may not be that easy because there are places (in the plant) which already reached their limits.
To be reflected in the chart:Increase in fixed cost.
FC= 2,970,000 + (12 x P60,000)= P3,690,000
CASE BACKGROUNDAdditional inputs from other meeting participants:
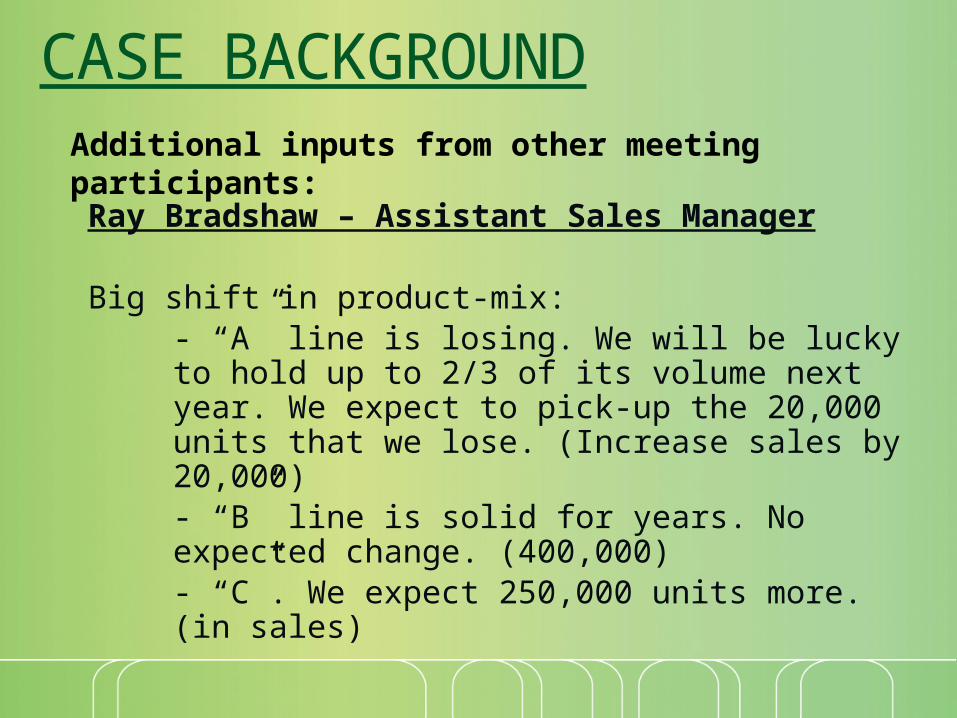
Ray Bradshaw – Assistant Sales Manager
Big shift in product-mix:- “A” line is losing. We will be lucky to hold up to 2/3 of its volume next year. We expect to pick-up the 20,000 units that we lose. (Increase sales by 20,000)- “B” line is solid for years. No expected change. (400,000)- “C”. We expect 250,000 units more. (in sales)
CASE BACKGROUNDAdditional inputs from other meeting participants:
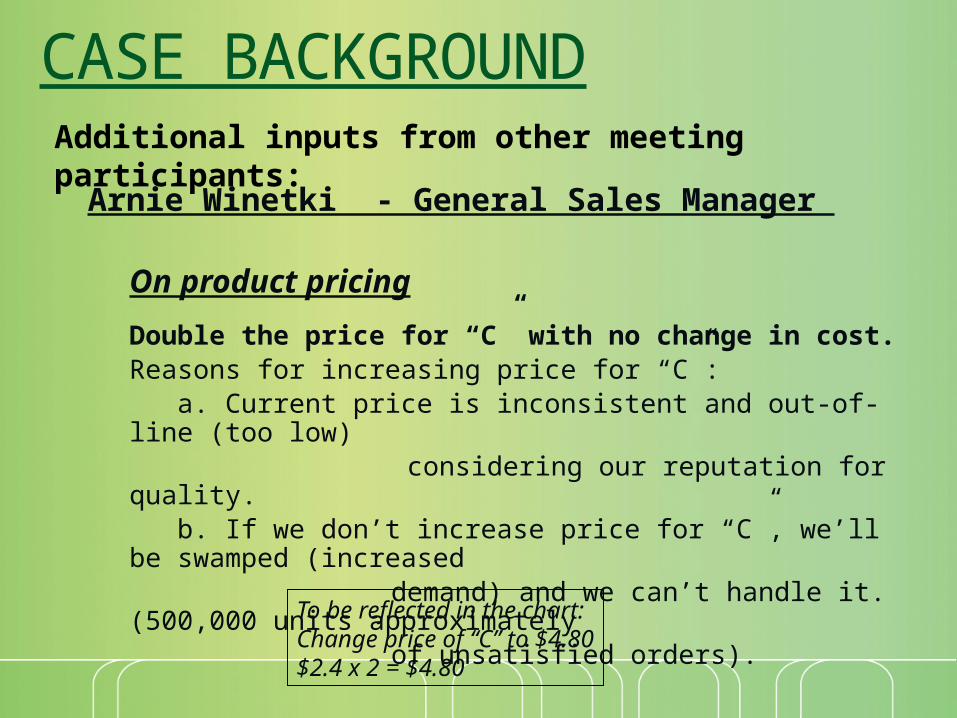
Arnie Winetki - General Sales Manager
On product pricing
Double the price for “C” with no change in cost.Reasons for increasing price for “C”:
a. Current price is inconsistent and out-of-line (too low) considering our reputation for quality.
b. If we don’t increase price for “C”, we’ll be swamped (increased
demand) and we can’t handle it. (500,000 units approximately of unsatisfied orders).
To be reflected in the chart:Change price of “C” to $4.80$2.4 x 2 = $4.80

CASE BACKGROUNDAdditional inputs from other meeting participants:
Anne Fraser - Administrative Assistant to President
On profit
1. On Net profit after taxes.Last year’s profit is $900,000, but half ($450,000) went to taxes.$300,000 were paid to stockholders as dividends.(Approximate profit after tax was only $450,000)
Assumption: Tax= 50% of Net Profit Before Tax(After dividend payments, only $150,000 was left)Target for this year: $600,000 after tax ($1,200,000 before tax)Need to increase profit after taxes by $150,000 more because of plan to give out 50% more dividends because of the anniversary year. ($450,000 dividends)
CASE BACKGROUNDAdditional inputs from other meeting participants:
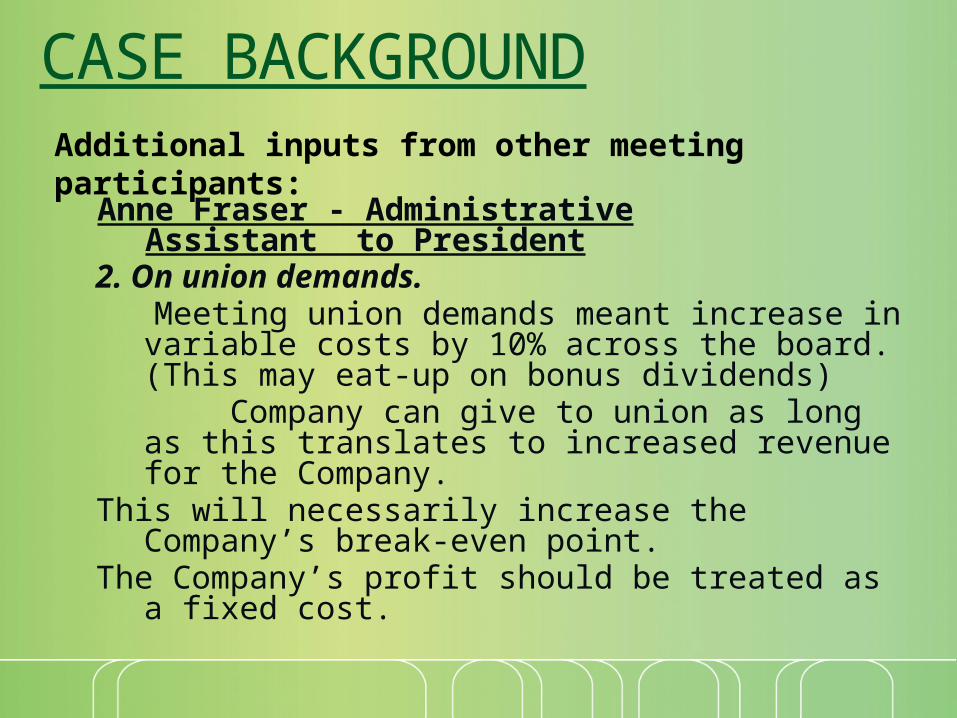
2. On union demands. Meeting union demands meant increase in variable costs
by 10% across the board. (This may eat-up on bonus dividends)
Company can give to union as long as this translates to increased revenue for the Company.
This will necessarily increase the Company’s break-even point.The Company’s profit should be treated as a fixed cost.
Anne Fraser - Administrative Assistant to President

CASE BACKGROUNDAdditional inputs from other meeting participants:
Anne Fraser - Administrative Assistant to President
3. On changing product-emphasis. Product contribution of “A” line is the lowest among three. Solution: Shift some assets from “A” to “C”. Wes Davidson (Controller): Bill, you rework your chart. The
chart is based on a series of assumptions. Try to set those assumptions in black and white.
Additional, insert in the chart the following:Unit sales increase, change in product mix, price change in “C”,
increase in fixed manufacturing costs of $60,000 a month, taxes, dividends and product emphasis. Compute also for individual products.

STATEMENT OF THE PROBLEM
What should be Bill French’s revised cost-volume-profit (CVP) analysis after his colleagues provided additional information, which he must consider in his study?

OBJECTIVES OF THE CASE STUDY To apply the cost-volume-profit analysis to:
– determine the company’s break-even point; and
– determine the level of operations that must be achieved, given specific business conditions.

QUESTION & ANSWER1) What are the assumptions implicit in Bill French’s determination of his
company’s break-even point?
The following are Bill French’s assumptions:
a. There is just one break-even point for the firm.
b. The sales mix will remain constant and there will be no substantial change in product prices.
c. The total revenue and total expenses behave in a linear manner over the relevant range.
d. There will be no significant changes in the business/operations (e.g. sales volume will be maintained, constant dividends for the stockholders, labor union will not affect costs).
e. The increase in capacity will be allocated to Product “C” since the production of this product will be increased. The production of Product “A” is to be decreased, but its level of fixed costs is assumed to be unchanged.
QUESTION & ANSWER
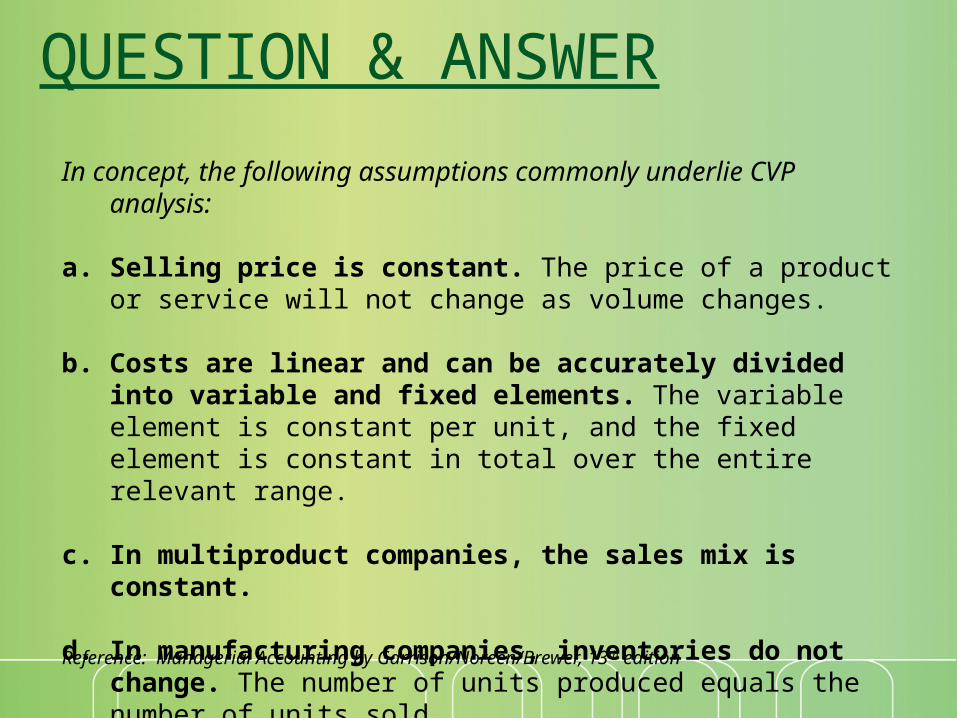
In concept, the following assumptions commonly underlie CVP analysis:
a. Selling price is constant. The price of a product or service will not change as volume changes.
b. Costs are linear and can be accurately divided into variable and fixed elements. The variable element is constant per unit, and the fixed element is constant in total over the entire relevant range.
c. In multiproduct companies, the sales mix is constant.
d. In manufacturing companies, inventories do not change. The number of units produced equals the number of units sold.
Reference: Managerial Accounting by Garrison/Noreen/Brewer, 13th edition
QUESTION & ANSWER2) On the basis of French’s revised information, what does next year look like?
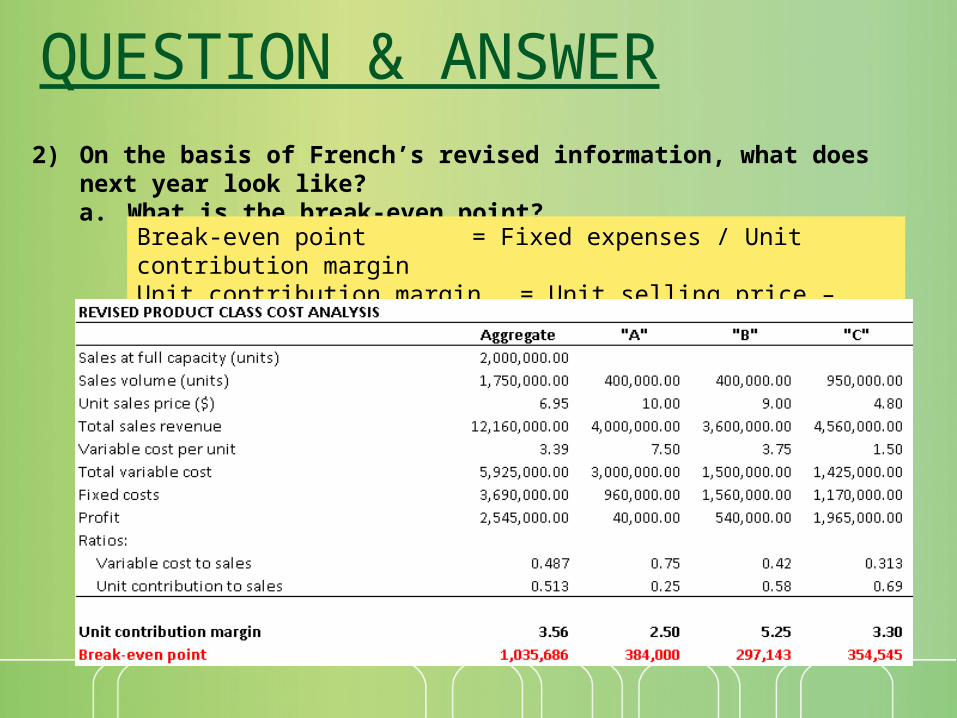
a. What is the break-even point?
Break-even point = Fixed expenses / Unit contribution marginUnit contribution margin = Unit selling price – Variable cost per unit
QUESTION & ANSWER2) On the basis of French’s revised information, what does next year look like?
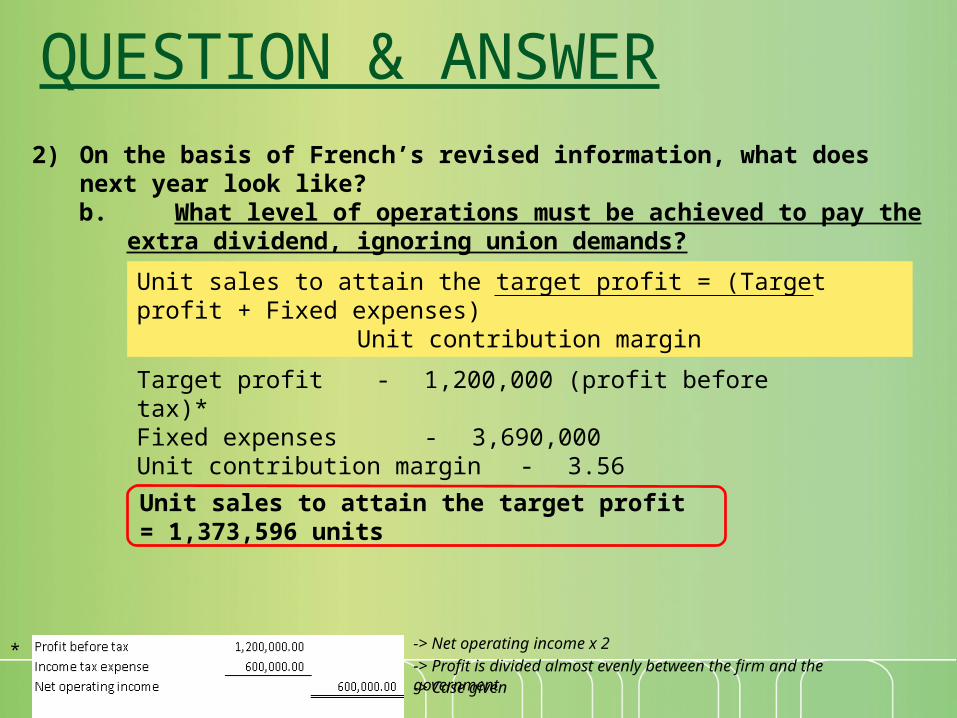
b. What level of operations must be achieved to pay the extra dividend, ignoring union demands?
Unit sales to attain the target profit = (Target profit + Fixed expenses) Unit contribution margin
Target profit - 1,200,000 (profit before tax)*Fixed expenses - 3,690,000Unit contribution margin - 3.56
Unit sales to attain the target profit = 1,373,596 units
*
-> Case given-> Profit is divided almost evenly between the firm and the government-> Net operating income x 2
QUESTION & ANSWER2) On the basis of French’s revised information, what does next year look like?
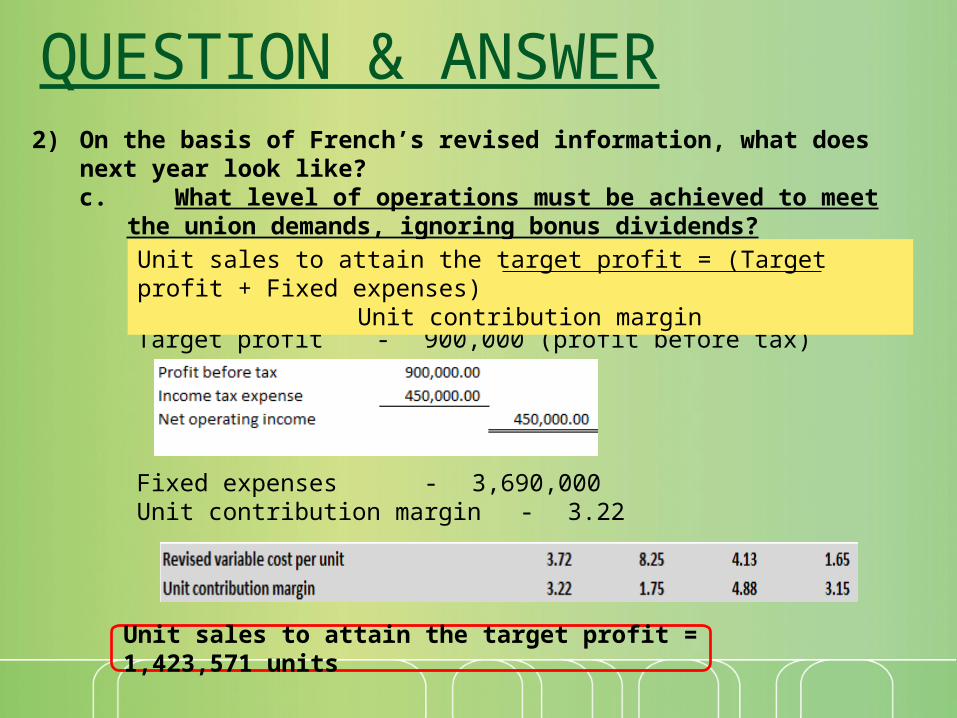
c. What level of operations must be achieved to meet the union demands, ignoring bonus dividends?
Target profit - 900,000 (profit before tax)
Fixed expenses - 3,690,000Unit contribution margin - 3.22
Unit sales to attain the target profit = 1,423,571 units
Unit sales to attain the target profit = (Target profit + Fixed expenses) Unit contribution margin

QUESTION & ANSWER2) On the basis of French’s revised information, what does next year look like?
d. What level of operations must be achieved to meet both dividends and expected union requirements?
Target profit - 1,200,000 (profit before tax)
Fixed expenses - 3,690,000Unit contribution margin - 3.22
Unit sales to attain the target profit = 1,516,615 units
Unit sales to attain the target profit = (Target profit + Fixed expenses) Unit contribution margin
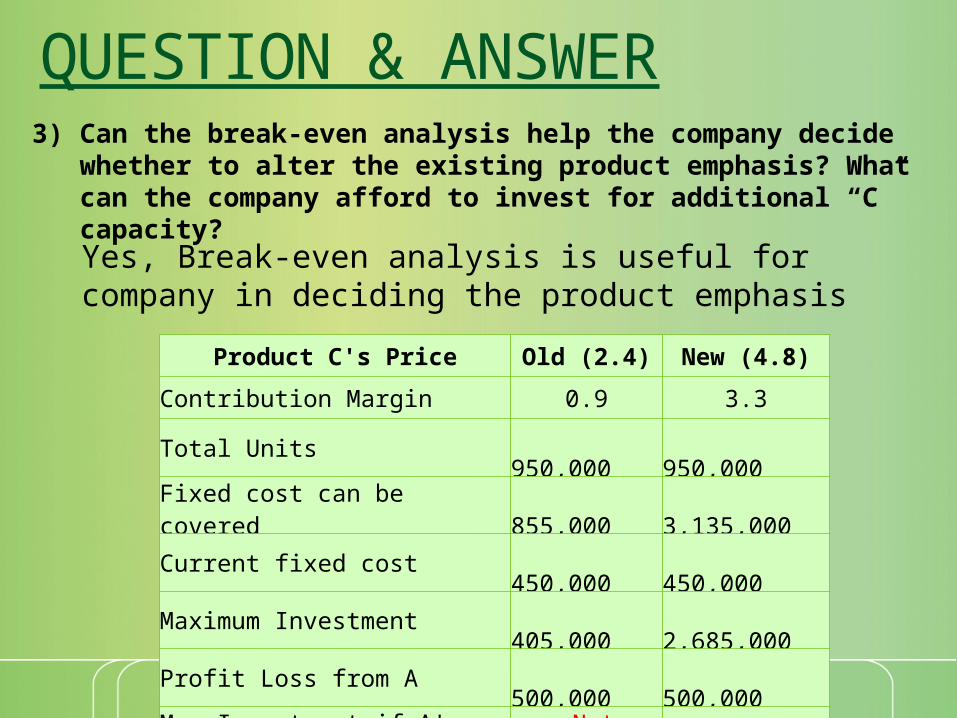
QUESTION & ANSWER3) Can the break-even analysis help the company decide whether to alter the
existing product emphasis? What can the company afford to invest for additional “C” capacity?
Yes, Break-even analysis is useful for company in deciding the product emphasis
Product C's Price Old (2.4) New (4.8)
Contribution Margin 0.9 3.3
Total Units 950,000 950,000
Fixed cost can be covered 855,000 3,135,000
Current fixed cost 450,000 450,000
Maximum Investment 405,000 2,685,000
Profit Loss from A 500,000 500,000
Max Investment if A's loss taken Not Possible 2,185,000

QUESTION & ANSWER4) Calculate each of the three products’ break-even points using the data in
Exhibit 3? Why is the sum of these three volumes not equal to the 1,100,000 units aggregate break-even volume?
Product A = 384,000 unitsProduct B = 297,143 unitsProduct C = 500,000 units
The sum total is not equal to the 1,100,000 units aggregate breakeven volume because each product has a different contribution margin ratio and different level of fixed costs and sales volume.

QUESTION & ANSWER5) Is this type of analysis of any value? For what can it be used?
Break-even analysis is a basic tool that can be used by managers to determine the level of sales that is required for the company to start earning a profit. It allows managers to see how changing sales prices and costs affect their profits.
It will help understand and formulate the relationship between costs (fixed and variable), output and profit
It will help to quickly observe profit levels at different output
In a wide product range, the analysis helps to find out which products are performing well and which are leading to losses
The technique can be used to set sales targets and/or prices to generate target profits
CONCLUSION & RECOMMENDATION
xyz

END OF PRESENTATIONThank You
Questions?