billing formula for the inland empire brine line - sawpa · billing formula for the inland empire...
TRANSCRIPT

Billing Formula for the Inland Empire Brine Line
1
Dischargers Workshop July 7, 2016
Emily Owens-Bennett, P.E., Bryan Trussell, P.E., Rhodes Trussell, Ph.D., P.E.
Trussell Technologies, Inc.
Presentation Outline
• Approach • Results • Proposed Billing Formula • Monitoring Program • Recommendations
2

APPROACH
3

Methodology County Line Solids Characterization
4
CalciumMinerals OthernVSS Water Cellulose Bio-OrganicMa8er
*Values in lbs/month based on 2015 data
11400030%
12900035%
66102%
151004%
10800029%
1. Elemental composition (ICP, EDX) 2. Mineral composition (XRD) 3. Waters of hydration (TGA)
Inorganic Analyses
1. TSS 2. VSS 3. Alkalinity 4. BOD
General Analyses
1. Particulate Organic Carbon (POC) by indirect and direct measurements
2. Organic characterization (TGA)
Organic Analyses

Methodology
5
Discharged Suspended
Solids =
Suspended Solids Formed in Brine Line
–
County Line Suspended Solids
…so, if we can
determine this…
We know this… …then, we
can calculate this.
11400030%
12900035%
66102%
151004%
10800029%

Methodology
6
• 3-day sampling event

SAMPLING RESULTS DISCHARGERS AND COUNTY LINE
7

Sampling Results - Organics
• Measurements – VSS, POC, TGA, BOD5
• Formation of organic solids: – ∆Organics = OrganicsIN – OrganicsOUT – Cellulose is conserved (IN = OUT) – Therefore, ∆Organics = biomass formed
8
LOI 100ºC: 3.7%
LOI 950ºC: 4.4%
LOI 300ºC: 30.9%
LOI 200ºC: 6.5%
LOI 650ºC: 1.1%
LOI 450ºC: 9.2%
LOI 550ºC: 5.6%
LOI 700ºC to 950ºC: 3.9%
CaCO3 → CaO + CO
2232˚C (451˚F)

Sampling Results - Organics
• Calculation of biomass formation – Biomass from POC, VSS, & cellulose (via TGA) – Microbial biomass formed: 8 mg/L
• Alternative estimate as independent check – ∆Dissolved BOD5, travel time, growth rates, and
yield – Microbial biomass formed: 5-8 mg/L, depending
on assumed yield (variable) – Results validate calculation
9

Sampling Results - Inorganics
• Measurements – ICP Metals (solids, total, and dissolved) – Alkalinity (total and dissolved) – Orthophosphate (total and dissolved)
• Calcium was dominant inorganic
10

Sampling Results - Inorganics • Calculation of particulate calcium (CaP)
formation – CaP-IN = Σ(Total – Dissolved) for all dischargers
(ICP of liquid) – CaP-OUT = ICP of TSS at County Line – Calcium minerals formed: 18 mg/L
• Alternative estimate as independent check – ∆Dissolved Calcium = Calcium Minerals Formed – Calcium minerals formed: 21 mg/L – Results validate calculation
11

12
County Line Suspended Solids
Discharged Suspended Solids
Suspended Solids Formed in Brine Line
Concentration
mg/L
Microbial Biomass 50
Cellulosic Material 25
Calcium Minerals 42
Other Inorganics 8
Total 125
ComponentConcentration
mg/L
42
25
25
10
102
Concentration
mg/L
8
0
18
-2
24
Sampling Results

13
County Line Suspended Solids
Discharged Suspended Solids
Suspended Solids Formed in Brine Line
Concentration
mg/L
Microbial Biomass 50
Cellulosic Material 25
Calcium Minerals 42
Other Inorganics 8
Total 125
ComponentConcentration
mg/L
42
25
25
10
102
Concentration
mg/L
8
0
18
-2
24
Sampling Results
MicrobialBiomass50.1mg/L
CellulosicMaterial24.9mg/L
OtherInorganics7.6mg/L
CalciumMinerals42.4mg/L
MicrobialBiomass42.2mg/L
CellulosicMaterial24.9mg/L
OtherInorganics9.6mg/L
CalciumMinerals24.8mg/L
MicrobialBiomass7.9mg/L
CalciumMinerals17.6mg/L

14
County Line Suspended Solids
Discharged Suspended Solids
Suspended Solids Formed in Brine Line
Concentration
mg/L
Microbial Biomass 50
Cellulosic Material 25
Calcium Minerals 42
Other Inorganics 8
Total 125
ComponentConcentration
mg/L
42
25
25
10
102
Concentration
mg/L
8
0
18
-2
24
Sampling Results
MicrobialBiomass50.1mg/L
CellulosicMaterial24.9mg/L
OtherInorganics7.6mg/L
CalciumMinerals42.4mg/L
MicrobialBiomass42.2mg/L
CellulosicMaterial24.9mg/L
OtherInorganics9.6mg/L
CalciumMinerals24.8mg/L
MicrobialBiomass7.9mg/L
CalciumMinerals17.6mg/L
Sediment traps

PROPOSED BILLING FORMULA
15

Microbial Biomass
Cellulosic Material
Calcium Minerals
Other Inorganics
Total
ComponentConcentration
mg/L
8
0
18
-2
24
16
X
MicrobialBiomass31%
CalciumMinerals69%
Total: 26 mg/L
Proposed Billing Formula Suspended Solids Formed in Brine Line

Proposed Billing Formula
17
Component Percent of total solids
Cost Allocation Parameter
Microbial Biomass 31% Dissolved BOD5
Calcium Minerals 69%
Dissolved Calcium
Dissolved Alkalinity
Total 100%
MicrobialBiomass31%
CalciumMinerals69%
Total: 26 mg/L
Suspended Solids Formed in Brine Line

Alkalinity
• Primary calcium minerals formed: – Calcium carbonate, CaCO3 – Amorphous calcium phosphates, (Ca)3(PO4)2
– Both compounds are 40% calcium by weight – The remaining 60% comes from the alkalinity
18

Alkalinity
• General equation for total alkalinity: – Total alkalinity = [OH-] + [HCO3
-] + [H2PO4-] +
2[CO32-] + 2[HPO4
2-] + 3[PO43-] – [H+] + [NH3] +
[H3SiO4-] + [B(OH)4
-] + [HS-] • When wastewater has pH 7-8 and typical
sulfide levels: – Total alkalinity ≈ [HCO3
-] + [H2PO4-] + 2[HPO4
2-]
19

Proposed Billing Formula
20
Component Percent of total solids
Cost Allocation Parameter
Microbial Biomass 31% Dissolved BOD5
Calcium Minerals 69%
Dissolved Calcium (40%)
Dissolved Alkalinity (60%)
Total 100%
MicrobialBiomass31%
CalciumMinerals69%
Total: 26 mg/L
Suspended Solids Formed in Brine Line

Proposed Billing Formula
Where: • FFi = Formation factor for individual discharger (i) • Alki = Individual dissolved alkalinity loading to the Brine Line for discharger (i) • AlkT = Combined dissolved alkalinity loading from all dischargers to the Brine Line • BODi = Individual dissolved BOD5 loading to the Brine Line for discharger (i) • BODT = Combined dissolved BOD5 loading from all dischargers to the Brine Line • Cai = Individual dissolved calcium loading to the Brine Line for discharger (i) • CaT = Combine dissolved calcium loading from all dischargers to the Brine Line
21
Alkalinity Load
BOD Load
Calcium Load
!!! = 0.41 ∗ !"#!!"#! + 0.31 ∗ !"#!
!"#! + 0.28 ∗ !"!!"!

MONITORING PROGRAM
22

Monitoring Program
1. Routine Monitoring – Dischargers and County Line
2. Quarterly County Line solids characterization
3. Annual Billing Formula Review
23

Monitoring Program Routine Monitoring • All dischargers and County Line • Billing parameters
– Flow − Alkalinity (total & dissolved) – TSS (triplicate) − BOD (total & dissolved, triplicate) – VSS (triplicate) − Calcium (total & dissolved)
• Monitoring frequency determined by loading contribution – Monthly monitoring for dischargers contributing to top
95% of load for any billing parameter – Quarterly monitoring for all others
24

Monitoring Program
25
Industrial Discharger TSS VSS Total BOD Dissolved BOD
Total Calcium
Dissolved Calcium Total Alkalinity Dissolved
Alkalinity PerrisandMenifeeDesalter M M M M M M M MChinoIDesalter M M M M M M M MTemescalDesalter M M M M M M M MChinoIIEastDesalter M M M M M M M MArlingtonDesalter M M M M M M M MJCSD-E<wanda M M M M M M M MCDCBonview M M M M M M M MCaliforniaIns<tuteforWomen M M M M M M M MMissionLinen M M M M M M M MStringfellow M M M M M M M MChinoIIWestDesalter Q Q Q Q Q Q Q QMountainviewPowerPlant Q Q Q Q Q Q Q QCaliforniaIns<tuteforMen Q Q Q Q Q Q Q QOLSEnergy Q Q Q Q Q Q Q QInlandBioenergy M M M M M M M MDiaryFarmersofAmerica Q Q Q Q Q Q Q QJCSD-Wineville M M M M M M M MJCSD-Hamner M M M M M M M MCoronaEnergyPartners Q Q Q Q Q Q Q QDartContainer Q Q Q Q Q Q Q QRepet M M M M M M M MWellingtonFoods Q Q Q Q Q Q Q QRubidouxCSD Q Q Q Q Q Q Q QFrutaromFlavorSpecial<es M M M M M M M MGreenRiverGolfCourse Q Q Q Q Q Q Q Q
Legend Top 3 75% of loading 95% of loading

Monitoring Program
Quarterly Monitoring • County Line solids characterization
26
MicrobialBiomass50.1mg/L
CellulosicMaterial24.9mg/L
OtherInorganics7.6mg/L
CalciumMinerals42.4mg/L

Monitoring Program
Annual Billing Formula Review • Compile annual results • Perform mass balance of system • Update billing formula, as needed
27
!!! = 0.41 ∗ !"#!!"#! + 0.31 ∗ !"#!
!"#! + 0.28 ∗ !"!!"!

RECOMMENDATIONS
28

Recommendations
• Study impact of antiscalant use • Review sampling and testing methodology
– Homogeneity of TSS samples – Variability of TSS measurements – Review Canyon RV Park S-01 monitoring
location • Review discharger sample locations
29

Questions?
30
Combined Discharge County Line Formation
MicrobialBiomass42.2mg/L
CellulosicMaterial24.9mg/L
OtherInorganics9.6mg/L
CalciumMinerals24.8mg/L
MicrobialBiomass7.9mg/L
CalciumMinerals17.6mg/L
MicrobialBiomass50.1mg/L
CellulosicMaterial24.9mg/L
OtherInorganics7.6mg/L
CalciumMinerals42.4mg/L

BACKUP SLIDES
31

SAMPLING RESULTS REACH-BY-REACH
32

33
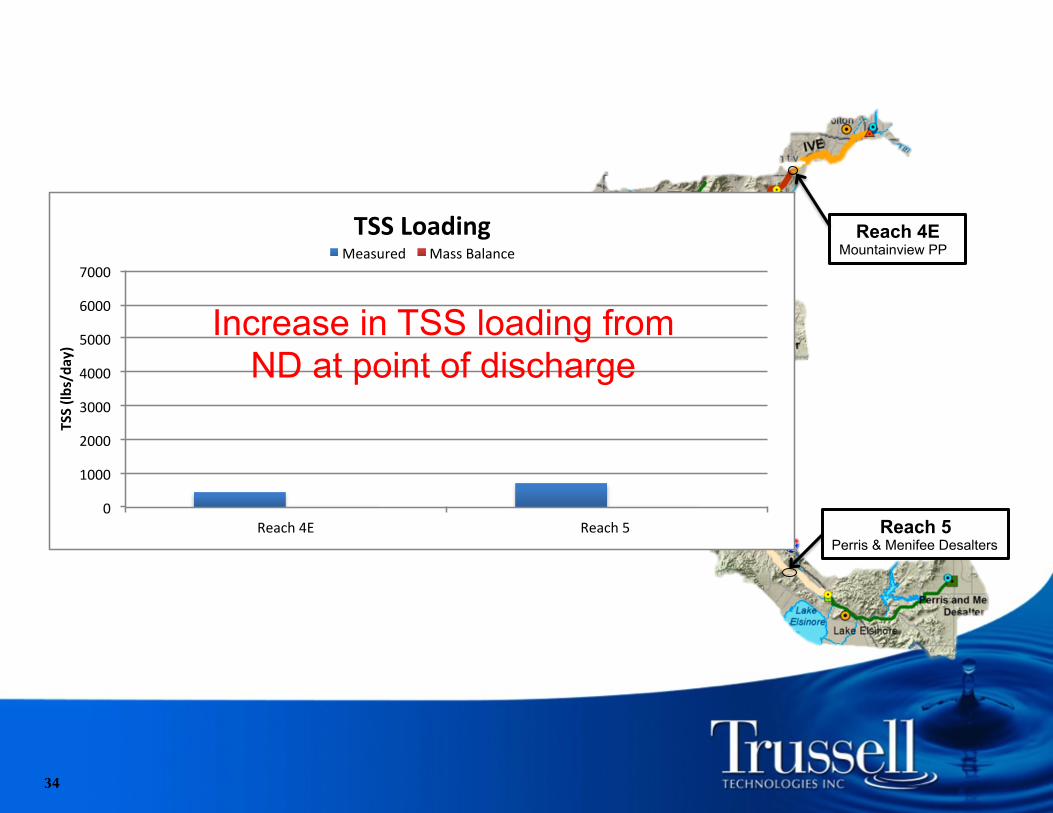
Reach 4E
Reach 4D
Reach 4A
Reach 4B
Reach 5
34
Reach 4E Mountainview PP
Reach 5 Perris & Menifee Desalters
0
1000
2000
3000
4000
5000
6000
7000
Reach4E Reach5
TSS(lb
s/da
y)
TSSLoadingMeasured MassBalance
Increase in TSS loading from ND at point of discharge

35
Reach 4E Mountainview PP
Reach 4D Rubidoux CSD Stringfellow Chino II Desalter (E & W) JCSD-Etiwanda JCSD-Wineville JCSD-Hamner CIW Chino I Desalter CDC Bonview
Reach 4A CIM Mission Linen OLS Power Repet Inland Bioenergy
Reach 4B Wellington Foods Arlington Desalter Temescal Desalter Dart Container CEP PP DFA Water Plant Frutarom
Reach 5 Perris & Menifee Desalters
0
1000
2000
3000
4000
5000
6000
7000
Reach4A Reach4B Reach4D Reach4E Reach5
TSS(lb
s/da
y)
TSSLoadingMeasured MassBalance