biogas potential from spent tea waste: a laboratory scale
TRANSCRIPT

1
Biogas potential from spent tea waste: A laboratory scale investigation of co-
digestion with cow manure
Naseem Khayum*, S. Anbarasu, S.Murugan
Department of Mechanical Engineering, National Institute of Technology Rourkela, India *Corresponding author e-mail address: [email protected]
Abstract
Spent tea waste (STW) is an organic waste that is disposed in open land after preparation of
tea. Generally, it is disposed in an open land which increases anthropogenic gases. Converting
it into useful energy or value added product may reduce disposal problem and anthropogenic
activity. In this study, STW was co-digested with cow manure (CM) for obtaining biogas by
anaerobic digestion. For this purpose, STW was mixed with CM at different proportions,
namely 50:50, 40:60, 30:70, 20:80, and 0:100 percentages on a mass basis, were used in five
different anaerobic digesters. The samples were kept in different anaerobic digesters for the
study. The effect of important input parameters like pH, Carbon to Nitrogen (C/N), and
digestion time on the biogas production were studied. Further, the collected biogas from the
digesters were characterised to ensure the suitability for use as a renewable fuel. Furthermore,
the digested slurry was also analysed for its use in agriculture sector. The results are presented
in this paper.
Keywords: Spent tea waste, Cow manure, anaerobic digestion, biogas
Nomenclature
STW Spent Tea Waste
CM Cow Manure
AD1 Anaerobic Digester1
C/N Carbon to Nitrogen
CH4 Methane
NH3 Ammonia
CO2 Carbon dioxide
H2S Hydrogen Sulphide
MSW Municipal Solid Waste
NIT National Institute of Technology
FTIR Fourier Transform Infrared Spectrography
O Oxygen
H Hydrogen
Br Bromine
I Iodine
Cl Chlorine
TS Total Solid
VS Volatile Solid
2
ml Millilitre
kg Kilogram
kW kilowatt
Vol. Volumetric
MJ Mega Joule
N/K Nitrogen to Potassium
N/P Nitrogen to Phosphorous
Fe Ferrous (iron)
Zn Zinc
Ni Nickel
Co Cobalt
GHG Greenhouse gases
1 Introduction
Global warming and ozone depletion are the two major threats to the world. Pollutants resulted
from combustion of fossil fuels and the anthropogenic gases released from dumping of organic
wastes into open land are believed to be the main reasons for global warming. Some of the
measures are being taken by many countries to control global warming are (i) adopting
emission reduction techniques for combustion devices (ii) using renewable alternative fuels
(iii) effective waste management [1]. Organic wastes are present in the form of biomass waste,
animal waste, municipal waste and industrial waste. Biomass waste is largely available in the
form of bushes, straws, residues, leaves, seeds etc. Industrial wastes include fodder and
brewery industries, food and fish processing, starch, milk, sugar, pulp and paper,
pharmaceuticals, biochemical and cosmetics, as well as slaughterhouses. The examples of
municipal wastes are garden waste, food waste and other organic wastes [2].
Spent tea leaves, spent tea waste, and spent coffee powder, are the type of organic wastes
significantly available in houses, restaurants, hotels, refreshment stalls throughout the world.
Some documents in the form of research articles are available on obtaining energy or fuel from
spent tea leaves [3] [4], spent coffee powder [5] [6], and still there is a need to explore more
possibilities of converting such residues into useful energy.
There are two main methods adopted for converting organic wastes into energy or fuels are; (i)
thermochemical conversion and (ii) biochemical conversion. Example of thermochemical
conversion includes direct combustion, pyrolysis and gasification. The examples of the
biochemical conversion are anaerobic digestion and fermentation. Biochemical conversion is
the most suitable technique for a maximum recovery of energy from organic wastes [7]. It can
be used when an organic waste is almost free from metals. Among the biochemical conversion

3
methods, anaerobic digestion is a well-recognised and proven technology by which
biodegradable organic matters are decomposed with the help of bacteria in the absence of air,
creating biogas as a by-product. In an anaerobic digestion process, process stability is very
important. Sometimes, instability occurs between the micro-organisms is due to inhibition.
Inhibitory substances like sulphide, ammonia, heavy metals like Fe, Zn, Ni, Co, chromium,
mercury, lead and manganese, organic compounds include chlorinated hydrocarbons, benzene
ring compounds, cyanides, phenols and alkyl phenols, lignin related compounds, organic acids
(long fatty acids and amino acids), citrus oils (limonene) etc., will adversely affect the
anaerobic digestion process [8] [9]. Owing to high energy recovery and limited environmental
impact, anaerobic digestion is widely used for the conversion of different organic wastes into
energy or fuel.
Biogas is a renewable gaseous fuel obtained from the anaerobic digestion of variety of feed
stocks that originate from agriculture, municipal and industry [10]. Biogas obtained from a
single feed stock mainly depends upon the feed stock characteristics. Co-digestion involves the
mixing of two or more different feed stocks in a suitable proportions to obtain a complementary
characteristics of the feed stocks. Many research papers have been published on the
performance of anaerobic digesters using different organic wastes. Co-digestion offers a few
advantages such as dilution of inhibitory wastes, supply of sufficient nutrients, and initiation
of positive synergism in digester medium and enhancement of biogas production [11]. Only a
few papers dealt directly with the co-digestion of animal manure which are discussed in the
next paragraph.
An investigation was carried out by Zhai et al. [12] to study out the effect of pH (6.0-8.0)
anaerobic co-digestion of kitchen waste with cow manure that was carried out in a laboratory
scale digester. The results revealed that, the pH values in the range of 7.7-7.9, increased the
biogas production yield. Finally, the experimental results were compared with those of the
results obtained from a modified Gompertz equation. A study was carried out by Riggio et al.
[13], to assess the feasibility of biogas production by mixing cow slurry with olive pomace and
apple pulp. It was concluded that, a mixture containing 85% cow slurry, 15% olive pomace,
5% apple pulp gave a better yield. It was also concluded that, a stable biogas production was
obtained at a digestion time of 40 days. Food wastes are largely available year round and have
the potential of biofuel production. Many researchers studied on the digestion of food waste
for obtaining energy or fuel. For instance, co-digestion of cow manure and food waste balances
the nutrients in an anaerobic digester, and thus providing a more stable environment for the

4
growth of anaerobic bacteria [14]. In another study, thermophilic anaerobic digestion of cattle
manure and pasteurised food waste was assessed in batch and high volume lab scale digesters
[15]. During this study, it was found that, the specific methane production increased by about
86%, and a reduction in volatile solid (VS) by about 35.2% when compared to the
monodigestion of cattle manure. To enhance the performance of the anaerobic digester, various
pre-treatment techniques can be employed. Song et al. [16], conducted the experiments by pre-
treating wheat straw with H2O2 at different concentrations viz., 1%, 2%, 3%, and 4%. The
pretreated feed stock was co-digested with the dairy cattle manure at different ratios. It was
concluded that, wheat straw treated with 3% H2O2 was the optimal concentration. Also, the
methane yield was found to be higher with the co-digestion of treated wheat straw than
untreated wheat straw or dairy cattle manure alone. Most recently, a few articles have been
published on the anaerobic co-digestion of livestock manure with the organic wastes are cow
manure with barley [17], cow manure with sugar beet by-product [18], dairy manure with
tomato residues and corn stover [19], cow manure with kitchen waste and water hyacinth [20],
goose manure with alkali solubilised wheat straw [21], chicken manure and pig manure with
corn stover and apple pulp [22], and sheep dung with waste paper [23]. The results of all these
studies significantly improved the biogas production.
The main aim of this study was to make an attempt to use the spent tea waste (STW) as a co-
substrate in combination with cow manure for production of biogas. For this purpose, STW
was mixed with CM at different proportions in five different anaerobic digesters like AD1,
AD2, AD3, AD4, and AD5. Further, the study was aimed to evaluate the various affecting
parameters on the biogas production. Finally, the samples of biogas obtained from the digesters
were characterised to ensure the quality for using it as an alternative gaseous fuel. Further, the
digested slurry was also analysed to utilize as a fertilizer for growth of crops.
1.1 Potential of spent tea waste
Tea is one of the most popular and lowest cost beverages in the world, and is consumed by a
large number of people. Majority of the tea producing countries are located in the continent of
Asia where China, India, and Sri Lanka are the major producers. Today, the four major tea
producing countries in the world are China, India, Sri Lanka and Kenya. On an average, these
countries together produce about 75% of world’s production. India is the second largest
producer of tea in the world, producing an average of about 900,000 tonnes every year. It is
estimated that about 70 percent of tea is consumed in India only. Owing to its increasing
demand, tea is considered to be one of the major components of world beverage market. Global

5
tea production is increased by about 110% from the year 1995 to 2015 due to its increased
consumption [24]. This gives a rise to a huge amount of spent tea wastes which leads to serious
waste management issues. As reported in [24] by Chang, India is one among the top 5 per
capita tea consumers. A number of renowned teas, such as Assam and Darjeeling, also grows
exclusively in India. A snapshot of spent tea waste used in this study is shown in Fig.1. The
current status of Indian tea in the global position is given in Table 1.
Table 1 Present status of Indian tea in global position [25]
World India Rank % Share
Area under tea (Million hectares) 3.94 0.58 2nd 15
Yield (kg/hectare) 1143 1668 NA NA
Production (Million kg) 4162 966 2nd 23
Consumption (Million kg) 3980 837 2nd 21
Export (Million kg) 1738 193 4th 11
*NA-Not available
Spent tea waste (STW) is disposed in the form of slurry in open land after preparation of tea,
and is one of the potential organic wastes that is abundantly available in restaurants, hotels,
hostels, and almost all the houses release this waste, especially in India. A continuous disposal
of STW in open land increases anthropogenic gases, pollution of soil, water, and unpleasant
surroundings etc [26]. Therefore, it is necessary to find a solution to reuse or recycle of STW.
Biogas production is a very efficient way to address the foresaid issues [27] both through
production of renewable energy and through avoidance of uncontrolled release of greenhouse
gases (GHG) emissions into the atmosphere during STW management.
Fig.1 Spent tea waste used in this study

6
2 Materials and methods
2.1 Feed stock
The fresh cow manure (CM) was collected from a local farm house near NIT Rourkela campus,
Odisha, India. The visible straws present in the CM were removed manually. The collected CM
was mixed with water in the ratio 1:1, stirred for 10min at 2000rpm, and filtered with a nylon
grid of size 0.25mm. The filtrated one was used as a feed for the anaerobic digestion process.
On the other hand, STW was collected from various hostels, and canteens in the institute. The
collected STW was dried for 48 h at 80o C and stored at room temperature in a dry place for
further experiments.
2.2 Experimental setup and design
In this research work, experiments were conducted in laboratory scale anaerobic digesters
namely AD1, AD2, AD3, AD4, and AD5 containing 50:50, 60:40, 70:30, 80:20, and 100:0 on
a mass basis of CM: STW respectively. The prepared samples of CM:STW mixture were
diluted with water at a ratio of 1:1 and 1:3 respectively. The characteristics of the feed stocks
at different proportions of CM and STW are given in Table 2. The prepared samples were in a
kept in a 2L glass reactors and air tight sealing was done using M-seal (epoxy compound). The
anaerobic digesters used in this study are shown in Fig.2. In general, CM is the most commonly
used feed stock for the production of biogas; hence, in this study, CM was also taken as a feed
stock in a separate digester. The results obtained from the four different proportions of CM and
STW were compared with 100 % CM. The experiments were conducted at a mesophilic
temperature range ( 310 2.0 K). All the reactors were flushed with nitrogen for 5 min before
sealing of the digesters. Since, there is no mechanical stirrer available in the laboratory for
stirring the mixture. Therefore, for obtaining a better reaction mixture, manual shaking was
done. Each digester was shaken manually for 1 min twice a day prior to the measurement of
biogas volume [12] [28].

7
Table 2 Properties of feed stocks at different proportions of CM and STW
Parameters Digester name (mass fraction %)
AD1 AD2 AD3 AD4 AD5
50:50 60:40 70:30 80:20 100:0
TS (wt%) 58.62 48.72 42.67 36.55 19.26
VS (wt%) 52.48 45.61 39.54 32.42 15.23
VS/TS ratio 0.89 0.93 0.92 0.88 0.79
Weight of CM
added (g)
200 240 280 320 400
Weight of STW
added (g)
200 160 120 80 --
Volume of water
(ml)
800 720 640 560 400
Total weight of
substrate (g)
1200 1120 1040 960 800
AD1-AD5 anaerobic digesters; 6-10 biogas to analyser; 11-15 scale for water level indicator
Fig.2 Anaerobic digesters used in this study
11 15 14 13 12
10 9
8 7 6
AD2 AD4 AD3 AD5 AD1

8
2.3 Biogas measurement and its composition analysis
Biogas production was measured by the water displacement method in a U-tube manometer
(outer diameter 1.8cm and 0.25 thickness) in an interval of 24 hours during 25 days of digestion
time. To measure the composition of gas produced, a sample of gas was collected daily from
the headspace of each digester using gas tight syringe (25 µL Perkin Elmer), and then injected
into GC equipped with a stainless steel column of TDX-01 (packed with carbon molecular
sieve, 2 m × 3 mm) and a thermal conductivity detector (TCD). The temperatures of the
column oven, injector, and detector were 100 °C, 150 °C, and 175 °C, respectively. Argon was
used as a carrier gas at a flow rate of 20 mL/min. Biogas majorly consists of CH4, CO2, and a
trace amounts of H2S, and NH3. Biogas composition was measured daily, in terms of
percentage volume (%vol), as per the test method (ASTM D 7833). Also, the properties of
biogas includes density, energy content, lower heating value, boiling point were characterised
according to the ASTM standards D 3588, 4868, 1945, 1835 respectively.
2.4 Analytical methods and calculations
Firstly, feedstock characterization was carried out to ensure the suitability of the feed stock for
anaerobic digestion, which included the proximate and ultimate analyses. The proximate
analysis of all the samples was calculated in the Chemical Engineering Department of NIT
Rourkela, as recommended by APHA [29] and are given in Table 3. The ultimate analysis of
the samples was done by a C-H-N-S elemental analyser in the Chemistry Department of NIT
Rourkela, and are given in Table 4. The C/N ratio was determined by dividing the total carbon
content to the total nitrogen content. The pH value of the feed stock was measured with a pH
metre (Systronics µ pH system 362). Various characteristic functional groups present in the
substrate were identified by a Perkin Elmer RX Fourier Transform Infrared spectrograph
(FTIR) in the Mining Engineering Department of NIT Rourkela. The FTIR results were
collected in the range of 40 – 4000 cm-1 with the resolution of 8 cm-1 which is discussed in a
separate section. Further, the concentrations of Phosphorous (P), and Potassium (K) present in
the digester were determined using inductively coupled plasma mass spectrometry, from a
standard laboratory (Advanced research and testing laboratory, Kolkata). All the experiments
were conducted thrice to find out its average. The methane yield expressed in terms of ml/kg
TS was calculated by multiplying the total biogas production with the methane content obtained
from GC in %vol, divided by 100.

9
Table 3 Proximate analysis of CM and STW
Substrate Weight % dry basis
Moisture content Volatile matter Ash content Fixed carbon
Cow manure 71.2 12.3 4.37 12.13
Spent tea waste 9.36 42.33 8.8 39.51
Table 4 Ultimate analysis of CM and STW
Substrate Weight % dry basis
%C %H %N %S %O %P %K
Cow manure 36.23 4.76 1.67 0.03 57.2 0.05 0.06
Spent tea waste 63.3 6.45 0.97 0.48 26.6 0.8 1.40
2.5 FTIR spectra of the feed stocks
Basically, FTIR determines the different types of functional groups and bonds that are present
in a molecule, using infrared electromagnetic radiation. The functional groups present in CM
and STW are depicted in Fig. 3. It can be observed from the figure that, such peaks (broad,
and sharp) observed at various intensities reveal the presence of different functional groups.
The group compounds present at different intensities in the feed stocks are listed in Table 5.
The broad peak observed in the range of 3800-3200 cm-1 mainly represents the presence of
phenols, alcohols, and hydroxyl acid, and is caused by O-H, N-H stretching. The C-H bond
stretching vibration from 2960-2850 cm-1 represents the sharp edge with medium intensity,
indicates the presence of alkanes.
Fig.3 FTIR spectra of STW and CM
200
250
300
350
400
450
500
550
600
650
700
0 500 1000 1500 2000 2500 3000 3500 4000 4500
Tra
nsm
itta
nce
(%
T)
Wavenumber (cm-1)
STW CM

10
A sharp peak at 1649.11 cm-1 arises from C=O stretching, which indicates the presence of
ketones. A peak at 1455 cm-1 represents the presence of alkyl methylene due to C-O, C-H, and
N-O stretching. Furthermore, the region from 0-1500 cm-1 is known as finger print region,
which indicates a cluster of stretches in one region. It refers to the mono cyclic substituted
aromatics with C-Cl, C-Br, C-I, and O-H bending. From this study, it was concluded that, the
feed stocks were suitable for anaerobic treatment, as they contain ingredients for the growth of
microorganisms.
Table 5 Feed stocks’ FTIR spectra
Wavelength
range, cm-1
Peak Functional group Type of vibration
STW (cm-1, %T) CM (cm-1, %T)
3500-3300 3384.96 , 322.08 3332.62, 275.49 Phenols, Alcohols,
Hydroxyl acid
-OH, N-H stretching
2960-2850 2924.82 , 356.03
2854.07 , 414.92
2920.82 , 293.68 Alkane (fully
saturated)
C-C, C-N, C-H
stretching
1740-1550 1744.61 , 395.65
1649.11 , 313.77
1538.26 , 389.68
1654.51 , 251.14 Ketones C=C, C=N, C=O
stretching
1470-1250 1455.00 , 387.68
1377.90 , 392.70
1242.34 , 393.29
1423.48 , 281.00 Alkyl C-O, C-H, N-O
stretching
1150-500 1147.31 , 372.94
1053.62 , 344.70
620.80 , 495.67
1094.88 , 223.72
796.49 , 369.45
555.72 , 365.52
466.76 , 340.41
Mono cyclic
substituted
aromatics
C-Cl, C-Br, C-I,
O-H bending
3 Results and discussion
3.1 Effect of pH
One of the most important parameters that affect the biogas production is the pH value of the
slurry. pH value changes at different stages of anaerobic digestion. Kigozi et al. [30] reported
that, most of the anaerobic bacteria performs a good yield, if the pH value lies between 7-8.5.
During the initial stages of anaerobic digestion, the pH value of the substrate rapidly drops
because of digestible matter get hydrolysed and converted into fatty acids. Due to the formation
of huge amount of fatty acids, sometimes, pH value may fall below 5 in the digester. In general,
an increase in pH accompanies when the consumption of fatty acids by methanogens and thus
produces alkalinity [31]. It was reported by Mshandete et al. [32] that, for a normal functioning
of an anaerobic digester, the pH value is in the range of 6.4-7.6. Beyond this stated range, the

11
biogas process will become more sensitive towards the concentration of ammonia with increase
in pH. Because of which, the growth rate of microbes decreases. Fig.4 portrays the variation of
pH with the digestion time by considering the average value of pH in every five consecutive
days.
Fig.4 Variation of pH value with digestion time
It can be observed from the figure that, for the digesters AD1, AD2, AD3, AD4, the pH value
rapidly decreases at the beginning stages of digestion, as the easily digestible organic matter
hydrolyse and further convert to volatile fatty acids. After the initial drop in the pH value, it
increases gradually as the volatile fatty acids are consumed by methanogens [33]. Among all
the anaerobic digesters AD5 gives a maximum pH. During 2-8 days of the digestion time, a
maximum pH value of 6.58 and 6.02 are obtained on 7th and 8th day for the digesters AD2 and
AD3 respectively, which is 7.19% and 14.97% less than the digester containing cow manure
alone (AD5) respectively. Because of hydrolytic and acetogenic bacterial are observed to be
more during those days. During the anaerobic digestion process, the digester AD1, AD2, AD3,
AD4, and AD5 shows its peak value on 24th day, 20th day, 22nd day, 21st day, 24th day
respectively.
3.2 Effect of C/N
The carbon to nitrogen (C/N) ratio is the most influencing parameter for the biogas production.
For an optimum biogas production, it was reported that, the C/N ratio should lie in the range
of 20-30:1 [34].
5
5.5
6
6.5
7
7.5
Day 1-5 Day 6-10 Day 11-15 Day 16-20 Day 21-25
pH
Digestion time in every five consecutive days
AD1 AD2 AD3 AD4 AD5

12
Fig.5 Average cumulative biogas production at different C/N ratios
If the C/N ratio is much higher than the range, then the biogas production will be low. This is
because, nitrogen will be consumed rapidly by methanogenic bacteria for meeting their protein
requirements, and will no longer react on the left over carbon remaining in the material. If the
C/N ratio is very low, that is outside the stated range, nitrogen will be liberated, and it will
accumulate in the form of ammonia (NH3). As a fact, NH3 will intern increase the pH value of
the slurry. A significant amount of release of NH3 may cause toxic to methanogenic bacteria
in the slurry, thus biogas production will be low [35]. Fig.5 depicts the average cumulative
biogas production at different C/N ratios for a 25 days of digestion time.
It can be observed from the figure, that the anaerobic digester AD3 gives a maximum biogas
production of 0.76ml/g TS (or) 0.82ml/g VS, than AD4 gives 0.61ml/g TS (or) 0.68ml/g VS,
than AD2 gives 0.46ml/g TS (or) 0.49 ml/g VS, than AD5 gives 0.29ml/g TS (or) 0.36ml/g
VS. It can also be noticed that, the lowest yield for the digester AD1 is 0.25ml/g TS (or)
0.27ml/g VS. The lowest biogas production for AD1 might be due to formation of NH3, which
may lead to toxic to bacteria. It was also reported by the Guermoud et al. [36] and Khalid et al.
[37] that, the C/N ratio of 22-25 is the best condition for carrying out anaerobic digestion. The
digester AD3 has a C/N ratio of 24.96, which is well under the optimum range. But, on the
addition of STW more than 30%, the C/N ratio slightly shifts from the optimum range and
tends to decrease. Because of which, excessive nitrogen will be liberated that could inhibit the
methanogenic bacteria; thus the biogas production decreases [38].
0 0.1 0.2 0.3 0.4 0.5 0.6 0.7 0.8 0.9 1
AD1=20.04
AD2=22.16
AD3=24.96
AD4=22.71
AD5=19.86
Cumulative biogas
Cummulative biogas (ml/g VS) Cummulative biogas (ml/g TS)

13
3.3 Effect of digestion time
Fig.6 depicts the daily biogas production with respect to the digestion time. The average daily
biogas production during 25 days of digestion time is observed to be approximately 21.57
ml/day per kg of TS, 40.92 ml/day per kg of TS, 66.77 ml/day per kg of TS, 53.45 ml/day per
kg of TS, and 24.67 ml/day per kg of TS for the digesters AD1, AD2, AD3, AD4 and AD5
respectively. It can be observed that, the biogas production in AD1, AD2, and AD5 became
stable after 9-10 days of digestion time. It then decreases after 20 days of digestion time, the
decrease in biogas production might be due to lack of carbon availability in the digester.
Initially, the biogas yield from the digesters AD3 and AD4 is low during 1-5 days of digestion
time. It is reported that, when the digestion time is more than 5 days, the methanogenic bacteria
will consume volatile fatty acids rapidly, and hence increases the biogas yield [31]. After 5
days, biogas production increases gradually up to 19 days of digestion time, and then biogas
production stops, and becomes stable. There is a sudden change in peak of biogas production
is observed at 19-22 days of digestion time, because of excessive formation of nitrogen during
those days which in turn decreases the C/N ratio and shifts the pH value of the slurry towards
alkalinity. Thus a sudden increase and decrease in the biogas production is observed [31]. In
this investigation, it is observed that, CM mixed with STW in proportion of 70% and 30%
respectively yields 170% more biogas than the sole CM. This may be due to the presence of
carbon, nitrogen and organic compounds like C6H12O6 in the STW. Among all the digesters,
AD1 gives the least biogas production.
Fig.6 Daily biogas yield in response to digestion time
This is because of the less organic compounds present in the digester for microbial growth and
survival.
0
10
20
30
40
50
60
70
80
90
100
1 6 11 16 21 26
Bio
gas
(ml)
Digestion time (days)
AD1 AD2 AD3 AD4 AD5

14
3.4 Cumulative biogas production
The variation of the cumulative biogas production per unit TS over a 25 days of digestion time
for AD1, AD2, AD3, AD4 in comparison with AD5 is shown in Fig.7.
Fig.7 Cumulative biogas yield in response to digestion time
The maximum cumulative biogas production is observed for AD3, followed by AD4. The range
of cumulative biogas production for AD3 over a 25 days of digestion time are found to be about
54.92 to 1669.25 ml/kg TS (or) 0.054 ml/g TS to 1.66 ml/g TS and 0.057 to 1.77 ml/g VS. The
digester AD3 yields a maximum cumulative biogas of 1669.25 ml/kg TS, which can also be
represented as 1.66 ml/g TS (or) 1.77 ml/g VS. The maximum cumulative biogas production
for AD3 is observed at an average C/N ratio of 24.96. This might be due to the presence of
essential nutrients at correct compositions. In fact, carbon and nitrogen are the main nutrients
are the source for a sustainable growth of anaerobic bacteria [31].
3.5 Methane content of the produced biogas
Fig.8 depicts the variation of the methane yield with respect to the digestion time. In this
investigation, a similar trend is found for both the biogas production and the methane yield.
Although, there was is a huge biogas production in the initial stages of digestion, a little
methane is observed during those 4 days. The rapid increase in the biogas production and the
low methane content may be due to the presence of some easily digestible organic materials
like carbohydrates and rapid acidification of spent tea waste in the digester, which leads to
decrease in the methane yield during the early stages of digestion [32]. The dissipation of easily
digestible organic materials leads to temporary biogas production. A maximum methane
0
250
500
750
1000
1250
1500
1750
2000
1 5 9 13 17 21 25
Cu
mu
lati
ve
bio
ga
s (m
l/k
g T
S)
Digestion time (days)
AD1 AD2 AD3 AD4 AD5

15
produced from the AD1, AD2, AD3, AD4, and AD5 during first 4 days is 21.18%, 31.92%,
39.97%, 36.42%, and 23.34% which corresponds to 4.31 mlCH4/kg TS,10.18 mlCH4/kg TS,
14.40 mlCH4/kg TS, 7.64 mlCH4/kg TS, 5.44 mlCH4/kg TS respectively. Similar results was
observed by Mashad and Zhang [28], when they investigated on the production of biogas from
co-digestion of dairy manure and food waste. The methane content in the biogas produced
from the digesters AD3 and AD4 is 39.97% on 5th day, and 33.54% on 4th day, reaching to
continue its increasing trend till 21st day, which is similar to biogas production. The methane
yield and biogas production patterns show inhibition of methanogenic bacteria in the first 4
days due to acidification in the digester [39].
Fig.8 Variation of methane yield with respect to digestion time
As methane (CH4) is the only useful gas in the biogas, the digester with the highest methane
yield is considered as the best combination of substrates. The highest methane percentage is
obtained in the AD3 followed by AD4. It can be observed from the figure that, AD5 which
contains only cow manure produces lower methane when compared to other digesters.
Therefore, it indicates that, co-digestion of CM with STW is an effective approach for methane
improvement. Addition of two or more substrates increase the biogas production and the
methane yield has been reported previously. Maranon et al. [40] obtained a higher methane
yield of 603 mlCH4/g-VS when co-digested 70% manure with 20% food waste and 10%
sewage sludge. In this study, during the final stages of anaerobic digestion of CM with STW,
the growth of microbes is reduced, due to the increase in the NH3 production, resulting in the
decrease in the methane yield [41].
0
10
20
30
40
50
60
70
80
1 6 11 16 21 26
Met
han
e (%
)
Digestion time (days)
AD1 AD2 AD3 AD4 AD5

16
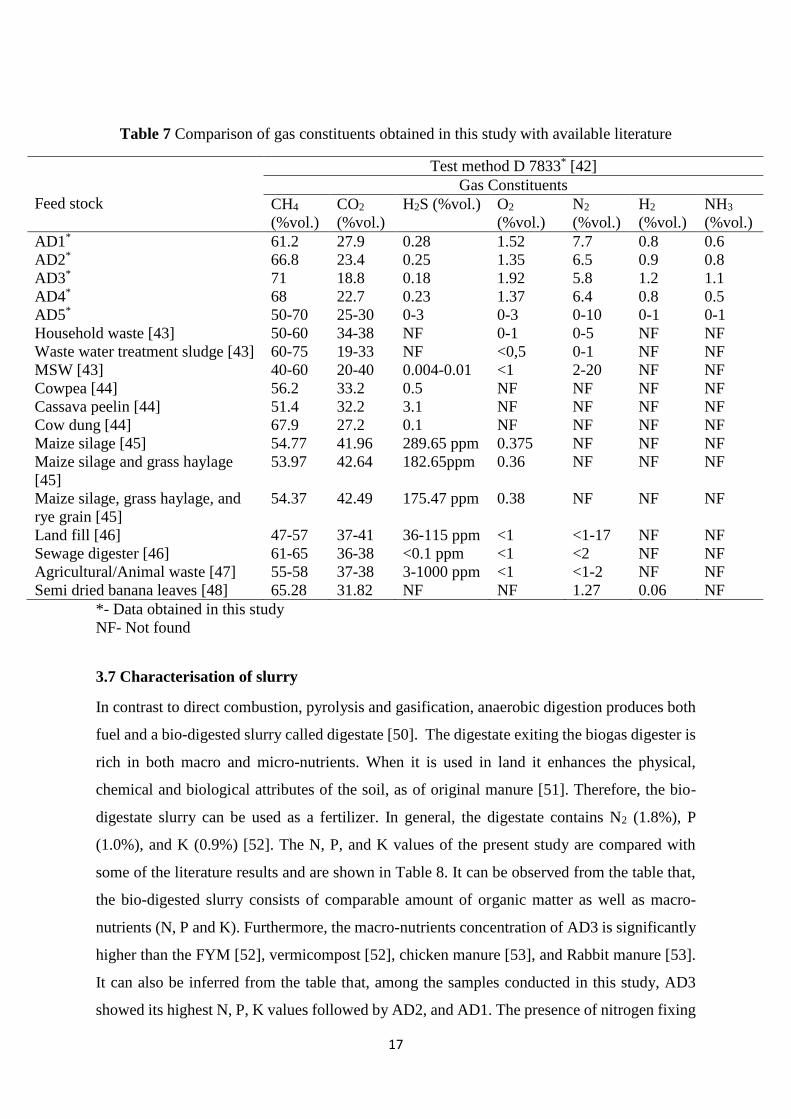
3.6 Characterisation of biogas
The biogas obtained from the digesters AD1, AD2, AD3, AD4 and AD5 were characterized
for determining its density, temperature, energy content, lower calorific value, boiling point
and gas constituents. The properties of the biogas are given in Table 6. The biogas composition
(CH4, CO2, H2S, H2, NH3, etc.,) were analysed as per the ASTM D 7833 [42]. Biogas
constituents of this study were compared with some of the commonly available literature, and
are presented in Table 7. It can be inferred that, AD3 shows a high methane content of about
71% which is 16%, 6.28%, and 4.41% more methane obtained from AD1, AD2, and AD4
respectively. AD2 shows a methane content of about 67%. A similar methane composition
was reported by Jena et al. using semi dried banana leaves [48], and Rasi et al. digesting sewage
sludge [46], however a marginal increase in CO2 content in banana leaves and sewage digester
may decrease the calorific value of methane. It was noticed that, biogas obtained from AD3
had a better quality of biogas than those of other digesters used in this study. A higher methane
content (about over 70%) in AD3 indicates a greater tendency to resist knock due to its high
octane rating and auto-ignition temperature, when it is used as an alternative gaseous fuel for
IC engines, if produced in a large quantity [11]. Also, a large reduction in emissions could be
achieved by using biogas as a fuel [49].
Table 6 Properties of biogas obtained from AD1, AD2, AD3, AD4, and AD5
Properties Test
method
AD1 AD2 AD3 AD4 AD5
Density at 1
atm, kg/m3
D 3588 1.28 1.24 1.18 1.27 1.33
Auto ignition
temperature, oC
- 642-655 620-635 605-640 610-645 650-670
Energy content,
kW/m3
D 4868 3.3-4.1 3.9-4.8 5.1-5.7 4.1-5.2 4-4.5
Lower heating
value, MJ/kg
D 1945 19.1 22.1 26.4 24.2 16.1
Boiling point, oC
D 1835 -128 to -170 -122 to -160 -118 to -152 -113 to -155 -130- to -162
17
Table 7 Comparison of gas constituents obtained in this study with available literature
*- Data obtained in this study
NF- Not found
3.7 Characterisation of slurry
In contrast to direct combustion, pyrolysis and gasification, anaerobic digestion produces both
fuel and a bio-digested slurry called digestate [50]. The digestate exiting the biogas digester is
rich in both macro and micro-nutrients. When it is used in land it enhances the physical,
chemical and biological attributes of the soil, as of original manure [51]. Therefore, the bio-
digestate slurry can be used as a fertilizer. In general, the digestate contains N2 (1.8%), P
(1.0%), and K (0.9%) [52]. The N, P, and K values of the present study are compared with
some of the literature results and are shown in Table 8. It can be observed from the table that,
the bio-digested slurry consists of comparable amount of organic matter as well as macro-
nutrients (N, P and K). Furthermore, the macro-nutrients concentration of AD3 is significantly
higher than the FYM [52], vermicompost [52], chicken manure [53], and Rabbit manure [53].
It can also be inferred from the table that, among the samples conducted in this study, AD3
showed its highest N, P, K values followed by AD2, and AD1. The presence of nitrogen fixing
Test method D 7833* [42]
Feed stock
Gas Constituents
CH4
(%vol.)
CO2
(%vol.)
H2S (%vol.) O2
(%vol.)
N2
(%vol.)
H2
(%vol.)
NH3
(%vol.)
AD1* 61.2 27.9 0.28 1.52 7.7 0.8 0.6
AD2* 66.8 23.4 0.25 1.35 6.5 0.9 0.8
AD3* 71 18.8 0.18 1.92 5.8 1.2 1.1
AD4* 68 22.7 0.23 1.37 6.4 0.8 0.5
AD5* 50-70 25-30 0-3 0-3 0-10 0-1 0-1
Household waste [43] 50-60 34-38 NF 0-1 0-5 NF NF
Waste water treatment sludge [43] 60-75 19-33 NF <0,5 0-1 NF NF
MSW [43] 40-60 20-40 0.004-0.01 <1 2-20 NF NF
Cowpea [44] 56.2 33.2 0.5 NF NF NF NF
Cassava peelin [44] 51.4 32.2 3.1 NF NF NF NF
Cow dung [44] 67.9 27.2 0.1 NF NF NF NF
Maize silage [45] 54.77 41.96 289.65 ppm 0.375 NF NF NF
Maize silage and grass haylage
[45]
53.97 42.64 182.65ppm 0.36 NF NF NF
Maize silage, grass haylage, and
rye grain [45]
54.37 42.49 175.47 ppm 0.38 NF NF NF
Land fill [46] 47-57 37-41 36-115 ppm <1 <1-17 NF NF
Sewage digester [46] 61-65 36-38 <0.1 ppm <1 <2 NF NF
Agricultural/Animal waste [47] 55-58 37-38 3-1000 ppm <1 <1-2 NF NF
Semi dried banana leaves [48] 65.28 31.82 NF NF 1.27 0.06 NF

18
and phosphate solubilizing organisms in the digestate shows that, the digestate it could be
utilized as an efficient bio-fertilizer for the growth of crops [54]. Also, it is noticed that, after
anaerobic digestion the concentration of N, P, and K increased. This might be due to action of
micro-organisms which significantly reduces the microbial pathogens. Hence, it is a good sign
for the growth of plants [54]. A similar kind of results were obtained by Owamah et al. [55]
from the co-digestion of food waste and human excreta. From these experimental results, it is
suggested that, the bio-digested slurry from co-digesting CM and STW can be used as an
organic fertilizer. Therefore, the problem associated with the disposal of STW can be
minimised.
Table 8 Fertilizer value of bio-digested CM-STW slurry of all digesters
Digester name Carbon, % Nitrogen
(N), %
Potassium
(K), %
Phosphorous
(P), %
N/K-
ratio
N/P-
ratio
AD1 56 4.9 2.8 1.8 1.75 2.72
AD2 53 5.5 3.3 2.3 1.66 2.39
AD3 49 6.7 3.7 2.9 1.81 2.31
AD4 45 3.8 2.5 1.7 1.52 2.23
AD5 38 2.7 2.1 1.2 1.28 2.25
Farm yard manure [52] 25-55 0.4-0.8 0.6-0.82 0.5-0.65 NF NF
Vermicompost [52] 9.8-13.4 0.51-1.61 0.19-1.02 0.15-0.73 NF NF
Horse manure [53] NF 0.7 0.6 0.3 1.16 2.33
Chicken manure [53] NF 1.1 0.5 0.8 2.2 1.37
Sheep manure [53] NF 0.7 0.9 0.3 0.77 2.33
Rabbit manure [53] NF 2.4 0.6 1.4 4 1.71
Pig manure [53] NF 0.8 0.5 0.7 1.6 1.14
Food waste with human excreta [55] 20.1 ± 0.44 0.7 ± 0.03 NF NF NF NF
NF- Not found
4 Conclusions
An experimental investigation was carried out to assess the possibility of using spent tea waste
(STW) for its energy use. For biogas production, STW was co-digested with CM, and the
performance is assessed by considering the input parameters like pH, C/N, and digestion time.
The following points are the conclusion of the investigation;
STW a solid organic waste obtained as a municipal as well as a food waste can be co-
digested with cow manure for obtaining biogas containing a maximum methane content of
about 70%.
A maximum biogas production can be obtained from the co-digestion of substrate
containing 30% STW and 70% CM, for a digestion time of 25 days.

19
AD3 shows a max pH value of 7.16, which indicates good for anaerobic digestion. The
biogas obtained from the digester AD3 has a heating value and energy content of 26.4
MJ/kg and 5.1-5.7 kW/m3 respectively.
The fertilizer values of AD2, AD3, and AD4 holds good for growth of plants than other
digesters.
Further, investigations may be carried out at different operating conditions (organic loading
rate (OLR), temperature, etc., and at different reactors (continuous and fed-batch systems),
which is not considered in this study), to show its potential for usage in industrial
applications.
More possibilities can be explored on co-digestion of STW with multiple organic wastes
that originate from agriculture, municipal and industrial wastes for producing a large
quantity of biogas at a single point. Assessment of pre-treatment of STW can be carried out
for ensuring the quality and yield.
Finally, possibilities of long-term field research based on a comprehensive approach
including storage, handling and application of both animal manure and bio slurry as
fertiliser and soil improver may be explored.
References
1. Bacenetti J, Negri M, Fiala M, González-García S. Anaerobic digestion of different
feedstocks: impact on energetic and environmental balances of biogas process. Science
of the Total Environment. 2013 Oct 1; 463:541-51.
2. Drosg B, Braun R, Bochmann G, Al Saedi T. Analysis and characterisation of biogas
feedstocks. InThe Biogas Handbook 2013 (pp. 52-84).
3. Goel B, Pant DC, Kishore VV. Two-phase anaerobic digestion of spent tea leaves for
biogas and manure generation. Bioresource technology. 2001 Nov 1;80(2):153-6.
4. Munda US, Pholane L, Kar DD, Meikap BC. Production of bioenergy from composite
waste materials made of corn waste, spent tea waste, and kitchen waste co-mixed with
cow dung. International journal of green energy. 2012 May 1;9(4):361-75.
5. Luz FC, Cordiner S, Manni A, Mulone V, Rocco V. Anaerobic digestion of coffee
grounds soluble fraction at laboratory scale: Evaluation of the biomethane potential.
Applied Energy. 2017 Dec 1;207:166-75.
6. Luz FC, Cordiner S, Manni A, Mulone V, Rocco V. Analysis of Residual Biomass fast
pyrolysis at laboratory scale: experimental and numerical evaluation of spent coffee
powders energy content. Energy Procedia. 2017 May 1;105:817-22.
7. Li Y, Jin Y, Li J, Li H, Yu Z, Nie Y. Effects of thermal pretreatment on degradation
kinetics of organics during kitchen waste anaerobic digestion. Energy. 2017 Jan 1;
118:377-86.
8. Kumar G, Sivagurunathan P, Park JH, Kim SH. Anaerobic digestion of food waste to
methane at various organic loading rates (OLRs) and hydraulic retention times (HRTs):
Thermophilic vs. mesophilic regimes. Environmental Engineering Research. 2015 Dec
29; 21(1):69-73.
9. Chen Y, Cheng JJ, Creamer KS. Inhibition of anaerobic digestion process: a review.
Bioresource technology. 2008 Jul 1;99(10):4044-64.

20
10. Lijó L, González-García S, Bacenetti J, Moreira MT. The environmental effect of
substituting energy crops for food waste as feedstock for biogas production. Energy.
2017 Oct 15; 137:1130-43.
11. Bora BJ, Saha UK, Chatterjee S, Veer V. Effect of compression ratio on performance,
combustion and emission characteristics of a dual fuel diesel engine run on raw biogas.
Energy conversion and management. 2014 Nov 30; 87:1000-9.
12. Zhai N, Zhang T, Yin D, Yang G, Wang X, Ren G, Feng Y. Effect of initial pH on
anaerobic co-digestion of kitchen waste and cow manure. Waste management. 2015
Apr 1; 38:126-31.
13. Riggio V, Comino E, Rosso M. Energy production from anaerobic co-digestion
processing of cow slurry, olive pomace and apple pulp. Renewable Energy. 2015 Nov
1; 83:1043-9.
14. Banks CJ, Salter AM, Heaven S, Riley K. Energetic and environmental benefits of co-
digestion of food waste and cattle slurry: A preliminary assessment. Resources,
Conservation and Recycling. 2011 Nov 1; 56(1):71-9.
15. Zarkadas IS, Sofikiti AS, Voudrias EA, Pilidis GA. Thermophilic anaerobic digestion
of pasteurised food wastes and dairy cattle manure in batch and large volume laboratory
digesters: Focussing on mixing ratios. Renewable Energy. 2015 Aug 1; 80:432-40.
16. Song Z, Zhang C. Anaerobic codigestion of pretreated wheat straw with cattle manure
and analysis of the microbial community. Bioresource technology. 2015 Jun 1;
186:128-35.
17. Akyol Ç, Ozbayram EG, Ince O, Kleinsteuber S, Ince B. Anaerobic co‐digestion of cow
manure and barley: Effect of cow manure to barley ratio on methane production and
digestion stability. Environmental Progress & Sustainable Energy. 2016 Mar 4;
35(2):589-95.
18. Aboudi K, Álvarez-Gallego CJ, Romero-García LI. Evaluation of methane generation
and process stability from anaerobic co-digestion of sugar beet by-product and cow
manure. Journal of bioscience and bioengineering. 2016 May 1; 121(5):566-72.
19. Li Y, Li Y, Zhang D, Li G, Lu J, Li S. Solid state anaerobic co-digestion of tomato
residues with dairy manure and corn stover for biogas production. Bioresource
technology. 2016 Oct 1; 217:50-5.
20. Tasnim F, Iqbal SA, Chowdhury AR. Biogas production from anaerobic co-digestion
of cow manure with kitchen waste and Water Hyacinth. Renewable Energy. 2017 Aug
1; 109:434-9.
21. Hassan M, Ding W, Umar M, Rasool G. Batch and semi-continuous anaerobic co-
digestion of goose manure with alkali solubilized wheat straw: A case of carbon to
nitrogen ratio and organic loading rate regression optimization. Bioresource
technology. 2017 Apr 1; 230:24-32.
22. Li K, Liu R, Cui S, Yu Q, Ma R. Anaerobic co-digestion of animal manures with corn
stover or apple pulp for enhanced biogas production. Renewable Energy. 2018 Apr 1;
118:335-42.
23. Li W, Siddhu MA, Amin FR, He Y, Zhang R, Liu G, Chen C. Methane production
through anaerobic co-digestion of sheep dung and waste paper. Energy Conversion and
Management. 2018 Jan 15; 156:279-87.
24. Chang K. World tea production and trade: Current and future development. A
publication by the Food and Agricultural Organization of the United Nations, Rome.
Available online at www. fao. Org (date accessed 29 May 2016). 2015.
25. http://www.teaboard.gov.in/

21
26. Cooper JM, Butler G, Leifert C. Life cycle analysis of greenhouse gas emissions from
organic and conventional food production systems, with and without bio-energy
options. Njas-Wageningen Journal of Life Sciences. 2011 Dec 1;58(3-4):185-92.
27. Liebetrau J, Reinelt T, Clemens J, Hafermann C, Friehe J, Weiland P. Analysis of
greenhouse gas emissions from 10 biogas plants within the agricultural sector. Water
Science and Technology. 2013 Mar 1;67(6):1370-9.
28. El-Mashad HM, Zhang R. Biogas production from co-digestion of dairy manure and
food waste. Bioresource technology. 2010 Jun 1;101(11):4021-8.
29. Federation WE, American Public Health Association. Standard methods for the
examination of water and wastewater. American Public Health Association (APHA):
Washington, DC, USA. 2005.
30. Kigozi R, Muzenda E, Aboyade AO. Biogas technology: current trends, opportunities
and challenges, Proceedings of 6th Internatio Conference on Greeen Technology,
Renewable Energy and Environmental Engineering [ICGTREEE’2014), November 24-
28th November 2014, Cape Twon, South Africa, pp.311-317.
31. Chandra R, Vijay VK, Subbarao PM, Khura TK. Production of methane from anaerobic
digestion of jatropha and pongamia oil cakes. Applied energy. 2012 May 31; 93:148-
59
32. Mshandete A, Kivaisi A, Rubindamayugi M, Mattiasson B. Anaerobic batch co-
digestion of sisal pulp and fish wastes. Bioresource technology. 2004 Oct 1;95(1):19-
24.
33. Macias-Corral M, Samani Z, Hanson A, Smith G, Funk P, Yu H, Longworth J.
Anaerobic digestion of municipal solid waste and agricultural waste and the effect of
co-digestion with dairy cow manure. Bioresource technology. 2008 Nov
1;99(17):8288-93.
34. Athanasoulia E, Melidis P, Aivasidis A. Optimization of biogas production from waste
activated sludge through serial digestion. Renewable Energy. 2012 Nov 30; 47:147-51.
35. Dioha IJ, Ikeme CH, Nafi’u T, Soba NI, Yusuf MB. Effect of carbon to nitrogen ratio
on biogas production. International Research Journal of Natural Sciences. 2013 Sep;
1(3):1-0.
36. Guermoud N, Ouadjnia F, Abdelmalek F, Taleb F. Municipal solid waste in
Mostaganem city (Western Algeria). Waste Management. 2009 Feb 1;29(2):896-902.
37. Khalid A, Arshad M, Anjum M, Mahmood T, Dawson L. The anaerobic digestion of
solid organic waste. Waste management. 2011 Aug 1;31(8):1737-44.
38. Weerayutsil P, Khoyun U, Khuanmar K. Optimum ratio of chicken manure and napier
grass in single stage anaerobic co-digestion. Energy Procedia. 2016 Nov 1;100:22-5.
39. Macias-Corral M, Samani Z, Hanson A, Smith G, Funk P, Yu H, Longworth J.
Anaerobic digestion of municipal solid waste and agricultural waste and the effect of
co-digestion with dairy cow manure. Bioresource technology. 2008 Nov
1;99(17):8288-93.
40. Marañón E, Castrillón L, Quiroga G, Fernández-Nava Y, Gómez L, García MM. Co-
digestion of cattle manure with food waste and sludge to increase biogas production.
Waste management. 2012 Oct 1;32(10):1821-5.
41. Barik D, Murugan S. Assessment of sustainable biogas production from de-oiled seed
cake of karanja-an organic industrial waste from biodiesel industries. Fuel. 2015 May
15;148:25-31.
42. https://www.astm.org/Standards/D7833.html
43. Godi NY, Zhengwuvi LB, Dasin DY, Kamtu P. Gas chromatograph plots on diverse
cow dung analysis, International Journal of Energy and Environmental Research, Vol.
2, No.s, June 2014, pp.19-27,

22
44. Ukpai PA, Nnabuchi MN. Comparative study of biogas production from cow dung,
cow pea and cassava peeling using 45 litres biogas digester. Advances in Applied
Science Research. 2012;3(3):1864-9.
45. Herout M, Malatak J, Kucera L, Dlabaja T. Biogas composition depending on the type
of plant biomass used. Res. Agric. Eng. 2011;57(4):137.
46. Rasi S, Veijanen A, Rintala J. Trace compounds of biogas from different biogas
production plants. Energy. 2007 Aug 1;32(8):1375-80.
47. Allegue LB, Hinge J, Allé K. Biogas and bio-syngas upgrading. Danish Technological
Institute, Aarhus. 2012 Dec.
48. Jena SP, Mishra S, Acharya SK, Mishra SK. An experimental approach to produce
biogas from semi dried banana leaves. Sustainable Energy Technologies and
Assessments. 2017 Feb 1;19:173-8.
49. Zhang LX, Wang CB, Song B. Carbon emission reduction potential of a typical
household biogas system in rural China. Journal of cleaner production. 2013 May 31;
47:415-21.
50. Stolarski MJ, Krzyżaniak M, Warmiński K, Tworkowski J, Szczukowski S, Olba–Zięty
E, Gołaszewski J. Energy efficiency of perennial herbaceous crops production
depending on the type of digestate and mineral fertilizers. Energy. 2017 Sep 1; 134:50-
60.
51. Alburquerque JA, de la Fuente C, Ferrer-Costa A, Carrasco L, Cegarra J, Abad M,
Bernal MP. Assessment of the fertiliser potential of digestates from farm and
agroindustrial residues. Biomass and bioenergy. 2012 May 1;40:181-9.
52. Surendra KC, Takara D, Hashimoto AG, Khanal SK. Biogas as a sustainable energy
source for developing countries: Opportunities and challenges. Renewable and
Sustainable Energy Reviews. 2014 Mar 1;31:846-59.
53. http://www.allotment-garden.org/composts-fertilisers/npk-nutritional-values-animal-
manures-compost/
54. Alburquerque JA, De la Fuente C, Campoy M, Carrasco L, Nájera I, Baixauli C,
Caravaca F, Roldán A, Cegarra J, Bernal MP. Agricultural use of digestate for
horticultural crop production and improvement of soil properties. European Journal of
Agronomy. 2012 Nov 1;43:119-28.
55. Owamah HI, Dahunsi SO, Oranusi US, Alfa MI. Fertilizer and sanitary quality of
digestate biofertilizer from the co-digestion of food waste and human excreta. Waste
management. 2014 Apr 1;34(4):747-52.