biogen 2018 annual report
TRANSCRIPT

2018 ANNUAL REPORT
Biogen
201
8 A
nnual Report
2018 ANNUAL REPORT
Biogen
201
8 A
nnual Report
2018 ANNUAL REPORT
Biogen
201
8 A
nnual Report
2018 ANNUAL REPORT
Biogen
201
8 A
nnual Report
Bio
gen
201
8 A
nnua
l R
epor
t
02
1 Non-GAAP diluted earnings per share (EPS) and Free Cash Flow are Non-GAAP financial measures. A reconciliation of GAAP to Non-GAAP diluted EPS and Free Cash Flow amounts is set forth on pages 19–21 of this Annual Report.
2 GAAP diluted EPS for 2018 and 2017 includes charges of $125 million and $1,176 million, respectively, related to the impact of the Tax Cuts and Jobs Act of 2017.
3 Free Cash Flow for 2018 and 2017 reflects an increase in capital expenditures related to the construction of our large-scale biologics manufacturing facility in Solothurn, Switzerland.
HIG
HLI
GH
TS Strong financial performance
4 For 2018 and 2017 Other includes product revenues from FAMPYRA, FUMADERM, BENEPALI, FLIXABI and ZINBRYTA. For 2018 Other also includes product revenues from IMRALDI, which was launched in Europe in October 2018. For 2017 Other also includes product revenues from ALPROLIX and ELOCTATE through January 31, 2017. No product revenues for ALPROLIX and ELOCTATE were recognized subsequent to February 1, 2017, the effective date of the spin-off of our hemophilia business.
5 Interferon includes AVONEX and PLEGRIDY.
Free Cash Flow 1,3 ($ in millions)
2014
2015
2016
2017
2018
$2,279
$2,223
$2,706
$2,484
$3,917
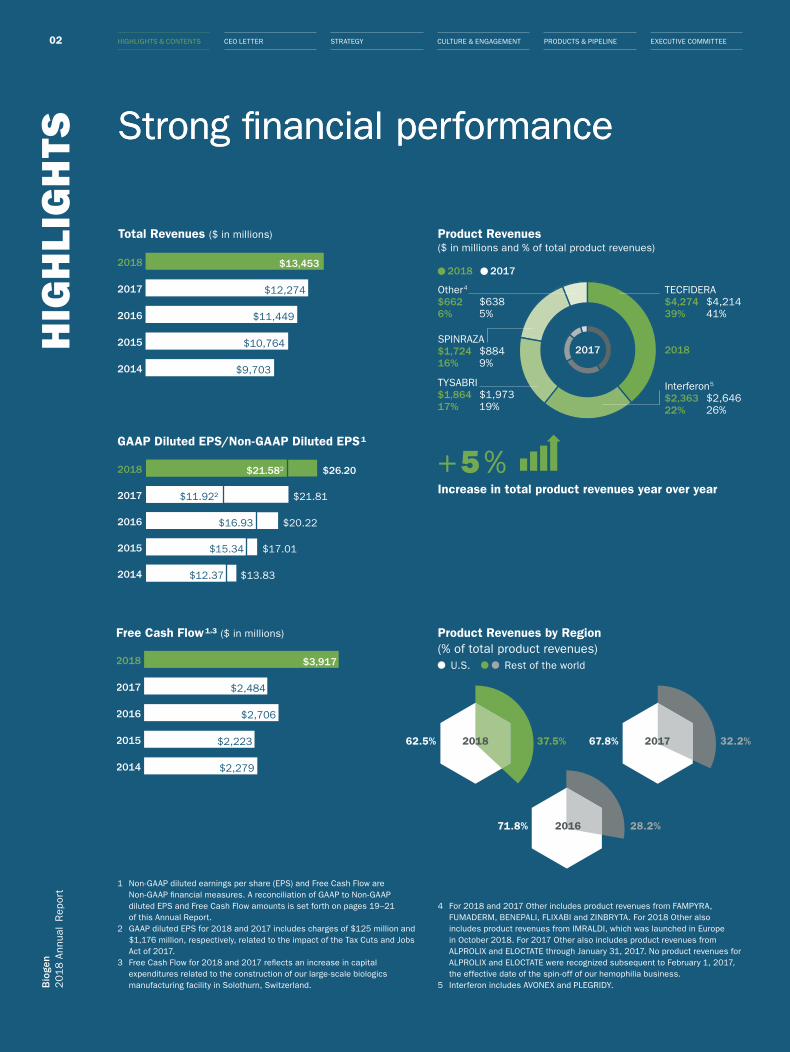
Strong financial performance
Product Revenues ($ in millions and % of total product revenues)
Total Revenues ($ in millions)
GAAP Diluted EPS/Non-GAAP Diluted EPS 1
2014
2015
2016
2017
2018
$9,703
$10,764
$11,449
$12,274
$13,453
2014
2015
2016
2017
2018
$13.83
$17.01
$20.22
$12.37
$15.34
$16.93
$11.922
$21.582
$21.81
$26.20
TECFIDERA$4,274 $4,21439% 41%
Other4
$662 $6386% 5%
Interferon5
$2,363 $2,64622% 26%
TYSABRI$1,864 $1,97317% 19%
SPINRAZA$1,724 $88416% 9%
2017 2018
2018 2017
Product Revenues by Region (% of total product revenues)
U.S. Rest of the world
2016
62.5% 67.8%
71.8%
37.5% 32.2%
28.2%
20172018
+ 5 %Increase in total product revenues year over year
HIGHLIGHTS & CONTENTS CEO LETTER STRATEGY CULTURE & ENGAGEMENT PRODUCTS & PIPELINE EXECUTIVE COMMITTEEB
ioge
n2
01
8 A
nnua
l R
epor
t
02
1 Non-GAAP diluted earnings per share (EPS) and Free Cash Flow are Non-GAAP financial measures. A reconciliation of GAAP to Non-GAAP diluted EPS and Free Cash Flow amounts is set forth on pages 19–21 of this Annual Report.
2 GAAP diluted EPS for 2018 and 2017 includes charges of $125 million and $1,176 million, respectively, related to the impact of the Tax Cuts and Jobs Act of 2017.
3 Free Cash Flow for 2018 and 2017 reflects an increase in capital expenditures related to the construction of our large-scale biologics manufacturing facility in Solothurn, Switzerland.
HIG
HLI
GH
TS Strong financial performance
4 For 2018 and 2017 Other includes product revenues from FAMPYRA, FUMADERM, BENEPALI, FLIXABI and ZINBRYTA. For 2018 Other also includes product revenues from IMRALDI, which was launched in Europe in October 2018. For 2017 Other also includes product revenues from ALPROLIX and ELOCTATE through January 31, 2017. No product revenues for ALPROLIX and ELOCTATE were recognized subsequent to February 1, 2017, the effective date of the spin-off of our hemophilia business.
5 Interferon includes AVONEX and PLEGRIDY.
Free Cash Flow 1,3 ($ in millions)
2014
2015
2016
2017
2018
$2,279
$2,223
$2,706
$2,484
$3,917
Strong financial performance
Product Revenues ($ in millions and % of total product revenues)
Total Revenues ($ in millions)
GAAP Diluted EPS/Non-GAAP Diluted EPS 1
2014
2015
2016
2017
2018
$9,703
$10,764
$11,449
$12,274
$13,453
2014
2015
2016
2017
2018
$13.83
$17.01
$20.22
$12.37
$15.34
$16.93
$11.922
$21.582
$21.81
$26.20
TECFIDERA$4,274 $4,21439% 41%
Other4
$662 $6386% 5%
Interferon5
$2,363 $2,64622% 26%
TYSABRI$1,864 $1,97317% 19%
SPINRAZA$1,724 $88416% 9%
2017 2018
2018 2017
Product Revenues by Region (% of total product revenues)
U.S. Rest of the world
2016
62.5% 67.8%
71.8%
37.5% 32.2%
28.2%
20172018
+ 5 %Increase in total product revenues year over year
HIGHLIGHTS & CONTENTS CEO LETTER STRATEGY CULTURE & ENGAGEMENT PRODUCTS & PIPELINE EXECUTIVE COMMITTEE
Bio
gen
201
8 A
nnua
l R
epor
t
02
1 Non-GAAP diluted earnings per share (EPS) and Free Cash Flow are Non-GAAP financial measures. A reconciliation of GAAP to Non-GAAP diluted EPS and Free Cash Flow amounts is set forth on pages 19–21 of this Annual Report.
2 GAAP diluted EPS for 2018 and 2017 includes charges of $125 million and $1,176 million, respectively, related to the impact of the Tax Cuts and Jobs Act of 2017.
3 Free Cash Flow for 2018 and 2017 reflects an increase in capital expenditures related to the construction of our large-scale biologics manufacturing facility in Solothurn, Switzerland.
HIG
HLI
GH
TS Strong financial performance
4 For 2018 and 2017 Other includes product revenues from FAMPYRA, FUMADERM, BENEPALI, FLIXABI and ZINBRYTA. For 2018 Other also includes product revenues from IMRALDI, which was launched in Europe in October 2018. For 2017 Other also includes product revenues from ALPROLIX and ELOCTATE through January 31, 2017. No product revenues for ALPROLIX and ELOCTATE were recognized subsequent to February 1, 2017, the effective date of the spin-off of our hemophilia business.
5 Interferon includes AVONEX and PLEGRIDY.
Free Cash Flow 1,3 ($ in millions)
2014
2015
2016
2017
2018
$2,279
$2,223
$2,706
$2,484
$3,917
Strong financial performance
Product Revenues ($ in millions and % of total product revenues)
Total Revenues ($ in millions)
GAAP Diluted EPS/Non-GAAP Diluted EPS 1
2014
2015
2016
2017
2018
$9,703
$10,764
$11,449
$12,274
$13,453
2014
2015
2016
2017
2018
$13.83
$17.01
$20.22
$12.37
$15.34
$16.93
$11.922
$21.582
$21.81
$26.20
TECFIDERA$4,274 $4,21439% 41%
Other4
$662 $6386% 5%
Interferon5
$2,363 $2,64622% 26%
TYSABRI$1,864 $1,97317% 19%
SPINRAZA$1,724 $88416% 9%
2017 2018
2018 2017
Product Revenues by Region (% of total product revenues)
U.S. Rest of the world
2016
62.5% 67.8%
71.8%
37.5% 32.2%
28.2%
20172018
+ 5 %Increase in total product revenues year over year
HIGHLIGHTS & CONTENTS CEO LETTER STRATEGY CULTURE & ENGAGEMENT PRODUCTS & PIPELINE EXECUTIVE COMMITTEE
03
Bio
gen
201
8 A
nnua
l R
epor
t
EXECUTIVE COMMITTEEPRODUCTS & PIPELINECULTURE & ENGAGEMENTSTRATEGYCEO LETTERHIGHLIGHTS & CONTENTS
CO
NTE
NTS
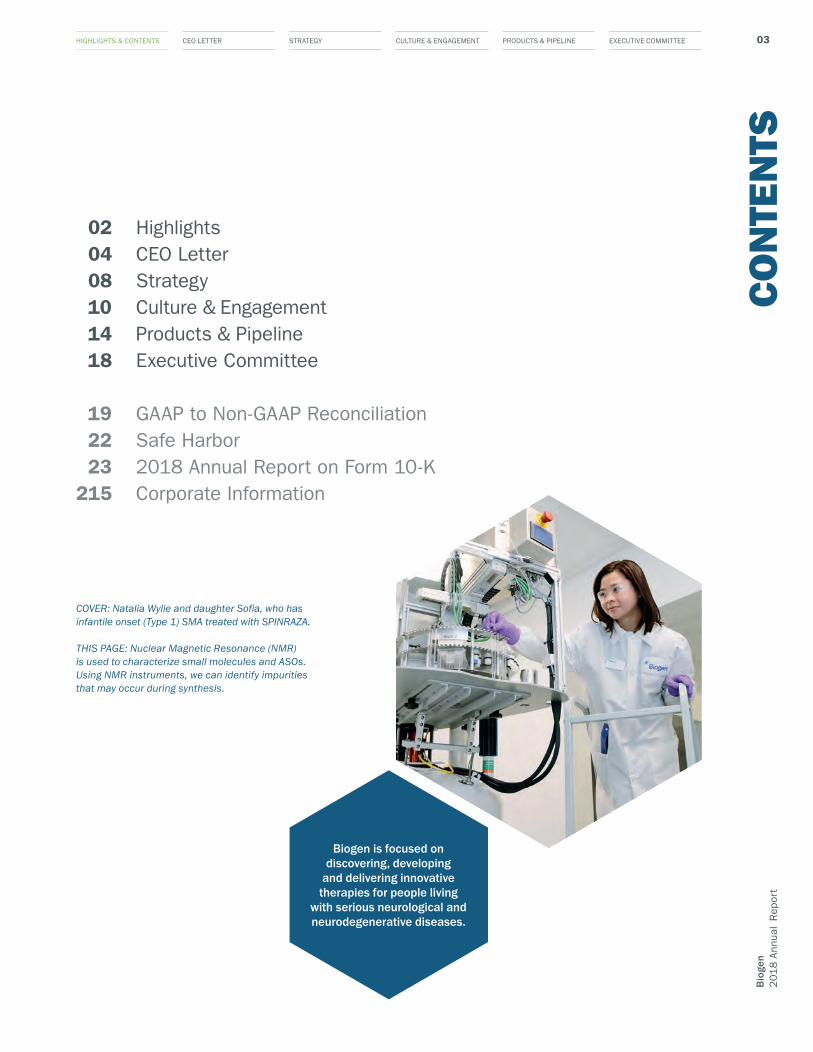
002 Highlights004 CEO Letter008 Strategy010 Culture & Engagement014 Products & Pipeline018 Executive Committee
019 GAAP to Non-GAAP Reconciliation022 Safe Harbor023 2018 Annual Report on Form 10-K215 Corporate Information
Biogen is focused on discovering, developing
and delivering innovative therapies for people living
with serious neurological and neurodegenerative diseases.
COVER: Natalia Wylie and daughter Sofia, who has infantile onset (Type 1) SMA treated with SPINRAZA.
THIS PAGE: Nuclear Magnetic Resonance (NMR) is used to characterize small molecules and ASOs. Using NMR instruments, we can identify impurities that may occur during synthesis.
HIGHLIGHTS & CONTENTS04 STRATEGY CULTURE & ENGAGEMENT PRODUCTS & PIPELINE EXECUTIVE COMMITTEEB
ioge
n2
01
8 A
nnua
l R
epor
t CEO LETTER
My fellow stockholders,
2018 was an important year as we took significant steps in strengthening our leadership in our core business and advancing our pipeline.
However, before I comment on our 2018 performance, I would like to acknowledge the discontinuation of the Phase 3 ENGAGE and EMERGE stud-ies of aducanumab in Alzheimer's disease (AD) that we announced in March 2019.
This disappointing news reaffirmed the complexity of treating AD. We are grateful to the patients, their families and inves-tigators who participated in the studies. We know that the sobering reality of drug discovery is that many studies will fail before one succeeds. We are committed to learning from these clinical studies and furthering the scientific understanding of this terrible disease.
We believe our foundation and future remain strong. Neurological diseases are the #1 cause of disability and the #2 cause of death worldwide1. The prevalence and societal burden of these diseases are massive and are
Building for sustainable leadership
CEO
LE
TTER
increasing as the aging population continues to grow. Few other areas of medicine hold as much promise for scientific breakthroughs.
In 2018 we maintained our market leadership in our core franchise of multiple sclerosis (MS) and made prog-
ress toward building a neuromuscular disease franchise with the expansion of SPINRAZA,
the first approved treatment for spinal muscular atrophy (SMA),
a rare neurological disease.
Our view is that neurolog-ical diseases are deeply connected. Because the pathways of these diseas-es are interrelated, we believe the potential ap-proaches for treating them are as well. Our success in MS gives us insight into many other disease areas. For example, research in remyelination and repair,
neuroprotection and axonal health could have applications in
AD, amyotrophic lateral sclerosis (ALS), Parkinson’s disease, stroke and pain.
We are working to build a multi-franchise therapeutic portfolio and to create new sources of value by diversifying our pipeline. In 2018 we made progress in movement disorders such as Parkinson’s disease and in neuromuscular disorders such as ALS.
Achievements in 2018
1 Source: Lancet Neurology, 2017; DRG 2017, American Heart Association, American Parkinson’s Disease Association, The ALS Association.
MAY – Initiated Phase 2TANGO study of BIIB092 (gosuranemab) for AD
APRIL – Acquired BIIB104 (AMPA),a first-in-class Phase 2basset for CIAS
JANUARY – Acquired BIIB100 (XPO1inhibitor), a Phase 1 readyasset primarily for ALS
05HIGHLIGHTS & CONTENTS STRATEGY CULTURE & ENGAGEMENT PRODUCTS & PIPELINE EXECUTIVE COMMITTEECEO LETTER
2018 core business performance In 2018 we generated an all-time high of $13.5 billion in total revenues for the year, a 10% increase over the prior year, and we generated net cash flows from operations of $6.2 bil-lion. GAAP diluted earnings per share for 2018 were $21.58, an increase of 81% over 2017, and Non-GAAP diluted earnings per share increased 20% over the prior year to $26.20.
These results reflect the resilience of our core MS busi-ness, the continued strong global launch of SPINRAZA and the ongoing growth of our biosimilar business.
With approximately 35% of MS patients treated with our medicines globally, in 2018 we continued to be the leader in MS, and we remain firmly committed to the MS community. Our MS portfolio ranges from symptomatic treatments to disease modifying therapies, which enables us to address diverse patient needs across disease stages, and we have continued to push forward. In December Alkermes, with whom we have a license and collaboration agreement, submitted a New Drug Application (NDA) to the U.S. Food and Drug Administration (FDA) for diroximel fumarate (BIIB098), a potential treatment for relapsing forms of MS (RMS). If approved, we will be responsible for marketing diroximel fumarate, which we plan to do under the brand name VUMERITY, a name conditionally accepted by the FDA.
In SMA, SPINRAZA revenues for 2018 nearly doubled year over year with total global revenues of $1.7 billion, which was driven by strong revenue growth in both the
U.S. and international markets. Since its launch two years ago, SPINRAZA, our first product based on the anti-sense oligonucleotide (ASO) platform, has become the standard of care in
SMA. By the end of 2018 SPINRAZA had been approved in over 40 countries and had
received formal reimbursement in 30 countries. Including clinical trials and our Expanded Access Program, as of year-end, more than 6,600 patients have benefited from this remarkable therapy.
Additionally, in November, SPINRAZA won the prestigious International Prix Galien for Best Biotechnology Product – its seventh Prix Galien, following six individual country awards.
The efficacy and safety profile of SPINRAZA are evi-denced by our long-term data and mounting real-world evidence. This includes the unprecedented efficacy data in pre-symptomatic infants as demonstrated by the new interim results from the NURTURE clinical study evaluat-ing efficacy and safety that we announced in October.
Our 2018 revenues also grew as a result of the continued expansion of our biosimilar business. Our biosimilars revenues increased 44% over the prior year. This growth was primarily driven by the success of BENEPALI (an etanercept biosimilar referencing ENBREL), as well as the continued growth of FLIXABI (an infliximab biosimilar referencing REMICADE) and the October launch of IMRALDI (an adalimumab biosimilar referencing HUMIRA) in several European markets. We believe biosimilar products benefit patients and
Bio
gen
201
8 A
nnua
l R
epor
t
We are working to
build a multi-franchise therapeutic portfolio and
to create new sources of value by diversifying
our pipeline.
JUNE – Acquired exclusive option for TMS-007 for acute ischemic stroke
JULY – Acquired Phase 1a BIIB110 (ActRIIA/B ligand trap) and pre-clinical ALG-802 for neuromuscular indications
– Expanded strategic collaboration with Ionis to develop novel ASO drug candidates
– Launched Aby/Cleo app to support individuals with MS
HIGHLIGHTS & CONTENTS06 STRATEGY CULTURE & ENGAGEMENT PRODUCTS & PIPELINE EXECUTIVE COMMITTEECEO LETTER
CEO
LETT
ER are strategically important as we work with payers and
health systems globally with the goal of creating room in healthcare budgets for innovative therapies. Based on our internal estimates, BENEPALI has created savings of up to €800 million annually across Europe.
The launch of SPINRAZA and the growth of our biosimilar business have led to meaningful revenue growth outside of the U.S. and the expansion of our global footprint. At the end of 2018 ex-U.S. product revenues were 37% of our product revenues, up from 32% of our product revenues in 2017.
Overall, our business and cash generation remained strong and continued to provide us with flexibility to allo-cate capital. In 2018 we spent a total of approximately $1.8 billion to develop and expand our pipeline as we signed six business development deals and increased our ownership in Samsung Bioepis Co., Ltd. (Samsung Bioepis), our joint venture with Samsung BioLogics Co. Ltd. (Samsung BioLogics). We also made share repurchases totaling approximately $4.4 billion. We plan to continue evaluating new opportunities for business development as we aim to create long-term stockholder value and in March 2019 we announced a new program for the repurchase of up to $5 billion of our common stock.
2018 pipeline progress2018 was also a productive year with great strides in innovation and achievements of clinical milestones. We continued to build momentum by adding depth in our core growth areas (MS and neuroimmunology, AD and dementia, movement disorders and neuromuscular disorders) and by advancing our emerging growth areas (acute neurology, neurocognitive disorders and pain). We expanded and advanced our pipeline by adding six new clinical programs and completed enrollment of
late-stage studies, including the PASSPORT study for progressive supranuclear palsy (PSP) and the AFFINITY study for MS.
We believe our expansion into movement disorders holds great promise. We initiated the Phase 2 SPARK study of BIIB054 (anti-α-synuclein) in Parkinson’s disease and completed enrollment of our Phase 2 PASSPORT study of BIIB092 (gosuranemab) in PSP, a disease leading to loss of balance, slowing of movement, difficulty moving the eyes and dementia.
We also made progress in neuromuscular disorders by acquiring BIIB110 (ActRIIA/B), a muscle enhancement program for investigation in ALS and SMA, and advanc-ing programs based on the ASO platform. We believe ASOs hold great promise to directly target the genetic
and pathological origin of disease. We initiated a Phase 1 study of BIIB078 (IONIS-C9Rx), an
ASO drug candidate, for ALS targeting C9ORF72, which is the most common-ly inherited cause of ALS.
In the fourth quarter of 2018 we and our collaboration partner Ionis Pharmaceuticals, Inc. (Ionis) announced results from a positive in-terim analysis of the ongoing Phase 1 study of BIIB067 (tofersen) in ALS with superoxide dismutase
1 (SOD1) mutations, a genetic form of ALS representing approximately 2% of all ALS
Our goal is to deliver innovative therapies for patients and invest in
the areas of highest return to deliver long-term value
to our stockholders.
patients. This interim analysis demonstrated both proof-of-biology and proof-of-concept with a concordance across multiple clinical and biomarker endpoints. Based on these results, we initiated and dosed the first patient in the anticipated Phase 3 VALOR study, a continuation of the Phase 1/2 single- and multiple- ascending dose study.
We remain committed to research in AD and to support-ing the millions of patients affected by this devastating
OCTOBER
– FDA granted BIIB092 fasttrack designation for PSP
SEPTEMBER – Enrolled first patient in Phase 3 CHARM study of BIIB093 (glibenclamide IV) for LHI
– Completed enrollment of Phase 2 PASSPORTstudy of BIIB092 for PSP
– Completed enrollment of Phase 2b AFFINITYstudy of opicinumab (anti-LINGO) for MS
– Launched IMRALDI, an adalimumab biosimilar referencing HUMIRA, in Europe
– Presented new interim results from the ongoing NURTURE study for SPINRAZA
Bio
gen
201
8 A
nnua
l R
epor
t
07HIGHLIGHTS & CONTENTS STRATEGY CULTURE & ENGAGEMENT PRODUCTS & PIPELINE EXECUTIVE COMMITTEE
Bio
gen
201
8 A
nnua
l R
epor
t
CEO LETTER
disease. We will continue to advance our tau-related programs, including BIIB092 (gosuranemab) and BIIB080 (IONIS-MAPTRx), and plan to refocus on early research to understand the biology and genetic origins of disease for our remaining AD portfolio.
In our emerging growth areas, we initiated four new studies, including the Phase 3 CHARM study for BIIB093 (glibenclamide IV) in large hemispheric infarction (LHI), a severe form of ischemic stroke. We also expanded our pipeline with the addition of BIIB104 (AMPA) for cognitive impairment associated with schizophrenia (CIAS) and our option for TMS-007 for acute ischemic stroke.
Looking ahead Our solid financial performance in 2018 underpinned our continued investment in research and development and global business expansion. We will continue to be financially disciplined and focused on implementing a lean and simple operating model. We are committed to continuous improvement across all of our operations, something that demands a thoughtful approach toward all our investments over both the short and long term.
We aim to continue our momentum in 2019. To deliver on our aspirations, we will remain focused on executing on our strategic priorities in our core business of MS and SMA and developing and expanding our portfolio. Across the portfolio, we are prioritizing resources based on what we believe are the most promising programs, and we plan to continue to significantly invest in research and development.
This is a remarkable time for Biogen and all our stake-holders. We believe we are well-positioned to address the significant unmet medical need in neuroscience, as well as in adjacent therapeutic areas where we currently have assets or expertise. Our goal is to deliver innovative therapies for patients and invest in the areas of highest return to deliver long-term value to our stockholders.
I would like to thank all of our employees for their con-tinuing dedication to the business and their unwavering commitment to the patients we serve. Pioneering means learning along the way and altering the course when it becomes evident that there is a better path. We are on an exciting journey, fueled by our passion for innovation and groundbreaking science. We care deeply about making a difference. We work fearlessly. We do not give up even when challenged, pursuing innovation in all that we do. We are humbled by the opportunity to change lives.
Michel VounatsosChief Executive Officer
NOVEMBER – Increased ownership in Samsung Bioepis joint venture to approximately 49.9%
DECEMBER – Alkermes submitted a NDA to the FDA for review of BIIB098 (diroximel fumarate) for RMS
– SPINRAZA awarded as Best Biotechnology Product by International Prix Galien
– Initiated Phase 3b NOVA study evaluating the efficacy of extended interval dosing for
natalizumab
– Dosed first patient in Phase 2b TALLY study of BIIB104 (AMPA) in CIAS – Announced positive results from Phase 1 study of BIIB067 ( ) in ALS with SOD1 mutations
– Entered into agreement to investigate the use of C4 Therapeutics' novel protein degradation platform
HIGHLIGHTS & CONTENTS08 CEO LETTER CULTURE & ENGAGEMENT PRODUCTS & PIPELINE EXECUTIVE COMMITTEEB
ioge
n2
01
8 A
nnua
l R
epor
t STRATEGY
STR
ATE
GY Delivering today and
investing for future growth
Continuing to build a multi-franchise portfolio
YESTERDAY TODAY
BIOSIMILARS
SMA
We are focused on neuroscience, and our goal is to further expand our multi-franchise portfolio.
Our strategy is rooted in the fact that the unmet need in neurosci-ence is vast, and we believe that no other area of medicine holds as much promise for scientific breakthroughs. Despite medical advances, many neurological diseases remain largely untreated, and there is a significant and growing opportunity to make a differ-ence in the lives of many patients.
We believe that neurological diseas-es and the therapeutic strategies to treat them are interconnected. We have identified a set of scientific hypotheses with the potential to unlock breakthroughs across our disease areas. Knowledge gained from one area may resonate across our pipeline.
MS FRANCHISE MS FRANCHISE
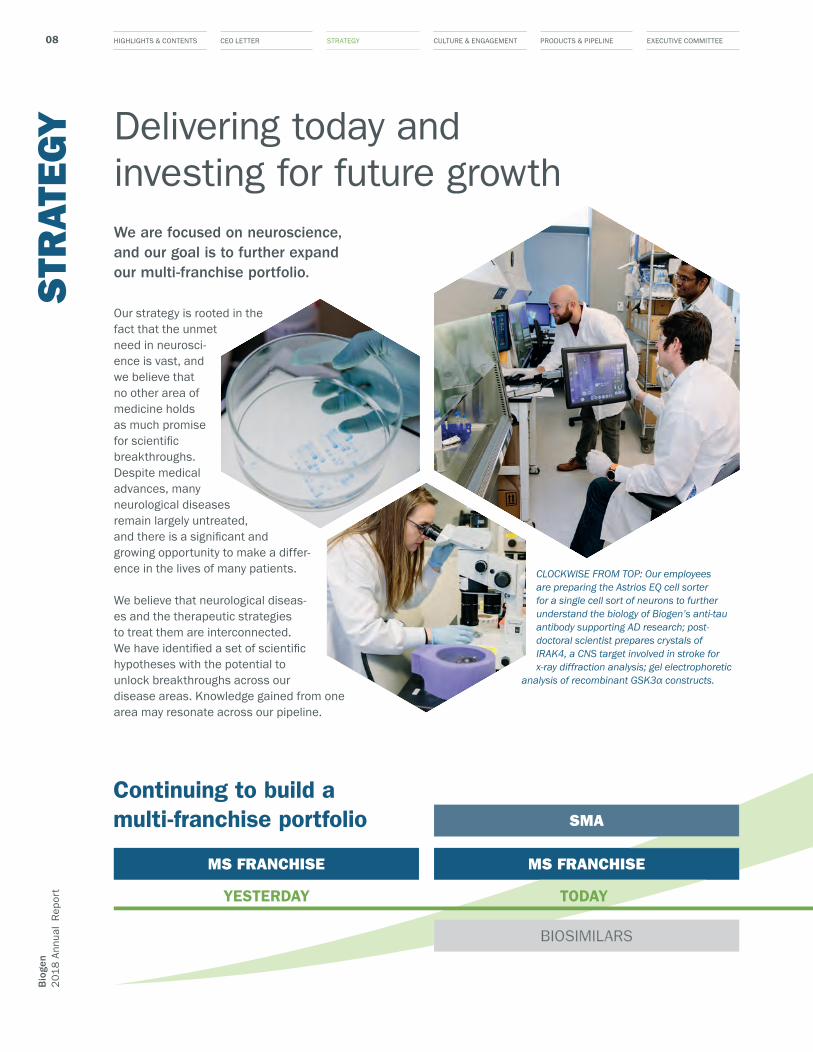
CLOCKWISE FROM TOP: Our employees are preparing the Astrios EQ cell sorter for a single cell sort of neurons to further understand the biology of Biogen’s anti-tau antibody supporting AD research; post- doctoral scientist prepares crystals of IRAK4, a CNS target involved in stroke for x-ray diffraction analysis; gel electrophoretic
analysis of recombinant GSK3α constructs.

09HIGHLIGHTS & CONTENTS CEO LETTER CULTURE & ENGAGEMENT PRODUCTS & PIPELINE EXECUTIVE COMMITTEE
Bio
gen
201
8 A
nnua
l R
epor
t
STRATEGY
EARLY 2020s
MS FRANCHISE
NEUROMUSCULAR FRANCHISE
OPHTHALMOLOGY FRANCHISE ¹ OPHTHALMOLOGY FRANCHISE 1
MOVEMENT DISORDER FRANCHISE
STROKE
MS FRANCHISE
NEUROMUSCULAR FRANCHISE
ALZHEIMER'S DISEASE FRANCHISE
THERAPEUTIC ADJACENCIES THERAPEUTIC ADJACENCIES
PAIN
MOVEMENT DISORDER FRANCHISE
NEUROCOGNITIVE DISORDERS
ACUTE NEUROLOGY FRANCHISE
BIOSIMILARS BIOSIMILARS
OUR VISION
Our strategy is to execute on our core business by max-imizing our resilience in MS, accelerating our progress in SMA and creating new sources of value by developing and expanding our pipeline. We are focused on our core growth areas of MS and neuroimmunology, AD and dementia, movement disorders and neuromuscular disorders, and our emerging growth areas of acute neu-rology, neurocognitive disorder, pain and ophthalmology.
Our biosimilar business is complementary to our strat-egy. We believe savings enabled by biosimilars provide payers and health systems globally the budgetary headroom to fund innovation.
We are focused on delivering on our strategy today and investing in future growth. We must remain financially disciplined with the aim of continuous improvement. We have reprioritized our capital allocation to support our strategy; namely, investing in research and development and business development. With our deep and diversi-fied pipeline, strong execution capabilities and financial strength, we believe we can deliver on our strategy.
1 In March 2019 we entered into an agreement to acquire Nightstar Therapeutics plc, a clinical-stage gene therapy company focused on AAV treatments for inherited retinal disorders. The closing of the proposed acquisition of Nightstar Therapeutics plc remains subject to customary closing conditions, including the approval by Nightstar Therapeutics stockholders and the issuance of an order by the U.K. Court.

HIGHLIGHTS & CONTENTS10 CEO LETTER STRATEGY PRODUCTS & PIPELINE EXECUTIVE COMMITTEEB
ioge
n2
01
8 A
nnua
l R
epor
t CULTURE & ENGAGEMENT
CU
LTU
RE Living our elements
Much like the periodic table of elements documents the building blocks of the universe around us, the Biogen Elements give shape to our company’s culture.
How we workThe Biogen Elements promote a unified approach to our individual jobs – strengthening our mission, informing our leadership, expanding our impact and fueling our growth.
As we remain focused on discovering, developing and delivering innovative therapies, we remain customer focused. We keep patients, payers and physicians front and center in our daily work and collab-orate to solve critical scientific and business challenges. In doing so, we foster an inclusive community, both internally and externally. We work in partnership to break down siloes and encourage diverse perspectives and backgrounds at all levels.
A pioneering spirit permeates our work. We challenge the status quo and experiment to create new possibilities. We are not afraid to take calculated risks and learn from failure. We are resilient and agile, adapting in response to internal changes and external disruptors and developing solutions quickly to take advantage of emerging opportunities. We hold ourselves accountable for our work and results. We honor our commitments, and we never compromise our integrity. We sustain an ethical environment of trust, honesty and transparency while ensuring appropri-ate confidentiality. We take responsibility for upholding our reputation.
Diversity and inclusionAt Biogen, we believe that a diverse and inclusive work-place allows us to empower our global workforce, foster innovation and achieve better business results. Diversity and inclusion lead to better teamwork and collaboration, create a climate of respect and trust, and cultivate an environment where employees feel empowered to work fearlessly. In 2018 we launched our company-wide Diversity and Inclusion Strategy, which aims to build inclusive talent systems, drive health equity in the disease areas we treat and ensure diversity and inclusion are owned by everyone within Biogen.
CARE DEEPLY DAY 2018: On September 21, employees volunteered at the Museum of Life and Science in Durham, N.C. (top), and on September 14, employees volunteered at West Somerville Neighborhood School in Somerville, Mass.

11HIGHLIGHTS & CONTENTS CEO LETTER STRATEGY PRODUCTS & PIPELINE EXECUTIVE COMMITTEE
Bio
gen
201
8 A
nnua
l R
epor
t
We are honored to be recognized as a company of choice for employees. In 2018 Biogen was ranked #51 on the Forbes list of World’s Best Employers, as well as one of the Best Employers for Women (at #38). We scored 100% on the 2018 Disability Equality Index, which measures our policies and practices related to disability inclusion. Additionally, for the fifth consecutive year, we were recognized as a Best Place to Work for LGBTQ Equality by the Human Rights Campaign, scoring 100% on their Corporate Equality Index.
Caring deeplyCaring about our communities is enshrined in our Care Deeply Day. Since 2011 we have set aside this annual global day of volunteer service to enable all employees to reach out and have an impact in their local communities. In 2018 over 3,200 employees volunteered for 60 projects in 30 locations in 28 countries.
CULTURE & ENGAGEMENT
Aby/CleoOur app for MS patients We believe that regardless of their treatment choices, MS patients should always be informed, supported and inspired to aim for better tomorrows. We created innovative solutions and services to further support patients “beyond the pill” – offering products specifically designed for people who live with neurological conditions. In 2018 we launched a mobile app, called Aby in the U.S. and Cleo outside the U.S., created to serve as a digital companion for people living with MS and those who support them. Individuals are able to access personalized content and track their health in a way that can easily be shared with their healthcare professionals.
Engagement with the app was achieved through a customer-centric approach, involving more than 150 patients, 60 healthcare professionals and 6 Patient Advocacy Groups assisting in the app design process.
Caroline Craven (pictured below), an MS patient and Aby user, explains that understanding MS goes beyond the disease and therapies: “It's about some-body learning to live better, learning new life skills, learning to manage their life with their medicine and their healthcare professionals as one big picture.”
44 %
48 %
120,000 +downloads as of
December 31, 2018
Bio
gen
201
8 A
nnua
l R
epor
t
of director-level and above positions held by women
of manager-level and above positions held by women
HIGHLIGHTS & CONTENTS12 CEO LETTER STRATEGY PRODUCTS & PIPELINE EXECUTIVE COMMITTEEB
ioge
n2
01
8 A
nnua
l R
epor
t CULTURE & ENGAGEMENT
We work to have an impact beyond our medicines as we strive to improve patient health outcomes, solve social and environmental challenges, support local communities and inspire future generations of scientists.
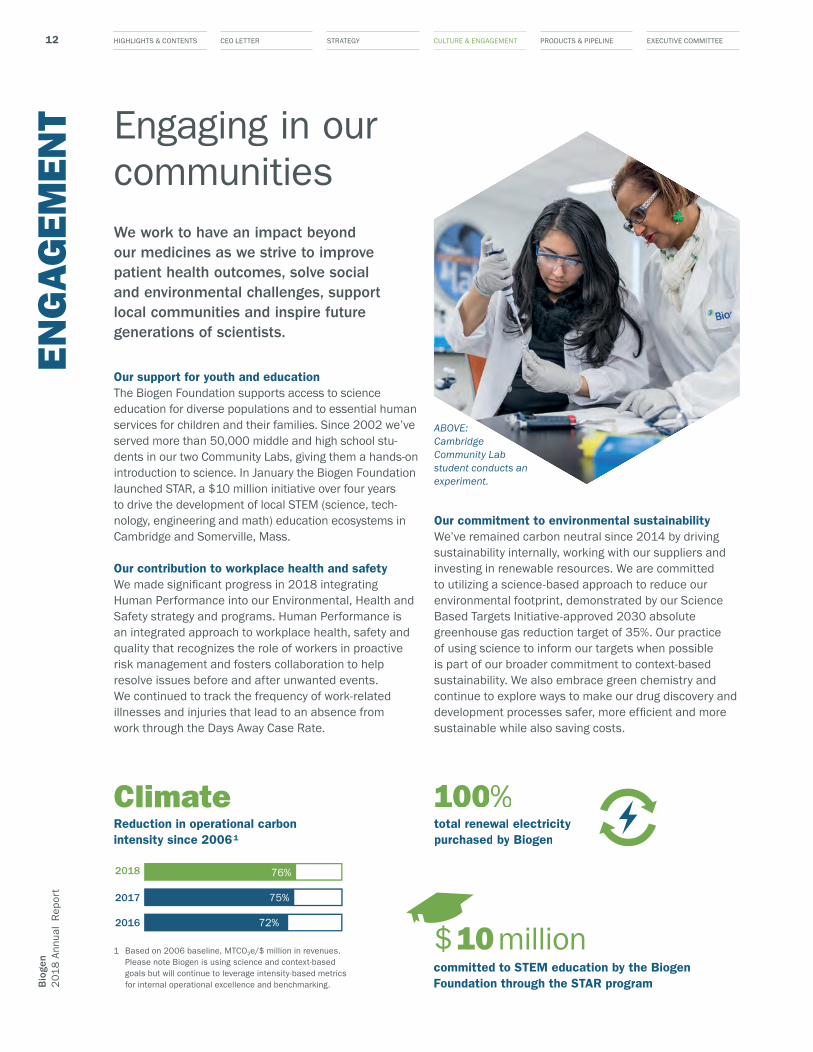
Our support for youth and educationThe Biogen Foundation supports access to science education for diverse populations and to essential human services for children and their families. Since 2002 we’ve served more than 50,000 middle and high school stu-dents in our two Community Labs, giving them a hands-on introduction to science. In January the Biogen Foundation launched STAR, a $10 million initiative over four years to drive the development of local STEM (science, tech-nology, engineering and math) education ecosystems in Cambridge and Somerville, Mass.
Our contribution to workplace health and safety We made significant progress in 2018 integrating Human Performance into our Environmental, Health and Safety strategy and programs. Human Performance is an integrated approach to workplace health, safety and quality that recognizes the role of workers in proactive risk management and fosters collaboration to help resolve issues before and after unwanted events. We continued to track the frequency of work-related illnesses and injuries that lead to an absence from work through the Days Away Case Rate.
Engaging in our communities
2016
2017
2018
72%
75%
76%
ClimateReduction in operational carbon intensity since 2006 ¹
EN
GA
GEM
ENT
100%total renewal electricitypurchased by Biogen
Our commitment to environmental sustainabilityWe’ve remained carbon neutral since 2014 by driving sustainability internally, working with our suppliers and investing in renewable resources. We are committed to utilizing a science-based approach to reduce our environmental footprint, demonstrated by our Science Based Targets Initiative-approved 2030 absolute greenhouse gas reduction target of 35%. Our practice of using science to inform our targets when possible is part of our broader commitment to context-based sustainability. We also embrace green chemistry and continue to explore ways to make our drug discovery and development processes safer, more efficient and more sustainable while also saving costs.
1 Based on 2006 baseline, MTCO2e/$ million in revenues. Please note Biogen is using science and context-based goals but will continue to leverage intensity-based metrics for internal operational excellence and benchmarking.
$ 10 millioncommitted to STEM education by the Biogen Foundation through the STAR program
ABOVE: Cambridge Community Lab student conducts an experiment.
13HIGHLIGHTS & CONTENTS CEO LETTER STRATEGY PRODUCTS & PIPELINE EXECUTIVE COMMITTEE
Bio
gen
201
8 A
nnua
l R
epor
t
CULTURE & ENGAGEMENT
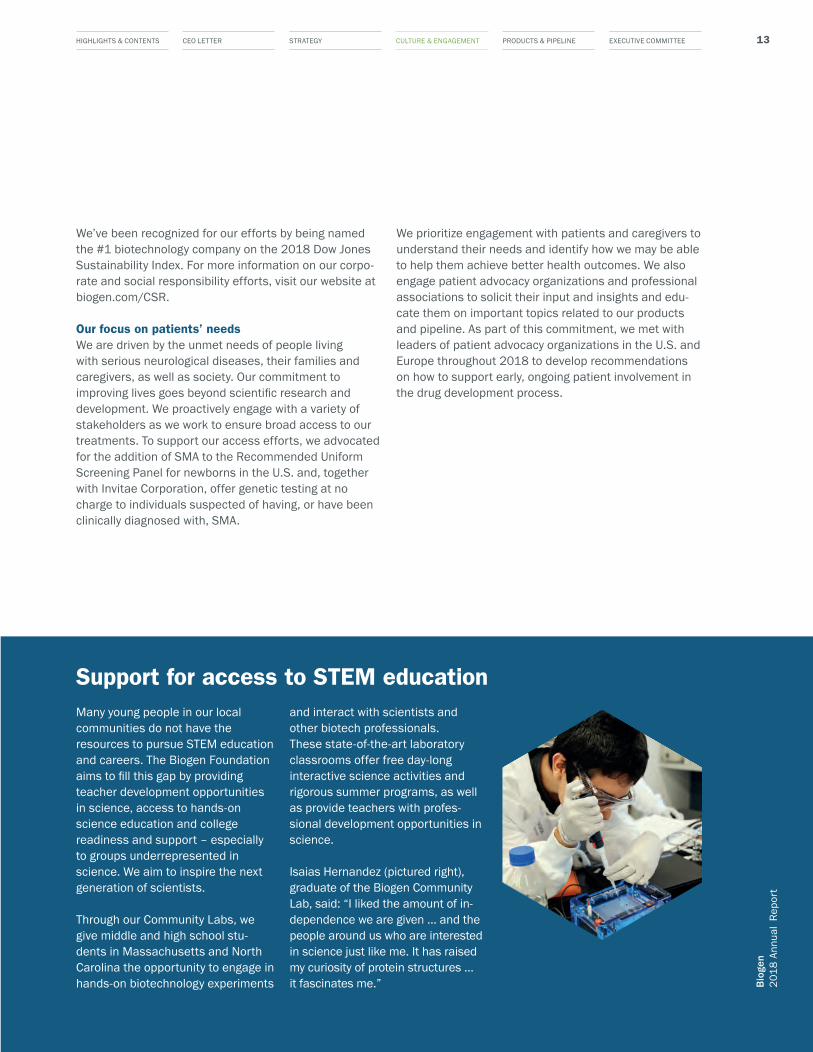
Support for access to STEM educationMany young people in our local communities do not have the resources to pursue STEM education and careers. The Biogen Foundation aims to fill this gap by providing teacher development opportunities in science, access to hands-on science education and college readiness and support – especially to groups underrepresented in science. We aim to inspire the next generation of scientists.
Through our Community Labs, we give middle and high school stu-dents in Massachusetts and North Carolina the opportunity to engage in hands-on biotechnology experiments
and interact with scientists and other biotech professionals. These state-of-the-art laboratory classrooms offer free day-long interactive science activities and rigorous summer programs, as well as provide teachers with profes-sional development opportunities in science.
Isaias Hernandez (pictured right), graduate of the Biogen Community Lab, said: “I liked the amount of in-dependence we are given … and the people around us who are interested in science just like me. It has raised my curiosity of protein structures … it fascinates me.”
We’ve been recognized for our efforts by being named the #1 biotechnology company on the 2018 Dow Jones Sustainability Index. For more information on our corpo-rate and social responsibility efforts, visit our website at biogen.com/CSR.
Our focus on patients’ needsWe are driven by the unmet needs of people living with serious neurological diseases, their families and caregivers, as well as society. Our commitment to improving lives goes beyond scientific research and development. We proactively engage with a variety of stakeholders as we work to ensure broad access to our treatments. To support our access efforts, we advocated for the addition of SMA to the Recommended Uniform Screening Panel for newborns in the U.S. and, together with Invitae Corporation, offer genetic testing at no charge to individuals suspected of having, or have been clinically diagnosed with, SMA.
We prioritize engagement with patients and caregivers to understand their needs and identify how we may be able to help them achieve better health outcomes. We also engage patient advocacy organizations and professional associations to solicit their input and insights and edu-cate them on important topics related to our products and pipeline. As part of this commitment, we met with leaders of patient advocacy organizations in the U.S. and Europe throughout 2018 to develop recommendations on how to support early, ongoing patient involvement in the drug development process.
Bio
gen
201
8 A
nnua
l R
epor
t
HIGHLIGHTS & CONTENTS14 CEO LETTER STRATEGY CULTURE & ENGAGEMENT EXECUTIVE COMMITTEEB
ioge
n2
01
8 A
nnua
l R
epor
t PRODUCTS & PIPELINE
Our portfolio of therapies provides treatment for diseases that are among humanity’s most complex and difficult health challenges.
Globally, more than one in three MS patients are treated with one of our MS therapies. TECFIDERA celebrated five years since its approval by the FDA and is the most prescribed oral MS therapy globally. TYSABRI is the market leading high efficacy therapy for MS globally. We have the market leading interferon portfolio for MS globally with AVONEX and PLEGRIDY.
MS remains at our core. Among the oral therapies, we are preparing for the potential launch of diroximel fumarate (BIIB098), which we plan to market under the brand name VUMERITY, a name conditionally accepted by the FDA, and we expect approval in the fourth quarter of 2019. Within the high efficacy space, we have initiated the Phase 3b
Leading in multiple sclerosis and spinal muscular atrophy
NOVA study to assess the efficacy of six-week extended interval dosing of TYSABRI (natalizumab) compared with standard interval dosing in patients with RMS, an approach that demonstrated the potential to reduce the risk of progressive multifocal leukoencephalopathy (PML), a serious brain injury. Finally, within our interferon portfolio, we are developing an intramuscular formula-tion of PLEGRIDY (peginterferon beta-1a) to potentially reduce injection site reactions.
Our commitment to SMA is unwavering, and we are humbled by the trust we have built with the SMA
community. Since its launch, SPINRAZA has become the standard of care for SMA,
with more than 6,600 patients on treatment, including our Expanded Access Program and clinical trials, as of December 31, 2018. The efficacy and safety profile of SPINRAZA is evidenced by our long-term data and real-world experience. SPINRAZA has the largest clinical data set in SMA to date, with over 300 patients followed for up to six years.
PR
OD
UC
TS
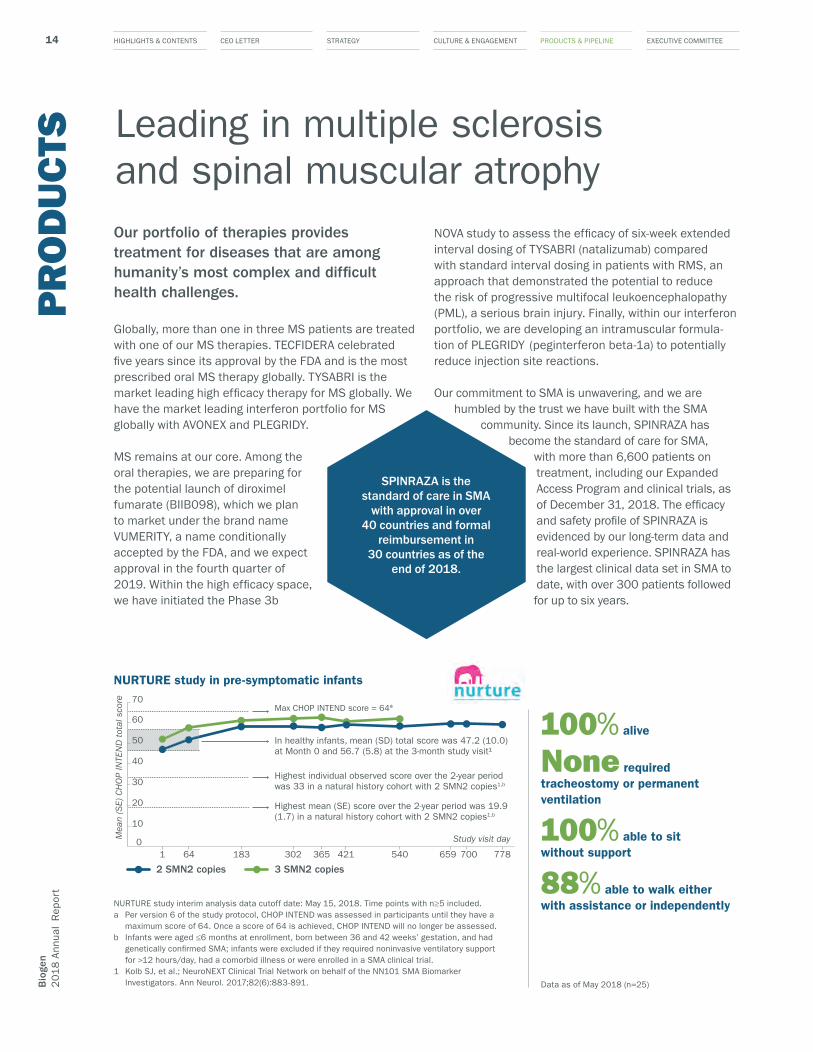
Max CHOP INTEND score = 64ª
Highest individual observed score over the 2-year period was 33 in a natural history cohort with 2 SMN2 copies1,b
In healthy infants, mean (SD) total score was 47.2 (10.0) at Month 0 and 56.7 (5.8) at the 3-month study visit¹
Highest mean (SE) score over the 2-year period was 19.9 (1.7) in a natural history cohort with 2 SMN2 copies1,b
Mea
n (S
E) C
HO
P IN
TEN
D t
otal
sco
re
Study visit day
2 SMN2 copies 3 SMN2 copies
0
10
20
30
40
50
60
70
778700659540421365302183641
NURTURE study in pre-symptomatic infants
SPINRAZA is the standard of care in SMA
with approval in over 40 countries and formal
reimbursement in 30 countries as of the
end of 2018.
Data as of May 2018 (n=25)
100% alive
None required tracheostomy or permanent ventilation
100% able to sit without support
88% able to walk either with assistance or independentlyNURTURE study interim analysis data cutoff date: May 15, 2018. Time points with n≥5 included.
a Per version 6 of the study protocol, CHOP INTEND was assessed in participants until they have a maximum score of 64. Once a score of 64 is achieved, CHOP INTEND will no longer be assessed.
b Infants were aged ≤6 months at enrollment, born between 36 and 42 weeks’ gestation, and had genetically con�rmed SMA; infants were excluded if they required noninvasive ventilatory support for >12 hours/day, had a comorbid illness or were enrolled in a SMA clinical trial.
1 Kolb SJ, et al.; NeuroNEXT Clinical Trial Network on behalf of the NN101 SMA Biomarker Investigators. Ann Neurol. 2017;82(6):883-891.
15HIGHLIGHTS & CONTENTS CEO LETTER STRATEGY CULTURE & ENGAGEMENT EXECUTIVE COMMITTEEPRODUCTS & PIPELINE
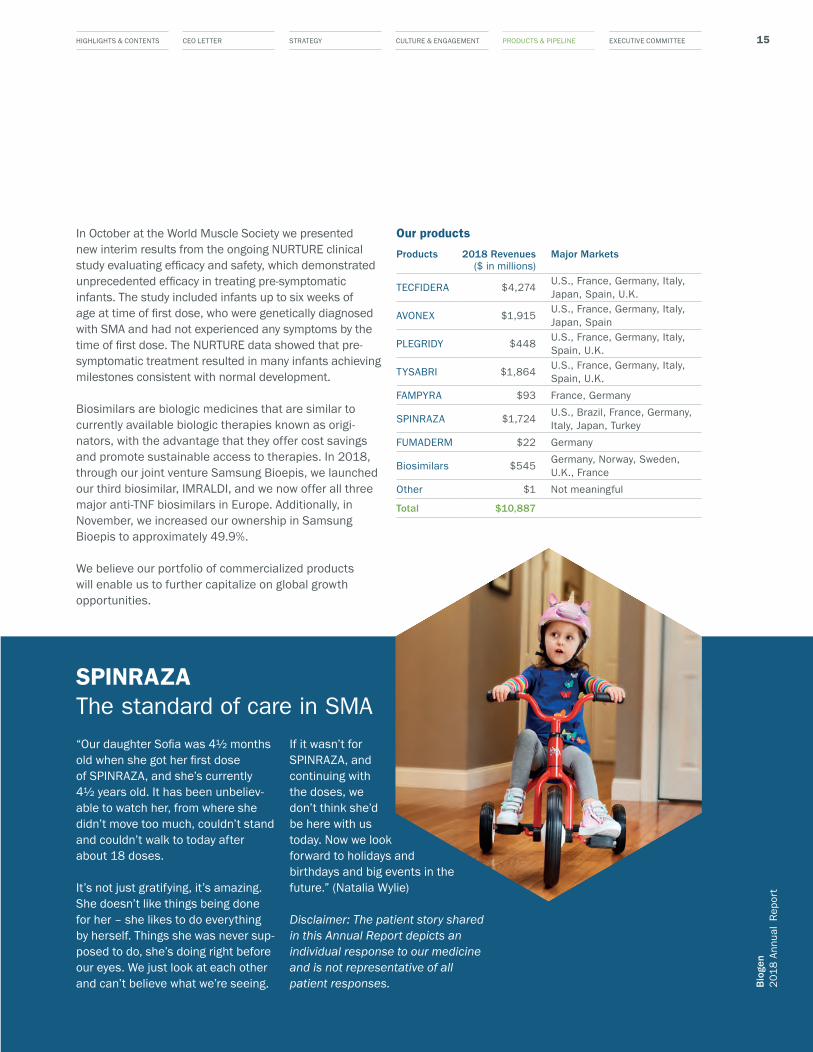
SPINRAZAThe standard of care in SMA“Our daughter Sofia was 4½ months old when she got her first dose of SPINRAZA, and she’s currently 4½ years old. It has been unbeliev-able to watch her, from where she didn’t move too much, couldn’t stand and couldn’t walk to today after about 18 doses.
It’s not just gratifying, it’s amazing. She doesn’t like things being done for her – she likes to do everything by herself. Things she was never sup-posed to do, she’s doing right before our eyes. We just look at each other and can’t believe what we’re seeing.
If it wasn’t for SPINRAZA, and continuing with the doses, we don’t think she’d be here with us today. Now we look forward to holidays and birthdays and big events in the future.” (Natalia Wylie)
Disclaimer: The patient story shared in this Annual Report depicts an individual response to our medicine and is not representative of all patient responses.
Our products
Products 2018 Revenues ($ in millions)
Major Markets
TECFIDERA $4,274U.S., France, Germany, Italy, Japan, Spain, U.K.
AVONEX $1,915U.S., France, Germany, Italy, Japan, Spain
PLEGRIDY $448U.S., France, Germany, Italy, Spain, U.K.
TYSABRI $1,864U.S., France, Germany, Italy, Spain, U.K.
FAMPYRA $93 France, Germany
SPINRAZA $1,724U.S., Brazil, France, Germany, Italy, Japan, Turkey
FUMADERM $22 Germany
Biosimilars $545Germany, Norway, Sweden, U.K., France
Other $1 Not meaningful
Total $10,887
Bio
gen
201
8 A
nnua
l R
epor
t
In October at the World Muscle Society we presented new interim results from the ongoing NURTURE clinical study evaluating efficacy and safety, which demonstrated unprecedented efficacy in treating pre-symptomatic infants. The study included infants up to six weeks of age at time of first dose, who were genetically diagnosed with SMA and had not experienced any symptoms by the time of first dose. The NURTURE data showed that pre- symptomatic treatment resulted in many infants achieving milestones consistent with normal development.
Biosimilars are biologic medicines that are similar to currently available biologic therapies known as origi-nators, with the advantage that they offer cost savings and promote sustainable access to therapies. In 2018, through our joint venture Samsung Bioepis, we launched our third biosimilar, IMRALDI, and we now offer all three major anti-TNF biosimilars in Europe. Additionally, in November, we increased our ownership in Samsung Bioepis to approximately 49.9%.
We believe our portfolio of commercialized products will enable us to further capitalize on global growth opportunities.

HIGHLIGHTS & CONTENTS16 CEO LETTER STRATEGY CULTURE & ENGAGEMENT EXECUTIVE COMMITTEEB
ioge
n2
01
8 A
nnua
l R
epor
t PRODUCTS & PIPELINE
PIP
ELI
NE Building depth in our pipeline
We are prioritizing our resources on what we believe are the most promising programs and funded research and development expenditures of $2.6 billion in 2018.
Pursuing multiple modalities The emergence of prom-ising new modalities, includ-ing ASOs and gene therapy via AAV, and advancements in biologics and small molecules, are opening entirely new target spaces for potential therapeutic interventions. Our pursuit of multiple modalities may have the ability to slow or halt the progression of neurological diseases.
In June we invested $1 billion to enter into a 10-year exclusive agreement with Ionis, giving us access to their innovative antisense platform across a broad range of neurological diseases to develop novel ASO candidates. This promising platform has the poten-tial to selectively target the genetic drivers of disease.
The positive interim results from our BIIB067 program may have positive implications for additional ASOs in our pipeline. For instance, BIIB078, an ASO targeting C9ORF72 for ALS, leverages a similar RNA degradation mechanism as BIIB067. Furthermore, our BIIB080 program is an ASO targeting tau that is currently being evaluated in a Phase 1 study in patients with mild AD.
Leveraging the interconnectivity in neuroscience Our success in MS gives our researchers insight into many other disease areas, such as remyelination and repair, neuroprotection and axonal health, with potential applications in AD, Parkinson’s disease, ALS, stroke and pain. And targeting tau, key proteins in the central nervous system, holds promise for potentially treating not just AD but other tauopathies such as PSP, which affects tens of thousands of people globally.
Our most advanced asset for PSP is BIIB092, a mono-clonal antibody targeting tau, which is believed to be
the underlying cause of the disease. Phase 1 data demonstrated a greater than 90% reduction in
CSF tau. If BIIB092 demonstrates clinical efficacy in PSP, it would represent
an important inflection point for us and our efforts to treat movement disorders and the broader class of tauopathies.
Standing on the brink of potential significant break-throughs, we continue to explore new opportunities and external innovation. In December we entered into an agreement with C4 Therapeutics to inves-
tigate the use of protein degraders for neurological
diseases in our areas of interest.
Building off our momentum from the prior year, we continued to focus on business development
across multiple modalities. In January 2019 we entered into an agreement with Skyhawk Therapeutics, Inc. to leverage their SkySTAR technology platform with the goal of discovering innovative small molecules.
In March 2019 we entered into an agreement to acquire Nightstar Therapeutics plc, a clinical-stage gene therapy company focused on AAV treatments for inherited retinal disorders. The closing of this proposed acquisition re-mains subject to customary closing conditions, including the approval by Nightstar Therapeutics stockholders and the issuance of an order by the U.K. Court.
As we advance our multi-franchise portfolio, we are excited by the possibility of pioneering new scientific breakthroughs and bringing new treatment options to patients in need.

17HIGHLIGHTS & CONTENTS CEO LETTER STRATEGY CULTURE & ENGAGEMENT EXECUTIVE COMMITTEE
Bio
gen
201
8 A
nnua
l R
epor
t
PRODUCTS & PIPELINE
We added ( ) or advanced ( ) 15 clinical programs since the beginning of 2017 through April 22, 2019.
CORE GROWTH AREAS Phase 1 Phase 2 Phase 3
Multiple sclerosis and neuroimmunologyBIIB098 (diroximel fumarate) 1
Opicinumab (anti-LINGO)
BIIB061 (oral remyelination)
Alzheimer’s disease and dementiaElenbecestat (E2609) 1
BAN2401 (A mAb)1
BIIB092 (gosuranemab)
BIIB076 (anti-tau mAb)
BIIB080 (IONIS-MAPTRx) 2
Movement disordersBIIB092 (gosuranemab) – Progressive Supranuclear Palsy
BIIB054 (anti-α-synuclein mAb) – Parkinson’s Disease
Neuromuscular disordersBIIB067 (tofersen) 1, 3 – Amyotrophic Lateral Sclerosis
BIIB078 (IONIS-C9Rx) 2 – Amyotrophic Lateral Sclerosis
BIIB110 (ActRIIA/B ligand trap) – Spinal Muscular Atrophy
EMERGING GROWTH AREAS Phase 1 Phase 2 Phase 3
Acute neurologyBIIB093 (glibenclamide IV) – Large Hemispheric Infarction
TMS-007 2 – Acute Ischemic Stroke
Natalizumab – Epilepsy
Neurocognitive disordersBIIB104 (AMPA) – Cognitive Impairment Associated with Schizophrenia
PainBIIB074 (vixotrigine) – Trigeminal Neuralgia 4
BIIB074 (vixotrigine) – Small Fiber Neuropathy
Phase 1 Phase 2 Phase 3
BIIB095 (Nav. 1.7) – Neuropathic Pain
THERAPEUTIC ADJACENCIES
Dapirolizumab pegol (anti-CD40L)1 – Systemic Lupus Erythematosus
BIIB059 (anti-BDCA2) – Systemic Lupus Erythematosus
BG00011 (STX-100) – Idiopathic Pulmonary Fibrosis
1 Collaboration program.2 Option agreement.
I n December 2018 Biogen received feedback from the FDA on its proposed Phase 3 development plan for BIIB074 (vixotrigine) in trigeminal neuralgia (TGN).2

HIGHLIGHTS & CONTENTS18 CEO LETTER STRATEGY CULTURE & ENGAGEMENT PRODUCTS & PIPELINEB
ioge
n2
01
8 A
nnua
l R
epor
t EXECUTIVE COMMITTEE
EX
EC
UTI
VE
CO
MM
ITTE
E
Chir� GuindoExecutive Vice President, Global Product Strategy and Commercialization
Paul F. McKenzie, Ph.D.Executive Vice President, Pharmaceutical Operations and Technology
Daniel KarpExecutive Vice President, Corporate Development
Michel VounatsosChief Executive Officer
Alfred W. Sandrock, Jr., M.D., Ph.D.Executive Vice President and Chief Medical Officer
Susan H. AlexanderExecutive Vice President, Chief Legal Officer and Secretary
Jeffrey D. CapelloExecutive Vice President and Chief Financial Officer
Ginger Gregory, Ph.D. Executive Vice President and Chief Human Resources Officer
Michael D. Ehlers, M.D., Ph.D.Executive Vice President, Research and Development
Our management team
(LEFT TO RIGHT)
19
Bio
gen
201
8 A
nnua
l R
epor
t
GAAP to Non-GAAP Reconciliation
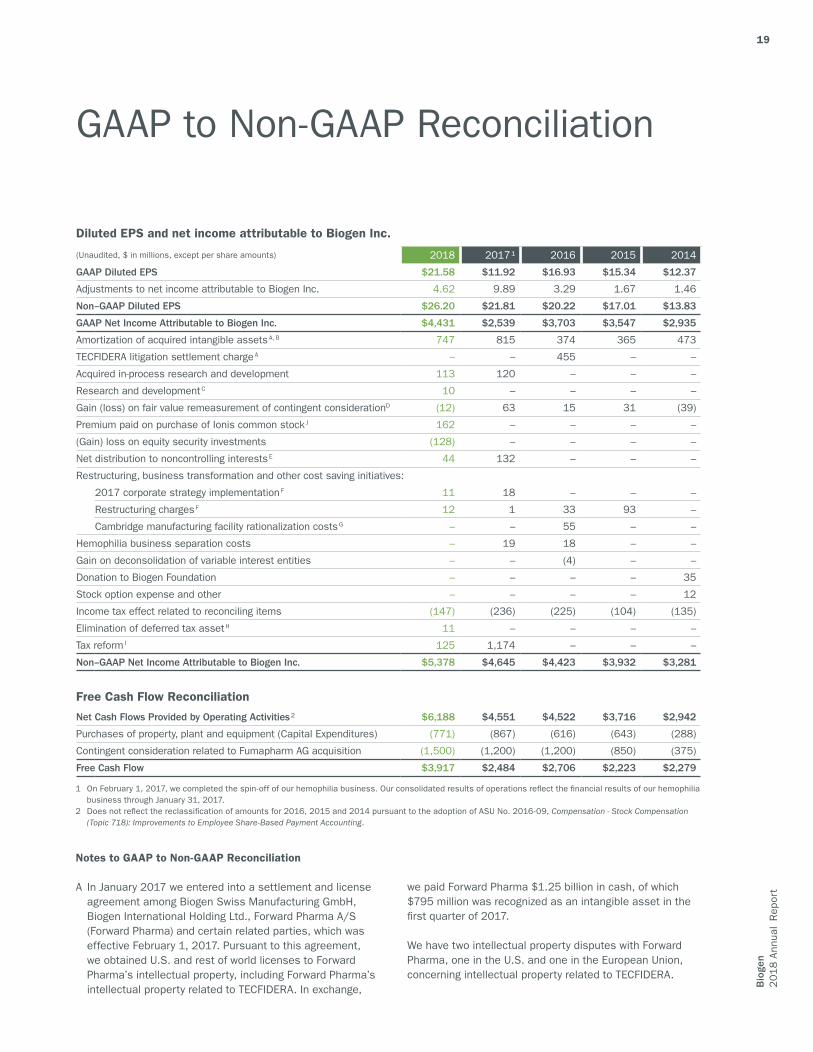
Diluted EPS and net income attributable to Biogen Inc.
(Unaudited, $ in millions, except per share amounts) 2018 2017 ¹ 2016 2015 2014
GAAP Diluted EPS $21.58 $11.92 $16.93 $15.34 $12.37
Adjustments to net income attributable to Biogen Inc. 4.62 9.89 3.29 1.67 1.46
Non–GAAP Diluted EPS $26.20 $21.81 $20.22 $17.01 $13.83
GAAP Net Income Attributable to Biogen Inc. $4,431 $2,539 $3,703 $3,547 $2,935
Amortization of acquired intangible assets A, B 747 815 374 365 473
TECFIDERA litigation settlement charge A – – 455 – –
Acquired in-process research and development 113 120 – – –
Research and development C 10 – – – –
Gain (loss) on fair value remeasurement of contingent considerationD (12) 63 15 31 (39)
Premium paid on purchase of Ionis common stock J 162 – – – –
(Gain) loss on equity security investments (128) – – – –
Net distribution to noncontrolling interests E 44 132 – – –
Restructuring, business transformation and other cost saving initiatives:
2017 corporate strategy implementation F 11 18 – – –
Restructuring charges F 12 1 33 93 –
Cambridge manufacturing facility rationalization costs G – – 55 – –
Hemophilia business separation costs – 19 18 – –
Gain on deconsolidation of variable interest entities – – (4) – –
Donation to Biogen Foundation – – – – 35
Stock option expense and other – – – – 12
Income tax effect related to reconciling items (147) (236) (225) (104) (135)
Elimination of deferred tax asset H 11 – – – –
Tax reform I 125 1,174 – – –
Non–GAAP Net Income Attributable to Biogen Inc. $5,378 $4,645 $4,423 $3,932 $3,281
Free Cash Flow Reconciliation
Net Cash Flows Provided by Operating Activities 2 $6,188 $4,551 $4,522 $3,716 $2,942
Purchases of property, plant and equipment (Capital Expenditures) (771) (867) (616) (643) (288)
Contingent consideration related to Fumapharm AG acquisition (1,500) (1,200) (1,200) (850) (375)
Free Cash Flow $3,917 $2,484 $2,706 $2,223 $2,279
Notes to GAAP to Non-GAAP Reconciliation
A In January 2017 we entered into a settlement and license agreement among Biogen Swiss Manufacturing GmbH, Biogen International Holding Ltd., Forward Pharma A/S (Forward Pharma) and certain related parties, which was effective February 1, 2017. Pursuant to this agreement, we obtained U.S. and rest of world licenses to Forward Pharma’s intellectual property, including Forward Pharma’s intellectual property related to TECFIDERA. In exchange,
we paid Forward Pharma $1.25 billion in cash, of which $795 million was recognized as an intangible asset in the �rst quarter of 2017.
We have two intellectual property disputes with Forward
Pharma, one in the U.S. and one in the European Union, concerning intellectual property related to TECFIDERA.
1 On February 1, 2017, we completed the spin-off of our hemophilia business. Our consolidated results of operations re�ect the �nancial results of our hemophilia business through January 31, 2017.
2 Does not re�ect the reclassi�cation of amounts for 2016, 2015 and 2014 pursuant to the adoption of ASU No. 2016-09, Compensation - Stock Compensation (Topic 718): Improvements to Employee Share-Based Payment Accounting.
20B
ioge
n2
01
8 A
nnua
l R
epor
t
In March 2017 the U.S. intellectual property dispute was decided in our favor. Forward Pharma appealed to the U.S. Court of Appeals for the Federal Circuit. We evaluated the recoverability of the U.S. asset acquired from Forward Pharma and recorded a $328 million impairment charge in the �rst quarter of 2017 to adjust the carrying value of the acquired U.S. asset to fair value re�ecting the impact of the developments in the U.S. legal dispute and continued to amortize the remaining net book value of the U.S. intangible asset in our consolidated statements of income utilizing an economic consumption model. The U.S. Court of Appeals for the Federal Circuit upheld the U.S. Patent and Trademark Of�ce's March 2017 ruling and in January 2019 denied Forward Pharma's petition for rehearing. We evaluat-ed the recoverability of the U.S. asset based upon these most recent developments and recorded a $177 million impairment charge in the fourth quarter of 2018 to reduce the remaining net book value of the U.S. asset to zero.
In March 2018 the European Patent Of�ce (EPO) revoked Forward Pharma’s European Patent No. 2 801 355. Forward Pharma has �led an appeal to the Technical Boards of Appeal of the EPO and the appeal is pending. Based upon our assessment of this ruling, we continue to amortize the remaining net book value of the rest of world intangible asset in our consolidated statements of income utilizing an economic consumption model.
The TECFIDERA litigation settlement charge for 2016 represents the portion of the $1.25 billion cash payment made in the �rst quarter of 2017 attributable to our sales of TECFIDERA during the period April 2014 through December 31, 2016.
Amortization of acquired intangible assets for 2017 also includes a $31 million pre-tax impairment charge related to our acquired and in-licensed rights and patents intangible asset associated with ZINBRYTA after the initiation of an European Medicines Agency review (referred to as an Article 20 Procedure) of ZINBRYTA following the report of a case of fatal fulminant liver failure, as well as four cases of serious liver injury.
B Amortization of acquired intangible assets for 2018 includes the impact of impairment charges totaling $189 million related to certain in-process research and development (IPR&D) assets associated with our vixotrigine (BIIB074) program.
During the third quarter of 2018 we completed a Phase 2b study of vixotrigine for the treatment of painful lumbosacral radiculopathy (PLSR). The study did not meet its primary or secondary ef�cacy endpoints; therefore, we discontinued development of vixotrigine for the treatment of PLSR and we recognized an impairment charge of approximately $60 million during the third quarter of 2018 to reduce the fair value of the related IPR&D intangible asset to zero. In addition, we delayed the initiation of the Phase 3 studies of vixotrigine for the treatment of trigeminal neuralgia (TGN) as we awaited the outcome of ongoing interactions with
the FDA regarding the design of the Phase 3 studies, a more detailed review of the data from the Phase 2b study of vixotrigine for the treatment of PLSR and insights from the Phase 2 study of vixotrigine for the treatment of small fiber neuropathy. We reassessed the fair value of our vixotrigine program for the treatment of TGN using reduced expected lifetime revenues, higher expected clinical development costs and a lower cumulative probability of success and, as a result of that assessment, we recognized an impairment charge of $129 million during the third quarter of 2018 to reduce the fair value of the IPR&D intangible asset associated with our vixotrigine program for the treatment of TGN to $42 million.
C GAAP research and development expense for 2018 includes a $10 million contingent consideration payment accrued in relation to the acquisition of an asset.
D During the third quarter of 2018 we adjusted the fair value of our contingent consideration obligations related to our vixotrigine program for the treatment of TGN to re�ect the lower cumulative probabilities of success, which resulted in a gain of $90 million.
In late December 2018 we received feedback from the FDA regarding the design of the Phase 3 studies of vixotrigine for the treatment of TGN. Following this feedback, we are now planning to initiate the Phase 3 studies for our vixo-trigine program for the treatment of TGN and, as a result, we adjusted the fair value of our contingent consideration obligations related to our vixotrigine program for the treatment of TGN to re�ect the increased probabilities of success and recognized a loss of $81 million in the fourth quarter of 2018.
E In October 2017 we amended the terms of our collabora-tion and license agreement with Neurimmune SubOne AG (Neurimmune). Under the amended agreement, we made a $150 million payment to Neurimmune in exchange for a 15% reduction in the previously negotiated royalty rates payable on products developed under this agreement. In May 2018 we made an additional $50 million payment to Neurimmune to further reduce the previously negotiated royalty rates payable on products developed under this agreement by an additional 5%.
Net distribution to noncontrolling interest for 2018 re�ects the $50 million payment made to Neurimmune, net of Neurimmune’s tax, in May 2018.
Net distribution to noncontrolling interest for 2017 re�ects the $150 million payment made to Neurimmune, net of Neurimmune’s tax, in October 2017.
F 2017 corporate strategy implementation and restructuring charges are related to our efforts to create a leaner and simpler operating model.
Restructuring charges for 2016 include charges of $18 mil-lion incurred in connection with our 2016 restructuring
21
Bio
gen
201
8 A
nnua
l R
epor
t
resulting from our decision to spin-off our hemophilia business. Restructuring charges for 2016 also include severance charges of $7 million related to employee separation costs as a result of our decision to vacate and cease manufacturing in Cambridge, Mass. and vacate our warehouse in Somerville, Mass. Restructuring charges for 2016 further include $8 million of costs incurred in connection with our 2015 corporate restructuring.
Restructuring charges for 2015 re�ect $93 million of charges incurred in connection with our 2015 corporate restructuring.
G Cambridge manufacturing facility rationalization costs for 2016 re�ect $46 million of additional depreciation ex-pense included in cost of sales, excluding amortization of acquired intangible assets in our consolidated statements of income. Cambridge manufacturing facility rationalization costs for 2016 also includes charges of $7 million for the write-down of excess inventory.
H Elimination of deferred tax asset due to Samsung Bioepis Co., Ltd. qualifying as a corporate joint venture for accounting purposes.
I The Tax Cuts and Jobs Act of 2017 (2017 Tax Act) resulted in signi�cant changes to the U.S. corporate income tax system. These changes include a federal statutory rate reduction from 35% to 21%, the elimination or reduction of certain domestic deductions and credits and limitations on the deductibility of interest expense and executive compen-sation. The 2017 Tax Act also transitions international taxation from a worldwide system to a modi�ed territorial system and includes base erosion prevention measures on non-U.S. earnings, which has the effect of subjecting certain earnings of our foreign subsidiaries to U.S. taxation as global intangible low-taxed income (GILTI). During the fourth quarter of 2018 we elected to recognize deferred taxes for the basis differences expected to reverse as GILTI is incurred and have established initial deferred tax balances, as of the enactment date of the 2017 Tax Act.
During the fourth quarter of 2017 we recognized within our provision for income taxes a $1.2 billion provisional estimate pursuant to the U.S. Securities and Exchange Commission Staff Accounting Bulletin No. 118. Our provisional estimate included an amount of $990 million associated with a one-time mandatory deemed repatriation tax on accumulated foreign subsidiaries previously untaxed foreign earnings (the Transition Toll Tax) and $184 million related to the impact of remeasuring our deferred tax balances to re�ect the new federal statutory rate and other changes to U.S. tax law.
Tax reform amounts for 2018 re�ect the effect of a net reduction of $35 million to our 2017 preliminary Transition Toll Tax estimate, an expense of $13 million for the remea-surement of our deferred tax balances and an $11 million expense to re�ect other aspects of the 2017 Tax Act.
Tax reform amounts for 2018 also re�ect the effect of an expense of $136 million related to the establishment of GILTI deferred taxes.
The �nal determination of the Transition Toll Tax and remeasurement of our deferred assets and liabilities was completed in the fourth quarter of 2018.
J In June 2018 we closed a new ten-year exclusive agree-ment with Ionis Pharmaceuticals, Inc. (Ionis) to develop novel antisense oligonucleotide drug candidates for a broad range of neurological diseases for a total payment of $1 billion consisting of an upfront payment of $375 million and the purchase of approximately 11.5 million shares of Ionis' common stock at a cost of $625 million.
The 11.5 million shares of Ionis' common stock were purchased at a premium to their fair value at the transac-tion closing date. The premium consisted of acquiring the shares at a price above the fair value based on the trailing 10-day weighted-average close price prior to entering intothe agreement in April 2018 and the effect of certain hold-ing period restrictions. We recorded an asset of $463 mil-lion in investments and other assets in our consolidatedbalance sheets re�ecting the fair value of the commonstock as of the purchase date and a charge of $162 millionto research and development expense in our consolidatedstatements of income during the second quarter of 2018re�ecting the premium paid for the common stock.
NOTES: Our “Non-GAAP net income attributable to Biogen Inc.” and “Non-GAAP diluted earnings per share” �nancial measures exclude the following items from “GAAP net income attributable to Biogen Inc.” and “GAAP diluted earnings per share”: (1) purchase accounting, merger-related and other adjustments, (2) hemophilia business separation costs, (3) restructuring, business transformation and other cost saving initiatives, (4) (gain) loss on equity security investments, (5) stock option expense, (6) other select items and (7) their related tax effects. “Free Cash Flow” is de�ned as net cash �ows provided by operating activities less purchases of property, plant and equipment and contingent consideration related to our acquisition of Fumapharm AG as disclosed within our Annual Report on Form 10-K. We believe that the disclosure of these Non-GAAP �nancial measures provides additional insight into the ongoing economics of our business and re�ects how we manage our business internally, set operational goals and form the basis of our management incentive programs. These Non-GAAP financial measures are not in accordance with generally accepted accounting principles in the United States and should not be viewed in isolation or as a substitute for reported, or GAAP, net income attrib-utable to Biogen Inc., GA P diluted earnings per share and net cash flows provided by operating activities. Numbers may not foot due to rounding. Additional reconciliations of our Non-GAAP financial measures can be found in the Investors section of www.biogen.com.
HIGHLIGHTS & CONTENTS CEO LETTER STRATEGY CULTURE & ENGAGEMENT PRODUCTS & PIPELINE EXECUTIVE COMMITTEE
Safe Harbor
This Annual Report contains forward-looking statements, including statements made pursuant to the safe harbor provisions of the Private Securities Litigation Reform Act of 1995, relating to: our strategy and plans; potential of our commercial business and pipeline programs; capital allocation and investment strategy; clinical trials and data readouts and presentations; regulatory �lings and the timing thereof; risks and uncertainties associated with drug development and commercialization; the potential bene�ts, safety and ef�cacy of our products and investiga-tional therapies; the clinical development program for our investigational therapies; anticipated bene�ts and potential of investments, collaborations and business development activities; the potential bene�ts that may be achieved through our proposed acquisition of Nightstar Therapeutics; and the anticipated timing of our proposed acquisition of Nightstar Therapeutics. These forward-looking statements may be accompanied by such words as “aim,” “anticipate,” “believe,” “could,” “estimate,” “expect,” “forecast,” “goal,” “intend,” “may,” “plan,” “potential,” “possible,” “will,” “would” and other words and terms of similar meaning. Drug development and commercialization involve a high degree of risk, and only a small number of research and development programs result in commercialization of a product. Results in early stage clinical trials may not be indicative of full results or results from later stage or larger scale clinical trials and do not ensure regulatory approval. You should not place undue reliance on these statements or the scienti�c data presented.
These statements involve risks and uncertainties that could cause actual results to differ materially from those re�ected in such statements, including: our dependence on sales from our products; dif�culties in obtaining and maintaining adequate coverage, pricing and reimbursement for our products; failure to protect and enforce our data, intellectual property and other proprietary rights and the risks and uncertainties relating to intellectual property claims and challenges; uncertainty of long-term success in developing, licensing or acquiring other product candidates or addi-tional indications for existing products; failure to compete effectively due to signi�cant product competition in the markets for our products; failure to successfully execute or realize the anticipated bene�ts of our growth and strategic initiatives; risks relating to technology failures or breaches; the risk that positive results in a clinical trial may not be replicated in subsequent or con�rmatory trials or success in early stage clinical trials may not be predictive of results in later stage or large scale clinical trials or trials in other potential indications; risks associated with clinical trials, including our ability to adequately manage clinical activities, unexpected concerns that may arise from additional data or analysis obtained during clinical trials, regulatory authorities
may require additional information or further studies or may fail to approve or may delay approval of our drug candidates; the occurrence of adverse safety events, restrictions on use with our products or product liability claims; our dependence on collaborators and other third parties for the development, regulatory approval and commercialization of products and other aspects of our business, which are outside of our control; risks associated with current and potential future healthcare reforms; failure to comply with legal and regulato-ry requirements; the risks of doing business internationally, including currency exchange rate �uctuations; risks relating to management and key personnel changes, including attracting and retaining key personnel; risks relating to investment in our manufacturing capacity; problems with our manufacturing processes; risks related to commercialization of biosimilars; �uctuations in our effective tax rate; risks related to investment in properties; the market, interest and credit risks associated with our portfolio of marketable securities; risks relating to share repurchase programs; risks relating to access to capital and credit markets; risks related to indebtedness; environmental risks; risks relating to the sale and distribution by third parties of counterfeit or un�t versions of our products; risks relating to the use of social media for our business; change in control provisions in certain of our collaboration agreements; risks relating to the spin-off of our hemophilia business, including exposure to claims and liabilities; risks that our proposed acquisition of Nightstar Therapeutics will not be completed in a timely manner or at all; the possibility that certain closing conditions to our proposed acquisition of Nightstar Therapeutics will not be satis�ed; uncertainty as to whether the anticipated bene�ts of our proposed acquisition of Nightstar Therapeutics can be achieved; our ability to successfully integrate Nightstar Therapeutics’ operations and employees; and the other risks and uncertainties that are described in the Risk Factors section of our most recent annual or quarterly report and in other reports we have �led with the Securities and Exchange Commission.
These statements are based on our current beliefs and expectations and speak only as of April 22, 2019. We do not undertake any obligation to publicly update any forward-look-ing statements, except as required by law.
NOTE REGARDING TRADEMARKS: AVONEX®, BIOGEN®, PLEGRIDY®, SPINRAZA®, TECFIDERA®, TYSABRI® and ZINBRYTA® are registered trademarks of Biogen. BENEPALI™, FLIXABI™, FUMADERM™ and IMRALDI™ are trademarks of Biogen. ALPROLIX®, ELOCTATE®, FAMPYRA™, SkySTAR™ and other trademarks referenced in this Annual Report are the property of their respective owners.
22B
ioge
n2
01
8 A
nnua
l R
epor
t

23HIGHLIGHTS & CONTENTS CEO STATEMENT STRATEGY CULTURE & ENGAGEMENT PRODUCTS & PIPELINE EXECUTIVE COMMITEE
2018 FORM 10-K

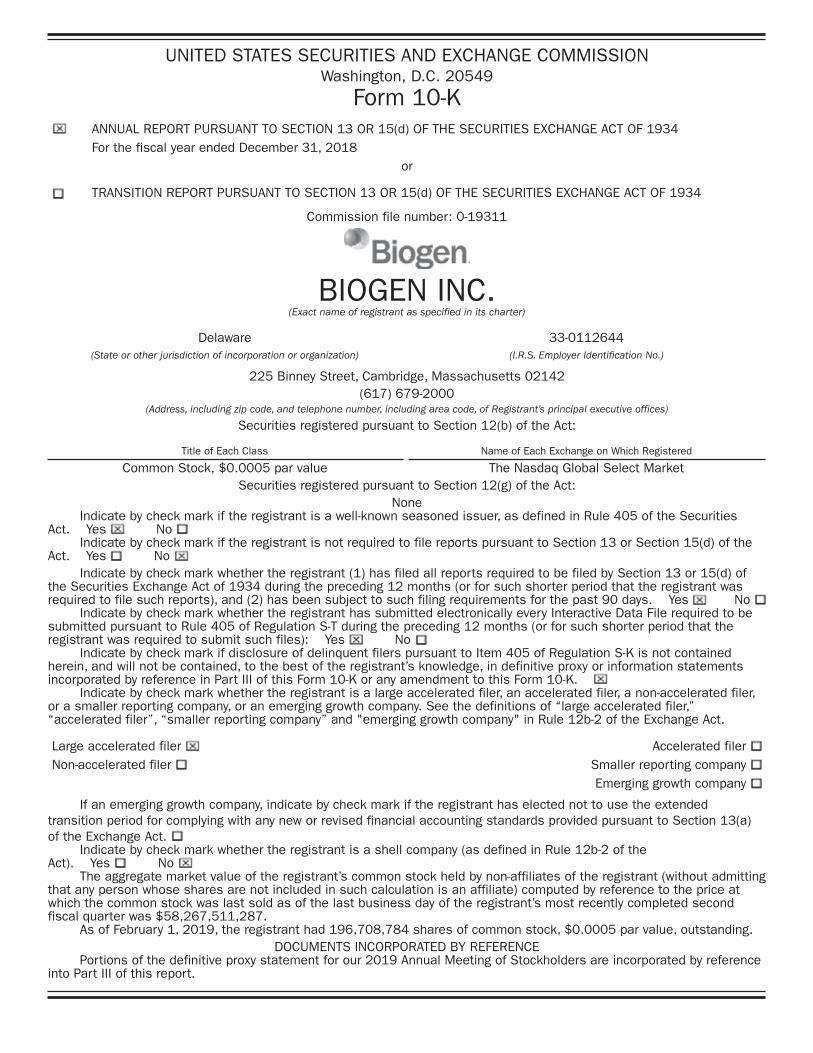
UNITED STATES SECURITIES AND EXCHANGE COMMISSIONWashington, D.C. 20549
Form 10-KANNUAL REPORT PURSUANT TO SECTION 13 OR 15(d) OF THE SECURITIES EXCHANGE ACT OF 1934For the fiscal year ended December 31, 2018
or
TRANSITION REPORT PURSUANT TO SECTION 13 OR 15(d) OF THE SECURITIES EXCHANGE ACT OF 1934
Commission file number: 0-19311
BIOGEN INC.(Exact name of registrant as specified in its charter)
Delaware 33-0112644(State or other jurisdiction of incorporation or organization) (I.R.S. Employer Identification No.)
225 Binney Street, Cambridge, Massachusetts 02142(617) 679-2000
(Address, including zip code, and telephone number, including area code, of Registrant’s principal executive offices)
Securities registered pursuant to Section 12(b) of the Act:
Title of Each Class Name of Each Exchange on Which Registered
Common Stock, $0.0005 par value The Nasdaq Global Select MarketSecurities registered pursuant to Section 12(g) of the Act:
NoneIndicate by check mark if the registrant is a well-known seasoned issuer, as defined in Rule 405 of the Securities
Act. Yes No Indicate by check mark if the registrant is not required to file reports pursuant to Section 13 or Section 15(d) of the
Act. Yes No Indicate by check mark whether the registrant (1) has filed all reports required to be filed by Section 13 or 15(d) of
the Securities Exchange Act of 1934 during the preceding 12 months (or for such shorter period that the registrant was required to file such reports), and (2) has been subject to such filing requirements for the past 90 days. Yes No
Indicate by check mark whether the registrant has submitted electronically every Interactive Data File required to be submitted pursuant to Rule 405 of Regulation S-T during the preceding 12 months (or for such shorter period that the registrant was required to submit such files): Yes No
Indicate by check mark if disclosure of delinquent filers pursuant to Item 405 of Regulation S-K is not contained herein, and will not be contained, to the best of the registrant’s knowledge, in definitive proxy or information statements incorporated by reference in Part III of this Form 10-K or any amendment to this Form 10-K.
Indicate by check mark whether the registrant is a large accelerated filer, an accelerated filer, a non-accelerated filer, or a smaller reporting company, or an emerging growth company. See the definitions of “large accelerated filer,” “accelerated filer”, “smaller reporting company” and "emerging growth company" in Rule 12b-2 of the Exchange Act.
Large accelerated filer Accelerated filer Non-accelerated filer Smaller reporting company
Emerging growth company
If an emerging growth company, indicate by check mark if the registrant has elected not to use the extended transition period for complying with any new or revised financial accounting standards provided pursuant to Section 13(a) of the Exchange Act.
Indicate by check mark whether the registrant is a shell company (as defined in Rule 12b-2 of the Act). Yes No
The aggregate market value of the registrant’s common stock held by non-affiliates of the registrant (without admitting that any person whose shares are not included in such calculation is an affiliate) computed by reference to the price at which the common stock was last sold as of the last business day of the registrant’s most recently completed second fiscal quarter was $58,267,511,287.
As of February 1, 2019, the registrant had 196,708,784 shares of common stock, $0.0005 par value, outstanding.DOCUMENTS INCORPORATED BY REFERENCE
Portions of the definitive proxy statement for our 2019 Annual Meeting of Stockholders are incorporated by reference into Part III of this report.
BIOGEN INC.ANNUAL REPORT ON FORM 10-K
For the Year Ended December 31, 2018TABLE OF CONTENTS
Page
PART IItem 1. Business
Item 1A. Risk Factors
Item 1B. Unresolved Staff Comments
Item 2. Properties
Item 3. Legal Proceedings
Item 4. Mine Safety Disclosures
PART IIItem 5. Market for Registrant’s Common Equity, Related Stockholder Matters and Issuer
Purchases of Equity Securities
Item 6. Selected Financial Data
Item 7. Management’s Discussion and Analysis of Financial Condition and Results of Operations
Item 7A. Quantitative and Qualitative Disclosures About Market Risk
Item 8. Financial Statements and Supplementary Data
Item 9. Changes in and Disagreements with Accountants on Accounting and Financial Disclosure
Item 9A. Controls and Procedures
Item 9B. Other Information
PART IIIItem 10. Directors, Executive Officers and Corporate Governance
Item 11. Executive Compensation
Item 12. Security Ownership of Certain Beneficial Owners and Management and Related Stockholder Matters
Item 13. Certain Relationships and Related Transactions, and Director Independence
Item 14. Principal Accountant Fees and Services
PART IVItem 15. Exhibits and Financial Statement Schedules
Item 16. Form 10-K Summary
Signatures
Consolidated Financial Statements
1
34
47
47
48
48
49
51
54
91
93
93
93
94
95
95
95
95
95
9696
100
F- 1
NOTE REGARDING FORWARD-LOOKING STATEMENTS This report contains forward-looking statements that are being made pursuant to the provisions of the Private
Securities Litigation Reform Act of 1995 (the Act) with the intention of obtaining the benefits of the “Safe Harbor” provisions of the Act. These forward-looking statements may be accompanied by such words as “aim,” “anticipate,” “believe,” “could,” “estimate,” “expect,” “forecast,” "goal," “intend,” “may,” “plan,” “potential,” “possible,” “will,” “would” and other words and terms of similar meaning. Reference is made in particular to forward-looking statements regarding:
• the anticipated amount, timing and accounting of revenues; contingent, milestone, royalty and other payments under licensing, collaboration or acquisition agreements; tax positions and contingencies; collectability of receivables; pre-approval inventory; cost of sales; research and development costs; compensation and other selling, general and administrative expenses; amortization of intangible assets; foreign currency exchange risk; estimated fair value of assets and liabilities; and impairment assessments;
• expectations, plans and prospects relating to sales, pricing, growth and launch of our marketed and pipeline products;
• the timing, outcome and impact of administrative, regulatory, legal and other proceedings related to our patents and other proprietary and intellectual property rights, tax audits, assessments and settlements, pricing matters, sales and promotional practices, product liability and other matters;
• patent terms, patent term extensions, patent office actions and expected availability and period of regulatory exclusivity;
• the potential impact of increased product competition in the markets in which we compete, including increased competition from generics, biosimilars, prodrugs and other products approved under alternative regulatory pathways;
• our plans and investments in our core and emerging growth areas, as well as implementation of our 2017 corporate strategy;
• the drivers for growing our business, including our plans and intent to commit resources relating to research and development programs and business development opportunities;
• our ability to finance our operations and business initiatives and obtain funding for such activities;
• the costs and timing of potential clinical trials, filings and approvals, and the potential therapeutic scope of the development and commercialization of our and our collaborators’ pipeline products;
• adverse safety events involving our marketed products or generic or biosimilar products marketed by others;
• the potential impact of healthcare reform in the United States (U.S.) and measures being taken worldwide designed to reduce healthcare costs and limit the overall level of government expenditures, including the impact of pricing actions and reduced reimbursement for our products;
• our manufacturing capacity, use of third-party contract manufacturing organizations and plans and timing relating to the expansion of our manufacturing capabilities, including anticipated investments and activities in new manufacturing facilities;
• the anticipated benefits and the potential costs and expenses related to our current or future initiatives to streamline our operations and reallocate resources;
• the impact of the continued uncertainty of the credit and economic conditions in certain countries in Europe and our collection of accounts receivable in such countries;
• the potential impact on our results of operations and liquidity of the United Kingdom's (U.K.) intent to voluntarily depart from the European Union (E.U.);
• lease commitments, purchase obligations and the timing and satisfaction of other contractual obligations;
• the impact of new laws, regulatory requirements, judicial decisions and accounting standards; and
• the anticipated costs and tax treatment of the spin-off of our hemophilia business as well as the timeline for selling substantially all remaining hemophilia related inventory.
These forward-looking statements involve risks and uncertainties, including those that are described in Item 1A. Risk Factors included in this report and elsewhere in this report that could cause actual results to differ materially from those reflected in such statements. You should not place undue reliance on these statements. Forward-looking statements speak only as of the date of this report. Except as required by law, we do not undertake any obligation to publicly update any forward-looking statements, whether as a result of new information, future developments or otherwise.
NOTE REGARDING COMPANY AND PRODUCT REFERENCESReferences in this report to:
• “Biogen,” the “company,” “we,” “us” and “our” refer to Biogen Inc. and its consolidated subsidiaries;
• “RITUXAN” refers to both RITUXAN (the trade name for rituximab in the U.S., Canada and Japan) and MabThera (the trade name for rituximab outside the U.S., Canada and Japan); and
• "ELOCTATE" refers to both ELOCTATE (the trade name for Antihemophilic Factor (recombinant), Fc Fusion Protein in the U.S., Canada and Japan) and ELOCTA (the trade name for Antihemophilic Factor (recombinant), Fc Fusion Protein in the E.U.).
NOTE REGARDING TRADEMARKSAVONEX®, PLEGRIDY®, RITUXAN®, RITUXAN HYCELA®, SPINRAZA®, TECFIDERA®, TYSABRI® and ZINBRYTA®
are registered trademarks of Biogen. BENEPALITM, FLIXABITM, FUMADERMTM and IMRALDITM are trademarks of Biogen. ALPROLIX®, ELOCTATE®, ENBREL®, FAMPYRATM, GAZYVA®, HUMIRA®, OCREVUS®, REMICADE® and other trademarks referenced in this report are the property of their respective owners.
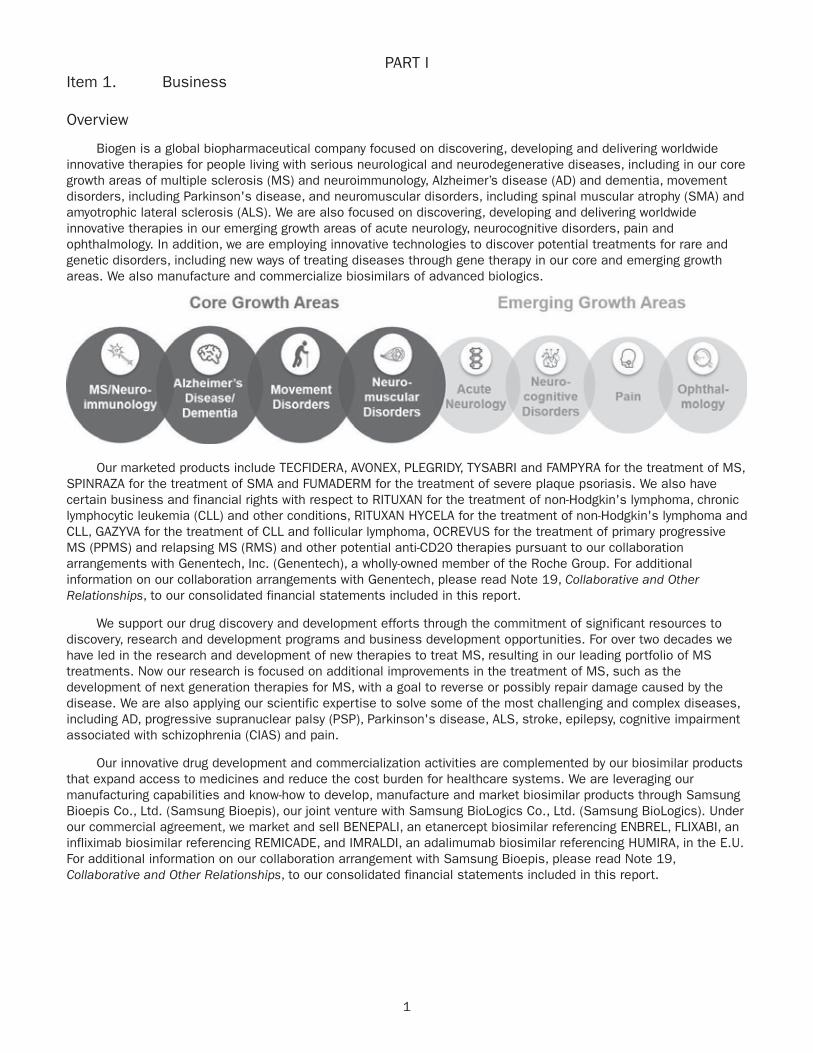
1
PART IItem 1. Business
Overview
Biogen is a global biopharmaceutical company focused on discovering, developing and delivering worldwide innovative therapies for people living with serious neurological and neurodegenerative diseases, including in our core growth areas of multiple sclerosis (MS) and neuroimmunology, Alzheimer’s disease (AD) and dementia, movement disorders, including Parkinson's disease, and neuromuscular disorders, including spinal muscular atrophy (SMA) and amyotrophic lateral sclerosis (ALS). We are also focused on discovering, developing and delivering worldwide innovative therapies in our emerging growth areas of acute neurology, neurocognitive disorders, pain and ophthalmology. In addition, we are employing innovative technologies to discover potential treatments for rare and genetic disorders, including new ways of treating diseases through gene therapy in our core and emerging growth areas. We also manufacture and commercialize biosimilars of advanced biologics.
Our marketed products include TECFIDERA, AVONEX, PLEGRIDY, TYSABRI and FAMPYRA for the treatment of MS, SPINRAZA for the treatment of SMA and FUMADERM for the treatment of severe plaque psoriasis. We also have certain business and financial rights with respect to RITUXAN for the treatment of non-Hodgkin's lymphoma, chronic lymphocytic leukemia (CLL) and other conditions, RITUXAN HYCELA for the treatment of non-Hodgkin's lymphoma and CLL, GAZYVA for the treatment of CLL and follicular lymphoma, OCREVUS for the treatment of primary progressive MS (PPMS) and relapsing MS (RMS) and other potential anti-CD20 therapies pursuant to our collaboration arrangements with Genentech, Inc. (Genentech), a wholly-owned member of the Roche Group. For additional information on our collaboration arrangements with Genentech, please read Note 19, Collaborative and Other Relationships, to our consolidated financial statements included in this report.
We support our drug discovery and development efforts through the commitment of significant resources to discovery, research and development programs and business development opportunities. For over two decades we have led in the research and development of new therapies to treat MS, resulting in our leading portfolio of MS treatments. Now our research is focused on additional improvements in the treatment of MS, such as the development of next generation therapies for MS, with a goal to reverse or possibly repair damage caused by the disease. We are also applying our scientific expertise to solve some of the most challenging and complex diseases, including AD, progressive supranuclear palsy (PSP), Parkinson's disease, ALS, stroke, epilepsy, cognitive impairment associated with schizophrenia (CIAS) and pain.
Our innovative drug development and commercialization activities are complemented by our biosimilar products that expand access to medicines and reduce the cost burden for healthcare systems. We are leveraging our manufacturing capabilities and know-how to develop, manufacture and market biosimilar products through Samsung Bioepis Co., Ltd. (Samsung Bioepis), our joint venture with Samsung BioLogics Co., Ltd. (Samsung BioLogics). Under our commercial agreement, we market and sell BENEPALI, an etanercept biosimilar referencing ENBREL, FLIXABI, an infliximab biosimilar referencing REMICADE, and IMRALDI, an adalimumab biosimilar referencing HUMIRA, in the E.U. For additional information on our collaboration arrangement with Samsung Bioepis, please read Note 19, Collaborative and Other Relationships, to our consolidated financial statements included in this report.

2
Key Business DevelopmentsThe following is a summary of key developments affecting our business since the beginning of 2018.
For additional information on our acquisitions, collaborative and other relationships discussed below, please read Note 2, Acquisitions, Note 19, Collaborative and Other Relationships, Note 20, Investments in Variable Interest Entities, and Note 27, Subsequent Events, to our consolidated financial statements included in this report.
Acquisitions, Collaborative and Other Relationships
BIIB100 Acquisition
In January 2018 we acquired BIIB100 (formerly known as KPT-350) from Karyopharm Therapeutics Inc. (Karyopharm). BIIB100 is a Phase 1 ready investigational oral compound for the treatment of certain neurological and neurodegenerative diseases, primarily in ALS. BIIB100 is a novel therapeutic candidate that works by inhibiting a protein known as XP01, with the goal of reducing inflammation and neurotoxicity, along with increasing neuroprotective responses.
BIIB104 Acquisition
In April 2018 we acquired BIIB104 (formerly known as PF-04958242) from Pfizer Inc. (Pfizer). BIIB104 is a first-in-class, Phase 2b ready AMPA receptor potentiator for CIAS, representing our first program in neurocognitive disorders. AMPA receptors mediate fast excitatory synaptic transmission in the central nervous system, a process which can be disrupted in a number of neurological and psychiatric diseases, including schizophrenia.
Neurimmune SubOne AG
In May 2018 we made a $50.0 million payment to Neurimmune SubOne AG (Neurimmune) under the terms of our amended collaboration and license agreement with Neurimmune (as amended, the Neurimmune Agreement) to reduce the previously negotiated royalty rates payable on products developed under the Neurimmune Agreement, including royalties payable on potential commercial sales of aducanumab, our anti-amyloid beta antibody candidate for the treatment of AD, by 5%. Our royalty rates payable on products developed under the Neurimmune Agreement, including royalties payable on potential commercial sales of aducanumab, will now range from the high single digits to sub-teens.
Ionis Pharmaceuticals, Inc.
In June 2018 we closed a 10-year exclusive agreement with Ionis Pharmaceuticals, Inc. (Ionis) to develop novel antisense oligonucleotide (ASO) drug candidates for a broad range of neurological diseases (the 2018 Ionis Agreement). We have the option to license therapies arising out of the 2018 Ionis Agreement and will be responsible for the development and potential commercialization of such therapies.
TMS Co., Ltd. Option Agreement
In June 2018 we entered into an exclusive option agreement with TMS Co., Ltd. (TMS) granting us the option to acquire TMS-007, a plasminogen activator with a novel mechanism of action (MOA) associated with breaking down blood clots, which is in Phase 2 development in Japan, and backup compounds for the treatment of stroke.
Samsung Bioepis
In June 2018 we exercised our option under our joint venture agreement with Samsung BioLogics to increase our ownership percentage in Samsung Bioepis from approximately 5% to approximately 49.9%. The share purchase transaction was completed in November 2018.
BIIB110 Acquisition
In July 2018 we acquired BIIB110 (formerly known as ALG-801) (Phase 1a) and ALG-802 (preclinical) from AliveGen Inc. (AliveGen). BIIB110 and ALG-802 represent novel ways of targeting the myostatin pathway. We initially plan to study BIIB110 in multiple neuromuscular indications, including SMA and ALS.
BIIB067 Option Exercise
In December 2018 we exercised our option with Ionis and obtained a worldwide, exclusive, royalty-bearing license to develop and commercialize BIIB067 (IONIS-SOD1Rx), an investigational treatment for ALS with superoxide dismutase 1 (SOD1) mutations.
C4 Therapeutics
In December 2018 we entered into a collaborative research and license agreement with C4 Therapeutics (C4T) to investigate the use of C4T’s novel protein degradation platform to discover and develop potential new treatments
3
for neurological diseases, such as AD and Parkinson’s disease. We will be responsible for the development and potential commercialization of any therapies resulting from this collaboration.
Skyhawk Therapeutics, Inc.
In January 2019 we entered into a collaboration and research and development services agreement with Skyhawk Therapeutics, Inc. (Skyhawk) pursuant to which the companies will leverage Skyhawk’s SkySTAR technology platform with the goal of discovering innovative small molecule treatments for patients with neurological diseases, including MS and SMA. We will be responsible for the development and potential commercialization of any therapies resulting from this collaboration.
Other Key Developments
ZINBRYTA Withdrawal
In March 2018 we and AbbVie Inc. (AbbVie) announced the voluntary worldwide withdrawal of ZINBRYTA for RMS.
IMRALDI
In October 2018 we began to recognize revenues on sales of IMRALDI, an adalimumab biosimilar referencing HUMIRA, to third parties in the E.U. We and Samsung Bioepis previously entered into an agreement with AbbVie for the commercialization of IMRALDI. Under the terms of the agreement, AbbVie granted us and Samsung Bioepis patent licenses for the use and sale of IMRALDI in Europe, on a country-by-country basis, and we make royalty payments to AbbVie on behalf of Samsung Bioepis.
2018 Share Repurchase Program
In August 2018 our Board of Directors authorized a program to repurchase up to $3.5 billion of our common stock (2018 Share Repurchase Program). Our 2018 Share Repurchase Program does not have an expiration date. All share repurchases under our 2018 Share Repurchase Program will be retired.
4
Product and Pipeline DevelopmentsCore Growth Areas
Multiple Sclerosis and Neuroimmunology
TECFIDERA (dimethyl fumarate)
• In April 2018 we presented new real-world data that demonstrated that people with RMS treated with TECFIDERA early in the course of their disease may experience better long-term outcomes. These data were presented at the 70th annual meeting of the American Academy of Neurology (AAN) in Los Angeles, CA.
• In October 2018 we presented clinical and real-world evidence that further support the long-term efficacy and well characterized safety of TECFIDERA early within the disease course. These data were presented at the 34th Congress of the European Committee for Treatment and Research in MS (ECTRIMS) in Berlin, Germany.
TYSABRI (natalizumab)
• In April 2018, at the 70th annual meeting of the AAN in Los Angeles, CA, we presented new real-world data that demonstrated that people with RMS treated with TYSABRI early in the course of their disease may experience better long-term outcomes.
• In April 2018 we presented observational data that demonstrated that extended interval dosing with TYSABRI is associated with a significant reduction in the risk of progressive multifocal leukoencephalopathy (PML), a serious brain injury, compared with standard interval dosing in the TOUCH prescribing program. These data were presented at the 70th annual meeting of the AAN in Los Angeles, CA. In November 2018 we initiated the Phase 3b NOVA study evaluating the efficacy and safety of extended interval dosing (every six weeks) for natalizumab compared to standard interval dosing in patients with RMS and enrolled the first patient in December 2018.
• In October 2018 we presented clinical and real-world evidence that further support the long-term efficacy and well characterized safety of TYSABRI early within the disease course. These data were presented at the 34th Congress of ECTRIMS in Berlin, Germany.
PLEGRIDY (peginterferon beta-1a)
• In December 2018 we dosed the first patient in a bioequivalence study to test whether exposure levels of PLEGRIDY are maintained with intramuscular administration.
ZINBRYTA (daclizumab)
• In March 2018 we and AbbVie announced the voluntary worldwide withdrawal of ZINBRYTA for RMS.
BIIB098 (formerly known as ALKS 8700) (diroximel fumarate; DRF)
• In April 2018 MRI and relapse results from the Phase 3 EVOLVE-MS-1 study for diroximel fumarate in patients with relapsing remitting MS (RRMS) were presented at the 70th annual meeting of the AAN in Los Angeles, CA.
• In December 2018 Alkermes Pharma Ireland Limited, a subsidiary of Alkermes plc (Alkermes), submitted a New Drug Application (NDA) to the U.S. Food and Drug Administration (FDA) for diroximel fumarate. Alkermes is seeking approval of diroximel fumarate under the 505(b)(2) regulatory pathway. If approved, we intend to market diroximel fumarate under the brand name VUMERITY. This name has been conditionally accepted by the FDA and will be confirmed upon approval.
Opicinumab (anti-LINGO)
• In September 2018 we completed enrollment of the Phase 2b AFFINITY study, evaluating opicinumab as an add-on therapy in MS patients who are adequately controlled on their anti-inflammatory disease-modifying therapy (DMT), versus the DMT alone.
5
Neuromuscular Disorders
SPINRAZA (nusinersen)
• In February 2018 the end of study results from CHERISH, the Phase 3 study evaluating SPINRAZA for the treatment of individuals with later-onset SMA, were published in The New England Journal of Medicine. Results from CHERISH demonstrated meaningful motor function and upper limb improvements in individuals with later-onset SMA rarely seen in the natural course of the disease, which is typically a continued decline in motor function over time.
• In March 2018 we presented new interim Phase 2 results from NURTURE, the ongoing open-label, single-arm study evaluating the efficacy and safety of SPINRAZA among pre-symptomatic infants with SMA. In NURTURE, all infants treated with SPINRAZA were alive, did not require permanent ventilation and showed improvement in motor function and motor milestone achievements as of July 5, 2017, compared to the disease's natural history. We also presented a case series demonstrating SPINRAZA's effectiveness among teens and young adults. These data were presented at the Muscular Dystrophy Association Clinical Conference in Arlington, VA.
• In April 2018 we presented data from the CS2/CS12 studies that demonstrated that with SPINRAZA treatment, older patients were able to walk longer distances while experiencing stable or less fatigue at the same time, in contrast to natural history. The study participants have Type 2 or Type 3 SMA and were ages 12 to 15 years at study enrollment.
We also presented data on part one of the Phase 2 EMBRACE study as well as an interim analysis of the SHINE open-label extension study, which examined the longer-term safety and efficacy of SPINRAZA in infantile-onset SMA patients.
These data were presented at the 70th annual meeting of the AAN in Los Angeles, CA.
• In June 2018 we presented data from our SPINRAZA clinical development program for SMA at the Cure SMA 2018 Annual SMA Conference in Dallas, TX. Platform and poster presentations highlighted interim analyses from the SHINE and NURTURE studies, which assess SPINRAZA's safety and efficacy among those with infantile-onset SMA, and data on the utility of plasma phosphorylated neurofilament heavy chain (pNF-H) as a potential biomarker for SMA.
• In October 2018 we presented new interim results from NURTURE, an ongoing open-label, single-arm efficacy and safety study of SPINRAZA in 25 presymptomatic infants with SMA at the Annual Congress of the World Muscle Society held in Mendoza, Argentina. As of May 2018 all NURTURE study participants were alive and none required permanent ventilation, in contrast to the natural history of SMA. In addition, 100% of study participants achieved the motor milestone of sitting independently, 88% were able to walk with assistance and 77% were able to walk independently. All NURTURE study participants were older than 15 months at the time of the analysis.
• In November 2018 we were awarded the 2018 International Prix Galien as Best Biotechnology Product for SPINRAZA. The prestigious honor marks the seventh Prix Galien for SPINRAZA, following country recognitions in the U.S., Germany, Italy, Belgium-Luxembourg, the Netherlands, and the U.K. The International Prix Galien is given every two years by Prix Galien International Committee members in recognition of excellence in scientific innovation to improve human health.
BIIB089 - SMA
• In May 2018 we submitted an Investigational New Drug Application for BIIB089 in SMA.
• In October 2018 we announced that the FDA had placed BIIB089 on a clinical hold.
BIIB078 (IONIS-C9Rx) - ALS
• In September 2018 we enrolled the first patient in the Phase 1 study evaluating BIIB078, an ASO drug candidate, in adults with C9ORF72-associated ALS.
BIIB067 (IONIS-SOD1Rx) - ALS
• In December 2018 we and Ionis announced results from a positive interim analysis of the ongoing Phase 1 study of BIIB067 in ALS with SOD1 mutations. The interim analysis showed that, over a three month period,
6
BIIB067 resulted in a statistically significant lowering of SOD1 protein levels in the cerebrospinal fluid and a numerical trend towards slowing of clinical decline as measured by the ALS Functional Rating Scale Revised, both compared to placebo.
Alzheimer's Disease and Dementia
Aducanumab (A mAb)
• In February 2018 we announced that, following a pre-planned blinded sample size review of the data per study protocol and based on variability in the primary endpoint that was greater than study protocol assumed, we increased the sample size of ENGAGE and EMERGE, the Phase 3 studies of aducanumab.
• In March 2018 we presented data from the long-term extension (LTE) of the Phase 1b PRIME study of aducanumab at the Advances in Alzheimer's and Parkinson's Therapies (AAT-AD/PD) Focus Meeting in Torino, Italy. The data presentation included the Centiloid scale, a method used to standardize the aducanumab Phase 1b PRIME study amyloid-PET (positron emission tomography) results as previously measured by the composite Standardized Uptake Value Ratio.
• In April 2018 we presented 36-month data and 24-month titration data from the Phase 1b PRIME study of aducanumab at the 70th annual meeting of the AAN in Los Angeles, CA.
• In July 2018 we completed enrollment of ENGAGE and EMERGE, the Phase 3 studies of aducanumab.
• In July 2018 we presented a new analysis from the Phase 1b PRIME study of aducanumab at the Alzheimer's Association International Conference (AAIC) 2018 in Chicago, IL. These data included a poster presentation on the 24-month analysis of APOE ?4 carriers in the Phase 1b PRIME study and a platform presentation on the 24-month clinical dementia rating scale analysis of the Phase 1b PRIME study.
• In August 2018 we and our collaboration partner Eisai Co., Ltd. (Eisai) announced results from a recent analysis of the ongoing LTE of the Phase 1b PRIME study of aducanumab. The updated analyses include data from the placebo-controlled period and LTE for patients treated with aducanumab up to 36 months in the titration cohort and up to 48 months in the fixed dose cohorts. The results are generally consistent with previous interim analyses, and there were no changes to the risk-benefit profile of aducanumab.
• In October 2018 we presented data on the efficacy of aducanumab and the cumulative safety data from the LTE of the Phase 1b PRIME study of patients with prodromal and mild Alzheimer's disease. These data were presented at the Clinical Trials on Alzheimer's Disease (CTAD) annual meeting in Barcelona, Spain. These results are generally consistent with previous interim analyses, and there were no changes to the risk-benefit profile of aducanumab.
• In November 2018 we initiated a Phase 2 study of aducanumab to assess the clinical relevance of asymptomatic amyloid related imaging abnormalities (ARIA). This Phase 2 study was not required by regulators and is not necessary for registration.
BAN2401 (A mAb)
• In December 2017 we and our collaboration partner Eisai announced that the Phase 2 study of BAN2401, a monoclonal antibody that targets amyloid beta aggregates, an Eisai product candidate for the treatment of AD, did not meet the criteria for success based on a Bayesian analysis at 12 months as the primary endpoint in an 856-patient Phase 2 clinical study, an endpoint that was designed to enable a potentially more rapid entry into Phase 3 development. In July 2018, based upon the final analysis of the data at 18 months, we and Eisai announced that the topline results from the Phase 2 study demonstrated a statistically significant slowing in clinical decline and reduction of amyloid beta accumulated in the brain. The study achieved statistical significance on key predefined endpoints evaluating efficacy at 18 months on slowing progression in Alzheimer’s Disease Composite Score (ADCOMS) and on reduction of amyloid accumulated in the brain as measured using amyloid-PET. In July 2018 Eisai presented this data in an oral session at AAIC 2018 in Chicago, IL.
• In October 2018 our collaboration partner Eisai presented clinical and biomarker updates from the Phase 2 study of BAN2401 at the CTAD annual meeting in Barcelona, Spain.
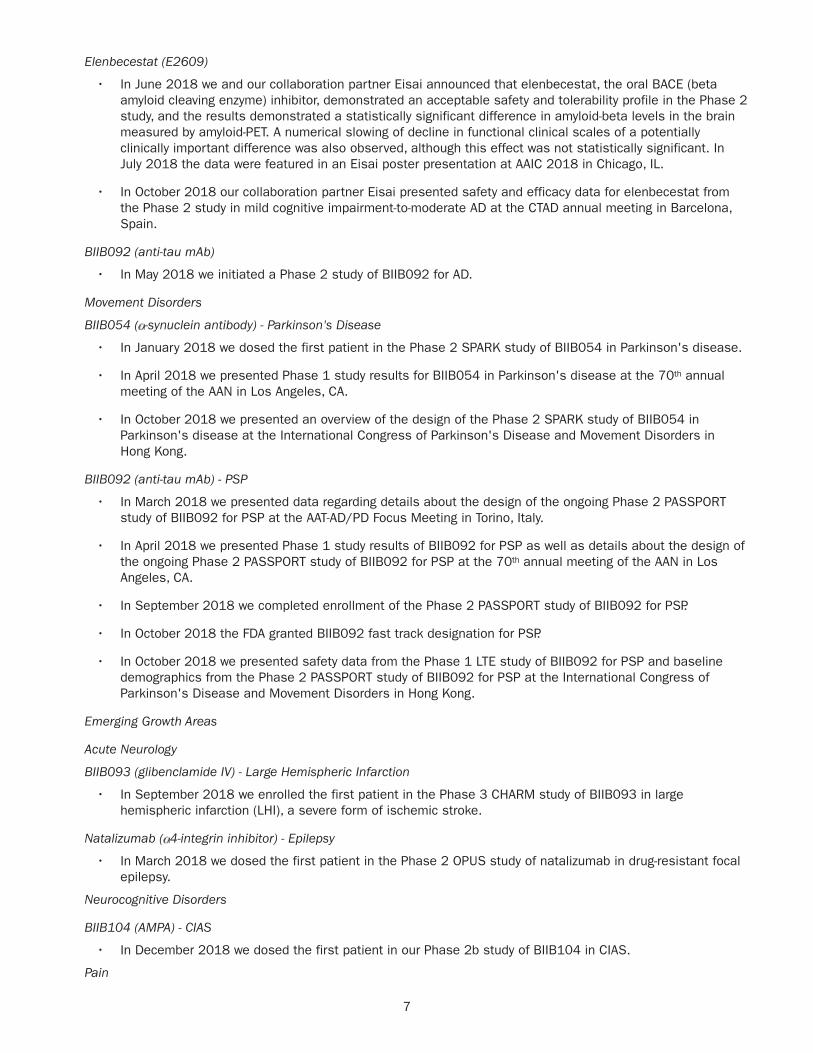
7
Elenbecestat (E2609)
• In June 2018 we and our collaboration partner Eisai announced that elenbecestat, the oral BACE (beta amyloid cleaving enzyme) inhibitor, demonstrated an acceptable safety and tolerability profile in the Phase 2 study, and the results demonstrated a statistically significant difference in amyloid-beta levels in the brain measured by amyloid-PET. A numerical slowing of decline in functional clinical scales of a potentially clinically important difference was also observed, although this effect was not statistically significant. In July 2018 the data were featured in an Eisai poster presentation at AAIC 2018 in Chicago, IL.
• In October 2018 our collaboration partner Eisai presented safety and efficacy data for elenbecestat from the Phase 2 study in mild cognitive impairment-to-moderate AD at the CTAD annual meeting in Barcelona, Spain.
BIIB092 (anti-tau mAb)
• In May 2018 we initiated a Phase 2 study of BIIB092 for AD.
Movement Disorders
BIIB054 ( -synuclein antibody) - Parkinson's Disease
• In January 2018 we dosed the first patient in the Phase 2 SPARK study of BIIB054 in Parkinson's disease.
• In April 2018 we presented Phase 1 study results for BIIB054 in Parkinson's disease at the 70th annual meeting of the AAN in Los Angeles, CA.
• In October 2018 we presented an overview of the design of the Phase 2 SPARK study of BIIB054 in Parkinson's disease at the International Congress of Parkinson's Disease and Movement Disorders in Hong Kong.
BIIB092 (anti-tau mAb) - PSP
• In March 2018 we presented data regarding details about the design of the ongoing Phase 2 PASSPORT study of BIIB092 for PSP at the AAT-AD/PD Focus Meeting in Torino, Italy.
• In April 2018 we presented Phase 1 study results of BIIB092 for PSP as well as details about the design of the ongoing Phase 2 PASSPORT study of BIIB092 for PSP at the 70th annual meeting of the AAN in Los Angeles, CA.
• In September 2018 we completed enrollment of the Phase 2 PASSPORT study of BIIB092 for PSP.
• In October 2018 the FDA granted BIIB092 fast track designation for PSP.
• In October 2018 we presented safety data from the Phase 1 LTE study of BIIB092 for PSP and baseline demographics from the Phase 2 PASSPORT study of BIIB092 for PSP at the International Congress of Parkinson's Disease and Movement Disorders in Hong Kong.
Emerging Growth Areas
Acute Neurology
BIIB093 (glibenclamide IV) - Large Hemispheric Infarction
• In September 2018 we enrolled the first patient in the Phase 3 CHARM study of BIIB093 in large hemispheric infarction (LHI), a severe form of ischemic stroke.
Natalizumab ( 4-integrin inhibitor) - Epilepsy
• In March 2018 we dosed the first patient in the Phase 2 OPUS study of natalizumab in drug-resistant focal epilepsy.
Neurocognitive Disorders
BIIB104 (AMPA) - CIAS
• In December 2018 we dosed the first patient in our Phase 2b study of BIIB104 in CIAS.
Pain
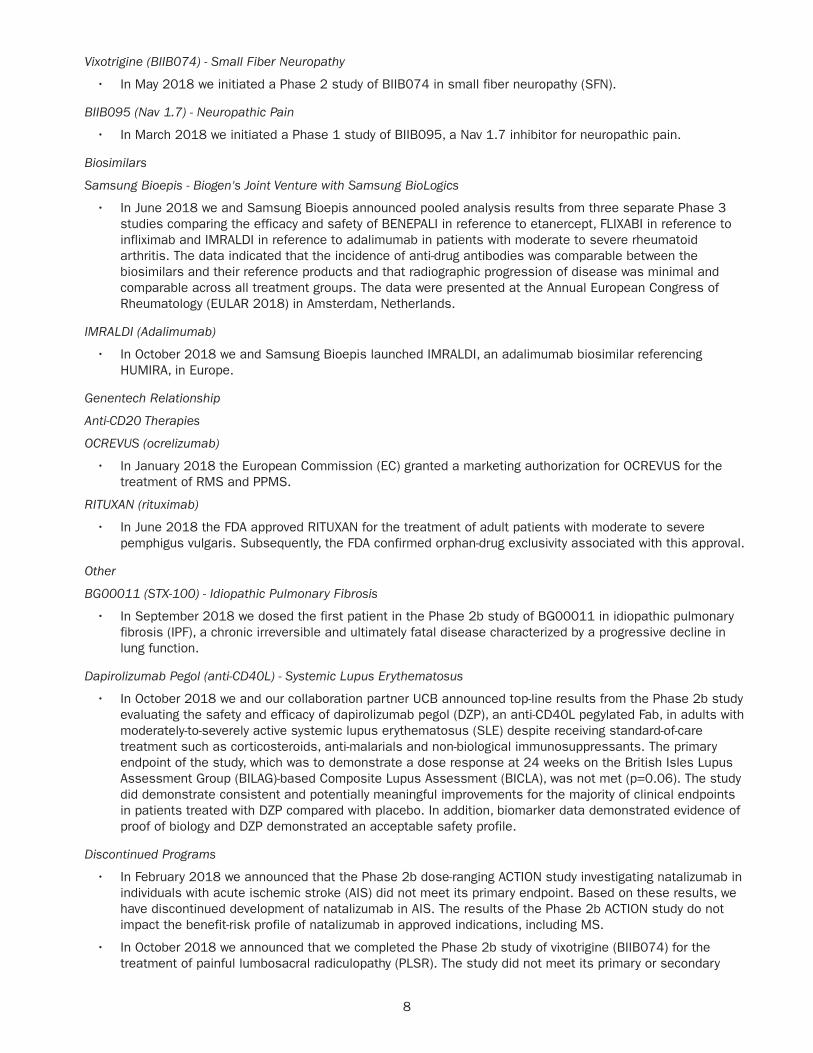
8
Vixotrigine (BIIB074) - Small Fiber Neuropathy
• In May 2018 we initiated a Phase 2 study of BIIB074 in small fiber neuropathy (SFN).
BIIB095 (Nav 1.7) - Neuropathic Pain
• In March 2018 we initiated a Phase 1 study of BIIB095, a Nav 1.7 inhibitor for neuropathic pain.
Biosimilars
Samsung Bioepis - Biogen's Joint Venture with Samsung BioLogics
• In June 2018 we and Samsung Bioepis announced pooled analysis results from three separate Phase 3 studies comparing the efficacy and safety of BENEPALI in reference to etanercept, FLIXABI in reference to infliximab and IMRALDI in reference to adalimumab in patients with moderate to severe rheumatoid arthritis. The data indicated that the incidence of anti-drug antibodies was comparable between the biosimilars and their reference products and that radiographic progression of disease was minimal and comparable across all treatment groups. The data were presented at the Annual European Congress of Rheumatology (EULAR 2018) in Amsterdam, Netherlands.
IMRALDI (Adalimumab)
• In October 2018 we and Samsung Bioepis launched IMRALDI, an adalimumab biosimilar referencing HUMIRA, in Europe.
Genentech Relationship
Anti-CD20 Therapies
OCREVUS (ocrelizumab)
• In January 2018 the European Commission (EC) granted a marketing authorization for OCREVUS for the treatment of RMS and PPMS.
RITUXAN (rituximab)
• In June 2018 the FDA approved RITUXAN for the treatment of adult patients with moderate to severe pemphigus vulgaris. Subsequently, the FDA confirmed orphan-drug exclusivity associated with this approval.
Other
BG00011 (STX-100) - Idiopathic Pulmonary Fibrosis
• In September 2018 we dosed the first patient in the Phase 2b study of BG00011 in idiopathic pulmonary fibrosis (IPF), a chronic irreversible and ultimately fatal disease characterized by a progressive decline in lung function.
Dapirolizumab Pegol (anti-CD40L) - Systemic Lupus Erythematosus
• In October 2018 we and our collaboration partner UCB announced top-line results from the Phase 2b study evaluating the safety and efficacy of dapirolizumab pegol (DZP), an anti-CD40L pegylated Fab, in adults with moderately-to-severely active systemic lupus erythematosus (SLE) despite receiving standard-of-care treatment such as corticosteroids, anti-malarials and non-biological immunosuppressants. The primary endpoint of the study, which was to demonstrate a dose response at 24 weeks on the British Isles Lupus Assessment Group (BILAG)-based Composite Lupus Assessment (BICLA), was not met (p=0.06). The study did demonstrate consistent and potentially meaningful improvements for the majority of clinical endpoints in patients treated with DZP compared with placebo. In addition, biomarker data demonstrated evidence of proof of biology and DZP demonstrated an acceptable safety profile.
Discontinued Programs
• In February 2018 we announced that the Phase 2b dose-ranging ACTION study investigating natalizumab in individuals with acute ischemic stroke (AIS) did not meet its primary endpoint. Based on these results, we have discontinued development of natalizumab in AIS. The results of the Phase 2b ACTION study do not impact the benefit-risk profile of natalizumab in approved indications, including MS.
• In October 2018 we announced that we completed the Phase 2b study of vixotrigine (BIIB074) for the treatment of painful lumbosacral radiculopathy (PLSR). The study did not meet its primary or secondary
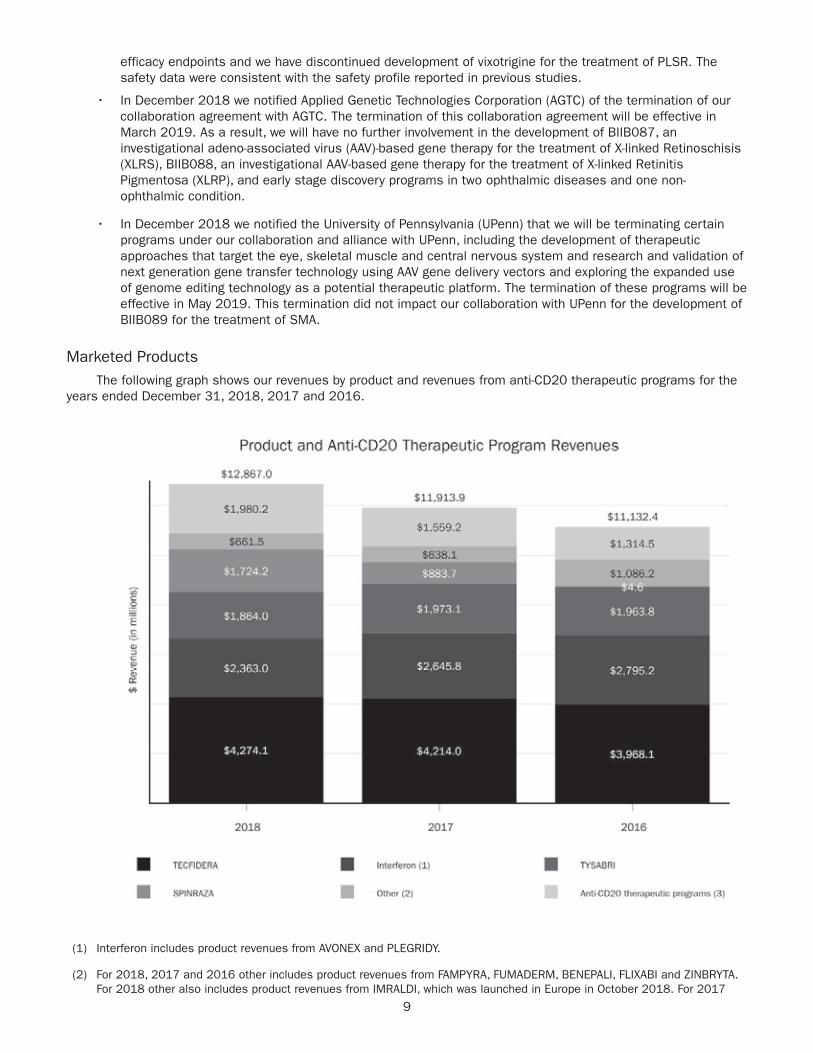
9
efficacy endpoints and we have discontinued development of vixotrigine for the treatment of PLSR. The safety data were consistent with the safety profile reported in previous studies.
• In December 2018 we notified Applied Genetic Technologies Corporation (AGTC) of the termination of our collaboration agreement with AGTC. The termination of this collaboration agreement will be effective in March 2019. As a result, we will have no further involvement in the development of BIIB087, an investigational adeno-associated virus (AAV)-based gene therapy for the treatment of X-linked Retinoschisis (XLRS), BIIB088, an investigational AAV-based gene therapy for the treatment of X-linked Retinitis Pigmentosa (XLRP), and early stage discovery programs in two ophthalmic diseases and one non-ophthalmic condition.
• In December 2018 we notified the University of Pennsylvania (UPenn) that we will be terminating certain programs under our collaboration and alliance with UPenn, including the development of therapeutic approaches that target the eye, skeletal muscle and central nervous system and research and validation of next generation gene transfer technology using AAV gene delivery vectors and exploring the expanded use of genome editing technology as a potential therapeutic platform. The termination of these programs will be effective in May 2019. This termination did not impact our collaboration with UPenn for the development of BIIB089 for the treatment of SMA.
Marketed ProductsThe following graph shows our revenues by product and revenues from anti-CD20 therapeutic programs for the
years ended December 31, 2018, 2017 and 2016.
(1) Interferon includes product revenues from AVONEX and PLEGRIDY.
(2) For 2018, 2017 and 2016 other includes product revenues from FAMPYRA, FUMADERM, BENEPALI, FLIXABI and ZINBRYTA. For 2018 other also includes product revenues from IMRALDI, which was launched in Europe in October 2018. For 2017
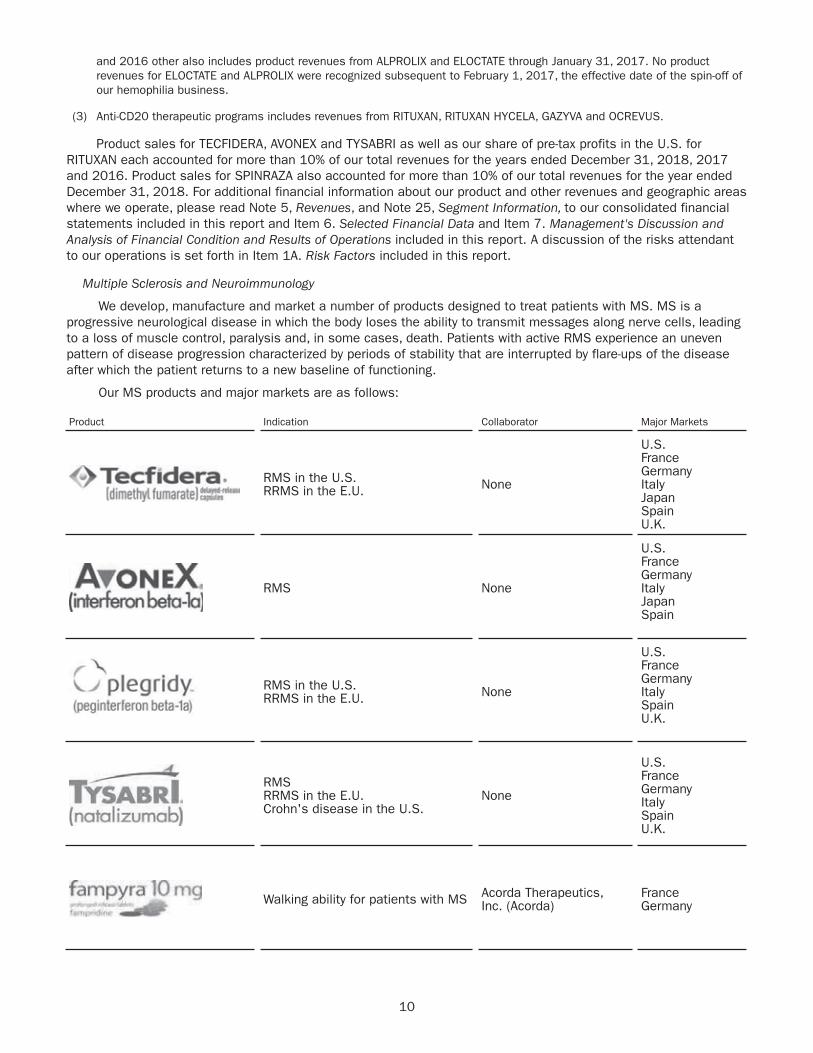
10
and 2016 other also includes product revenues from ALPROLIX and ELOCTATE through January 31, 2017. No product revenues for ELOCTATE and ALPROLIX were recognized subsequent to February 1, 2017, the effective date of the spin-off of our hemophilia business.
(3) Anti-CD20 therapeutic programs includes revenues from RITUXAN, RITUXAN HYCELA, GAZYVA and OCREVUS.
Product sales for TECFIDERA, AVONEX and TYSABRI as well as our share of pre-tax profits in the U.S. for RITUXAN each accounted for more than 10% of our total revenues for the years ended December 31, 2018, 2017 and 2016. Product sales for SPINRAZA also accounted for more than 10% of our total revenues for the year ended December 31, 2018. For additional financial information about our product and other revenues and geographic areas where we operate, please read Note 5, Revenues, and Note 25, Segment Information, to our consolidated financial statements included in this report and Item 6. Selected Financial Data and Item 7. Management's Discussion and Analysis of Financial Condition and Results of Operations included in this report. A discussion of the risks attendant to our operations is set forth in Item 1A. Risk Factors included in this report.
Multiple Sclerosis and Neuroimmunology
We develop, manufacture and market a number of products designed to treat patients with MS. MS is a progressive neurological disease in which the body loses the ability to transmit messages along nerve cells, leading to a loss of muscle control, paralysis and, in some cases, death. Patients with active RMS experience an uneven pattern of disease progression characterized by periods of stability that are interrupted by flare-ups of the disease after which the patient returns to a new baseline of functioning.
Our MS products and major markets are as follows:
Product Indication Collaborator Major Markets
RMS in the U.S.RRMS in the E.U. None
U.S.FranceGermanyItalyJapanSpainU.K.
RMS None
U.S.FranceGermanyItalyJapanSpain
RMS in the U.S.RRMS in the E.U. None
U.S.FranceGermanyItalySpainU.K.
RMSRRMS in the E.U.Crohn's disease in the U.S.
None
U.S.FranceGermanyItalySpainU.K.
Walking ability for patients with MS Acorda Therapeutics,Inc. (Acorda)
FranceGermany
11
Neuromuscular Disorders
SMA is characterized by loss of motor neurons in the spinal cord and lower brain stem, resulting in severe and progressive muscular atrophy and weakness. Ultimately, individuals with the most severe type of SMA can become paralyzed and have difficulty performing the basic functions of life, like breathing and swallowing. Due to a loss of, or defect in, the SMN1 gene, people with SMA do not produce enough survival motor neuron (SMN) protein, which is critical for the maintenance of motor neurons. The severity of SMA correlates with the amount of SMN protein. People with Type 1 SMA, the most severe life-threatening form, produce very little SMN protein and do not achieve the ability to sit without support or live beyond two years without respiratory support. People with Type 2 and Type 3 SMA produce greater amounts of SMN protein and have less severe, but still life-altering, forms of SMA.
Our SMA product and major markets are as follows:
Product Indication Collaborator Major Markets
SMA Ionis
U.S.BrazilFranceGermanyItalyJapanTurkey
Biosimilars
Biosimilars are a group of biologic medicines that are similar to currently available biologic therapies known as originators. Under our agreement with Samsung Bioepis, we manufacture and commercialize three anti-tumor necrosis factor (TNF) biosimilars in certain countries in the E.U.: BENEPALI, an etanercept biosimilar referencing ENBREL, FLIXABI, an infliximab biosimilar referencing REMICADE, and IMRALDI, an adalimumab biosimilar referencing HUMIRA.
Our biosimilar products and major markets are as follows:
Product Indication Major Markets
Moderate to severe rheumatoid arthritisProgressive psoriatic arthritisAxial spondyloarthritisModerate to severe plaque psoriasis
GermanyNorwaySwedenU.K
Rheumatoid arthritisModerate to severe Crohn's diseaseSevere ulcerative colitisSevere ankylosing spondylitisPsoriatic arthritisModerate to severe plaque psoriasis
FranceGermany
Rheumatoid arthritisAxial spondyloarthritisPsoriatic arthritisPsoriasisPaediatric plaque psoriasisHireadenitis suppurativaCrohn's diseasePaediatric Crohn's diseaseUlcerative colitisUveitis
Germany

12
Genentech Relationships
We have agreements with Genentech that entitle us to certain business and financial rights with respect to RITUXAN, RITUXAN HYCELA, GAZYVA, OCREVUS and other potential anti-CD20 therapies.
Our current anti-CD20 therapeutic programs and major markets are as follows:
Product Indication Major Markets
Non-Hodgkin's lymphomaCLLRheumatoid arthritisTwo forms of ANCA-associated vasculitisPemphigus vulgaris
U.S.Canada
Non-Hodgkin's lymphomaCLL U.S.
In combination with chlorambucil for previously untreated CLLFollicular lymphoma
In combination with chemotherapy followed by GAZYVA alone for previously untreated follicular lymphoma
U.S.
RMSPPMS
U.S.AustraliaGermanySwitzerland
For additional information on our collaboration arrangements with Genentech, please read Note 1, Summary of Significant Accounting Policies, and Note 19, Collaborative and Other Relationships, to our consolidated financial statements included in this report.
Other
Product Indication Collaborator Major Markets
Moderate to severe plaquepsoriasis None Germany
13
Patient Support and Access
We interact with patients, advocacy organizations and healthcare societies in order to gain insights into unmet needs. The insights gained from these engagements help us support patients with services, programs and applications that are designed to help patients lead better lives. Among other things, we provide customer service and other related programs for our products, such as disease and product specific websites, insurance research services, financial assistance programs and the facilitation of the procurement of our marketed products.
We are dedicated to helping patients obtain access to our therapies. Our patient representatives have access to a suite of financial assistance tools. With those tools, we help patients understand their insurance coverage and, if needed, help patients compare and select new insurance options and programs. In the U.S., we have established programs that provide co-pay assistance or free marketed product for qualified uninsured or underinsured patients, based on specific eligibility criteria. We also provide charitable contributions to independent charitable organizations that assist patients with out-of-pocket expenses associated with their therapy.
Marketing and DistributionSales Force and Marketing
We promote our products worldwide, including in the U.S., most of the major countries of the E.U. and Japan, primarily through our own sales forces and marketing groups. In some countries, particularly in areas where we continue to expand into new geographic areas, we partner with third parties.
We and Eisai co-promote AVONEX, TYSABRI and TECFIDERA in Japan in certain settings.
RITUXAN, RITUXAN HYCELA, GAZYVA and OCREVUS are marketed by the Roche Group and its sublicensees.
We co-promote BENEPALI, FLIXABI and IMRALDI with Samsung Bioepis in certain countries in the E.U.
We focus our sales and marketing efforts on specialist physicians in private practice or at major medical centers. We use customary industry practices to market our products and to educate physicians, such as sales representatives calling on individual physicians, advertisements, professional symposia, direct mail, public relations and other methods.
Distribution Arrangements
We distribute our products in the U.S. principally through wholesale distributors of pharmaceutical
products, mail order specialty distributors or shipping service providers. In other countries, the distribution of our products varies from country to country, including through wholesale distributors of pharmaceutical products and third-party distribution partners who are responsible for most marketing and distribution activities.
Eisai distributes AVONEX, TYSABRI, TECFIDERA and PLEGRIDY in India and other Asia-Pacific markets, excluding China.
RITUXAN, RITUXAN HYCELA, GAZYVA and OCREVUS are distributed by the Roche Group and its sublicensees.
We distribute BENEPALI, FLIXABI and IMRALDI in certain countries in the E.U.
Our product sales to two wholesale distributors, AmerisourceBergen and McKesson, each accounted for more than 10% of our total revenues for the years ended December 31, 2018, 2017 and 2016, and on a combined basis, accounted for approximately 50%, 56% and 57% of our gross product revenues for the years ended December 31, 2018, 2017 and 2016, respectively. For additional information, please read Note 5, Revenues, to our consolidated financial statements included in this report.
Patents and Other Proprietary RightsPatents are important to obtaining and
protecting exclusive rights in our products and product candidates. We regularly seek patent protection in the U.S. and in selected countries outside the U.S. for inventions originating from our research and development efforts. In addition, we license rights to various patents and patent applications.
U.S. patents, as well as most foreign patents, are generally effective for 20 years from the date the earliest application was filed; however, U.S. patents that issue on applications filed before June 8, 1995, may be effective until 17 years from the issue date, if that is later than the 20-year date. In some cases, the patent term may be extended to recapture a portion of the term lost during regulatory review of the claimed therapeutic or, in the case of the U.S., because of U.S. Patent and Trademark Office (USPTO) delays in prosecuting the application. Specifically, in the U.S., under the Drug Price Competition and Patent Term Restoration Act of 1984, commonly known as the Hatch-Waxman Act, a patent that covers a drug approved by the FDA may be eligible for patent term extension (for up to 5 years, but not beyond a total of 14 years from the date of product approval) as compensation for patent term lost during the FDA regulatory review process. The duration and extension of the term of foreign patents varies, in accordance

14
with local law. For example, supplementary protection certificates (SPCs) on some of our products have been granted in a number of European countries, compensating in part for delays in obtaining marketing approval.
Regulatory exclusivity, which may consist of regulatory data protection and market protection, also can provide meaningful protection for our products. Regulatory data protection provides to the holder of a drug or biologic marketing authorization, for a set period of time, the exclusive use of the proprietary pre-clinical and clinical data that it created at significant cost and submitted to the applicable regulatory authority to obtain approval of its product. After the applicable set period of time, third parties are then permitted to rely upon such data to file for approval of their abbreviated applications for, and to market (subject to any applicable market protection), their generic drugs and biosimilars referencing such data. Market protection provides to the holder of a drug or biologic marketing authorization the exclusive right to commercialize its product for a set period of time, thereby preventing the commercialization of another product containing the same active ingredient(s) during that period. Although the World Trade Organization's agreement on trade-related aspects of intellectual property rights (TRIPS) requires signatory countries to provide regulatory exclusivity to innovative pharmaceutical products, implementation and enforcement varies widely from country to country.
We also rely upon other forms of unpatented confidential information to remain competitive. We protect such information principally through confidentiality agreements with our employees, consultants, outside scientific collaborators,
scientists whose research we sponsor and other advisers. In the case of our employees, these agreements also provide, in compliance with relevant law, that inventions and other intellectual property conceived by such employees during their employment shall be our exclusive property.
Our trademarks are important to us and are generally covered by trademark applications or registrations in the USPTO and the patent or trademark offices of other countries. We also use trademarks licensed from third parties, such as the trademark FAMPYRA, which we license from Acorda. Trademark protection varies in accordance with local law, and continues in some countries as long as the trademark is used and in other countries as long as the trademark is registered. Trademark registrations generally are for fixed but renewable terms.
Our Patent Portfolio
The following table describes our patents in the U.S. and Europe that we currently consider of primary importance to our marketed products, including the territory, patent number, general subject matter and expected expiration dates. Except as otherwise noted, the expected expiration dates include any granted patent term extensions and issued SPCs. In some instances, there are later-expiring patents relating to our products directed to, among other things, particular forms or compositions, methods of manufacturing or use of the drug in the treatment of particular diseases or conditions. We also continue to pursue additional patents and patent term extensions in the U.S. and other territories covering various aspects of our products that may, if issued, extend exclusivity beyond the expiration of the patents listed in the table.
15
Product Territory Patent No. General Subject MatterPatent
Expiration(1)
TECFIDERA U.S. 7,619,001 Methods of treatment 2020U.S. 8,399,514 Methods of treatment 2028Europe 1131065 Formulations of dialkyl fumarates and their use for
treating autoimmune diseases2019(2)
Europe 2137537 Methods of use 2028(3)
AVONEX andPLEGRIDY
U.S. 7,588,755 Use of recombinant beta interferon forimmunomodulation
2026
PLEGRIDY U.S. 7,446,173 Polymer conjugates of interferon beta-1a 2022U.S. 8,524,660 Methods of treatment 2023U.S. 8,017,733 Polymer conjugates of interferon beta-1a 2027Europe 1656952 Polymer conjugates of interferon-beta-1a and uses
thereof2019
Europe 1476181 Polymer conjugates of interferon-beta-1a and usesthereof
2023(4)
TYSABRI U.S. 6,602,503 Humanized recombinant antibodies; nucleic acids andhost cells; processes for production; therapeuticcompositions; methods of use
2020
U.S. 7,807,167 Methods of treatment 2023U.S. 9,493,567 Methods of treatment 2027Europe 0804237 Humanized immunoglobulins; nucleic acids;
pharmaceutical compositions; medical uses2020(5)
Europe 1485127 Methods of use 2023FAMPYRA Europe 1732548 Sustained-release aminopyridine compositions for
increasing walking speed in patients with MS2025(6)
Europe 2377536 Sustained-release aminopyridine compositions fortreating MS
2025(7)
SPINRAZA U.S. 7,101,993 Oligonucleotides containing 2’-O-modified purines 2023U.S. 7,838,657 SMA treatment via targeting of SMN2 splice site
inhibitory sequences2027
U.S. 8,110,560 SMA treatment via targeting of SMN2 splice siteinhibitory sequences
2025
U.S. 8,361,977 Compositions and methods for modulation of SMN2splicing
2030
U.S. 8,980,853 Compositions and methods for modulation of SMN2splicing
2030
U.S. 9,717,750 Compositions and methods for modulation of SMN2splicing
2030
U.S. 9,926,559 Compositions and methods for modulation of SMN2splicing
2034
Europe 1910395 Compositions and methods for modulation of SMN2splicing
2026(8)
Europe 2548560 Compositions and methods for modulation of SMN2splicing
2026(9)
Europe 3305302 Compositions and methods for modulation of SMN2splicing
2030
Europe 3308788 Compositions and methods for modulation of SMN2splicing
2026
Footnotes follow on next page.
16
(1) In addition to patent protection, certain of our products are entitled to regulatory exclusivity in the U.S. and the E.U. expected until the dates set forth below:
Product Territory Expected Expiration
TECFIDERA U.S. 2018E.U. 2024
PLEGRIDY U.S. 2026E.U. 2024
FAMPYRA E.U. 2021SPINRAZA U.S. 2023
E.U. 2029
(2) This patent is subject to granted SPCs in certain European countries, which extended the patent term in those countries to 2024.
(3) This patent was revoked in a European opposition. This decision is being appealed. This patent is subject to granted SPCs in certain European countries, which extended the patent term in those countries to 2029.
(4) This patent is subject to granted SPCs in certain European countries, which extended the patent term in those countries to 2028.
(5) Reflects SPCs granted in most European countries and pediatric extension in some countries.
(6) This patent is subject to granted SPCs in certain European countries, which extended the patent term in those countries to 2026.
(7) This patent was revoked in a European opposition. This decision is being appealed. This patent is subject to granted SPCs in certain European countries, which extended the patent term in those countries to 2026.
(8) This patent is subject to granted SPCs in certain European countries, which extended the patent term in those countries to 2031.
(9) This patent is subject to granted SPCs in certain European countries, which extended the patent term in those countries to 2031.
The existence of patents does not guarantee our right to practice the patented technology or commercialize the patented product. Patents relating to pharmaceutical, biopharmaceutical and biotechnology products, compounds and processes, such as those that cover our existing products, compounds and processes and those that we will likely file in the future, do not always provide complete or adequate protection. Litigation, interferences, oppositions, inter partes reviews or other proceedings are, have been and may in the future be necessary in some instances to determine the validity and scope of certain of our patents, regulatory exclusivities or other proprietary rights, and in other instances to determine the validity, scope or non-infringement of certain patent rights claimed by third parties to be pertinent to the manufacture, use or sale of our products. We may also face challenges to our patents, regulatory exclusivities or other proprietary rights covering our products by manufacturers of generics, biosimilars, prodrugs and other products approved under alternative regulatory pathways. A discussion of certain risks and uncertainties that may affect our patent position, regulatory exclusivities or other proprietary rights is set forth in Item 1A. Risk Factors included in this report, and a discussion of legal proceedings related to certain patents described above is set forth in Note 21, Litigation, to our consolidated financial statements included in this report.
17
CompetitionCompetition in the biopharmaceutical industry is
intense and comes from many sources, including specialized biotechnology firms and large pharmaceutical companies. Many of our competitors are working to develop or have commercialized products similar to those we market or are developing and have considerable experience in undertaking clinical trials and in obtaining regulatory approval to market pharmaceutical products. Certain of these companies have substantially greater financial, marketing and research and development resources than we do.
We believe that competition and leadership in the industry is based on managerial and technological excellence and innovation as well as establishing patent and other proprietary positions through research and development. The achievement of a leadership position also depends largely upon our ability to maximize the approval, acceptance and use of products resulting from research and the availability of adequate financial resources to fund facilities, equipment, personnel, clinical testing, manufacturing and marketing. Another key aspect of remaining competitive within the industry is recruiting and retaining leading scientists and technicians. We believe that we have been successful in attracting and retaining skilled and experienced scientific personnel.
Competition among products approved for sale may be based, among other things, on patent position, product efficacy, safety, convenience/delivery devices, reliability, availability and price. In addition, early entry of a new pharmaceutical product into the market may have important advantages in gaining product acceptance and market share. Accordingly, the relative speed with which we can develop products, complete the testing and approval process and supply commercial quantities of products will have a significant impact on our competitive position.
The introduction of new products or technologies, including the development of new processes or technologies by competitors or new information about existing products or technologies, may result in increased competition for our marketed products or pricing pressure on our marketed products. It is also possible that the development of new or improved treatment options or standards of care or cures for the diseases our products treat could reduce or eliminate the use of our products or may limit the utility and application of ongoing clinical trials for our product candidates. We may also face increased competitive pressures as a result of generic versions, prodrugs of existing therapies, biosimilars of existing products, other products approved under alternative regulatory pathways or other technologies. If a generic, prodrug, biosimilar or
other product approved under alternative regulatory pathways of one of our products were approved, it could reduce our sales of that product.
Additional information about the competition that our marketed products face is set forth below.
Multiple Sclerosis
TECFIDERA, AVONEX, PLEGRIDY and TYSABRI each compete with one or more of the following products as well as generic and biosimilar versions of such products:
Competing Product Competitor
AUBAGIO (teriflunomide) Sanofi GenzymeBETASERON/BETAFERON(interferon-beta-1b)
Bayer Group
COPAXONE (glatiramer acetate)
Teva PharmaceuticalsIndustries Ltd.
EXTAVIA (interferon-beta-1b)
Novartis AG
GILENYA (fingolimod) Novartis AGGLATOPA (glatirameracetate)
Sandoz, a division ofNovartis AG
LEMTRADA(alemtuzumab)
Sanofi Genzyme
OCREVUS (ocrelizumab) GenentechREBIF (interferon-beta-1)
EMD Serono
FAMPYRA is indicated as a treatment to improve walking in adult patients with MS who a have walking disability and is the first treatment that addresses this unmet medical need with demonstrated efficacy in people with all types of MS. FAMPYRA is currently the only therapy approved to improve walking in patients with MS.
Competition in the MS market is intense. Along with us, a number of companies are working to develop additional treatments for MS that may in the future compete with our MS products. One such product that was approved in the U.S. in 2017 and in the E.U. in 2018 is OCREVUS, a treatment for RMS and PPMS that was developed by Genentech. While we have a financial interest in OCREVUS, future sales of our MS products may be adversely affected if OCREVUS continues to gain market share, or if other MS products that we or our competitors are developing are commercialized. Future sales may also be negatively impacted by the introduction of generics, prodrugs of existing therapeutics, biosimilars of existing products, other products approved under alternative regulatory pathways or other technologies.
Spinal Muscular Atrophy
SPINRAZA is the only approved treatment for SMA. We are aware of other products in development that, if successfully developed and approved, may

18
compete with SPINRAZA in the SMA market, including a potential gene therapy product for the treatment of SMA Type 1, which could come to market in the U.S. in 2019. Future sales of SPINRAZA may be adversely affected by the commercialization of competing products.
Psoriasis
FUMADERM competes with several different types of therapies in the psoriasis market within Germany, including oral systemics such as methotrexate and cyclosporine.
Biosimilars
BENEPALI, FLIXABI and IMRALDI, the three biosimilars we currently manufacture and commercialize in the E.U. for Samsung Bioepis, compete with their reference products, ENBREL, REMICADE and HUMIRA, respectively, as well as other biosimilars of those reference products.
Genentech Relationships in Other Indications
RITUXAN, RITUXAN HYCELA and GAZYVA in Oncology
RITUXAN, RITUXAN HYCELA and GAZYVA compete with a number of therapies in the oncology market, including TREANDA (bendamustine HCL), ARZERRA (ofatumumab), IMBRUVICA (ibrutinib) and ZYDELIG (idelalisib).
We also expect that over time RITUXAN HYCELA and GAZYVA will increasingly compete with RITUXAN in the oncology market. In addition, we are aware of anti-CD20 molecules, including biosimilars, in development that, if successfully developed and approved, may compete with RITUXAN, RITUXAN HYCELA and GAZYVA in the oncology market. In 2018 the FDA approved a rituximab biosimilar in the U.S. A biosimilar of RITUXAN could come to market in the U.S. in 2019, which may adversely affect the pre-tax profits of our collaboration arrangements with Genentech, which would, in turn adversely affect our co-promotion profits in the U.S. in future years.
RITUXAN in Rheumatoid Arthritis
RITUXAN competes with several different types of therapies in the rheumatoid arthritis market, including, among others, traditional disease-modifying anti-rheumatic drugs such as steroids, methotrexate and cyclosporine, TNF inhibitors, ORENCIA (abatacept), ACTEMRA (tocilizumab) and XELJANZ (tofacitinib).
We are also aware of other products, including biosimilars, in development that, if successfully developed and approved, may compete with RITUXAN in the rheumatoid arthritis market.
Research and Development ProgramsA commitment to research is fundamental to our
mission. Our research efforts are focused on better understanding the underlying biology of diseases so we can discover and deliver treatments that have the potential to make a real difference in the lives of patients with high unmet medical needs. By applying our expertise in biologics and our growing capabilities in small molecule, antisense, gene therapy, gene editing and other technologies, we target specific medical needs where we believe new or better treatments are needed.
We intend to continue committing significant resources to targeted research and development opportunities. As part of our ongoing research and development efforts, we have devoted significant resources to conducting clinical studies to advance the development of new pharmaceutical products and technologies and to explore the utility of our existing products in treating disorders beyond those currently approved in their labels.
For additional information on our research and development expense included in our consolidated statements of income, please read Item 7. Management's Discussion and Analysis of Financial Condition and Results of Operations included in this report.
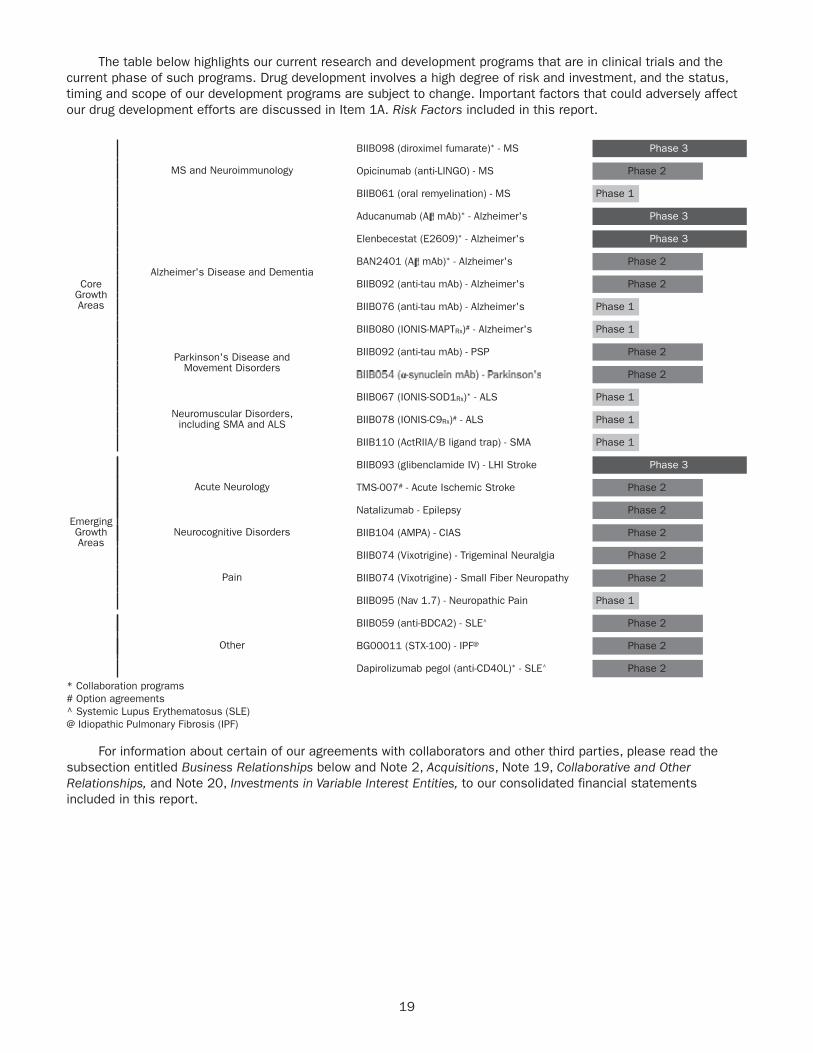
19
The table below highlights our current research and development programs that are in clinical trials and the current phase of such programs. Drug development involves a high degree of risk and investment, and the status, timing and scope of our development programs are subject to change. Important factors that could adversely affect our drug development efforts are discussed in Item 1A. Risk Factors included in this report.
CoreGrowthAreas
MS and Neuroimmunology
BIIB098 (diroximel fumarate)* - MS Phase 3
Opicinumab (anti-LINGO) - MS Phase 2
BIIB061 (oral remyelination) - MS Phase 1
Alzheimer's Disease and Dementia
Aducanumab (A mAb)* - Alzheimer's Phase 3
Elenbecestat (E2609)* - Alzheimer's Phase 3
BAN2401 (A mAb)* - Alzheimer's Phase 2
BIIB092 (anti-tau mAb) - Alzheimer's Phase 2
BIIB076 (anti-tau mAb) - Alzheimer's Phase 1
BIIB080 (IONIS-MAPTRx)# - Alzheimer's Phase 1
Parkinson's Disease and Movement Disorders
BIIB092 (anti-tau mAb) - PSP Phase 2
Phase 2
Neuromuscular Disorders, including SMA and ALS
BIIB067 (IONIS-SOD1Rx)* - ALS Phase 1
BIIB078 (IONIS-C9Rx)# - ALS Phase 1
BIIB110 (ActRIIA/B ligand trap) - SMA Phase 1
EmergingGrowthAreas
Acute Neurology
BIIB093 (glibenclamide IV) - LHI Stroke Phase 3
TMS-007# - Acute Ischemic Stroke Phase 2
Natalizumab - Epilepsy Phase 2
Neurocognitive Disorders BIIB104 (AMPA) - CIAS Phase 2
Pain
BIIB074 (Vixotrigine) - Trigeminal Neuralgia Phase 2
BIIB074 (Vixotrigine) - Small Fiber Neuropathy Phase 2
BIIB095 (Nav 1.7) - Neuropathic Pain Phase 1
Other
BIIB059 (anti-BDCA2) - SLE^ Phase 2
BG00011 (STX-100) - IPF@ Phase 2
Dapirolizumab pegol (anti-CD40L)* - SLE^ Phase 2
* Collaboration programs# Option agreements^ Systemic Lupus Erythematosus (SLE)@ Idiopathic Pulmonary Fibrosis (IPF)
For information about certain of our agreements with collaborators and other third parties, please read the subsection entitled Business Relationships below and Note 2, Acquisitions, Note 19, Collaborative and Other Relationships, and Note 20, Investments in Variable Interest Entities, to our consolidated financial statements included in this report.

20
Business RelationshipsAs part of our business strategy, we establish
business relationships, including joint ventures and collaborative arrangements with other companies, universities and medical research institutions, to assist in the clinical development and/or commercialization of certain of our products and product candidates and to provide support for our research programs. We also evaluate opportunities for acquiring products or rights to products and technologies that are complementary to our business from other companies, universities and medical research institutions.
Below is a brief description of certain business relationships and collaborations that expand our pipeline and provide us with certain rights to existing and potential new products and technologies. For additional information on certain of these relationships, including their ongoing financial and accounting impact on our business, please read Note 2, Acquisitions, Note 19, Collaborative and Other Relationships, Note 20, Investments in Variable Interest Entities, and Note 27, Subsequent Events, to our consolidated financial statements included in this report.
AbbVie, Inc.
We have a collaboration agreement with AbbVie for the development and commercialization of ZINBRYTA in MS, which was approved for the treatment of RMS in the U.S. in May 2016 and in the E.U. in July 2016. In March 2018 we and AbbVie announced the voluntary worldwide withdrawal of ZINBRYTA for RMS.
Under this agreement, we and AbbVie conducted ZINBRYTA co-promotion activities in the U.S., E.U. and Canadian territories, and we were responsible for all manufacturing and research and development activities.
Acorda Therapeutics, Inc.
We have a collaboration and license agreement with Acorda to develop and commercialize products containing fampridine, such as FAMPYRA, in markets outside the U.S. We are responsible for all regulatory activities and the future clinical development of related products in those markets.
Applied Genetic Technologies Corporation
In December 2018 we notified AGTC of the termination of our collaboration agreement with AGTC to develop gene-based therapies for multiple ophthalmic diseases. This collaboration focused on the development of BIIB087, an investigational AAV-based gene therapy for the treatment of XLRS, and BIIB088, an investigational AAV-based gene therapy
for the treatment of XLRP. This collaboration also provided us with options to early stage discovery programs in two ophthalmic diseases and one non-ophthalmic condition. The termination of this collaboration agreement will be effective in March 2019 and we will have no further involvement in the development of any of these programs.
Alkermes
We have an exclusive license and collaboration agreement with Alkermes to develop and commercialize diroximel fumarate (BIIB098), a novel oral fumarate in Phase 3 development for the treatment of RMS. Under this agreement, we received an exclusive, worldwide license to develop and commercialize diroximel fumarate. Alkermes will maintain responsibility for regulatory interactions with the FDA through the potential approval of the NDA for diroximel fumarate.
Bristol-Myers Squibb Company
We have an exclusive license agreement with Bristol-Myers Squibb Company (BMS) for the development and potential commercialization of BIIB092, a phase 2 investigational therapy with potential in AD and PSP. Under this agreement, we received worldwide rights to BIIB092 and are responsible for the full development and potential commercialization of BIIB092 in AD and PSP.
C4 Therapeutics
In December 2018 we entered into a collaborative research and license agreement with C4T to investigate the use of C4T’s novel protein degradation platform to discover and develop potential new treatments for neurological diseases, such as AD and Parkinson’s disease. We will be responsible for the development and potential commercialization of any therapies resulting from this collaboration.
Eisai Co., Ltd.
We have a collaboration agreement with Eisai to jointly develop and commercialize BAN2401 and elenbecestat, two Eisai product candidates for the treatment of AD. Eisai serves as the global operational and regulatory lead for BAN2401 and elenbecestat and all costs, including research, development, sales and marketing expenses, are shared equally between us and Eisai. Upon marketing approval in major markets, we and Eisai will co-promote BAN2401 and elenbecestat and share profits equally.
We also have a collaboration agreement with Eisai to jointly develop and commercialize aducanumab (the Aducanumab Collaboration Agreement). Under the Aducanumab Collaboration
21
Agreement, the two companies will co-promote aducanumab with a region-based profit split and we will continue to lead the ongoing Phase 3 development of aducanumab.
We and Eisai co-promote AVONEX, TYSABRI and TECFIDERA in Japan in certain settings and Eisai distributes AVONEX, TYSABRI, TECFIDERA and PLEGRIDY in India and other Asia-Pacific markets, excluding China.
Genentech, Inc. (Roche Group)
We have collaboration arrangements with Genentech which entitle us to certain business and financial rights with respect to RITUXAN, RITUXAN HYCELA, GAZYVA, OCREVUS and other potential anti-CD20 therapies.
Ionis Pharmaceuticals, Inc.
We have an exclusive, worldwide option and collaboration agreement with Ionis relating to the development and commercialization of up to three gene targets, and an exclusive, worldwide option and collaboration agreement with Ionis under which both companies are responsible for the development and commercialization of SPINRAZA for the treatment of SMA. We also have the 2018 Ionis Agreement, which is a 10-year exclusive collaboration agreement with Ionis to develop novel ASO drug candidates for a broad range of neurological diseases.
In addition, we have research collaboration agreements with Ionis, under which both companies perform discovery level research and will develop and commercialize new ASO drug candidates for the treatment of SMA and additional antisense and other therapeutics for the treatment of neurological diseases.
Neurimmune SubOne AG
We have a collaboration and license agreement with Neurimmune for the development and commercialization of antibodies for the treatment of AD, including aducanumab (as amended, the Neurimmune Agreement). Under the Neurimmune Agreement, we are responsible for the development, manufacturing and commercialization of all licensed products.
Samsung Bioepis Co., Ltd.
We and Samsung BioLogics established a joint venture, Samsung Bioepis, to develop, manufacture and market biosimilar products. We also have an agreement with Samsung Bioepis to commercialize, over a 10-year term, 3 anti-TNF biosimilar product candidates in Europe and, in the case of BENEPALI, Japan. Under this agreement, we are manufacturing and commercializing BENEPALI, an etanercept biosimilar referencing ENBREL, FLIXABI, an infliximab
biosimilar referencing REMICADE, and IMRALDI, an adalimumab biosimilar referencing HUMIRA.
In addition to our joint venture and commercialization agreements with Samsung Bioepis, we license certain of our proprietary technology to Samsung Bioepis in connection with Samsung Bioepis' development, manufacture and commercialization of its biosimilar products. We also provide technical development and technology transfer services to Samsung Bioepis and manufacture clinical and commercial quantities of bulk drug substance of Samsung Bioepis' biosimilar products.
Skyhawk Therapeutics, Inc.
In January 2019 we entered into a collaboration and research and development services arrangement with Skyhawk pursuant to which the companies will leverage Skyhawk’s SkySTAR technology platform with the goal of discovering innovative small molecule treatments for patients with neurological diseases, including MS and SMA. We will be responsible for the development and potential commercialization of any therapies resulting from this collaboration.
TMS Co., Ltd.
We have an exclusive option agreement with TMS granting us the option to acquire TMS-007 and backup compounds for the treatment of stroke.
University of Pennsylvania
We have a collaboration and alliance with UPenn to advance gene therapy and gene editing technologies.
In December 2018 we notified UPenn that we will be terminating certain programs under this collaboration, including the development of therapeutic approaches that target the eye, skeletal muscle and central nervous system and research and validation of next generation gene transfer technology using AAV gene delivery vectors and exploring the expanded use of genome editing technology as a potential therapeutic platform. The termination of these programs will be effective in May 2019. This termination did not impact our collaboration with UPenn for the development of BIIB089 for the treatment of SMA.
RegulatoryOur current and contemplated activities and the
products, technologies and processes that result from such activities are subject to substantial government regulation.
22
Regulation of Pharmaceuticals
Product Approval and Post-Approval Regulation in the U.S.
APPROVAL PROCESS
Before new pharmaceutical products may be sold in the U.S., preclinical studies and clinical trials of the products must be conducted and the results submitted to the FDA for approval. With limited exceptions, the FDA requires companies to register both pre-approval and post-approval clinical trials and disclose clinical trial results in public databases. Failure to register a trial or disclose study results within the required time periods could result in penalties, including civil monetary penalties. Clinical trial programs must establish efficacy, determine an appropriate dose and dosing regimen and define the conditions for safe use. This is a high-risk process that requires stepwise clinical studies in which the candidate product must successfully meet predetermined endpoints. The results of the preclinical and clinical testing of a product are then submitted to the FDA in the form of a Biologics License Application (BLA) or a NDA. In response to a BLA or NDA, the FDA may grant marketing approval, request additional information or deny the application if it determines the application does not provide an adequate basis for approval.
Product development and receipt of regulatory approval takes a number of years, involves the expenditure of substantial resources and depends on a number of factors, including the severity of the disease in question, the availability of alternative treatments, potential safety signals observed in preclinical or clinical tests and the risks and benefits of the product as demonstrated in clinical trials. The FDA has substantial discretion in the product approval process, and it is impossible to predict with any certainty whether and when the FDA will grant marketing approval. The agency may require the sponsor of a BLA or NDA to conduct additional clinical studies or to provide other scientific or technical information about the product, and these additional requirements may lead to unanticipated delays or expenses. Furthermore, even if a product is approved, the approval may be subject to limitations based on the FDA's interpretation of the existing pre-clinical or clinical data.
The FDA has developed four distinct approaches intended to make therapeutically important drugs available as rapidly as possible, especially when the drugs are the first available treatment or have advantages over existing treatments: accelerated approval, fast track, breakthrough therapy and priority review.
• Accelerated Approval: The FDA may grant “accelerated approval” status to products that treat serious or life-threatening illnesses and that provide meaningful therapeutic benefits to patients over existing treatments. Under this pathway, the FDA may approve a product based on surrogate endpoints, or clinical endpoints other than survival or irreversible morbidity. When approval is based on surrogate endpoints or clinical endpoints other than survival or morbidity, the sponsor will be required to conduct additional post-approval clinical studies to verify and describe clinical benefit. Under the FDA's accelerated approval regulations, if the FDA concludes that a drug that has been shown to be effective can be safely used only if distribution or use is restricted, it may require certain post-marketing restrictions to assure safe use. In addition, for products approved under accelerated approval, sponsors may be required to submit all copies of their promotional materials, including advertisements, to the FDA at least 30 days prior to initial dissemination. The FDA may withdraw approval under accelerated approval after a hearing if, for instance, post-marketing studies fail to verify any clinical benefit, it becomes clear that restrictions on the distribution of the product are inadequate to ensure its safe use, or if a sponsor fails to comply with the conditions of the accelerated approval.
• Fast Track: The FDA may grant "fast track" status to products that treat a serious condition and have data demonstrating the potential to address an unmet medical need or a drug that has been designated as a qualified infectious disease product.
• Breakthrough Therapy: The FDA may grant “breakthrough therapy” status to drugs designed to treat, alone or in combination with another drug or drugs, a serious or life-threatening disease or condition and for which preliminary clinical evidence suggests a substantial improvement over existing therapies. Such drugs need not address an unmet need, but are nevertheless eligible for expedited review if they offer the potential for an improvement. Breakthrough therapy status entitles the sponsor to earlier and more frequent meetings with the FDA regarding the development of nonclinical and clinical data and permits the FDA to offer product development or regulatory advice for the purpose of shortening the time to product approval. Breakthrough therapy status does not guarantee that a product will be reviewed more quickly and does not ensure FDA approval.
23
• Priority Review: “Priority review” only applies to applications (original or efficacy supplement) for a drug that treats a serious condition and, if approved, would provide a significant improvement in safety or effectiveness of the treatment, diagnosis or prevention of a serious condition when compared to standard applications. Priority review may also be granted for any supplement that proposes a labeling change due to studies completed in response to a written request from the FDA for pediatric studies, for an application for a drug that has been designated as a qualified infectious disease product or for any application or supplement for a drug submitted with a priority review voucher.
In December 2016 the FDA issued us a rare pediatric disease priority review voucher in connection with the approval of SPINRAZA.
POST-MARKETING STUDIES
Regardless of the approval pathway employed, the FDA may require a sponsor to conduct additional post-marketing studies as a condition of approval to provide data on safety and effectiveness. If a sponsor fails to conduct the required studies, the FDA may withdraw its approval. In addition, if the FDA concludes that a drug that has been shown to be effective can be safely used only if distribution or use is restricted, it can mandate post-marketing restrictions to assure safe use. In such a case, the sponsor may be required to establish rigorous systems to assure use of the product under safe conditions. These systems are usually referred to as Risk Evaluation and Mitigation Strategies (REMS). The FDA can impose financial penalties for failing to comply with certain post-marketing commitments, including REMS. In addition, any changes to an approved REMS must be reviewed and approved by the FDA prior to implementation.
ADVERSE EVENT REPORTING
We monitor information on side effects and adverse events reported during clinical studies and after marketing approval and report such information and events to regulatory agencies. Non-compliance with the FDA's safety reporting requirements may result in civil or criminal penalties. Side effects or adverse events that are reported during clinical trials can delay, impede or prevent marketing approval. Based on new safety information that emerges after approval, the FDA can mandate product labeling changes, impose a new REMS or the addition of elements to an existing REMS, require new post-marketing studies (including additional clinical trials) or suspend or withdraw approval of the product. These requirements may affect our ability to maintain marketing approval of our products or require us to
make significant expenditures to obtain or maintain such approvals.
APPROVAL OF CHANGES TO AN APPROVED PRODUCT
If we seek to make certain types of changes to an approved product, such as adding a new indication, making certain manufacturing changes or changing manufacturers or suppliers of certain ingredients or components, the FDA will need to review and approve such changes in advance. In the case of a new indication, we are required to demonstrate with additional clinical data that the product is safe and effective for a use other than what was initially approved. FDA regulatory review may result in denial or modification of the planned changes, or requirements to conduct additional tests or evaluations that can substantially delay or increase the cost of the planned changes.
REGULATION OF PRODUCT ADVERTISING AND PROMOTION
The FDA regulates all advertising and promotion activities and communications for products under its jurisdiction both before and after approval. Pursuant to FDA guidance, a company can make safety and efficacy claims from data either in or consistent with the label. However, physicians may prescribe legally available drugs for uses that are not described in the drug's labeling. Such off-label uses are common across medical specialties, and often reflect a physician's belief that the off-label use is the best treatment for patients. The FDA does not regulate the behavior of physicians in their choice of treatments, but FDA regulations do impose stringent restrictions on manufacturers' communications regarding off-label uses. Failure to comply with applicable FDA requirements may subject a company to adverse publicity, enforcement action by the FDA, corrective advertising and the full range of civil and criminal penalties available to the government.
Regulation of Combination Products
Combination products are defined by the FDA to include products comprising two or more regulated components (e.g., a biologic and a device). Biologics and devices each have their own regulatory requirements, and combination products may have additional requirements. Some of our marketed products meet this definition and are regulated under this framework and similar regulations outside the U.S., and we expect that some of our pipeline product candidates may be evaluated for regulatory approval under this framework as well.
24
Product Approval and Post-Approval Regulation Outside the U.S.
We market our products in numerous jurisdictions outside the U.S. Most of these jurisdictions have product approval and post-approval regulatory processes that are similar in principle to those in the U.S. In Europe, for example, where a substantial part of our ex-U.S. efforts are focused, there are several tracks for marketing approval, depending on the type of product for which approval is sought. Under the centralized procedure, a company submits a single application to the European Medicines Agency (EMA). The marketing authorization application is similar to the NDA or BLA in the U.S. and is evaluated by the Committee for Medicinal Products for Human Use (CHMP), the expert scientific committee of the EMA responsible for human medicines. If the CHMP determines that the marketing authorization application fulfills the requirements for quality, safety and efficacy and that the medicine has a positive benefit risk balance, it will adopt a positive opinion recommending the granting of the marketing authorization by the EC. The CHMP opinion is not binding, but is typically adopted by the EC. A marketing application approved by the EC is valid in all member states of the E.U. The centralized procedure is required for all biological products, orphan medicinal products and new treatments for neurodegenerative disorders, and it is available for certain other products, including those which constitute a significant therapeutic, scientific or technical innovation.
In addition to the centralized procedure, the European regulatory framework includes the following options for regulatory review and approval in E.U. member states:
• a national procedure, which requires an application to the competent authority of an E.U. country (if an application is to be made in more than one E.U. country, following approval in the first country, the applicant must submit applications in the other countries using the mutual recognition procedure);
• a decentralized procedure, whereby applicants submit identical applications to several countries and receive simultaneous approval, if the medicine has not yet been authorized in any E.U. country; and
• a mutual recognition procedure, where applicants that have a medicine authorized in one E.U. country can apply for mutual recognition of this authorization in other E.U. countries.
As in the U.S., the E.U. also has distinct approaches intended to optimize the regulatory pathways for therapeutically important drugs,
including the Priority Medicines Evaluation Scheme (PRIME), accelerated assessment and conditional authorization. PRIME is intended to provide additional support to medicine developers throughout the development process. Regulatory review timelines in the E.U. may be truncated under accelerated assessment for products that address an unmet medical need. In addition, conditional authorizations may be granted for such products in the interest of public health, where the benefit of immediate availability outweighs the risk of less comprehensive data than normally required. Conditional authorizations are valid for one year and can be renewed annually. The marketing authorization holder is required to complete specific obligations (ongoing or new studies and, in some cases, additional activities) with a view to providing comprehensive data confirming that the benefit risk balance is positive. Once comprehensive data on the product have been obtained, the marketing authorization may be converted into a standard marketing authorization.
In the E.U. there is detailed legislation on pharmacovigilance and extensive guidance on good pharmacovigilance practices. A failure to comply with the E.U. pharmacovigilance obligations may result in significant financial penalties.
Regardless of the approval process employed, various parties share responsibilities for the monitoring, detection and evaluation of adverse events post-approval, including national competent authorities, the EMA, the EC and the marketing authorization holder. The EMA’s Pharmacovigilance Risk Assessment Committee is responsible for assessing and monitoring the safety of human medicines and makes recommendations on product safety issues. Marketing authorization holders have an obligation to inform regulatory agencies of any new information which may influence the evaluation of benefits and risks of the medicinal product concerned. In the U.S., E.U. and other jurisdictions, regulatory agencies, including the FDA, conduct periodic inspections of NDA and BLA holders to assess their compliance with pharmacovigilance obligations.
In some regions, it is possible to receive an “accelerated” review whereby the national regulatory authority will commit to truncated review timelines for products that meet specific medical needs.
Good Manufacturing Practices
Regulatory agencies regulate and inspect equipment, facilities and processes used in the manufacturing and testing of pharmaceutical and biologic products prior to approving a product. If, after receiving approval from regulatory agencies, a company makes a material change in manufacturing
25
equipment, location or process, additional regulatory review and approval may be required. We also must adhere to current Good Manufacturing Practices (cGMP) and product-specific regulations enforced by regulatory agencies following product approval. The FDA, the EMA and other regulatory agencies also conduct periodic visits to re-inspect equipment, facilities and processes following the initial approval of a product. If, as a result of these inspections, it is determined that our equipment, facilities or processes do not comply with applicable regulations and conditions of product approval, regulatory agencies may seek civil, criminal or administrative sanctions or remedies against us, including significant financial penalties and the suspension of our manufacturing operations.
Good Clinical Practices
The FDA, the EMA and other regulatory agencies promulgate regulations and standards for designing, conducting, monitoring, auditing and reporting the results of clinical trials to ensure that the data and results are accurate and that the rights and welfare of trial participants are adequately protected (commonly referred to as current Good Clinical Practices (cGCP)). Regulatory agencies enforce cGCP through periodic inspections of trial sponsors, principal investigators and trial sites, contract research organizations (CROs) and institutional review boards. If our studies fail to comply with applicable cGCP guidelines, the clinical data generated in our clinical trials may be deemed unreliable and relevant regulatory agencies may require us to perform additional clinical trials before approving our marketing applications. Noncompliance can also result in civil or criminal sanctions. We rely on third parties, including CROs, to carry out many of our clinical trial-related activities. Failure of such third parties to comply with cGCP can likewise result in rejection of our clinical trial data or other sanctions.
In April 2014 the EC adopted a new Clinical Trial Regulation, which was effective in June 2014 but is not expected to apply until early 2020. The regulation harmonizes the procedures for assessment and governance of clinical trials throughout the E.U. and will require that information on the authorization, conduct and results of each clinical trial conducted in the E.U. be publicly available.
Approval of Biosimilars
The Patient Protection and Affordable Care Act (PPACA) amended the Public Health Service Act (PHSA) to authorize the FDA to approve biological products, referred to as biosimilars or follow-on biologics that are shown to be highly similar to previously approved biological products based upon potentially abbreviated data packages. The biosimilar must show it has no clinically meaningful differences
in terms of safety and effectiveness from the reference product, and only minor differences in clinically inactive components are allowable in biosimilars products. The approval pathway for biosimilars does, however, grant a biologics manufacturer a 12-year period of exclusivity from the date of approval of its biological product before biosimilar competition can be introduced. There is uncertainty, however, as the approval framework for biosimilars originally was enacted as part of the PPACA. There have been, and there are likely to continue to be, federal legislative and administrative efforts to repeal, substantially modify or invalidate some or all of the provisions of the PPACA. If the PPACA is repealed, substantially modified or invalidated, it is unclear what, if any, impact such action would have on biosimilar regulation.
A biosimilars approval pathway has been in place in the E.U. since 2003. The EMA has issued a number of scientific and product specific biosimilar guidelines, including requirements for approving biosimilars containing monoclonal antibodies. In the E.U., biosimilars are generally approved under the centralized procedure. The approval pathway allows sponsors of a biosimilar to seek and obtain regulatory approval based in part on reliance on the clinical trial data of an innovator product to which the biosimilar has been demonstrated, through comprehensive comparability studies, to be “similar.” In many cases, this allows biosimilars to be brought to market without conducting the full complement of clinical trials typically required for novel biologic drugs.
Orphan Drug Act
Under the U.S. Orphan Drug Act, the FDA may grant orphan drug designation to drugs or biologics intended to treat a “rare disease or condition,” which generally is a disease or condition that affects fewer than 200,000 individuals in the U.S. If a product which has an orphan drug designation subsequently receives the first FDA approval for the indication for which it has such designation, the product is entitled to orphan exclusivity, i.e., the FDA may not approve any other applications to market the same drug for the same indication for a period of seven years following marketing approval, except in certain very limited circumstances, such as if the later product is shown to be clinically superior to the orphan product. Legislation similar to the U.S. Orphan Drug Act has been enacted in other countries to encourage the research, development and marketing of medicines to treat, prevent or diagnose rare diseases. In the E.U., medicinal products that receive an orphan designation are entitled to 10 years of market exclusivity following approval, protocol assistance and access to the centralized procedure for marketing authorization. SPINRAZA has been granted orphan drug designation in the U.S., E.U. and Japan.

26
Regulation Pertaining to Pricing and Reimbursement
In both domestic and foreign markets, sales of our products depend, to a significant extent, on the availability and amount of reimbursement by third-party payors, including governments, private health plans and other organizations. Substantial uncertainty exists regarding the pricing and reimbursement of our products, and drug prices continue to receive significant scrutiny. Governments may regulate coverage, reimbursement and pricing of our products to control cost or affect utilization of our products. Challenges to our pricing strategies, by either government or private stakeholders, could harm our business. The U.S. and foreign governments have enacted and regularly consider additional reform measures that affect health care coverage and costs. Private health plans may also seek to manage cost and utilization by implementing coverage and reimbursement limitations. Other payors, including managed care organizations, health insurers, pharmacy benefit managers, government health administration authorities and private health insurers, seek price discounts or rebates in connection with the placement of our products on their formularies and, in some cases, may impose restrictions on access, coverage or pricing of particular drugs based on perceived value.
Within the U.S.
• Medicaid: Medicaid is a joint federal and state program that is administered by the states for low income and disabled beneficiaries. Under the Medicaid Drug Rebate Program, we are required to pay a rebate for each unit of product reimbursed by the state Medicaid programs. The amount of the rebate is established by law and is adjusted upward if the average manufacture price (AMP) increases more than inflation (measured by the Consumer Price Index - Urban). The rebate amount is calculated each quarter based on our report of current AMP and best price for each of our products to the Centers for Medicare & Medicaid Services (CMS). The requirements for calculating AMP and best price are complex. We are required to report any revisions to AMP or best price previously reported within a certain period, which revisions could affect our rebate liability for prior quarters. In addition, if we fail to provide information timely or we are found to have knowingly submitted false information to the government, the statute governing the Medicaid Drug Rebate Program provides for civil monetary penalties.
• Medicare: Medicare is a federal program that is administered by the federal government. The program covers individuals age 65 and over as
well as those with certain disabilities. Medicare Part B generally covers drugs that must be administered by physicians or other health care practitioners, are provided in connection with certain durable medical equipment or are certain oral anti-cancer drugs and certain oral immunosuppressive drugs. Medicare Part B pays for such drugs under a payment methodology based on the average sales price (ASP) of the drugs. Manufacturers, including us, are required to provide ASP information to the CMS on a quarterly basis. The manufacturer-submitted information is used to calculate Medicare payment rates. If a manufacturer is found to have made a misrepresentation in the reporting of ASP, the governing statute provides for civil monetary penalties.
Medicare Part D provides coverage to enrolled Medicare patients for self-administered drugs (i.e., drugs that are not administered by a physician). Medicare Part D is administered by private prescription drug plans approved by the U.S. government. Each drug plan establishes its own Medicare Part D formulary for prescription drug coverage and pricing, which the drug plan may modify from time-to-time. The prescription drug plans negotiate pricing with manufacturers and pharmacies, and may condition formulary placement on the availability of manufacturer discounts. In addition, manufacturers, including us, are required to provide to the CMS a discount of up to 70% on brand name prescription drugs utilized by Medicare Part D beneficiaries when those beneficiaries reach the coverage gap in their drug benefits.
• Federal Agency Discounted Pricing: Our products are subject to discounted pricing when purchased by federal agencies via the Federal Supply Schedule (FSS). FSS participation is required for our products to be covered and reimbursed by the Veterans Administration (VA), Department of Defense, Coast Guard and Public Health Service (PHS). Coverage under Medicaid, Medicare and the PHS pharmaceutical pricing program is also conditioned upon FSS participation. FSS pricing is intended not to exceed the price that we charge our most-favored non-federal customer for a product. In addition, prices for drugs purchased by the VA, Department of Defense (including drugs purchased by military personnel and dependents through the TriCare retail pharmacy program), Coast Guard and PHS are subject to a cap on pricing equal to 76% of the non-federal average manufacturer price (non-FAMP). An additional discount applies if non-FAMP increases more than inflation (measured by the Consumer Price
27
Index - Urban). In addition, if we fail to provide information timely or we are found to have knowingly submitted false information to the government, the governing statute provides for civil monetary penalties.
• 340B Discounted Pricing: To maintain coverage of our products under the Medicaid Drug Rebate Program and Medicare Part B, we are required to extend significant discounts to certain covered entities that purchase products under Section 340B of the PHS pharmaceutical pricing program. Purchasers eligible for discounts include hospitals that serve a disproportionate share of financially needy patients, community health clinics and other entities that receive certain types of grants under the PHSA. For all of our products, we must agree to charge a price that will not exceed the amount determined under statute (the “ceiling price”) when we sell outpatient drugs to these covered entities. In addition, we may, but are not required to, offer these covered entities a price lower than the 340B ceiling price. The 340B discount formula is based on AMP and is generally similar to the level of rebates calculated under the Medicaid Drug Rebate Program.
Outside the U.S.
Outside the U.S., our products are paid for by a variety of payors, with governments being the primary source of payment. Governments may determine or influence reimbursement of products and may also set prices or otherwise regulate pricing. Negotiating prices with governmental authorities can delay commercialization of our products. Governments may use a variety of cost-containment measures to control the cost of products, including price cuts, mandatory rebates, value-based pricing and reference pricing (i.e., referencing prices in other countries and using those reference prices to set a price). Budgetary pressures in many countries are continuing to cause governments to consider or implement various cost-containment measures, such as price freezes, increased price cuts and rebates and expanded generic substitution and patient cost-sharing.
Regulation Pertaining to Sales and Marketing
We are subject to various federal and state laws pertaining to health care “fraud and abuse,” including anti-kickback laws and false claims laws. Anti-kickback laws generally prohibit a prescription drug manufacturer from soliciting, offering, receiving or paying any remuneration to generate business, including the purchase or prescription of a particular drug. Although the specific provisions of these laws vary, their scope is generally broad and there may be no regulations, guidance or court decisions that clarify how the laws apply to particular industry practices.
There is therefore a possibility that our practices might be challenged under anti-kickback or similar laws. False claims laws prohibit anyone from knowingly and willingly presenting, or causing to be presented, for payment to third-party payors (including Medicare and Medicaid), claims for reimbursed drugs or services that are false or fraudulent, claims for items or services not provided as claimed or claims for medically unnecessary items or services. Our activities relating to the sale and marketing of our products may be subject to scrutiny under these laws. Violations of fraud and abuse laws may be punishable by criminal or civil sanctions, including fines and civil monetary penalties, and exclusion from federal health care programs (including Medicare and Medicaid). In the U.S., federal and state authorities are paying increased attention to enforcement of these laws within the pharmaceutical industry and private individuals have been active in alleging violations of the laws and bringing suits on behalf of the government under the federal civil False Claims Act. If we were subject to allegations concerning, or were convicted of violating, these laws, our business could be harmed.
Laws and regulations have been enacted by the federal government and various states to regulate the sales and marketing practices of pharmaceutical manufacturers. The laws and regulations generally limit financial interactions between manufacturers and health care providers or require disclosure to the government and public of such interactions. The laws include federal “sunshine” provisions. The sunshine provisions apply to pharmaceutical manufacturers with products reimbursed under certain government programs and require those manufacturers to disclose annually to the federal government (for re-disclosure to the public) certain payments made to physicians and certain other healthcare practitioners or to teaching hospitals. State laws may also require disclosure of pharmaceutical pricing information and marketing expenditures. Many of these laws and regulations contain ambiguous requirements. Given the lack of clarity in laws and their implementation, our reporting actions could be subject to the penalty provisions of the pertinent federal and state laws and regulations. Outside the U.S., other countries have implemented requirements for disclosure of financial interactions with healthcare providers and additional countries may consider or implement such laws.
Other Regulations
Foreign Anti-Corruption
We are subject to various federal and foreign laws that govern our international business practices with respect to payments to government officials. Those laws include the U.S. Foreign Corrupt Practices Act (FCPA), which prohibits U.S. companies and their

28
representatives from paying, offering to pay, promising to pay or authorizing the payment of anything of value to any foreign government official, government staff member, political party or political candidate for the purpose of obtaining or retaining business or to otherwise obtain favorable treatment or influence a person working in an official capacity. In many countries, the health care professionals we regularly interact with may meet the FCPA's definition of a foreign government official. The FCPA also requires public companies to make and keep books and records that accurately and fairly reflect their transactions and to devise and maintain an adequate system of internal accounting controls.
The laws to which we are subject also include the U.K. Bribery Act 2010 (Bribery Act), which proscribes giving and receiving bribes in the public and private sectors, bribing a foreign public official and failing to have adequate procedures to prevent employees and other agents from giving bribes. U.S. companies that conduct business in the U.K. generally will be subject to the Bribery Act. Penalties under the Bribery Act include significant fines for companies and criminal sanctions for corporate officers under certain circumstances.
NIH Guidelines
We seek to conduct research at our U.S. facilities in compliance with the current U.S. National Institutes of Health Guidelines for Research Involving Recombinant DNA Molecules (NIH Guidelines). By local ordinance, we are required to, among other things, comply with the NIH Guidelines in relation to our facilities in Research Triangle Park (RTP), NC and are required to operate pursuant to certain permits.
Other Laws
Our present and future business has been and will continue to be subject to various other laws and regulations. Various laws, regulations and recommendations relating to data privacy and protection, safe working conditions, laboratory practices, the experimental use of animals and the purchase, storage, movement, import, export and use and disposal of hazardous or potentially hazardous substances, including radioactive compounds and infectious disease agents, used in connection with our research work are or may be applicable to our activities. Certain agreements entered into by us involving exclusive license rights may be subject to national or international antitrust regulatory control, the effect of which cannot be predicted. The extent of government regulation, which might result from future legislation or administrative action, cannot accurately be predicted.
The European Parliament and the Council of the European Union adopted a comprehensive general
data privacy regulation (GDPR) in 2016 to replace the current E.U. Data Protection Directive and related country-specific legislation. The GDPR took effect in May 2018 and governs the collection and use of personal data in the E.U. The GDPR, which is wide-ranging in scope, imposes several requirements relating to the consent of the individuals to whom the personal data relates, the information provided to the individuals, the security and confidentiality of the personal data, data breach notification and the use of third-party processors in connection with the processing of the personal data. The GDPR also imposes strict rules on the transfer of personal data out of the E.U. to the U.S., provides an enforcement authority and imposes large penalties for noncompliance, including the potential for fines of up to €20.0 million or 4% of the annual global revenues of the infringer, whichever is greater.
Environmental MattersWe strive to comply in all material respects with
applicable laws and regulations concerning the environment. While it is impossible to predict accurately the future costs associated with environmental compliance and potential remediation activities, compliance with environmental laws is not expected to require significant capital expenditures and has not had, and is not expected to have, a material adverse effect on our operations or competitive position.
ManufacturingWe are committed to ensuring an uninterrupted
supply of medicines to patients around the world. To that end, we continually review our manufacturing capacity, capabilities, processes and facilities. We believe that our manufacturing facilities, together with the third-party contract manufacturing organizations we outsource to, currently provide sufficient capacity for our products and the contract manufacturing services we provide to Samsung Bioepis, our joint venture that develops, manufactures and markets biosimilar products, and other strategic contract manufacturing partners. Due to the long lead times necessary for the expansion of manufacturing capacity, we are expanding our large molecule production capacity by building a large-scale biologics manufacturing facility in Solothurn, Switzerland. We expect this facility to be operational by the end of 2020.
29
Manufacturing Facilities
Our drug substance manufacturing facilities include:
Facility Drug Substance Manufactured
RTP, NC AVONEXPLEGRIDYTYSABRIOther*
Hillerød, Denmark TYSABRIBiosimilars
Other** Other includes products manufactured for contract
manufacturing partners.
In addition to our drug substance manufacturing facilities, we have a drug product manufacturing facility and supporting infrastructure in RTP, NC, including a parenteral facility and an oral solid dose products manufacturing facility.
The parenteral facility adds capabilities and capacity for filling biologics into vials and is principally used for filling product candidates. The oral solid dose products facility supplements our outsourced small molecule manufacturing capabilities, including the manufacture of TECFIDERA.
We also have an oligonucleotide synthesis manufacturing facility in RTP, NC. This facility gives us the capability to manufacture ASO drugs like SPINRAZA as well as our other ASO candidates currently in our clinical pipeline.
We are building a large-scale biologics manufacturing facility in Solothurn, Switzerland. We expect this facility to be operational by the end of 2020.
Genentech is responsible for all worldwide manufacturing activities for bulk RITUXAN, RITUXAN HYCELA and GAZYVA and has sourced the manufacture of certain bulk RITUXAN, RITUXAN HYCELA and GAZYVA requirements to a third party. Acorda supplies FAMPYRA to us pursuant to its supply agreement with Alkermes, Inc. and Ionis supplies the active pharmaceutical ingredient (API) for SPINRAZA.
Third-Party Suppliers and Manufacturers
We principally use third parties to manufacture the API and the final product for our small molecule products and product candidates, including TECFIDERA and FUMADERM, and the final drug product for our large molecule products and, to a lesser extent, product candidates.
We source all of our fill-finish and the majority of final product assembly and storage operations for our products, along with a substantial part of our packaging operations, to a concentrated group of third-party contract manufacturing organizations. We have internal label and packaging capability for clinical and commercial products at our Hillerød facility. Raw materials, delivery devices, such as syringes and auto-injectors, and other supplies required for the production of our products and product candidates are procured from various third-party suppliers and manufacturers in quantities adequate to meet our needs. Continuity of supply of such raw materials, devices and supplies is assured using a strategy of dual sourcing where possible or by a risk-based inventory strategy. Our third-party service providers, suppliers and manufacturers may be subject to routine cGMP inspections by the FDA or comparable agencies in other jurisdictions and undergo assessment and certification by our quality management group.
30
Our EmployeesAs of December 31, 2018, we had approximately 7,800 employees worldwide.
Our Executive Officers (as of February 6, 2019)
Officer Current Position Age
YearJoinedBiogen
Michel Vounatsos Chief Executive Officer 57 2016
Susan H. Alexander Executive Vice President, Chief Legal Officer and Secretary 62 2006Jeffrey D. Capello Executive Vice President and Chief Financial Officer 54 2017Michael D. Ehlers, M.D., Ph.D. Executive Vice President, Research and Development 50 2016Ginger Gregory, Ph.D. Executive Vice President and Chief Human Resources Officer 51 2017Chirfi Guindo Executive Vice President and Head of Global Marketing, Market
Access and Customer Innovation53 2017
Daniel Karp Executive Vice President, Corporate Development 41 2018Robin C. Kramer Vice President, Chief Accounting Officer 53 2018Paul McKenzie, Ph.D. Executive Vice President, Pharmaceutical Operations and
Technology53 2016
Alfred W. Sandrock, Jr., M.D., Ph.D. Executive Vice President and Chief Medical Officer 61 1998
Michel VounatsosExperience
Mr. Vounatsos has served as our Chief Executive Officer since January 2017. Prior to that, from April 2016 toDecember 2016, Mr. Vounatsos served as our Executive Vice President and Chief Commercial Officer. Prior tojoining Biogen, Mr. Vounatsos spent 20 years at Merck & Co., Inc. (Merck), a pharmaceutical company, where hemost recently served as President, Primary Care, Customer Business Line. In this role, he led Merck’s globalprimary care business unit, a role which encompassed Merck’s cardiology-metabolic, general medicine, women’shealth and biosimilars groups and developed and instituted a strategic framework for enhancing the company’srelationships with key constituents, including the most significant providers, payors and retailers and the world’slargest governments. Mr. Vounatsos previously held leadership positions across Europe and in China for Merck.Prior to that, Mr. Vounatsos held management positions at Ciba-Geigy, a pharmaceutical company.Education
Universite Victor Segalen, Bordeaux II, France, C.S.C.T. Certificate in MedicineHEC School of Management - Paris, M.B.A.
Susan H. AlexanderExperienceMs. Alexander has served as our Executive Vice President, Chief Legal Officer and Secretary since April 2018. Priorto that, from March 2017 to March 2018, Ms. Alexander served as our Executive Vice President, Chief Legal,Corporate Services and Secretary, from December 2011 to March 2017, as our Executive Vice President, ChiefLegal Officer and Secretary and from 2006 to December 2011, as our Executive Vice President, General Counseland Corporate Secretary. Prior to joining Biogen, Ms. Alexander served as the Senior Vice President, GeneralCounsel and Corporate Secretary of PAREXEL International Corporation, a biopharmaceutical services company,from 2003 to January 2006. From 2001 to 2003 Ms. Alexander served as General Counsel of IONA Technologies,a software company. From 1995 to 2001 Ms. Alexander served as Counsel at Cabot Corporation, a specialtychemicals and performance materials company. Prior to that, Ms. Alexander was a partner at the law firms ofHinckley, Allen & Snyder and Fine & Ambrogne.Public Company Boards
Invacare Corporation, a medical and healthcare product companyEducation
Wellesley College, B.A.Boston University School of Law, J.D.
31
Jeffrey D. CapelloExperienceMr. Capello has served as our Executive Vice President and Chief Financial Officer since December 2017 andserved as our Chief Accounting Officer from July 2018 to November 2018. Prior to joining Biogen, Mr. Capelloserved as the Chief Financial Officer of Beacon Health Options, Inc., a behavioral health company, withresponsibility for finance, human resources, information technology, real estate and procurement, from October2016 until November 2017. From July 2015 until September 2016 Mr. Capello was the founder and ChiefExecutive Officer of Monomoy Advisors, which focuses on helping companies drive shareholder value. From July2014 until June 2015 Mr. Capello served as the Executive Vice President and Chief Financial Officer of Ortho-Clinical Diagnostics, an in-vitro diagnostics company that was acquired by the Carlyle Group from Johnson &Johnson (J&J), with responsibility for global finance and business development. From March 2010 to December2013 Mr. Capello served as Chief Financial Officer and Executive Vice President of Boston Scientific Corporation(Boston Scientific), a medical device company, where he was responsible for the worldwide management of BostonScientific’s finance, information systems, business development and corporate strategy functions. Mr. Capellojoined Boston Scientific in June 2008 and served as Senior Vice President and Chief Accounting Officer until March2010. From 2006 to 2008 he was the Senior Vice President and Chief Financial Officer with responsibilities forglobal finance and business development at PerkinElmer, Inc. (PerkinElmer), a life sciences tool company.Previously, he served as PerkinElmer’s Vice President of Finance, Corporate Controller, Treasurer and ChiefAccounting Officer from 2001 to 2006. Prior to his tenure at PerkinElmer, Mr. Capello was a Partner atPricewaterhouseCoopers LLP, both in the U.S. and in the Netherlands.Education
University of Vermont, B.S. Business AdministrationHarvard Business School, M.B.A.
Michael D. Ehlers, M.D., Ph.D.Experience
Dr. Ehlers has served as our Executive Vice President, Research and Development since May 2016. Prior to joining Biogen, from August 2010 to April 2016, Dr. Ehlers served in leadership positions at Pfizer, a biopharmaceutical company, including Senior Vice President & Head BioTherapeutics R&D and Chief Scientific Officer, Neuroscience & Pain. Prior to that, Dr. Ehlers was the George Barth Geller Professor of Neurobiology and an Investigator of the Howard Hughes Medical Institute at Duke University Medical Center. He is the recipient of numerous awards, including the Eppendorf & Science Prize in Neurobiology, the John J. Abel Award in Pharmacology, the Society for Neuroscience Young Investigator Award, a National Institute of Mental Health MERIT Award, the National Alliance for Schizophrenia and Depression Distinguished Investigator Award and the Massachusetts Medical Society Honored Business Leader Award. In 2013 Dr. Ehlers became the 11th recipient of the Thudichum Medal of the Biochemical Society of the U.K. Past recipients include two Nobel laureates. Dr. Ehlers has authored over 100 scientific papers, has served on the Editorial Boards of Annual Reviews in Medicine, Annual Reviews in Pharmacology and Toxicology, the Journal of Neuroscience, the Journal of Biological Chemistry and the Journal of Molecular and Cellular Neuroscience and has sat on advisory committees of the National Institutes of Health.Outside Affiliations
McKnight Endowment Fund for Neuroscience BoardAmerican Society for Cell Biology
Education
California Institute of Technology, B.S. ChemistryThe Johns Hopkins University School of Medicine, M.D.The Johns Hopkins University School of Medicine, Ph.D. Neuroscience

32
Ginger Gregory, Ph.D.Experience
Dr. Gregory has served as our Executive Vice President and Chief Human Resources Officer since July 2017. Priorto joining Biogen, Dr. Gregory served as Executive Vice President and Chief Human Resources Officer at Shire PLC,a global specialty biopharmaceutical company, from February 2014 to April 2017. Prior to that, Dr. Gregory heldexecutive-level human resources positions for several multinational companies across a variety of industries,including Dunkin’ Brands Group Inc., a restaurant holding company, where she served as Chief Human ResourceOfficer; Novartis, AG, a pharmaceutical company, where she was the division head of Human Resources forNovartis Vaccines and Diagnostics, Novartis Consumer Health and Novartis Institutes of BioMedical Research from2005 to 2012; and Novo Nordisk A/S, a pharmaceutical company, where she served as Senior Vice President,Corporate People & Organization at the company’s headquarters in Copenhagen, Denmark. Earlier in her career, Dr.Gregory held a variety of human resources generalist and specialist positions at BMS, a pharmaceutical company,and served as a consultant with Booz Allen & Hamilton, an information technology consulting company, in the areaof organization change and effectiveness.Education
University of Massachusetts, B.A. PsychologyThe George Washington University, Ph.D. Psychology
Chirfi GuindoExperience
Mr. Guindo has served as our Executive Vice President and Head of Global Marketing, Market Access andCustomer Innovation since November 2017. Prior to joining Biogen, Mr. Guindo has spent 27 years in the globalpharmaceutical industry and has held several leadership positions at Merck, a pharmaceutical company, inCanada, the U.S., France, Africa and the Netherlands. He worked in several disciplines including Finance, Sales &Marketing, General Management and Global Strategy/Product Development in specialty, acute and hospital care.Most recently Mr. Guindo was Vice President and Managing Director and President and Managing Director of MerckCanada from October 2014 to November 2017. From January 2011 to October 2014, he was Vice President andGeneral Manager, Global HIV Franchise at Merck.Education
Ecole Central de Paris (France), EngineeringStern School of Business, New York University, M.B.A. Finance/Economics
Daniel KarpExperience
Mr. Karp has served as our Executive Vice President, Corporate Development since June 2018. Prior to joiningBiogen, Mr. Karp held a number of positions of increasing responsibility at Pfizer, a biopharmaceutical company,including as Vice President, Worldwide Business Development and Head of Business Development for WorldwideResearch and Development from May 2016 to June 2018, as Vice President, Worldwide Business Developmentand BD Lead for Pfizer Vaccines, Oncology and Consumer Healthcare from January 2014 to May 2016, as SeniorDirector, Worldwide Business Development from December 2010 to December 2013, as Director, WorldwideBusiness Development from January 2008 to December 2010, as Senior Manager, Worldwide BusinessDevelopment from May 2007 to December 2007 and as Manager, U.S. Business Development from July 2006 toApril 2007. Prior to that, Mr. Karp held roles in healthcare and life sciences strategy consulting.Education
Duke University, B.S. BiologyWharton School of the University of Pennsylvania, M.B.A.
33
Robin C. KramerExperience
Ms. Kramer has served as our Vice President, Chief Accounting Officer since November 2018. Prior to joiningBiogen, Ms. Kramer served as the Senior Vice President and Chief Accounting Officer of Hertz Global Holdings,Inc., a car rental company, from May 2014 to November 2018. Prior to that, Ms. Kramer was an audit partner atDeloitte & Touche LLP (Deloitte), a professional services firm, from 2007 to 2014, including serving in Deloitte'sNational Office Accounting Standards and Communications Group from 2007 to 2010. From 2005 to 2007, Ms.Kramer served as Chief Accounting Officer of Fisher Scientific International, Inc., a laboratory supply andbiotechnology company, and from 2004 to 2005 Ms. Kramer served as Director, External Reporting, Accountingand Control for the Gillette Company, a personal care company. Ms. Kramer also held partner positions in thepublic accounting firms of Ernst & Young LLP and Arthur Anderson LLP. Ms. Kramer is a licensed certified publicaccountant (CPA) in Massachusetts. She is a member of the Massachusetts Society of CPAs and the AmericanInstitute of CPAs and served as a Board Member for the Massachusetts State Board of Accountancy fromSeptember 2011 to December 2015.Education
Salem State University, B.B.A. Accounting
Paul McKenzie, Ph.D.Experience
Dr. McKenzie has served as our Executive Vice President, Pharmaceutical Operations and Technology since July2016. Prior to that, from February 2016 to June 2016, he served as our Senior Vice President for Global BiologicsManufacturing & Technical Operations. Prior to joining Biogen, beginning in 2008, Dr. McKenzie held a number ofpositions of increasing responsibility at J&J, including Vice President of R&D for J&J’s Ethicon business and GlobalHead of Pharmaceutical Manufacturing and Technical Operations, where he led the manufacturing and technicaloperations team responsible for internal and external manufacturing of Janssen’s pharmaceutical portfolio. He alsoran global Development for Janssen R&D, helping to manage pipeline activities from discovery through clinicaldevelopment and commercialization. Prior to J&J, Dr. McKenzie also held various R&D and manufacturing positionsat BMS and Merck, both of which are pharmaceutical companies.Education
University of Pennsylvania, B.S. Chemical EngineeringCarnegie Mellon University, Ph.D. Chemical Engineering
Alfred W. Sandrock, Jr., M.D., Ph.D.Experience
Dr. Sandrock has served as our Executive Vice President and Chief Medical Officer since October 2017. Prior tothat, Dr. Sandrock served as our Executive Vice President, Chief Medical Officer Neurology and Neurodegenerationfrom October 2015 to October 2017, as our Chief Medical Officer and Group Senior Vice President from April 2013to October 2015 and as our Chief Medical Officer and Senior Vice President of Development Sciences fromFebruary 2012 to April 2013. Prior to that, Dr. Sandrock held several other senior executive positions since joiningBiogen in 1998, including Senior Vice President of Neurology Research and Development and Vice President ofClinical Development, Neurology.Public Company Boards
Neurocrine Biosciences, Inc., a life sciences companyEducation
Stanford University, B.A. Human BiologyHarvard Medical School, M.D.Harvard University, Ph.D. NeurobiologyMassachusetts General Hospital, internship in Medicine, residency and chief residency in Neurology andclinical fellowship in Neuromuscular Disease and Clinical Neurophysiology (electromyography)
Available InformationOur principal executive offices are located at 225 Binney Street, Cambridge, MA 02142 and our telephone
number is (617) 679-2000. Our website address is www.biogen.com. We make available free of charge through the Investors section of our website our Annual Reports on Form 10-K, Quarterly Reports on Form 10-Q, Current Reports on Form 8-K and all amendments to those reports as soon as reasonably practicable after such material is electronically filed with or furnished to the Securities and Exchange Commission (SEC). We include our website address in this report only as an inactive textual reference and do not intend it to be an active link to our website. The contents of our website are not incorporated into this report.

34
Item 1A. Risk Factors
We are substantially dependent on revenues from our principal products.
Our revenues depend upon continued sales of our principal products, as well as the financial rights we have in our anti-CD20 therapeutic programs, and, unless we develop, acquire rights to and/or commercialize new products and technologies, we will be substantially dependent on sales from our principal products and our financial rights in our anti-CD20 therapeutic programs for many years. Further, following the completion of the spin-off of our hemophilia business on February 1, 2017, our revenues are further reliant and concentrated on sales of our MS products in an increasingly competitive market, revenues from sales of our product for SMA and our financial rights in our anti-CD20 therapeutic programs. Any of the following negative developments relating to any of our principal products or any of our anti-CD20 therapeutic programs may adversely affect our revenues and results of operations or could cause a decline in our stock price:
• safety or efficacy issues;
• the introduction or greater acceptance of competing products, including lower-priced competing products;
• limitations and additional pressures on product pricing or price increases, including those resulting from governmental or regulatory requirements, increased competition or changes in, or implementation of, reimbursement policies and practices of payors and other third parties; or
• adverse legal, administrative, regulatory or legislative developments.
SPINRAZA has been approved by, among others, the FDA, the EC and the Japanese Ministry of Health, Labor and Welfare, and is in the early stages of commercial launch in certain markets. In addition to risks associated with new product launches and the other factors described in these Risk Factors, our ability to successfully commercialize SPINRAZA may be adversely affected due to:
• our limited marketing experience within certain SMA markets, which may impact our ability to develop additional relationships with the associated medical and scientific community;
• the lack of readiness of healthcare providers to treat patients with SMA;
• the effectiveness of our commercial strategy for marketing SPINRAZA;
• our ability to maintain a positive reputation among patients, healthcare providers and others in the SMA community, which may be impacted by pricing and reimbursement decisions relating to SPINRAZA; and
• the introduction of other products in development that, if successfully developed and approved, may compete with SPINRAZA in the SMA market, including potential gene therapy or oral products.
Sales of our products depend, to a significant extent, on adequate coverage, pricing and reimbursement from third-party payors, which are subject to increasing and intense pressure from political, social, competitive and other sources. Our inability to obtain and maintain adequate coverage, or a reduction in pricing or reimbursement, could have an adverse effect on our business, reputation, revenues and results of operations or could cause a decline or volatility in our stock price.
Sales of our products depend, to a significant extent, on the availability and extent of adequate coverage, pricing and reimbursement from government health administration authorities, private health insurers and other organizations. When a new pharmaceutical product is approved, the availability of government and private reimbursement for that product may be uncertain, as is the pricing and amount for which that product will be reimbursed.
Pricing and reimbursement for our products may be adversely affected by a number of factors, including:
• changes in, and implementation of, federal, state or foreign government regulations or private third-party payors’ reimbursement policies;
• pressure by employers on private health insurance plans to reduce costs;
• consolidation and increasing assertiveness of payors, including managed care organizations, health insurers, pharmacy benefit managers, government health administration authorities, private health insurers and other organizations, seeking price discounts or rebates in connection with the placement of our

35
products on their formularies and, in some cases, the imposition of restrictions on access or coverage of particular drugs or pricing determined based on perceived value; and
• our value-based contracting pilot program pursuant to which we aim to tie the pricing of our products to their clinical values by either aligning price to patient outcomes or adjusting price for patients who discontinue therapy for any reason, including efficacy or tolerability concerns.
Our ability to set the price for our products varies significantly from country to country and as a result so can the price of our products. Certain countries set prices by reference to the prices in other countries where our products are marketed. Thus, our inability to obtain and maintain adequate prices in a particular country may not only limit the revenues from our products within that country, but may also adversely affect our ability to secure acceptable prices in existing and potential new markets. This may create the opportunity for third-party cross-border trade or influence our decision to sell or not to sell a product, thus adversely affecting our geographic expansion plans and revenues.
Drug prices are under significant scrutiny in the markets in which our products are prescribed. We expect drug pricing and other health care costs to continue to be subject to intense political and societal pressures on a global basis. In addition, competition from current and future competitors may negatively impact our ability to maintain pricing and our market share. New products or treatments brought to market by our competitors could cause revenues for our products to decrease due to potential price reductions and lower sales volumes.
Payors, including managed care organizations, health insurers, pharmacy benefit managers, government health administration authorities, private health insurers and other organizations, increasingly seek ways to reduce their costs. Many payors continue to adopt benefit plan changes that shift a greater portion of prescription costs to patients. Such measures include more limited benefit plan designs, higher patient co-pay or co-insurance obligations and limitations on patients' use of commercial manufacturer co-pay payment assistance programs (including through co-pay accumulator adjustment or maximization programs). Payors also increasingly seek price discounts or rebates in connection with the placement of our products on their formularies or those they manage and control costs by imposing restrictions on access to or usage of our products, such as by requiring prior authorization or step therapy. Significant consolidation in the health insurance industry has resulted in a few large insurers and pharmacy benefit managers exerting greater pressure in pricing and usage negotiations with drug manufacturers, significantly increasing discounts and rebates required of manufacturers and limiting patient access and usage. Further consolidation among insurers, pharmacy benefit managers and other payors would increase the negotiating leverage such entities have over us and other drug manufacturers. Ultimately, additional discounts, rebates, coverage or plan changes, restrictions or exclusions as described above could have a material adverse effect on sales of our affected products.
Our failure to obtain or maintain adequate coverage, pricing or reimbursement for our products could have an adverse effect on our business, reputation, revenues and results of operations, could curtail or eliminate our ability to adequately fund research and development programs for the discovery and commercialization of new products or could cause a decline or volatility in our stock price.
If we are unable to obtain and maintain adequate protection for our data, intellectual property and other proprietary rights, our business may be harmed.
Our success depends in part on our ability to obtain and defend patent and other intellectual property rights that are important to the commercialization of our products and product candidates. The degree of patent protection that will be afforded to our products and processes in the U.S. and in other important markets remains uncertain and is dependent upon the scope of protection decided upon by the patent offices, courts, administrative bodies and lawmakers in these countries. We may fail to successfully obtain or preserve patent protection for the technologies incorporated into our products and processes, or the protection we obtain may not be of sufficient breadth and degree to protect our commercial interests in all countries where we conduct business. Under the Hatch-Waxman Act, a manufacturer may file an Abbreviated New Drug Application, seeking approval of a generic copy of an approved innovator product, or a NDA under Section 505(b)(2) of the Federal Food, Drug and Cosmetic Act, which may be for a new or improved version of the original innovator product. The manufacturers are allowed to rely on the safety and efficacy data of the innovator's product, may not need to conduct clinical trials, can market a competing version of a product after the expiration or loss of patent exclusivity or the expiration or loss of regulatory exclusivity and often charge significantly lower prices. Upon the expiration or loss of patent protection or the expiration or loss of regulatory exclusivity for a product, especially a small molecule product, the major portion of revenues for that product may be dramatically reduced in a very short period of time. If we cannot prevent others from exploiting our inventions, we will not derive the expected benefit from them. Furthermore, our products may be determined to

36
infringe patents or other intellectual property rights held by third parties, which could result in financial, legal, business or reputational harm to us.
We also rely on regulatory exclusivity for protection of our products. Implementation and enforcement of regulatory exclusivity, which may consist of regulatory data protection and market protection, varies widely from country to country. Failure to qualify for regulatory exclusivity, or failure to obtain or maintain the extent or duration of such protections that we expect in each of the markets for our products due to challenges, changes or interpretations in the law or otherwise, could affect our revenues for our products or our decision on whether to market our products in a particular country or countries or could otherwise have an adverse impact on our results of operations.
Litigation, interferences, oppositions, inter partes reviews, administrative challenges or other similar types of proceedings are, have been and may in the future be necessary in some instances to determine the validity and scope of certain of our proprietary rights, and in other instances to determine the validity, scope or non-infringement of certain patent rights claimed by third parties to be pertinent to the manufacture, use or sale of our products. We may also face challenges to our patent and regulatory protections covering our products by third parties, including manufacturers of generics and biosimilars that may choose to launch or attempt to launch their products before the expiration of our patent or regulatory exclusivity. Litigation, interference, oppositions, inter partes reviews, administrative challenges or other similar types of proceedings are unpredictable and may be protracted, expensive and distracting to management. The outcome of such proceedings could adversely affect the validity and scope of our patent or other proprietary rights, hinder our ability to manufacture and market our products, require us to seek a license for the infringed product or technology or result in the assessment of significant monetary damages against us that may exceed amounts, if any, accrued in our financial statements. An adverse determination in a judicial or administrative proceeding or a failure to obtain necessary licenses could prevent us from manufacturing or selling our products. Furthermore, payments under any licenses that we are able to obtain would reduce our profits derived from the covered products and services. Any of these circumstances could result in financial, business or reputational harm to us or could cause a decline or volatility in our stock price.
Our long-term success depends upon the successful development of new products and additional indications for existing products.
Our long-term viability and growth will depend upon the successful development of additional indications for our existing products as well as the successful development of new products and technologies from our research and development activities, our biosimilars joint venture with Samsung BioLogics or licenses or acquisitions from third parties.
Product development is very expensive and involves a high degree of risk. Only a small number of research and development programs result in the commercialization of a product. Clinical trials may indicate that our product candidates lack efficacy, have harmful side effects, result in unexpected adverse events or raise other concerns that may significantly reduce the likelihood of regulatory approval. This may result in terminated programs, significant restrictions on use and safety warnings in an approved label, adverse placement within the treatment paradigm or significant reduction in the commercial potential of the product candidate.
If we fail to compete effectively, our business and market position would suffer.
The biopharmaceutical industry and the markets in which we operate are intensely competitive. We compete in the marketing and sale of our products, the development of new products and processes, the acquisition of rights to new products with commercial potential and the hiring and retention of personnel. We compete with biotechnology and pharmaceutical companies that have a greater number of products on the market and in the product pipeline, substantially greater financial, marketing and research and development and other resources and other technological or competitive advantages. One or more of our competitors may benefit from significantly greater sales and marketing capabilities, may develop products that are accepted more widely than ours or may receive patent protection that dominates, blocks or adversely affects our product development or business.
Our products are also susceptible to increasing competition in many markets from generics, biosimilars, prodrugs and other products approved under alternative regulatory pathways. Generic versions of drugs, biosimilars, prodrugs and other products approved under alternative regulatory pathways are likely to be sold at substantially lower prices than branded products. Accordingly, the introduction of such products, as well as other lower-priced competing products, may significantly reduce both the price that we receive for branded products and the volume of branded products that we sell, which will negatively impact our revenues.
37
In the MS market, we face intense competition as the number of products and competitors continues to expand. Due to our significant reliance on sales of our MS products, including TECFIDERA, our business may be harmed if we are unable to successfully compete in the MS market. More specifically, our ability to compete, maintain and grow our share in the MS market may be adversely affected due to a number of factors, including:
• the introduction of more efficacious, safer, less expensive or more convenient alternatives to our MS products, including our own products and products of our collaborators;
• the introduction of biosimilars, follow-on products, generic versions of branded MS products, prodrugs or products approved under other alternative regulatory pathways, which would be significantly less costly than our products to bring to market and would be offered for sale at lower prices, and could result in a significant percentage of the sales of our products being lost to such biosimilars, follow-on products, generic versions of branded MS products, prodrugs or products approved under other alternative regulatory pathways;
• the off-label use by physicians of therapies indicated for other conditions to treat MS patients;
• patient dynamics, including the size of the patient population and our ability to attract and maintain new and current patients to our therapies;
• damage to physician and patient confidence in any of our MS products or generic or biosimilars of our MS products, or to our sales and reputation as a result of label changes or adverse experiences or events that may occur with patients treated with our MS products or generic or biosimilars of our MS products;
• inability to obtain appropriate pricing and reimbursement for our MS products compared to our competitors in key international markets; or
• our ability to obtain and maintain patent, data or market exclusivity for our MS products.
Our business may be adversely affected if we do not successfully execute our growth initiatives.
We anticipate growth through internal development projects, commercial initiatives and external opportunities, which may include the acquisition, partnering and in-licensing of products, technologies and companies or the entry into strategic alliances and collaborations. While we believe we have a number of promising programs in our pipeline, failure of internal development projects to advance or difficulties in executing on our commercial initiatives could impact our current and future growth, resulting in additional reliance on external development opportunities for growth. The availability of high quality, cost-effective development opportunities is limited and competitive, and we are not certain that we will be able to identify candidates that we and our shareholders consider suitable or complete transactions on terms that are acceptable to us and our shareholders. We may fail to complete transactions for other reasons, including if we are unable to obtain desired financing on favorable terms, if at all. Even if we are able to successfully identify and complete acquisitions and other strategic alliances and collaborations, we may face unanticipated costs or liabilities in connection with the transaction or we may not be able to integrate them, which may prove to be an expensive and time consuming procedure, or take full advantage of them or otherwise realize the benefits that we expect.
Supporting our growth initiatives and the further development of our existing products and potential new products in our pipeline will require significant capital expenditures and management resources, including investments in research and development, sales and marketing, manufacturing capabilities and other areas of our business. If we do not successfully execute our growth initiatives, then our business and financial results may be adversely affected and we may incur asset impairment or restructuring charges.
A breakdown or breach of our technology systems could subject us to liability or interrupt the operation of our business.
We are increasingly dependent upon technology systems and data. Our computer systems continue to increase in multitude and complexity, making them potentially vulnerable to breakdown, malicious intrusion and random attack. Likewise, data privacy or security breaches by individuals authorized to access our technology systems or others may pose a risk that sensitive data, including intellectual property, trade secrets or personal information belonging to us, our patients, customers or other business partners, may be exposed to unauthorized persons or to the public. Cyber-attacks are increasing in their frequency, sophistication and intensity, and are becoming increasingly difficult to detect. They are often carried out by motivated, well-resourced, skilled and persistent actors, including nation states, organized crime groups, “hacktivists” and employees or contractors acting with malicious
38
intent. Cyber-attacks could include the deployment of harmful malware and key loggers, ransomware, a denial-of-service attack, a malicious website, the use of social engineering and other means to affect the confidentiality, integrity and availability of our technology systems and data. Our key business partners face similar risks and any security breach of their systems could adversely affect our security posture. While we continue to build and improve our systems and infrastructure, including our business continuity plans, there can be no assurance that our efforts will prevent breakdowns or breaches in our systems that could adversely affect our business and operations and/or result in the loss of critical or sensitive information, which could result in financial, legal, business or reputational harm to us. In addition, our liability insurance may not be sufficient in type or amount to cover us against claims related to security breaches, cyber-attacks and other related breaches.
Successful preclinical work or early stage clinical trials does not ensure success in later stage trials, regulatory approval or commercial viability of a product.
Positive results in a clinical trial may not be replicated in subsequent or confirmatory trials. Additionally, success in preclinical work or early stage clinical trials does not ensure that later stage or larger scale clinical trials will be successful or that regulatory approval will be obtained. In addition, even if later stage clinical trials are successful, regulatory authorities may delay or decline approval of our product candidates. Regulatory authorities may disagree with our view of the data, require additional studies or disagree with our trial design or endpoints. Regulatory authorities may also fail to approve the facilities or the processes used to manufacture a product candidate, our dosing or delivery methods or companion devices. Regulatory authorities may grant marketing approval that is more restricted than anticipated. These restrictions may include limiting indications to narrow patient populations and the imposition of safety monitoring, educational requirements and risk evaluation and mitigation strategies. The occurrence of any of these events could result in significant costs and expenses, have an adverse effect on our business, financial condition and results of operations, and cause our stock price to decline or experience periods of volatility.
Even if we are able to successfully develop new products or indications, sales of new products or products with additional indications may not meet investor expectations. We may also make a strategic decision to discontinue development of a product or indication if, for example, we believe commercialization will be difficult relative to the standard of care or other opportunities in our pipeline.
Clinical trials and the development of biopharmaceutical products is a lengthy and complex process. If we fail to adequately manage our clinical activities, our clinical trials or potential regulatory approvals may be delayed or denied.
Conducting clinical trials is a complex, time-consuming and expensive process. Our ability to complete clinical trials in a timely fashion depends on a number of key factors. These factors include protocol design, regulatory and institutional review board approval, patient enrollment rates and compliance with cGCP. If we or our third-party clinical trial providers or third-party CROs do not successfully carry out these clinical activities, our clinical trials or the potential regulatory approval of a product candidate may be delayed or be unsuccessful.
We have opened clinical trial sites and are enrolling patients in a number of countries where our experience is limited. In most cases, we use the services of third parties to carry out our clinical trial related activities and rely on such parties to accurately report their results. Our reliance on third parties for these activities may impact our ability to control the timing, conduct, expense and quality of our clinical trials. One CRO has responsibility for a substantial portion of our activities and reporting related to our clinical trials. If this CRO does not adequately perform, many of our trials may be affected. We may need to replace our CROs. Although we believe there are a number of other CROs we could engage to continue these activities, the replacement of an existing CRO may result in the delay of the affected trials or otherwise adversely affect our efforts to obtain regulatory approvals and commercialize our product candidates.
Adverse safety events or restrictions on use and safety warnings for our products can negatively affect our business, product sales and stock price.
Adverse safety events involving our marketed products or generic or biosimilar products marketed by others may have a negative impact on our business. Discovery of safety issues with our products could create product liability and could cause additional regulatory scrutiny and requirements for additional labeling or safety monitoring, withdrawal of products from the market and the imposition of fines or criminal penalties. Adverse safety events may also damage physician, patient and/or investor confidence in our products and our reputation. Any of these could result in liabilities, loss of revenues, material write-offs of inventory, material impairments of intangible assets, goodwill and fixed assets, material restructuring charges or other adverse impacts on our results of operations.
39
Regulatory authorities are making greater amounts of stand-alone safety information directly available to the public through periodic safety update reports, patient registries and other reporting requirements. The reporting of adverse safety events involving our products or products similar to ours and public rumors about such events may increase claims against us and may also cause our product sales or stock price to decline or experience periods of volatility.
Restrictions on use or significant safety warnings that may be required to be included in the label of our products, such as the risk of developing PML or liver injury in the label for certain of our products, may significantly reduce expected revenues for those products and require significant expense and management time.
We depend on relationships with collaborators and other third parties for revenues, and for the development, regulatory approval, commercialization and marketing of certain of our products and product candidates, which are outside of our full control.
We rely on a number of significant collaborative and other third-party relationships for revenues, and for the development, regulatory approval, commercialization and marketing of certain of our products and product candidates. We also outsource to third parties certain aspects of our regulatory affairs and clinical development relating to our products and product candidates. Reliance on collaborative and other third-party relationships subjects us to a number of risks, including:
• we may be unable to control the resources our collaborators or third parties devote to our programs, products or product candidates;
• disputes may arise under an agreement, including with respect to the achievement and payment of milestones or ownership of rights to technology developed with our collaborators or other third parties, and the underlying agreement with our collaborators or other third parties may fail to provide us with significant protection or may fail to be effectively enforced if the collaborators or third parties fail to perform;
• the interests of our collaborators or third parties may not always be aligned with our interests, and such parties may not pursue regulatory approvals or market a product in the same manner or to the same extent that we would, which could adversely affect our revenues;
• third-party relationships and collaborations often require the parties to cooperate, and failure to do so effectively could adversely affect product sales, or the clinical development or regulatory approvals of products under joint control, could result in termination of the research, development or commercialization of product candidates or could result in litigation or arbitration;
• any failure on the part of our collaborators or other third parties to comply with applicable laws and regulatory requirements in the marketing, sale and maintenance of the marketing authorization of our products or to fulfill any responsibilities our collaborators or other third parties may have to protect and enforce any intellectual property rights underlying our products could have an adverse effect on our revenues as well as involve us in possible legal proceedings; and
• any improper conduct or actions on the part of our collaborators or other third parties could subject us to civil or criminal investigations and monetary and injunctive penalties, and could adversely impact our ability to conduct business, our operating results and our reputation.
Given these risks, there is considerable uncertainty regarding the success of our current and future collaborative efforts. If these efforts fail, our product development or commercialization of new products could be delayed or revenues from products could decline and/or we may not realize the anticipated benefits of the collaboration arrangements.
Our results of operations may be adversely affected by current and potential future healthcare reforms.
In the U.S., federal and state legislatures, health agencies and third-party payors continue to focus on containing the cost of health care. Legislative and regulatory proposals, enactments to reform health care insurance programs and increasing pressure from social sources could significantly influence the manner in which our products are prescribed and purchased. For example, provisions of the PPACA have resulted in changes in the way health care is paid for by both governmental and private insurers, including increased rebates owed by manufacturers under the Medicaid Drug Rebate Program, annual fees and taxes on manufacturers of certain branded prescription drugs, the requirement that manufacturers participate in a discount program for certain outpatient drugs under Medicare Part D
40
and the expansion of the number of hospitals eligible for discounts under Section 340B of the PHSA. These changes have had and are expected to continue to have a significant impact on our business.
We may face uncertainties as a result of federal and administrative efforts to repeal, substantially modify or invalidate some or all of the provisions of the PPACA. There is no assurance that the PPACA, as currently enacted or as amended in the future, will not adversely affect our business and financial results, and we cannot predict how future federal or state legislative or administrative changes relating to healthcare reform will affect our business.
The administration has also indicated an intent to address prescription drug pricing and recent Congressional hearings have brought increased public attention to the costs of prescription drugs. These actions and the uncertainty about the future of the PPACA and healthcare laws may put downward pressure on pharmaceutical pricing and increase our regulatory burdens and operating costs.
There is also significant economic pressure on state budgets that may result in states increasingly seeking to achieve budget savings through mechanisms that limit coverage or payment for our drugs. In recent years, some states have considered legislation and ballot initiatives that would control the prices of drugs, including laws to allow importation of pharmaceutical products from lower cost jurisdictions outside the U.S. and laws intended to impose price controls on state drug purchases. State Medicaid programs are increasingly requesting manufacturers to pay supplemental rebates and requiring prior authorization by the state program for use of any drug for which supplemental rebates are not being paid. Government efforts to reduce Medicaid expenses may lead to increased use of managed care organizations by Medicaid programs. This may result in managed care organizations influencing prescription decisions for a larger segment of the population and a corresponding limitation on prices and reimbursement for our products.
In the E.U. and some other international markets, the government provides health care at low cost to consumers and regulates pharmaceutical prices, patient eligibility or reimbursement levels to control costs for the government-sponsored health care system. Many countries have announced or implemented measures, and may in the future implement new or additional measures, to reduce health care costs to limit the overall level of government expenditures. These measures vary by country and may include, among other things, patient access restrictions, suspensions on price increases, prospective and possible retroactive price reductions and other recoupments and increased mandatory discounts or rebates, recoveries of past price increases and greater importation of drugs from lower-cost countries. These measures have negatively impacted our revenues and may continue to adversely affect our revenues and results of operations in the future.
If we fail to comply with the extensive legal and regulatory requirements affecting the health care industry, we could face increased costs, penalties and a loss of business.
Our activities, and the activities of our collaborators, distributors and other third-party providers, are subject to extensive government regulation and oversight both in the U.S. and in foreign jurisdictions. The FDA and comparable agencies in other jurisdictions directly regulate many of our most critical business activities, including the conduct of preclinical and clinical studies, product manufacturing, advertising and promotion, product distribution, adverse event reporting and product risk management. Our interactions in the U.S. or abroad with physicians and other health care providers that prescribe or purchase our products are also subject to government regulation designed to prevent fraud and abuse in the sale and use of products and place significant restrictions on the marketing practices of health care companies. Health care companies such as ours are facing heightened scrutiny of their relationships with health care providers from anti-corruption enforcement officials. In addition, health care companies such as ours have been the target of lawsuits and investigations alleging violations of government regulation, including claims asserting submission of incorrect pricing information, impermissible off-label promotion of pharmaceutical products, payments intended to influence the referral of health care business, submission of false claims for government reimbursement, antitrust violations or violations related to environmental matters. There is also enhanced scrutiny of company-sponsored patient assistance programs, including insurance premium and co-pay assistance programs and donations to third-party charities that provide such assistance. If we, or our vendors or donation recipients, are deemed to fail to comply with relevant laws, regulations or government guidance in the operation of these programs, we could be subject to significant fines or penalties. Risks relating to compliance with laws and regulations may be heightened as we continue to expand our global operations and enter new therapeutic areas with different patient populations, which may have different product distribution methods, marketing programs or patient assistance programs from those we currently utilize or support.
Conditions and regulations governing the health care industry are subject to change, with possible retroactive effect, including:
41
• new laws, regulations or judicial decisions, or new interpretations of existing laws, regulations or judicial decisions, related to health care availability, pricing or marketing practices, compliance with wage and hour laws and other employment practices, method of delivery, payment for health care products and services, compliance with health information and data privacy and security laws and regulations, tracking and reporting payments and other transfers of value made to physicians and teaching hospitals, extensive anti-bribery and anti-corruption prohibitions, product serialization and labeling requirements and used product take-back requirements;
• changes in the FDA and foreign regulatory approval processes that may delay or prevent the approval of new products and result in lost market opportunity;
• U.S. government shutdowns, similar to the one that began in December 2018, may result in delays to the FDA's review and approval process, slowing the time necessary for new drug candidates to be reviewed and/or approved, which may adversely affect our business;
• requirements that provide for increased transparency of clinical trial results and quality data, such as the EMA’s clinical transparency policy, which could impact our ability to protect trade secrets and competitively-sensitive information contained in approval applications or could be misinterpreted leading to reputational damage, misperception or legal action, which could harm our business; and
• changes in FDA and foreign regulations that may require additional safety monitoring, labeling changes, restrictions on product distribution or use or other measures after the introduction of our products to market, which could increase our costs of doing business, adversely affect the future permitted uses of approved products or otherwise adversely affect the market for our products.
Violations of governmental regulation may be punishable by criminal and civil sanctions against us, including fines and civil monetary penalties and exclusion from participation in government programs, including Medicare and Medicaid, as well as against executives overseeing our business. In addition to penalties for violation of laws and regulations, we could be required to repay amounts we received from government payors, or pay additional rebates and interest if we are found to have miscalculated the pricing information we have submitted to the government. We cannot ensure that our compliance controls, policies and procedures will in every instance protect us from acts committed by our employees, collaborators, partners or third-party providers that would violate the laws or regulations of the jurisdictions in which we operate. Whether or not we have complied with the law, an investigation into alleged unlawful conduct could increase our expenses, damage our reputation, divert management time and attention and adversely affect our business.
Our sales and operations are subject to the risks of doing business internationally.
We are increasing our presence in international markets, particularly emerging markets, subjecting us to many risks that could adversely affect our business and revenues, such as:
• the inability to obtain necessary foreign regulatory or pricing approvals of products in a timely manner;
• uncertainties regarding the collectability of accounts receivable;
• fluctuations in foreign currency exchange rates that may adversely impact our revenues, net income and value of certain of our investments;
• difficulties in staffing and managing international operations;
• the imposition of governmental controls;
• less favorable intellectual property or other applicable laws;
• increasingly complex standards for complying with foreign laws and regulations that may differ substantially from country to country and may conflict with corresponding U.S. laws and regulations;
• the far-reaching anti-bribery and anti-corruption legislation in the U.K., including the Bribery Act, and elsewhere and escalation of investigations and prosecutions pursuant to such laws;
• the effects of the implementation of the U.K.’s decision to voluntarily depart from the E.U., known as Brexit;
• compliance with complex import and export control laws;
42
• restrictions on direct investments by foreign entities and trade restrictions;
• greater political or economic instability;
• changes in tax laws; and
• the imposition of tariffs or embargoes and other trade restrictions, including the recent tariffs imposed by the U.S. and China and the possibility of additional tariffs or other trade restrictions relating to trade between the two countries.
In addition, our international operations are subject to regulation under U.S. law. For example, the FCPA prohibits U.S. companies and their representatives from paying, offering to pay, promising to pay or authorizing the payment of anything of value to any foreign government official, government staff member, political party or political candidate for the purpose of obtaining or retaining business or to otherwise obtain favorable treatment or influence a person working in an official capacity. In many countries, the health care professionals we regularly interact with may meet the FCPA's definition of a foreign government official. Failure to comply with domestic or foreign laws could result in various adverse consequences, including: possible delay in approval or refusal to approve a product, recalls, seizures or withdrawal of an approved product from the market, disruption in the supply or availability of our products or suspension of export or import privileges, the imposition of civil or criminal sanctions, the prosecution of executives overseeing our international operations and damage to our reputation. Any significant impairment of our ability to sell products outside of the U.S. could adversely impact our business and financial results.
Management and key personnel changes may disrupt our operations, and we may have difficulty retaining key personnel or attracting and retaining qualified replacements on a timely basis for management and other key personnel who may leave the Company.
We have experienced changes in management and other key personnel in critical functions across our organization in recent years. Changes in management and other key personnel have the potential to disrupt our business, and any such disruption could adversely affect our operations, programs, growth, financial condition or results of operations. Further, new members of management may have different perspectives on programs and opportunities for our business, which may cause us to focus on new business opportunities or reduce or change emphasis on our existing business programs.
Our success is dependent upon our ability to attract and retain qualified management and key personnel in a highly competitive environment. Qualified individuals are in high demand, and we may incur significant costs to attract them, particularly at the executive level. We may face difficulty in attracting and retaining key talent for a number of reasons, including management changes, the underperformance or discontinuation of one or more late stage programs or recruitment by competitors. We cannot ensure you that we will be able to hire or retain the personnel necessary for our operations or that the loss of any such personnel will not have a material impact on our financial condition and results of operations.
We are expanding our manufacturing capacity for future clinical and commercial requirements for product candidates, which will result in the incurrence of significant investment with no assurance that such investment will be recouped.
We believe we currently have sufficient large-scale manufacturing capacity to meet our near-term manufacturing requirements. However, due to the long lead times necessary for the expansion of manufacturing capacity, we are expanding our large molecule production capacity by building a large-scale biologics manufacturing facility in Solothurn, Switzerland with no assurance that the additional capacity will be required. In addition, we have made and expect to make significant investments in connection with the building of this manufacturing facility with no assurance that such investment will be recouped. If we are unable to adequately and timely manufacture and supply our products and product candidates or if we do not fully utilize our manufacturing facilities, our business may be harmed.
Manufacturing issues could substantially increase our costs, limit supply of our products and/or reduce our revenues.
The process of manufacturing our products is complex, highly regulated and subject to numerous risks, including:
• Risks of Reliance on Third Parties and Single Source Providers. We rely on third-party suppliers and manufacturers for many aspects of our manufacturing process for our products and product candidates. In some cases, due to the unique manner in which our products are manufactured, we rely on single source

43
providers of raw materials and manufacturing supplies. These third parties are independent entities subject to their own unique operational and financial risks that are outside of our control. These third parties may not perform their obligations in a timely and cost-effective manner or in compliance with applicable regulations, and they may be unable or unwilling to increase production capacity commensurate with demand for our existing or future products. Finding alternative providers could take a significant amount of time and involve significant expense due to the specialized nature of the services and the need to obtain regulatory approval of any significant changes to our suppliers or manufacturing methods. We cannot be certain that we could reach agreement with alternative providers or that the FDA or other regulatory authorities would approve our use of such alternatives.
• Risks Relating to Compliance with cGMP. We and our third-party providers are generally required to maintain compliance with cGMP and other stringent requirements and are subject to inspections by the FDA and comparable agencies in other jurisdictions to confirm such compliance. Any delay, interruption or other issues that arise in the manufacture, fill-finish, packaging or storage of our products as a result of a failure of our facilities or the facilities or operations of third parties to pass any regulatory agency inspection could significantly impair our ability to develop and commercialize our products. Significant noncompliance could also result in the imposition of monetary penalties or other civil or criminal sanctions and damage our reputation.
• Global Bulk Supply Risks. We rely on our principal manufacturing facilities for the production of drug substance for our large molecule products and product candidates. Our global bulk supply of these products and product candidates depends on the uninterrupted and efficient operation of these facilities, which could be adversely affected by equipment failures, labor shortages, natural disasters, power failures and numerous other factors.
• Risk of Product Loss. The manufacturing process for our products is extremely susceptible to product loss due to contamination, oxidation, equipment failure or improper installation or operation of equipment or vendor or operator error. Even minor deviations from normal manufacturing processes could result in reduced production yields, product defects and other supply disruptions. If microbial, viral or other contaminations are discovered in our products or manufacturing facilities, we may need to close our manufacturing facilities for an extended period of time to investigate and remediate the contaminant.
Any adverse developments affecting our manufacturing operations or the operations of our third-party suppliers and manufacturers may result in shipment delays, inventory shortages, lot failures, product withdrawals or recalls or other interruptions in the commercial supply of our products. We may also have to take inventory write-offs and incur other charges and expenses for products that fail to meet specifications, undertake costly remediation efforts or seek more costly manufacturing alternatives. Such developments could increase our manufacturing costs, cause us to lose revenues or market share as patients and physicians turn to competing therapeutics, diminish our profitability or damage our reputation.
In addition, although we have business continuity plans to reduce the potential for manufacturing disruptions or delays and reduce the severity of a disruptive event, there is no guarantee that these plans will be adequate, which could adversely affect our business and operations.
Our success in commercializing biosimilars developed by Samsung Bioepis is subject to risks and uncertainties inherent in the development, manufacture and commercialization of biosimilars. If Samsung Bioepis is unsuccessful in the development, manufacture and commercialization of biosimilars, we may not realize the anticipated benefits of our investment in Samsung Bioepis.
Our success in commercializing biosimilars developed by Samsung Bioepis is subject to a number of risks, including:
• Reliance on Third Parties. We are dependent on the efforts of Samsung Bioepis and other third parties over whom we have limited or no control in the development and manufacturing of biosimilars products. If Samsung Bioepis or such other third parties fail to perform successfully, we may not realize the anticipated benefits of our investment in Samsung Bioepis;
• Regulatory Compliance. Biosimilar products may face regulatory hurdles or delays due to the evolving and uncertain regulatory and commercial pathway of biosimilars products in certain jurisdictions;
• Intellectual Property and Regulatory Challenges. Biosimilar products may face extensive patent clearances, patent infringement litigation, injunctions or regulatory challenges, which could prevent the commercial
44
launch of a product or delay it for many years or result in imposition of monetary damages, penalties or other civil sanctions and damage our reputation;
• Failure to Gain Market and Patient Acceptance. Market success of biosimilar products will be adversely affected if patients, physicians and/or payors do not accept biosimilar products as safe and efficacious products offering a more competitive price or other benefit over existing therapies;
• Ability to Provide Adequate Supply. Manufacturing biosimilars is complex. If we encounter any manufacturing or supply chain difficulties, we may be unable to meet higher than anticipated demand; and
• Competitive Challenges. Biosimilar products face significant competition, including from innovator products and from biosimilar products offered by other companies. In some jurisdictions, local tendering processes may restrict biosimilar products from being marketed and sold in those jurisdictions. The number of competitors in a jurisdiction, the timing of approval and the ability to market biosimilar products successfully in a timely and cost-effective manner are additional factors that may impact our success and/or the success of Samsung Bioepis in this business area.
If Samsung Bioepis is unsuccessful in the development, manufacture and commercialization of biosimilar products, we may not realize the anticipated benefits of our investment in Samsung Bioepis.
In addition, as Samsung Bioepis is a privately-held entity, our ability to liquidate our investment in Samsung Bioepis, may be limited and we may realize significantly less than the value of such investment.
Our operating results are subject to significant fluctuations.
Our quarterly revenues, expenses and net income (loss) have fluctuated in the past and are likely to fluctuate significantly in the future due to the risks described in these Risk Factors as well as the timing of charges and expenses that we may take. We have recorded, or may be required to record, charges that include:
• the cost of restructurings or other initiatives to streamline our operations and reallocate resources;
• impairments with respect to investments, fixed assets and long-lived assets, including in-process R&D and other intangible assets;
• inventory write-downs for failed quality specifications, charges for excess or obsolete inventory and charges for inventory write downs relating to product suspensions, expirations or recalls;
• changes in the fair value of contingent consideration;
• bad debt expenses and increased bad debt reserves;
• outcomes of litigation and other legal or administrative proceedings, regulatory matters and tax matters;
• milestone payments under license and collaboration agreements; and
• payments in connection with acquisitions and other business development activities.
Our revenues and certain assets and liabilities are also subject to foreign currency exchange rate fluctuations due to the global nature of our operations. Although we have foreign currency forward contracts to hedge specific forecasted transactions denominated in foreign currencies, our efforts to mitigate the impact of fluctuating currency exchange rates may not be successful. As a result, currency fluctuations among our reporting currency, the U.S. dollar, and other currencies in which we do business will affect our operating results, often in unpredictable ways. Our net income may also fluctuate due to the impact of charges we may be required to take with respect to foreign currency hedge transactions. In particular, we may incur higher than expected charges from early termination of a hedge relationship.
Our operating results during any one period do not necessarily suggest the anticipated results of future periods.
Our effective tax rate fluctuates, and we may incur obligations in tax jurisdictions in excess of accrued amounts.
As a global biopharmaceutical company, we are subject to taxation in numerous countries, states and other jurisdictions. As a result, our effective tax rate is derived from a combination of applicable tax rates in the various places that we operate. In preparing our financial statements, we estimate the amount of tax that will become payable in each of such places. Our effective tax rate, however, may be different than experienced in the past due to numerous factors, including changes in the mix of our profitability from country to country, the results of
45
examinations and audits of our tax filings, adjustments to the value of our uncertain tax positions, changes in accounting for income taxes and changes in tax laws, including the Tax Cuts and Jobs Act of 2017 (2017 Tax Act). Any of these factors could cause us to experience an effective tax rate significantly different from previous periods or our current expectations.
In addition, our inability to secure or sustain acceptable arrangements with tax authorities and future changes in the tax laws, among other things, may result in tax obligations in excess of amounts accrued in our financial statements.
The 2017 Tax Act resulted in significant changes to the U.S. corporate income tax system. These changes include a federal statutory rate reduction from 35% to 21%, the elimination or reduction of certain domestic deductions and credits and limitations on the deductibility of interest expense and executive compensation. The 2017 Tax Act also transitions international taxation from a worldwide system to a modified territorial system, which has the effect of subjecting certain earnings of our foreign subsidiaries to U.S. taxation as global intangible low-taxed income (GILTI), and includes base erosion prevention measures on non-U.S. earnings. These changes became effective in 2018.
The 2017 Tax Act also includes a one-time mandatory deemed repatriation tax on accumulated foreign subsidiaries' previously untaxed foreign earnings (the Transition Toll Tax). The Transition Toll Tax will be paid in installments over an eight-year period, which started in 2018, and will not accrue interest.
Our estimates concerning the impact of the 2017 Tax Act on our accounting and on our business remain subject to developing interpretations of the provisions of the 2017 Tax Act and changes to certain estimates and amounts related to the earnings and profits of certain subsidiaries. U.S. Treasury regulations, administrative interpretations or court decisions interpreting the 2017 Tax Act may require further adjustments and changes in our estimates, which could have a material adverse effect on our business, results of operations or financial condition.
In addition, the adoption of some or all of the recommendations set forth in the Organization for Economic Cooperation and Development’s project on “Base Erosion and Profit Shifting” (BEPS) by tax authorities in the countries in which we operate, could negatively impact our effective tax rate. These recommendations focus on payments from affiliates in high tax jurisdictions to affiliates in lower tax jurisdictions and the activities that give rise to a taxable presence in a particular country.
Our investments in properties may not be fully realized.
We own or lease real estate primarily consisting of buildings that contain research laboratories, office space and manufacturing operations. For strategic or other operational reasons, we may decide to consolidate or co-locate certain aspects of our business operations or dispose of one or more of our properties, some of which may be located in markets that are experiencing high vacancy rates and decreasing property values. If we determine that the fair value of any of our owned properties is lower than their book value, we may not realize the full investment in these properties and incur significant impairment charges or additional depreciation when the expected useful lives of certain assets have been shortened due to the anticipated closing of facilities. If we decide to fully or partially vacate an owned or leased property, we may incur significant cost, including facility closing costs, employee separation and retention expenses, lease termination fees, rent expense in excess of sublease income and impairment of leasehold improvements and accelerated depreciation of assets. Any of these events may have an adverse impact on our results of operations.
Our portfolio of marketable securities is subject to market, interest and credit risk that may reduce its value.
We maintain a portfolio of marketable securities for investment of our cash. Changes in the value of our portfolio of marketable securities could adversely affect our earnings. In particular, the value of our investments may decline due to increases in interest rates, downgrades of the bonds and other securities included in our portfolio, instability in the global financial markets that reduces the liquidity of securities included in our portfolio, declines in the value of collateral underlying the securities included in our portfolio and other factors. Each of these events may cause us to record charges to reduce the carrying value of our investment portfolio or sell investments for less than our acquisition cost. Although we attempt to mitigate these risks through diversification of our investments and continuous monitoring of our portfolio's overall risk profile, the value of our investments may nevertheless decline.
There can be no assurance that we will continue to repurchase shares or that we will repurchase shares at favorable prices.
From time to time our Board of Directors authorizes share repurchase programs, including most recently our 2018 Share Repurchase Program, which is a program to repurchase up to $3.5 billion of our common stock that was
46
authorized by our Board of Directors in August 2018. The amount and timing of share repurchases are subject to capital availability and our determination that share repurchases are in the best interest of our shareholders and are in compliance with all respective laws and our agreements applicable to the repurchase of shares. Our ability to repurchase shares will depend upon, among other factors, our cash balances and potential future capital requirements for strategic transactions, our results of operations, our financial condition and other factors beyond our control that we may deem relevant. A reduction in repurchases under, or the completion of, our 2018 Share Repurchase Program could have a negative effect on our stock price. We can provide no assurance that we will repurchase shares at favorable prices, if at all.
We may not be able to access the capital and credit markets on terms that are favorable to us.
We may seek access to the capital and credit markets to supplement our existing funds and cash generated from operations for working capital, capital expenditure and debt service requirements and other business initiatives. The capital and credit markets have experienced extreme volatility and disruption in the past, which leads to uncertainty and liquidity issues for both borrowers and investors. In the event of adverse capital and credit market conditions, we may be unable to obtain capital or credit market financing on favorable terms. Changes in credit ratings issued by nationally recognized credit rating agencies could also adversely affect our cost of financing and the market price of our securities.
Our indebtedness could adversely affect our business and limit our ability to plan for or respond to changes in our business.
Our indebtedness, together with our significant contingent liabilities, including milestone and royalty payment obligations, could have important consequences to our business; for example, such obligations could:
• increase our vulnerability to general adverse economic and industry conditions;
• limit our ability to access capital markets and incur additional debt in the future;
• require us to dedicate a substantial portion of our cash flow from operations to payments on our indebtedness, thereby reducing the availability of our cash flow for other purposes, including business development efforts, research and development and mergers and acquisitions; and
• limit our flexibility in planning for, or reacting to, changes in our business and the industry in which we operate, thereby placing us at a competitive disadvantage compared to our competitors that have less debt.
Our business involves environmental risks, which include the cost of compliance and the risk of contamination or injury.
Our business and the business of several of our strategic partners involve the controlled use of hazardous materials, chemicals, biologics and radioactive compounds. Although we believe that our safety procedures for handling and disposing of such materials comply with state, federal and foreign standards, there will always be the risk of accidental contamination or injury. If we were to become liable for an accident, or if we were to suffer an extended facility shutdown, we could incur significant costs, damages and penalties that could harm our business. Manufacturing of our products and product candidates also requires permits from government agencies for water supply and wastewater discharge. If we do not obtain appropriate permits, including permits for sufficient quantities of water and wastewater, we could incur significant costs and limits on our manufacturing volumes that could harm our business.
The illegal distribution and sale by third parties of counterfeit or unfit versions of our products or stolen products could have a negative impact on our reputation and business.
Third parties might illegally distribute and sell counterfeit or unfit versions of our products, which do not meet our rigorous manufacturing, distribution and testing standards. A patient who receives a counterfeit or unfit drug may be at risk for a number of dangerous health consequences. Our reputation and business could suffer harm as a result of counterfeit or unfit drugs sold under our brand name. In addition, inventory that is stolen from warehouses, plants or while in-transit, and that is subsequently improperly stored and sold through unauthorized channels, could adversely impact patient safety, our reputation and our business.
The increasing use of social media platforms presents new risks and challenges.
Social media is increasingly being used to communicate about our products and the diseases our therapies are designed to treat. Social media practices in the biopharmaceutical industry continue to evolve and regulations
47
relating to such use are not always clear. This evolution creates uncertainty and risk of noncompliance with regulations applicable to our business. For example, patients may use social media channels to comment on the effectiveness of a product or to report an alleged adverse event. When such disclosures occur, there is a risk that we fail to monitor and comply with applicable adverse event reporting obligations or we may not be able to defend the company or the public's legitimate interests in the face of the political and market pressures generated by social media due to restrictions on what we may say about our products. There is also a risk of inappropriate disclosure of sensitive information or negative or inaccurate posts or comments about us on any social networking website. If any of these events were to occur or we otherwise fail to comply with applicable regulations, we could incur liability, face overly restrictive regulatory actions or incur other harm to our business.
Some of our collaboration agreements contain change in control provisions that may discourage a third party from attempting to acquire us.
Some of our collaboration agreements include change in control provisions that could reduce the potential acquisition price an acquirer is willing to pay or discourage a takeover attempt that could be viewed as beneficial to shareholders. Upon a change in control, some of these provisions could trigger reduced milestone, profit or royalty payments to us or give our collaboration partner rights to terminate our collaboration agreement, acquire operational control or force the purchase or sale of the programs that are the subject of the collaboration.
We may be exposed to claims and liabilities as a result of the spin-off of our hemophilia business.
On February 1, 2017, in connection with the spin-off of our hemophilia business, we distributed all of the then outstanding shares of Bioverativ Inc. (Bioverativ) common stock to Biogen shareholders pursuant to a separation agreement. In March 2018 Bioverativ was acquired by Sanofi and is now an indirect wholly-owned subsidiary of Sanofi.
The spin-off of our hemophilia business was intended to qualify for tax-free treatment to Biogen and its shareholders under the Internal Revenue Code. Completion of the spin-off was conditioned upon, among other things, our receipt of a favorable opinion from our tax advisors with respect to the tax-free nature of the transaction. The opinion is not binding on the U.S. Internal Revenue Service (IRS) or the courts, and there can be no assurance that the IRS or the courts will not challenge the qualification of the spin-off as a tax-free transaction or that any such challenge would not prevail. If the spin-off is determined to be taxable, the full financial benefits expected to result from the separation may not be achieved and/or Biogen and its shareholders could incur significant tax liabilities, which could adversely affect our business, financial condition or results of operations and the value of our stock could be adversely impacted.
Bioverativ agreed to indemnify us for certain potential liabilities that may arise, but we cannot guarantee that Bioverativ will be able to satisfy its indemnification obligations. Third parties could also seek to hold us responsible for any of these liabilities or obligations, and the indemnity rights we have under the separation agreement may not be sufficient to fully cover all of these liabilities and obligations. Even if we are successful in obtaining indemnification, we may have to bear costs temporarily. In addition, our indemnity obligations to Bioverativ may be significant. These risks could negatively affect our business, financial condition or results of operations.
Item 1B. Unresolved Staff CommentsNone.
Item 2. PropertiesBelow is a summary of our owned and leased properties as of December 31, 2018.
Massachusetts
In Cambridge, MA, we own approximately 508,000 square feet of real estate space, consisting of a building that houses a research laboratory and a cogeneration plant totaling approximately 263,000 square feet and a building that contains research, development and quality laboratories totaling approximately 245,000 square feet.
In addition, we lease a total of approximately 1,157,000 square feet in Massachusetts, which is summarized as follows:
• 800,000 square feet in Cambridge, MA, which is comprised of offices for our corporate headquarters, and other administrative and development functions and laboratories, of which 289,000 square feet is subleased by multiple companies for general office space, laboratories and manufacturing facilities; and
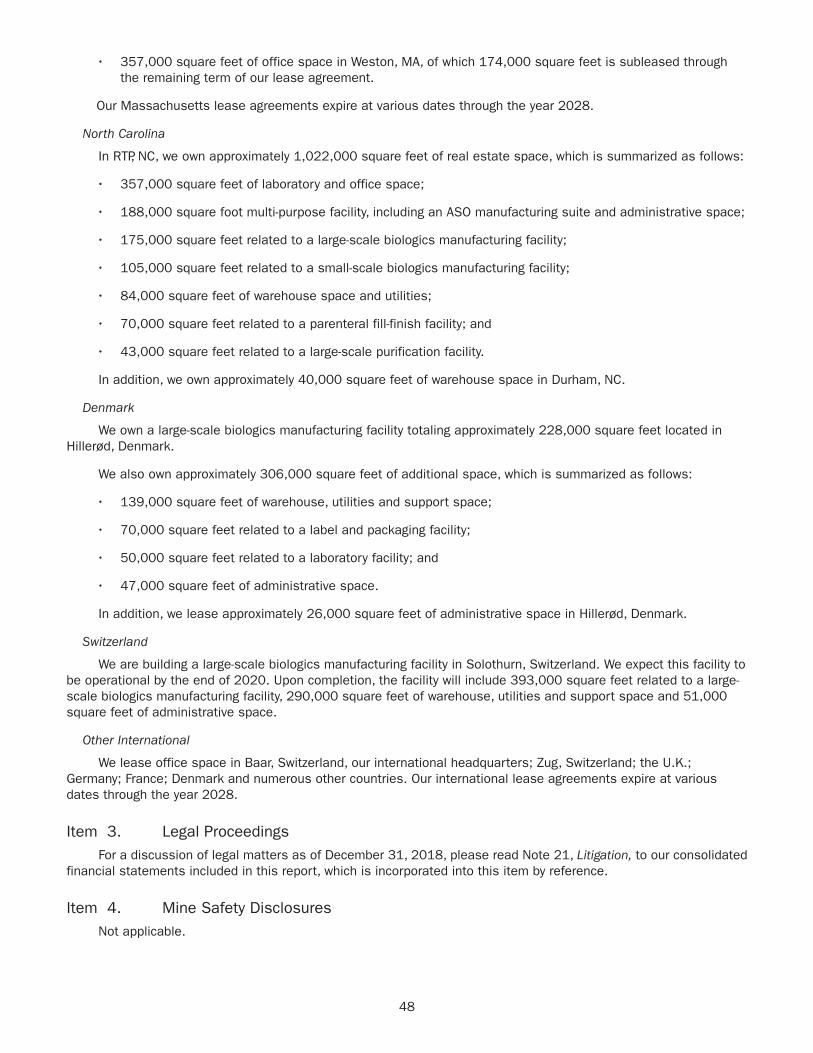
48
• 357,000 square feet of office space in Weston, MA, of which 174,000 square feet is subleased through the remaining term of our lease agreement.
Our Massachusetts lease agreements expire at various dates through the year 2028.
North Carolina
In RTP, NC, we own approximately 1,022,000 square feet of real estate space, which is summarized as follows:
• 357,000 square feet of laboratory and office space;
• 188,000 square foot multi-purpose facility, including an ASO manufacturing suite and administrative space;
• 175,000 square feet related to a large-scale biologics manufacturing facility;
• 105,000 square feet related to a small-scale biologics manufacturing facility;
• 84,000 square feet of warehouse space and utilities;
• 70,000 square feet related to a parenteral fill-finish facility; and
• 43,000 square feet related to a large-scale purification facility.
In addition, we own approximately 40,000 square feet of warehouse space in Durham, NC.
Denmark
We own a large-scale biologics manufacturing facility totaling approximately 228,000 square feet located in Hillerød, Denmark.
We also own approximately 306,000 square feet of additional space, which is summarized as follows:
• 139,000 square feet of warehouse, utilities and support space;
• 70,000 square feet related to a label and packaging facility;
• 50,000 square feet related to a laboratory facility; and
• 47,000 square feet of administrative space.
In addition, we lease approximately 26,000 square feet of administrative space in Hillerød, Denmark.
Switzerland
We are building a large-scale biologics manufacturing facility in Solothurn, Switzerland. We expect this facility to be operational by the end of 2020. Upon completion, the facility will include 393,000 square feet related to a large-scale biologics manufacturing facility, 290,000 square feet of warehouse, utilities and support space and 51,000 square feet of administrative space.
Other International
We lease office space in Baar, Switzerland, our international headquarters; Zug, Switzerland; the U.K.; Germany; France; Denmark and numerous other countries. Our international lease agreements expire at various dates through the year 2028.
Item 3. Legal ProceedingsFor a discussion of legal matters as of December 31, 2018, please read Note 21, Litigation, to our consolidated
financial statements included in this report, which is incorporated into this item by reference.
Item 4. Mine Safety DisclosuresNot applicable.
49
PART IIItem 5. Market for Registrant’s Common Equity, Related Stockholder Matters and Issuer Purchases of Equity Securities
Market and Stockholder InformationOur common stock trades on The Nasdaq Global Select Market under the symbol “BIIB.” As of February 1,
2019, there were approximately 600 shareholders of record of our common stock.
DividendsWe have not paid cash dividends since our inception. While we historically have not paid cash dividends and do
not have a current intention to pay cash dividends, we continually review our capital allocation strategies, including, among other things, payment of cash dividends, share repurchases and acquisitions.
Issuer Purchases of Equity Securities The following table summarizes our common stock repurchase activity under our 2018 Share Repurchase
Program during the fourth quarter of 2018:
Period
Total Number ofShares Purchased
(#)
Average PricePaid per Share
($)
Total Number ofShares Purchasedas Part of Publicly
Announced Programs(#)
MaximumApproximate Dollar Value
of Shares That May Yet BePurchased Under
Our Programs ($ in millions)
October 2018 .......... 762,633 $ 309.42 762,633 $ 3,264.0November 2018....... 1,809,120 $ 317.55 1,809,120 $ 2,689.5December 2018....... 1,774,138 $ 305.59 1,774,138 $ 2,147.4Total...................... 4,345,891 $ 311.24
In August 2018 our Board of Directors authorized our 2018 Share Repurchase Program, which is a program to repurchase up to $3.5 billion of our common stock. Our 2018 Share Repurchase program does not have an expiration date. All share repurchases under our 2018 Share Repurchase Program will be retired. Under our 2018 Share Repurchase Program, we repurchased and retired approximately 4.3 million shares of our common stock at a cost of approximately $1.4 billion during the year ended December 31, 2018.
In July 2016 our Board of Directors authorized a program to repurchase up to $5.0 billion of our common stock (2016 Share Repurchase Program), which was completed as of June 30, 2018. All share repurchases under our 2016 Share Repurchase Program were retired. Under our 2016 Share Repurchase Program, we repurchased and retired approximately 10.5 million, 3.7 million and 3.3 million shares of common stock at a cost of approximately $3.0 billion, $1.0 billion and $1.0 billion during the years ended December 31, 2018, 2017 and 2016, respectively.
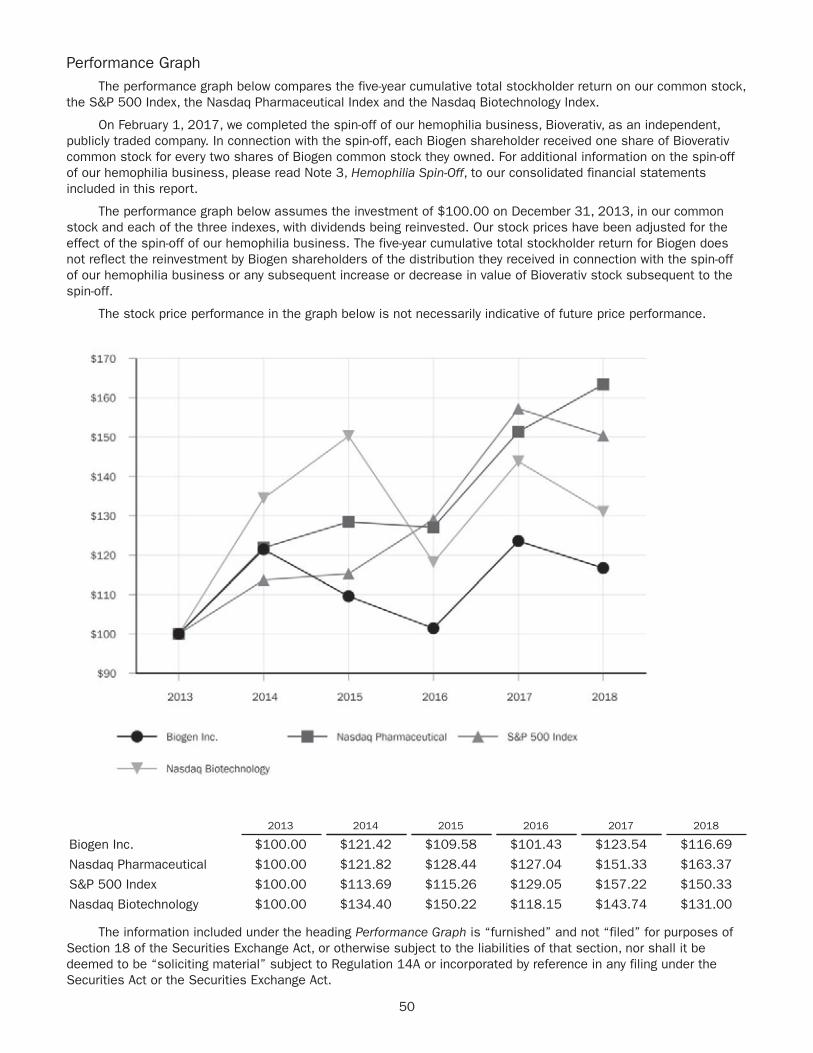
50
Performance GraphThe performance graph below compares the five-year cumulative total stockholder return on our common stock,
the S&P 500 Index, the Nasdaq Pharmaceutical Index and the Nasdaq Biotechnology Index.
On February 1, 2017, we completed the spin-off of our hemophilia business, Bioverativ, as an independent, publicly traded company. In connection with the spin-off, each Biogen shareholder received one share of Bioverativ common stock for every two shares of Biogen common stock they owned. For additional information on the spin-off of our hemophilia business, please read Note 3, Hemophilia Spin-Off, to our consolidated financial statements included in this report.
The performance graph below assumes the investment of $100.00 on December 31, 2013, in our common stock and each of the three indexes, with dividends being reinvested. Our stock prices have been adjusted for the effect of the spin-off of our hemophilia business. The five-year cumulative total stockholder return for Biogen does not reflect the reinvestment by Biogen shareholders of the distribution they received in connection with the spin-off of our hemophilia business or any subsequent increase or decrease in value of Bioverativ stock subsequent to the spin-off.
The stock price performance in the graph below is not necessarily indicative of future price performance.
2013 2014 2015 2016 2017 2018
Biogen Inc. $100.00 $121.42 $109.58 $101.43 $123.54 $116.69
Nasdaq Pharmaceutical $100.00 $121.82 $128.44 $127.04 $151.33 $163.37
S&P 500 Index $100.00 $113.69 $115.26 $129.05 $157.22 $150.33
Nasdaq Biotechnology $100.00 $134.40 $150.22 $118.15 $143.74 $131.00
The information included under the heading Performance Graph is “furnished” and not “filed” for purposes of Section 18 of the Securities Exchange Act, or otherwise subject to the liabilities of that section, nor shall it be deemed to be “soliciting material” subject to Regulation 14A or incorporated by reference in any filing under the Securities Act or the Securities Exchange Act.
51
Item 6. Selected Financial Data
BIOGEN INC. AND SUBSIDIARIESSELECTED FINANCIAL DATA
Our results of operations are summarized as follows: For the Years Ended December 31,
2018 2017 2016 2015 2014
(In millions, except per share amounts) (a) (b) (c) (d) (e) (c) (d) (e) (f) (e)
Results of Operations (1)Product revenues, net (2) ................................. $ 10,886.8 $10,354.7 $ 9,817.9 $ 9,188.5 $ 8,203.4Revenues from anti-CD20 therapeutic programs 1,980.2 1,559.2 1,314.5 1,339.2 1,195.4Other revenues................................................ 585.9 360.0 316.4 236.1 304.5
Total revenues........................................... 13,452.9 12,273.9 11,448.8 10,763.8 9,703.3Total cost and expenses................................... 7,564.3 6,928.1 6,297.1 5,872.8 5,747.7Gain on sale of rights....................................... — — — — 16.8Income from operations ................................... 5,888.6 5,345.8 5,151.7 4,891.0 3,972.4Other income (expense), net............................. 11.0 (217.0) (218.7) (123.7) (25.8)Income before income tax expense and equityin loss of investee, net of tax............................ 5,899.6 5,128.8 4,933.0 4,767.3 3,946.6Income tax expense......................................... 1,425.6 2,458.7 1,237.3 1,161.6 989.9Equity in loss of investee, net of tax.................. — — — 12.5 15.1Net income ..................................................... 4,474.0 2,670.1 3,695.7 3,593.2 2,941.6Net income (loss) attributable to noncontrollinginterests, net of tax (3) .................................... 43.3 131.0 (7.1) 46.2 6.8Net income attributable to Biogen Inc................ $ 4,430.7 $ 2,539.1 $ 3,702.8 $ 3,547.0 $ 2,934.8
Diluted Earnings Per Share (4)Diluted earnings per share attributable toBiogen Inc....................................................... $ 21.58 $ 11.92 $ 16.93 $ 15.34 $ 12.37Weighted-average shares used in calculatingdiluted earnings per share attributable toBiogen Inc....................................................... 205.3 213.0 218.8 231.2 237.2
Our financial condition is summarized as follows:As of December 31,
(In millions) 2018 2017 2016 2015 2014
Financial Condition (1)Cash, cash equivalents and marketablesecurities........................................................ $ 4,913.9 $ 6,746.3 $ 7,724.5 $ 6,188.9 $ 3,316.0Total assets .................................................... $ 25,288.9 $23,652.6 $22,876.8 $19,504.8 $14,314.7Notes payable, less current portion (5).............. $ 5,936.5 $ 5,935.0 $ 6,512.7 $ 6,521.5 $ 580.3Total Biogen Inc. shareholders’ equity (4) .......... $ 13,039.6 $12,612.8 $12,140.1 $ 9,372.8 $10,809.0
In addition to the following notes, the financial data included within the tables above should be read in conjunction with our consolidated financial statements and related notes and Item 7. Management’s Discussion and Analysis of Financial Condition and Results of Operations included in this report and our previously filed Annual Reports on Form 10-K.
(1) On February 1, 2017, we completed the spin-off of our hemophilia business. Our consolidated results of operations and financial position reflect the financial results of our hemophilia business for all periods through January 31, 2017.
(2) Product revenues, net reflect the impact of the following product launches:
52
• Commercial sales of SPINRAZA in the U.S. began in the fourth quarter of 2016 and in rest of world markets beginning in the first quarter of 2017.
• Under our collaboration agreement with AbbVie, we began to recognize revenues on sales of ZINBRYTA to third parties in the E.U. in the third quarter of 2016. In March 2018 we and AbbVie announced the voluntary worldwide withdrawal of ZINBRYTA for RMS.
• Under our commercial agreement with Samsung Bioepis, we began to recognize revenues on sales of BENEPALI and FLIXABI to third parties in the E.U. in the first and third quarters of 2016, respectively, and began to recognize revenues on sales of IMRALDI to third parties in the E.U. in the fourth quarter of 2018.
• Commercial sales of ALPROLIX commenced in the second quarter of 2014 and commercial sales of ELOCTATE and PLEGRIDY commenced in the third quarter of 2014. We stopped recognizing product revenues from ALPROLIX and ELOCTATE effective February 1, 2017,upon the completion of the spin-off of our hemophilia business.
(3) Net income (loss) attributable to noncontrolling interests, net of tax includes the following activity:
• Pre-tax charges of $50.0 million and $150.0 million for the years ended December 31, 2018 and 2017, respectively, for payments made under the terms of the Neurimmune Agreement in exchange for reductions in the previously negotiated royalty rates payable on products developed under the Neurimmune Agreement, including royalties payable on potential commercial sales of aducanumab.
• A pre-tax charge of $60.0 million for the year ended December 31, 2015, for a milestone payment due to Neurimmune upon the enrollment of the first patient in a Phase 3 study for aducanumab.
For additional information on our collaboration arrangement with Neurimmune, please read Note 20, Investments in Variable Interest Entities, to our consolidated financial statements included in this report.
(4) Total Biogen Inc. shareholders' equity reflects the repurchase of approximately 40.0 million shares of our common stock at a cost of approximately $11.7 billion between December 31, 2014 and December 31, 2018:
• During 2018 we repurchased and retired approximately 4.3 million and 10.5 million shares of our common stock at a cost of approximately $1.4 billion and $3.0 billion under our 2018 and 2016 Share Repurchase Programs, respectively.
• During 2017 we repurchased and retired approximately 3.7 million shares of our common stock at a cost of approximately $1.0 billion under our 2016 Share Repurchase Program.
• During 2017 we repurchased approximately 1.2 million shares of our common stock at a cost of $365.4 million under a program authorized by our Board of Directors in February 2011 for the repurchase of up to 20.0 million shares of our common stock (2011 Share Repurchase Program).
• During 2016 we repurchased and retired approximately 3.3 million shares of our common stock at a cost of approximately $1.0 billion under our 2016 Share Repurchase Program.
• During 2015 we repurchased and retired approximately 16.8 million shares of our common stock at a cost of $5.0 billion under a program authorized by our Board of Directors in May 2015 for the repurchase of up to $5.0 billion of our common stock.
(5) Notes payable, less current portion reflect:
• Our 2017 repayment of our 6.875% Senior Notes that were issued in 2008 with an aggregate principal amount of $550.0 million; and
• The issuance of our senior unsecured notes for an aggregate principal amount of $6.0 billion in September 2015.
(a) Total cost and expenses for the year ended December 31, 2018, includes a pre-tax charge to research and development expense of $486.2 million upon the closing of the 2018 Ionis Agreement. Included in this amount was a charge of $162.1 million reflecting the premium paid above fair value for the purchase of approximately 11.5 million shares of Ionis' common stock upon the closing of the 2018 Ionis Agreement. This charge is partially offset by net gains totaling $100.9 million recognized in other income (expense), net for the year ended December 31, 2018, related to these shares. For further information on our collaboration arrangements with Ionis, please read Note 19, Collaborative and Other Relationships, to our consolidated financial statements included in this report.
(b) Total cost and expenses for the year ended December 31, 2018, includes the impact of impairment charges totaling $189.3 million related to certain in-process research and development (IPR&D) assets associated with our vixotrigine (BIIB074) program.
(c) Total cost and expenses for the year ended December 31, 2018, includes pre-tax charges to acquired IPR&D totaling $112.5 million for upfront payments made to AliveGen, Pfizer and Karyopharm upon the closing of our asset purchase
53
transactions for BIIB110, BIIB104 and BIIB100, respectively, as the underlying assets had not yet reached technological feasibility.
Total cost and expenses for the year ended December 31, 2017, includes a pre-tax charge to acquired IPR&D of $120.0 million for an upfront payment made to Remedy Pharmaceuticals Inc. (Remedy) upon the closing of our asset purchase transaction for BIIB093 in LHI.
(d) Income tax expense for the year ended December 31, 2017, includes a $1,173.6 million provisional estimate pursuant to SEC Staff Accounting Bulletin No. 118. Our provisional estimate included an amount of $989.6 million associated with the Transition Toll Tax and $184.0 million related to the impact of remeasuring our deferred tax balances to reflect the new federal statutory rate and other changes to U.S. tax law.
Income tax expense for the year ended December 31, 2018, reflects a net increase to expense of approximately $125.0 million recognized upon finalization of our provisional estimates related to the Transition Toll Tax, the remeasurement of our deferred tax assets and liabilities, the impact of electing to record deferred taxes on GILTI and other aspects of the 2017 Tax Act. For additional information on the 2017 Tax Act, please read Note 17, Income Taxes, to our consolidated financial statements included in this report.
(e) Total cost and expenses for the year ended December 31, 2016, includes a pre-tax charge of $454.8 million related to our January 2017 settlement and license agreement with Forward Pharma A/S (Forward Pharma).
Total cost and expenses for the years ended December 31, 2018 and 2017, includes $176.8 million and $328.2 million, respectively, of impairment charges related to our intangible asset associated with our U.S. license to Forward Pharma’s intellectual property, including Forward Pharma's intellectual property related to TECFIDERA. For additional information on our settlement and license agreement with Forward Pharma and related intangible assets, please read Note 7, Intangible Assets and Goodwill, to our consolidated financial statements included in this report.
(f) Total cost and expenses for the year ended December 31, 2017, includes pre-tax charge of $300.0 million for an upfront payment made to BMS upon entering into our agreement to exclusively license BIIB092 and a pre-tax charge of $60.0 million for a development milestone that became payable to the former shareholders of iPierian, Inc. (iPierian) upon the dosing of the first patient in the Phase 2 study of BIIB092 for PSP.
54
Item 7. Management’s Discussion and Analysis of Financial Condition and Results of Operations
The following discussion should be read in conjunction with our consolidated financial statements and the accompanying notes beginning on page F-1 of this report.
Executive Summary
Introduction
Biogen is a global biopharmaceutical company focused on discovering, developing and delivering worldwide innovative therapies for people living with serious neurological and neurodegenerative diseases, including in our core growth areas of MS and neuroimmunology, AD and dementia, movement disorders, including Parkinson's disease, and neuromuscular disorders, including SMA and ALS. We are also focused on discovering, developing and delivering worldwide innovative therapies in our emerging growth areas of acute neurology, neurocognitive disorders, pain and ophthalmology. In addition, we are employing innovative technologies to discover potential treatments for rare and genetic disorders, including new ways of treating diseases through gene therapy in our core and emerging growth areas. We also manufacture and commercialize biosimilars of advanced biologics.
Our marketed products include TECFIDERA, AVONEX, PLEGRIDY, TYSABRI and FAMPYRA for the treatment of MS, SPINRAZA for the treatment of SMA and FUMADERM for the treatment of severe plaque psoriasis. We also have certain business and financial rights with respect to RITUXAN for the treatment of non-Hodgkin's lymphoma, CLL and other conditions, RITUXAN HYCELA for the treatment of non-Hodgkin's lymphoma and CLL, GAZYVA for the treatment of CLL and follicular lymphoma, OCREVUS for the treatment of PPMS and RMS and other potential anti-CD20 therapies pursuant to our collaboration arrangements with Genentech. For additional information on our collaboration arrangements with Genentech, please read Note 19, Collaborative and Other Relationships, to our consolidated financial statements included in this report.
Our revenues depend upon continued sales of our principal products, as well as the financial rights we have in our anti-CD20 therapeutic programs, and, unless we develop, acquire rights to and/or commercialize new products and technologies, we will be substantially dependent on sales from our principal products and our financial rights in our anti-CD20 therapeutic programs for many years.
In the longer term, our revenue growth will depend upon the successful clinical development, regulatory approval and launch of new commercial products as well as additional indications for our existing products, our ability to obtain and maintain patents and other rights related to our marketed products, assets originating from our research and development efforts and/or successful execution of external business development opportunities.
Our innovative drug development and commercialization activities are complemented by our biosimilar products that expand access to medicines and reduce the cost burden for healthcare systems. We are leveraging our manufacturing capabilities and know-how to develop, manufacture and market biosimilar products through Samsung Bioepis, our joint venture with Samsung BioLogics. Under our commercial agreement, we market and sell BENEPALI, an etanercept biosimilar referencing ENBREL, FLIXABI, an infliximab biosimilar referencing REMICADE, and IMRALDI, an adalimumab biosimilar referencing HUMIRA, in the E.U. For additional information on our collaboration arrangement with Samsung Bioepis, please read Note 19, Collaborative and Other Relationships, to our consolidated financial statements included in this report.
Hemophilia Spin-Off
On February 1, 2017, we completed the spin-off of our hemophilia business, Bioverativ, as an independent publicly traded company. Our consolidated results of operations and financial position included in our consolidated financial statements reflect the financial results of our hemophilia business for all periods through January 31, 2017. For additional information on the spin-off of our hemophilia business, please read Note 3, Hemophilia Spin-Off, to our consolidated financial statements included in this report.
Business Environment
The biopharmaceutical industry and the markets in which we operate are intensely competitive. Many of our competitors are working to develop or have commercialized products similar to those we market or are developing and have considerable experience in undertaking clinical trials and in obtaining regulatory approval to market pharmaceutical products. In addition, the commercialization of certain of our own approved MS products, products of our collaborators and pipeline product candidates may negatively impact future sales of our existing MS products. Our products may also face increased competitive pressures from the introduction of generic versions, prodrugs of existing therapies, biosimilars of existing products, other products approved under alternative regulatory pathways and other technologies.
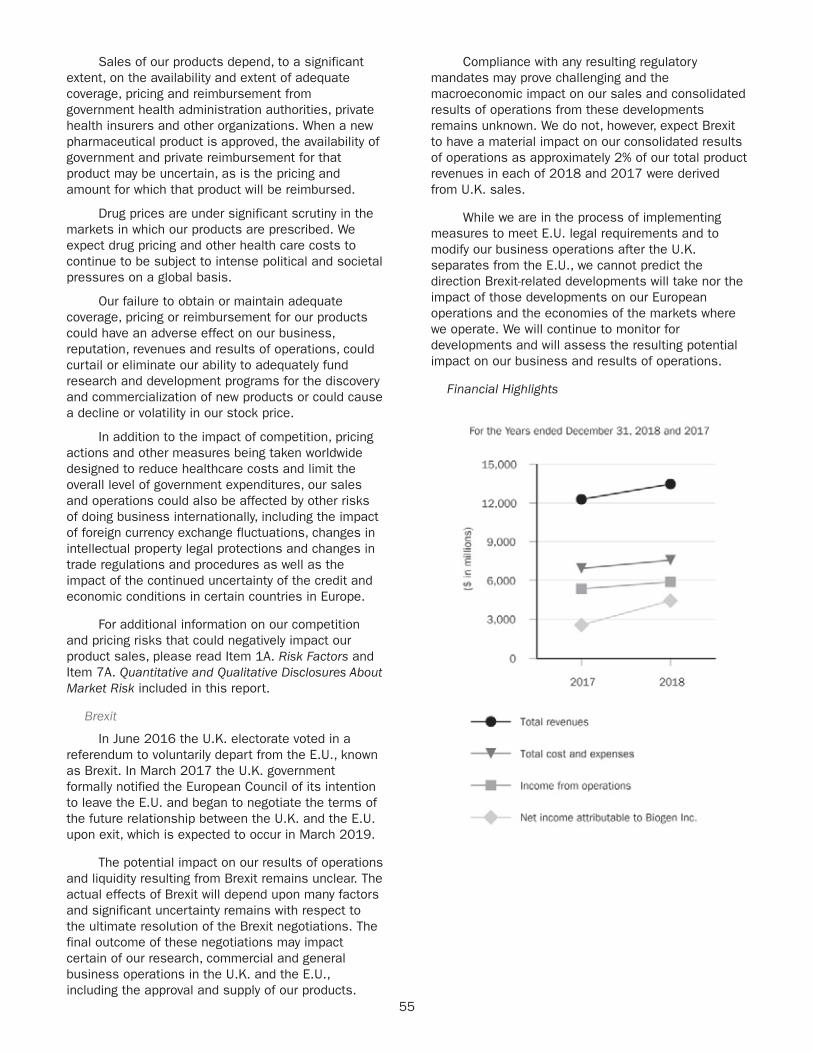
55
Sales of our products depend, to a significant extent, on the availability and extent of adequate coverage, pricing and reimbursement from government health administration authorities, private health insurers and other organizations. When a new pharmaceutical product is approved, the availability of government and private reimbursement for that product may be uncertain, as is the pricing and amount for which that product will be reimbursed.
Drug prices are under significant scrutiny in the markets in which our products are prescribed. We expect drug pricing and other health care costs to continue to be subject to intense political and societal pressures on a global basis.
Our failure to obtain or maintain adequate coverage, pricing or reimbursement for our products could have an adverse effect on our business, reputation, revenues and results of operations, could curtail or eliminate our ability to adequately fund research and development programs for the discovery and commercialization of new products or could cause a decline or volatility in our stock price.
In addition to the impact of competition, pricing actions and other measures being taken worldwide designed to reduce healthcare costs and limit the overall level of government expenditures, our sales and operations could also be affected by other risks of doing business internationally, including the impact of foreign currency exchange fluctuations, changes in intellectual property legal protections and changes in trade regulations and procedures as well as the impact of the continued uncertainty of the credit and economic conditions in certain countries in Europe.
For additional information on our competition and pricing risks that could negatively impact our product sales, please read Item 1A. Risk Factors and Item 7A. Quantitative and Qualitative Disclosures About Market Risk included in this report.
Brexit
In June 2016 the U.K. electorate voted in a referendum to voluntarily depart from the E.U., known as Brexit. In March 2017 the U.K. government formally notified the European Council of its intention to leave the E.U. and began to negotiate the terms of the future relationship between the U.K. and the E.U. upon exit, which is expected to occur in March 2019.
The potential impact on our results of operations and liquidity resulting from Brexit remains unclear. The actual effects of Brexit will depend upon many factors and significant uncertainty remains with respect to the ultimate resolution of the Brexit negotiations. The final outcome of these negotiations may impact certain of our research, commercial and general business operations in the U.K. and the E.U., including the approval and supply of our products.
Compliance with any resulting regulatory mandates may prove challenging and the macroeconomic impact on our sales and consolidated results of operations from these developments remains unknown. We do not, however, expect Brexit to have a material impact on our consolidated results of operations as approximately 2% of our total product revenues in each of 2018 and 2017 were derived from U.K. sales.
While we are in the process of implementing measures to meet E.U. legal requirements and to modify our business operations after the U.K. separates from the E.U., we cannot predict the direction Brexit-related developments will take nor the impact of those developments on our European operations and the economies of the markets where we operate. We will continue to monitor for developments and will assess the resulting potential impact on our business and results of operations.
Financial Highlights
56
Diluted earnings per share attributable to Biogen Inc. were $21.58 for 2018, representing an increase of 81.0% over $11.92 in the same period in 2017.
As described below under Results of Operations, our net income and diluted earnings per share attributable to Biogen Inc. for the year ended December 31, 2018, compared to the year ended December 31, 2017, reflects the following:
• Total revenues were $13,452.9 million for 2018, representing an increase of 9.6% over $12,273.9 million in 2017.
• Product revenues, net totaled $10,886.8 million for 2018, representing an increase of 5.1% over $10,354.7 million in 2017. This increase was primarily due to higher revenues from SPINRAZA and our biosimilar products, partially offset by a 4.3% net decrease in our MS product revenues, primarily resulting from a decrease in our Interferon product revenues. Product revenues, net, compared to the same period in 2017, further reflects the favorable impact of foreign currency exchange of $88.7 million. Net losses recognized in relation to the settlement of certain cash flow hedge instruments under our foreign currency hedging program for 2018 and 2017 were similar.
For 2018 compared to 2017, product revenues, net, were also negatively impacted by the elimination of worldwide ELOCTATE and ALPROLIX revenues resulting from the spin-off of our hemophilia business on February 1, 2017, as well as a decrease in ZINBRYTA revenues due to the voluntary worldwide withdrawal of ZINBRYTA, which was announced in the first quarter of 2018. Compared to 2017, these events negatively impacted revenues by $125.7 million.
• Revenues from anti-CD20 therapeutic programs totaled $1,980.2 million for 2018, representing an increase of 27.0% over $1,559.2 million in 2017. This increase was due to higher royalty revenues on sales of OCREVUS as well as an increase on our share of pre-tax profits in the U.S. for RITUXAN and GAZYVA.
• Other revenues totaled $585.9 million for 2018, representing an increase of 62.8% over $360.0 million in 2017. This increase was primarily due to higher contract manufacturing revenues.
• Total cost and expenses totaled $7,564.3 million for 2018, representing an increase of 9.2% over $6,928.1 million in 2017. This increase was primarily due to a 15.2% increase in research and development, a 11.4% increase
in cost of sales and an 8.9% increase in selling, general and administrative expenses. These increases were partially offset by the net change in (gain) loss recognized on the fair value remeasurement of our contingent consideration obligations as well as a decrease in amortization and impairment of acquired intangible assets.
The increase in research and development was primarily due to the $482.6 million net charge recognized upon the closing of the 2018 Ionis Agreement, partially offset by charges recognized in the prior year period totaling $360.0 million related to our exclusive license agreement with BMS as well as increased spending related to our early and late stage pipeline candidates.
The increase in cost of sales was primarily due to higher contract manufacturing shipments of drug product and drug substance production provided to our strategic partners, an increase in biosimilar sales volumes and increased royalties payable to Ionis on higher sales of SPINRAZA, partially offset by lower sales and costs associated with our MS products.
The increase in selling, general and administrative expenses was primarily due to increases in operational spending on sales and marketing activities in support of our marketed products, primarily related to SPINRAZA as we continue to expand into new international markets and increased costs incurred in support of our business development transactions completed in the current period.
• Net income attributable to Biogen Inc. was favorably impacted by a decrease in our effective tax rate to 24.2% for the year ended December 31, 2018, from 47.9% for 2017. The reduction in tax rate was primarily due to the favorable impacts of the 2017 Tax Act on our 2018 tax rate and the Transition Toll Tax expense recognized on enactment in December 2017.
As described below under Financial Condition, Liquidity and Capital Resources:
• We generated $6,187.7 million of net cash flows from operations for 2018, which were primarily driven by earnings.

57
• Cash, cash equivalents and marketable securities totaled approximately $4,913.9 million as of December 31, 2018.
• We repurchased and retired approximately 14.8 million shares of our common stock at a cost of approximately $4.4 billion during 2018 under our 2018 and 2016 Share Repurchase Programs.
Acquisitions, Collaborative and Other Relationships
BIIB100 Acquisition
In January 2018 we acquired BIIB100 from Karyopharm. BIIB100 is a Phase 1 ready investigational oral compound for the treatment of certain neurological and neurodegenerative diseases, primarily in ALS. BIIB100 is a novel therapeutic candidate that works by inhibiting a protein known as XP01, with the goal of reducing inflammation and neurotoxicity, along with increasing neuroprotective responses. In connection with the closing of this transaction, we made an upfront payment of $10.0 million to Karyopharm.
BIIB104 Acquisition
In April 2018 we acquired BIIB104 from Pfizer. BIIB104 is a first-in-class, Phase 2b ready AMPA receptor potentiator for CIAS, representing our first program in neurocognitive disorders. AMPA receptors mediate fast excitatory synaptic transmission in the central nervous system, a process which can be disrupted in a number of neurological and psychiatric diseases, including schizophrenia. In connection with the closing of this transaction, we made an upfront payment of $75.0 million to Pfizer.
Neurimmune SubOne AG
In May 2018 we made a $50.0 million payment to Neurimmune under the terms of the Neurimmune Agreement to reduce the previously negotiated royalty rates payable on products developed under the Neurimmune Agreement, including royalties payable on potential commercial sales of aducanumab, by 5%. Our royalty rates payable on products developed under the Neurimmune Agreement, including royalties payable on potential commercial sales of aducanumab, will now range from the high single digits to sub-teens.
Ionis Pharmaceuticals, Inc.
In June 2018 we closed the 2018 Ionis Agreement, which is a new 10-year exclusive agreement with Ionis to develop novel ASO drug candidates for a broad range of neurological diseases, and made a total payment of $1.0 billion to Ionis. We have the option to license therapies arising out of the 2018 Ionis Agreement and will be responsible for the development and potential commercialization of such therapies.
TMS Co., Ltd.
In June 2018 we entered into an exclusive option agreement with TMS granting us the option to acquire TMS-007, a plasminogen activator with a novel MOA associated with breaking down blood clots, which is in Phase 2 development in Japan, and backup compounds for the treatment of stroke. In exchange for the purchase option, we made a $4.0 million upfront payment to TMS.
Samsung Bioepis
In June 2018 we exercised our option under our joint venture agreement with Samsung BioLogics to increase our ownership percentage in Samsung Bioepis from approximately 5% to approximately 49.9%. The share purchase transaction was completed in November 2018 and, upon closing, we paid 759.5 billion South Korean won ($676.6 million) to Samsung BioLogics.
BIIB110 Acquisition
In July 2018 we acquired BIIB110 and ALG-802 from AliveGen. BIIB110 and ALG-802 represent novel ways of targeting the myostatin pathway. We initially plan to study BIIB110 in multiple neuromuscular indications, including SMA and ALS. In connection with the closing of this transaction, we made an upfront payment of $27.5 million to AliveGen.
BIIB067 Option Exercise
In December 2018 we exercised our option with Ionis and obtained a worldwide, exclusive, royalty-bearing license to develop and commercialize BIIB067, an investigational treatment for ALS with SOD1 mutations. In connection with the option exercise, we made an upfront payment of $35.0 million to Ionis.
C4 Therapeutics
In December 2018 we entered into a collaborative research and license agreement with C4T to investigate the use of C4T’s novel protein degradation platform to discover and develop potential new treatments for neurological diseases, such as AD and Parkinson’s disease. We will be responsible for the development and potential commercialization of any therapies resulting from this collaboration. In connection with this agreement, we made an upfront payment of $45.0 million to C4T.
Skyhawk Therapeutics, Inc.
In January 2019 we entered into a collaboration and research and development services agreement with Skyhawk pursuant to which the companies will leverage Skyhawk’s SkySTAR technology platform with the goal of discovering innovative small molecule treatments for patients with neurological diseases, including MS and SMA. We will be responsible for the development and potential commercialization of any

58
therapies resulting from this collaboration. In connection with this agreement, we made an upfront payment of $74.0 million to Skyhawk.
For additional information on our acquisitions of BIIB100, BIIB104 and BIIB110 and our exclusive option agreement with TMS, please read Note 2, Acquisitions, to our consolidated financial statements included in this report. For additional information on our collaboration arrangements with Ionis, Samsung Bioepis and C4T, please read Note 19, Collaborative and Other Relationships, to our consolidated financial statements included in this report. For additional information on our collaboration arrangement with Skyhawk, please read Note 27, Subsequent Events, to our consolidated financial statements included in this report.
Other Key Developments
ZINBRYTA Withdrawal
In March 2018 we and AbbVie announced the voluntary worldwide withdrawal of ZINBRYTA for RMS.
For additional information on our collaboration arrangement with AbbVie, please read Note 19, Collaborative and Other Relationships, to our consolidated financial statements included in this report.
IMRALDI
In October 2018 we began to recognize revenues on sales of IMRALDI, an adalimumab biosimilar referencing HUMIRA, to third parties in the E.U. We and Samsung Bioepis previously entered into an agreement with AbbVie for the commercialization of IMRALDI. Under the terms of the agreement, AbbVie granted us and Samsung Bioepis patent licenses for the use and sale of IMRALDI in Europe, on a country-by-country basis, and we make royalty payments to AbbVie on behalf of Samsung Bioepis.
2018 Share Repurchase Program
In August 2018 our Board of Directors authorized our 2018 Share Repurchase Program, which is a program to repurchase up to $3.5 billion of our common stock. Our 2018 Share Repurchase Program does not have an expiration date. All share repurchases under our 2018 Share Repurchase Program will be retired. Under our 2018 Share Repurchase Program, we repurchased and retired approximately 4.3 million shares of our common stock at a cost of approximately $1.4 billion during the year ended December 31, 2018.
Results of Operations
RevenuesRevenues are summarized as follows:
For the Years Ended
December 31,
% Change
2018 compared to
2017
2017 compared to
2016(In millions, except percentages) 2018 2017 2016
Product revenues, net:United States ..................................... $ 6,800.5 $ 7,017.1 $ 7,050.4 (3.1)% (0.5)%Rest of world...................................... 4,086.3 3,337.6 2,767.5 22.4 % 20.6 %
Total product revenues, net ............. 10,886.8 10,354.7 9,817.9 5.1 % 5.5 %Revenues from anti-CD20 therapeuticprograms ............................................. 1,980.2 1,559.2 1,314.5 27.0 % 18.6 %Other revenues..................................... 585.9 360.0 316.4 62.8 % 13.8 %
Total revenues................................ $ 13,452.9 $ 12,273.9 $ 11,448.8 9.6 % 7.2 %
59
Product RevenuesProduct revenues are summarized as follows:
For the Years Ended
December 31,
% Change
2018 compared
to 20172017 compared
to 2016(In millions, except percentages) 2018 2017 2016
Multiple Sclerosis (MS):TECFIDERA....................................... $ 4,274.1 $ 4,214.0 $ 3,968.1 1.4 % 6.2 %Interferon*....................................... 2,363.0 2,645.8 2,795.2 (10.7)% (5.3)%TYSABRI .......................................... 1,864.0 1,973.1 1,963.8 (5.5)% 0.5 %FAMPYRA ......................................... 92.7 91.6 84.9 1.2 % 7.9 %ZINBRYTA......................................... 1.4 52.7 7.8 (97.3)% 575.6 %Subtotal: MS product revenues........ 8,595.2 8,977.2 8,819.8 (4.3)% 1.8 %
Spinal Muscular Atrophy:SPINRAZA ........................................ 1,724.2 883.7 4.6 95.1 % 19,110.9 %
Biosimilars:BENEPALI......................................... 485.2 370.8 100.6 30.9 % 268.6 %FLIXABI ............................................ 43.2 9.0 0.1 380.0 % 8,900.0 %IMRALDI........................................... 16.7 — — ** **
Subtotal: Biosimilar productrevenues........................................ 545.1 379.8 100.7 43.5 % 277.2 %
Other:FUMADERM...................................... 22.3 39.6 45.9 (43.7)% (13.7)%
Hemophilia:ELOCTATE ........................................ — 48.4 513.2 ** (90.6)%ALPROLIX......................................... — 26.0 333.7 ** (92.2)%Subtotal: Hemophilia productrevenues........................................ — 74.4 846.9 ** (92.2)%
Total product revenues, net ............. $ 10,886.8 $ 10,354.7 $ 9,817.9 5.1 % 5.5 %* Interferon includes AVONEX and PLEGRIDY.** Percentage not meaningful.
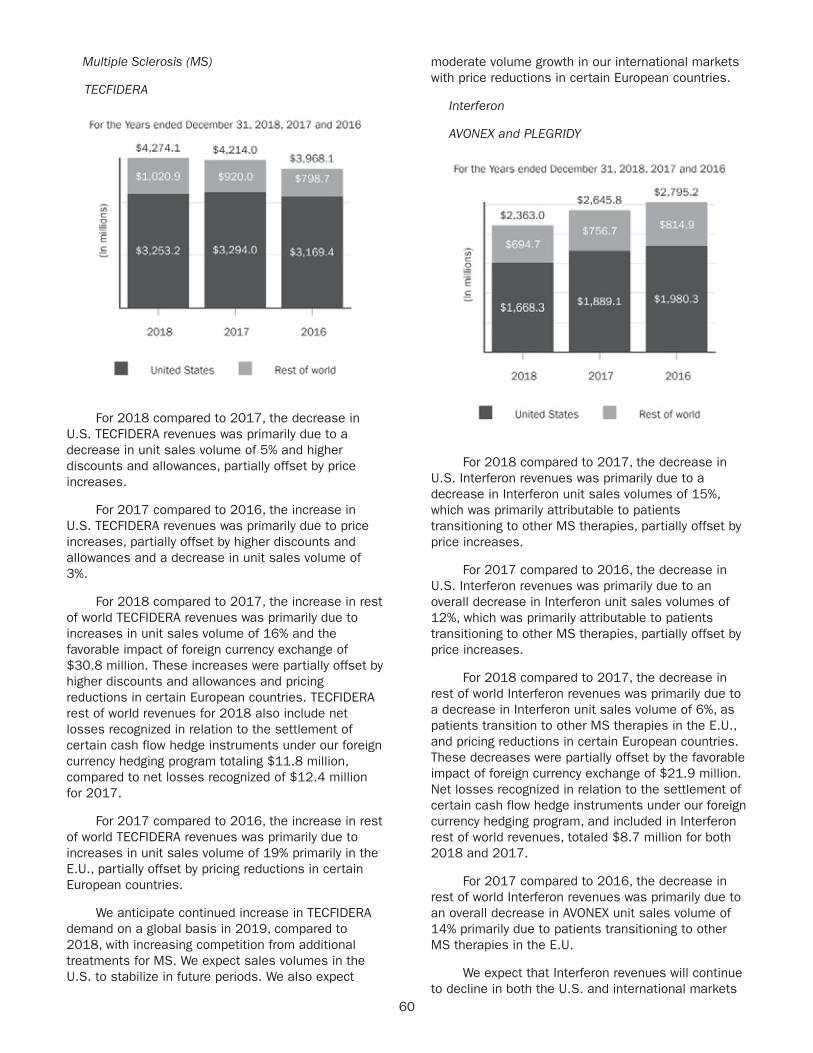
60
Multiple Sclerosis (MS)
TECFIDERA
For 2018 compared to 2017, the decrease in U.S. TECFIDERA revenues was primarily due to a decrease in unit sales volume of 5% and higher discounts and allowances, partially offset by price increases.
For 2017 compared to 2016, the increase in U.S. TECFIDERA revenues was primarily due to price increases, partially offset by higher discounts and allowances and a decrease in unit sales volume of 3%.
For 2018 compared to 2017, the increase in rest of world TECFIDERA revenues was primarily due to increases in unit sales volume of 16% and the favorable impact of foreign currency exchange of $30.8 million. These increases were partially offset by higher discounts and allowances and pricing reductions in certain European countries. TECFIDERA rest of world revenues for 2018 also include net losses recognized in relation to the settlement of certain cash flow hedge instruments under our foreign currency hedging program totaling $11.8 million, compared to net losses recognized of $12.4 million for 2017.
For 2017 compared to 2016, the increase in rest of world TECFIDERA revenues was primarily due to increases in unit sales volume of 19% primarily in the E.U., partially offset by pricing reductions in certain European countries.
We anticipate continued increase in TECFIDERA demand on a global basis in 2019, compared to 2018, with increasing competition from additional treatments for MS. We expect sales volumes in the U.S. to stabilize in future periods. We also expect
moderate volume growth in our international markets with price reductions in certain European countries.
Interferon
AVONEX and PLEGRIDY
For 2018 compared to 2017, the decrease in U.S. Interferon revenues was primarily due to a decrease in Interferon unit sales volumes of 15%, which was primarily attributable to patients transitioning to other MS therapies, partially offset by price increases.
For 2017 compared to 2016, the decrease in U.S. Interferon revenues was primarily due to an overall decrease in Interferon unit sales volumes of 12%, which was primarily attributable to patients transitioning to other MS therapies, partially offset by price increases.
For 2018 compared to 2017, the decrease in rest of world Interferon revenues was primarily due to a decrease in Interferon unit sales volume of 6%, as patients transition to other MS therapies in the E.U., and pricing reductions in certain European countries. These decreases were partially offset by the favorable impact of foreign currency exchange of $21.9 million. Net losses recognized in relation to the settlement of certain cash flow hedge instruments under our foreign currency hedging program, and included in Interferon rest of world revenues, totaled $8.7 million for both 2018 and 2017.
For 2017 compared to 2016, the decrease in rest of world Interferon revenues was primarily due to an overall decrease in AVONEX unit sales volume of 14% primarily due to patients transitioning to other MS therapies in the E.U.
We expect that Interferon revenues will continue to decline in both the U.S. and international markets
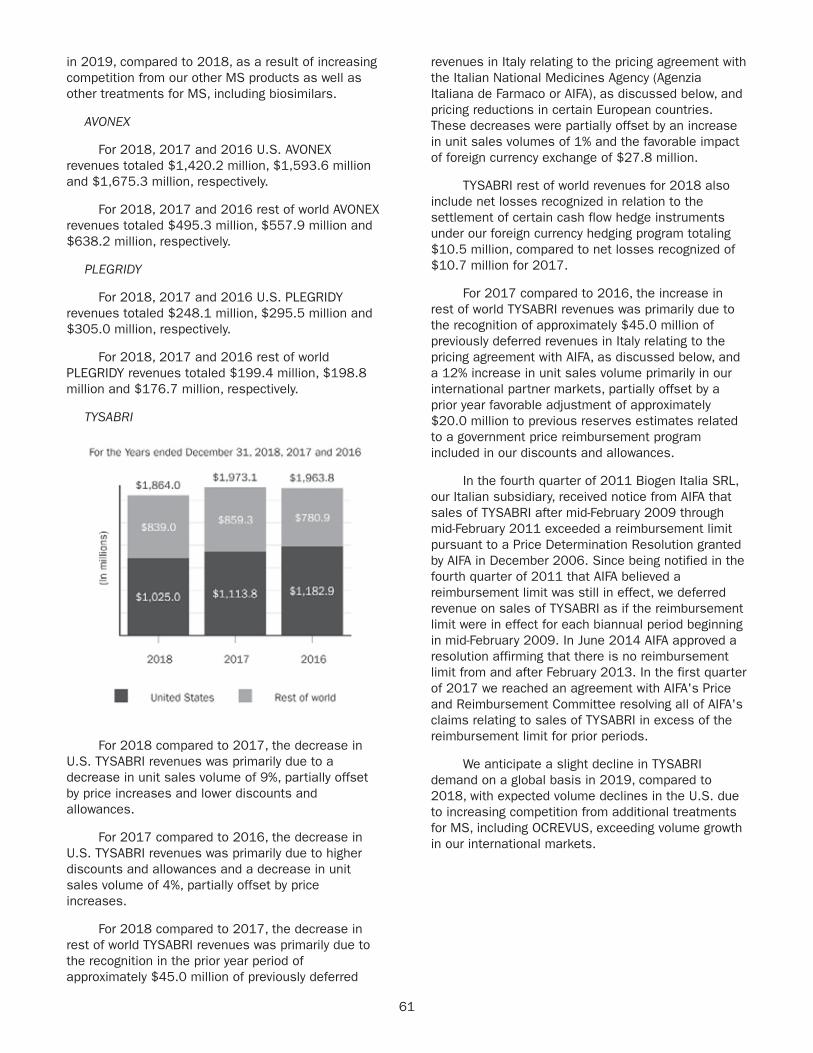
61
in 2019, compared to 2018, as a result of increasing competition from our other MS products as well as other treatments for MS, including biosimilars.
AVONEX
For 2018, 2017 and 2016 U.S. AVONEX revenues totaled $1,420.2 million, $1,593.6 million and $1,675.3 million, respectively.
For 2018, 2017 and 2016 rest of world AVONEX revenues totaled $495.3 million, $557.9 million and $638.2 million, respectively.
PLEGRIDY
For 2018, 2017 and 2016 U.S. PLEGRIDY revenues totaled $248.1 million, $295.5 million and $305.0 million, respectively.
For 2018, 2017 and 2016 rest of world PLEGRIDY revenues totaled $199.4 million, $198.8 million and $176.7 million, respectively.
TYSABRI
For 2018 compared to 2017, the decrease in U.S. TYSABRI revenues was primarily due to a decrease in unit sales volume of 9%, partially offset by price increases and lower discounts and allowances.
For 2017 compared to 2016, the decrease in U.S. TYSABRI revenues was primarily due to higher discounts and allowances and a decrease in unit sales volume of 4%, partially offset by price increases.
For 2018 compared to 2017, the decrease in rest of world TYSABRI revenues was primarily due to the recognition in the prior year period of approximately $45.0 million of previously deferred
revenues in Italy relating to the pricing agreement with the Italian National Medicines Agency (Agenzia Italiana de Farmaco or AIFA), as discussed below, and pricing reductions in certain European countries. These decreases were partially offset by an increase in unit sales volumes of 1% and the favorable impact of foreign currency exchange of $27.8 million.
TYSABRI rest of world revenues for 2018 also include net losses recognized in relation to the settlement of certain cash flow hedge instruments under our foreign currency hedging program totaling $10.5 million, compared to net losses recognized of $10.7 million for 2017.
For 2017 compared to 2016, the increase in rest of world TYSABRI revenues was primarily due to the recognition of approximately $45.0 million of previously deferred revenues in Italy relating to the pricing agreement with AIFA, as discussed below, and a 12% increase in unit sales volume primarily in our international partner markets, partially offset by a prior year favorable adjustment of approximately $20.0 million to previous reserves estimates related to a government price reimbursement program included in our discounts and allowances.
In the fourth quarter of 2011 Biogen Italia SRL, our Italian subsidiary, received notice from AIFA that sales of TYSABRI after mid-February 2009 through mid-February 2011 exceeded a reimbursement limit pursuant to a Price Determination Resolution granted by AIFA in December 2006. Since being notified in the fourth quarter of 2011 that AIFA believed a reimbursement limit was still in effect, we deferred revenue on sales of TYSABRI as if the reimbursement limit were in effect for each biannual period beginning in mid-February 2009. In June 2014 AIFA approved a resolution affirming that there is no reimbursement limit from and after February 2013. In the first quarter of 2017 we reached an agreement with AIFA's Price and Reimbursement Committee resolving all of AIFA's claims relating to sales of TYSABRI in excess of the reimbursement limit for prior periods.
We anticipate a slight decline in TYSABRI demand on a global basis in 2019, compared to 2018, with expected volume declines in the U.S. due to increasing competition from additional treatments for MS, including OCREVUS, exceeding volume growth in our international markets.

62
ZINBRYTA
Under our collaboration agreement with AbbVie, we began to recognize revenues on sales of ZINBRYTA to third parties in the E.U. in the third quarter of 2016.
For 2018 compared to 2017, the decrease in ZINBRYTA revenues was primarily due to the voluntary worldwide withdrawal of ZINBRYTA for RMS, which we and AbbVie announced in March 2018.
For 2017 compared to 2016, the increase in ZINBRYTA revenues was primarily due to an increase in unit sales volume.
For additional information on our collaboration arrangement with AbbVie, please read Note 19, Collaborative and Other Relationships, to our consolidated financial statements included in this report.
Spinal Muscular Atrophy
SPINRAZA
We began to recognize revenues on sales of SPINRAZA in the U.S. in the fourth quarter of 2016 and in our rest of world markets beginning in the first quarter of 2017.
For 2018 compared to 2017, the increase in U.S. SPINRAZA revenues was primarily due to increases in unit sales volume of 32%, partially offset by higher discounts and allowances.
For 2018 compared to 2017, the increase in rest of world SPINRAZA revenues was primarily due to increases in unit sales volumes as the product continued to be launched in new markets around the world, partially offset by the unfavorable impact of foreign currency exchange of $10.0 million.
For 2017 compared to 2016, the increase in U.S. and rest of world SPINRAZA revenues was primarily due to an increase in unit sales volume in new and existing markets.
We expect that the rate at which SPINRAZA revenues will grow will moderate in 2019, compared to 2018, primarily due to a lower rate of new patient starts combined with the impact of loading dose dynamics as patients transition to dosing once every four months.
In addition, we are aware of other products in development that, if successfully developed and approved, may compete with SPINRAZA in the SMA market, including a potential gene therapy product for the treatment of SMA Type 1, which could come to market in the U.S. in 2019. Future sales of SPINRAZA may be adversely affected by the commercialization of competing products.
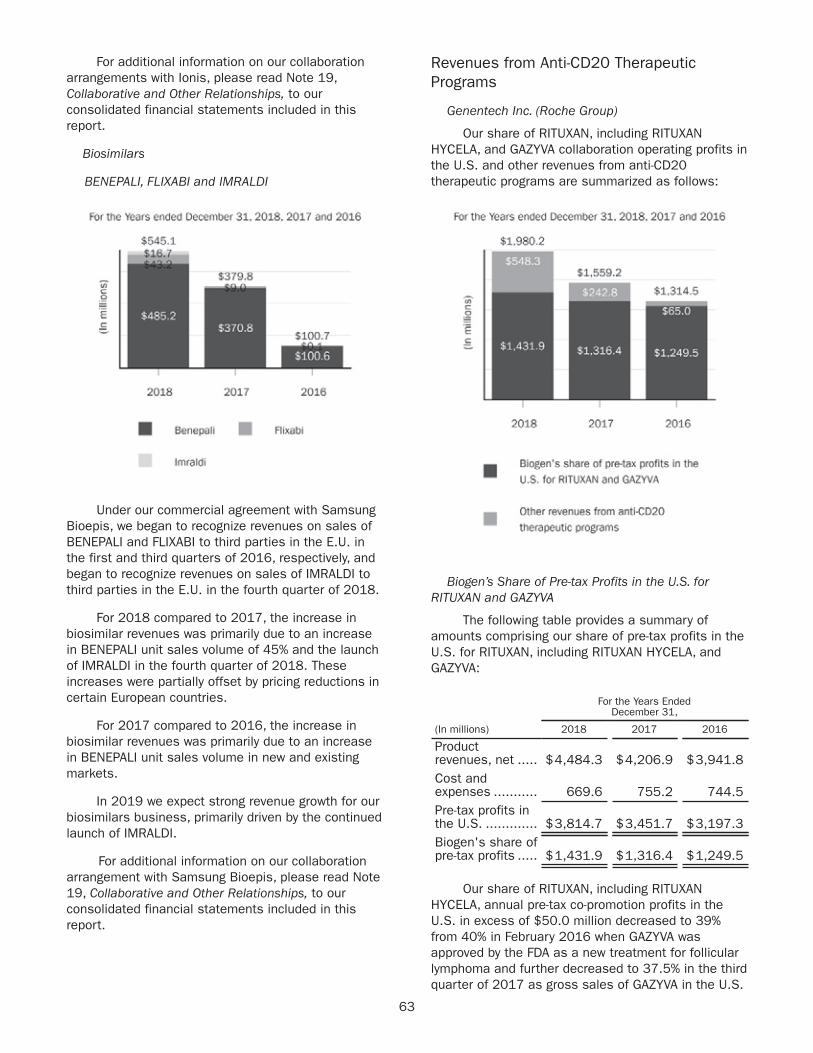
63
For additional information on our collaboration arrangements with Ionis, please read Note 19, Collaborative and Other Relationships, to our consolidated financial statements included in this report.
Biosimilars
BENEPALI, FLIXABI and IMRALDI
Under our commercial agreement with Samsung Bioepis, we began to recognize revenues on sales of BENEPALI and FLIXABI to third parties in the E.U. in the first and third quarters of 2016, respectively, and began to recognize revenues on sales of IMRALDI to third parties in the E.U. in the fourth quarter of 2018.
For 2018 compared to 2017, the increase in biosimilar revenues was primarily due to an increase in BENEPALI unit sales volume of 45% and the launch of IMRALDI in the fourth quarter of 2018. These increases were partially offset by pricing reductions in certain European countries.
For 2017 compared to 2016, the increase in biosimilar revenues was primarily due to an increase in BENEPALI unit sales volume in new and existing markets.
In 2019 we expect strong revenue growth for our biosimilars business, primarily driven by the continued launch of IMRALDI.
For additional information on our collaboration arrangement with Samsung Bioepis, please read Note 19, Collaborative and Other Relationships, to our consolidated financial statements included in this report.
Revenues from Anti-CD20 Therapeutic Programs
Genentech Inc. (Roche Group)
Our share of RITUXAN, including RITUXAN HYCELA, and GAZYVA collaboration operating profits in the U.S. and other revenues from anti-CD20 therapeutic programs are summarized as follows:
Biogen’s Share of Pre-tax Profits in the U.S. for RITUXAN and GAZYVA
The following table provides a summary of amounts comprising our share of pre-tax profits in the U.S. for RITUXAN, including RITUXAN HYCELA, and GAZYVA:
For the Years Ended
December 31,
(In millions) 2018 2017 2016
Productrevenues, net ..... $4,484.3 $4,206.9 $3,941.8Cost andexpenses ........... 669.6 755.2 744.5Pre-tax profits inthe U.S. ............. $3,814.7 $3,451.7 $3,197.3Biogen's share ofpre-tax profits ..... $1,431.9 $1,316.4 $1,249.5
Our share of RITUXAN, including RITUXAN HYCELA, annual pre-tax co-promotion profits in the U.S. in excess of $50.0 million decreased to 39% from 40% in February 2016 when GAZYVA was approved by the FDA as a new treatment for follicular lymphoma and further decreased to 37.5% in the third quarter of 2017 as gross sales of GAZYVA in the U.S.
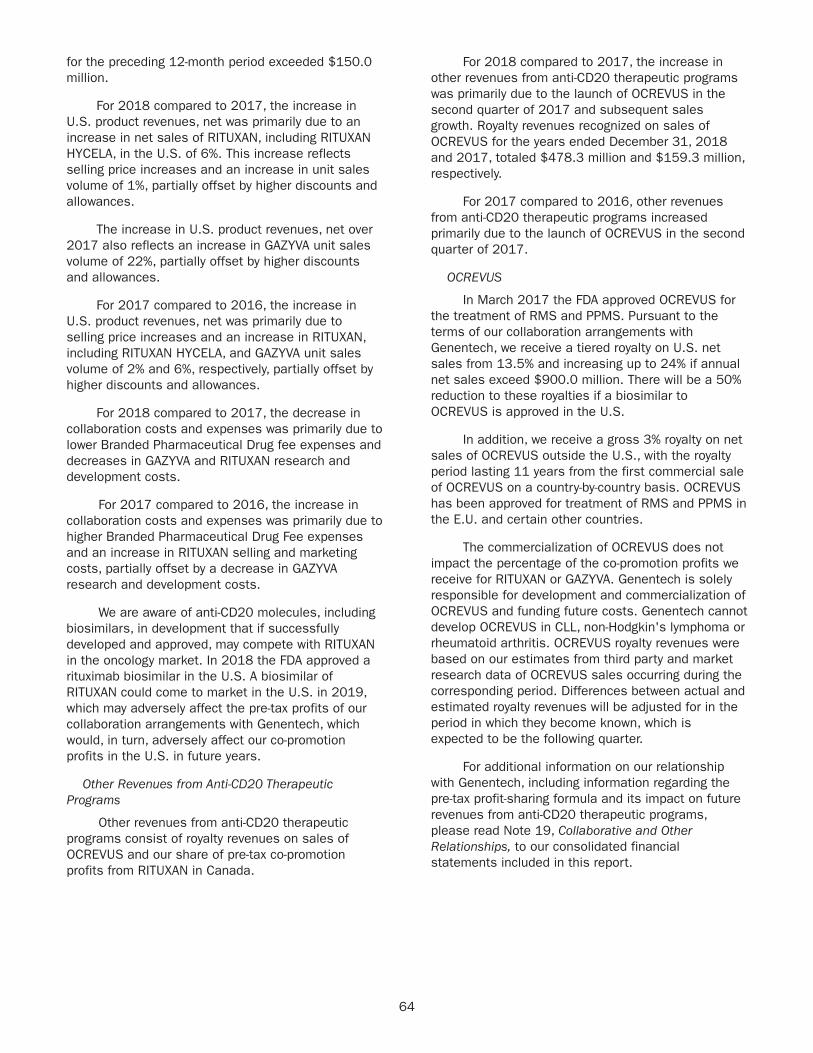
64
for the preceding 12-month period exceeded $150.0 million.
For 2018 compared to 2017, the increase in U.S. product revenues, net was primarily due to an increase in net sales of RITUXAN, including RITUXAN HYCELA, in the U.S. of 6%. This increase reflects selling price increases and an increase in unit sales volume of 1%, partially offset by higher discounts and allowances.
The increase in U.S. product revenues, net over 2017 also reflects an increase in GAZYVA unit sales volume of 22%, partially offset by higher discounts and allowances.
For 2017 compared to 2016, the increase in U.S. product revenues, net was primarily due to selling price increases and an increase in RITUXAN, including RITUXAN HYCELA, and GAZYVA unit sales volume of 2% and 6%, respectively, partially offset by higher discounts and allowances.
For 2018 compared to 2017, the decrease in collaboration costs and expenses was primarily due to lower Branded Pharmaceutical Drug fee expenses and decreases in GAZYVA and RITUXAN research and development costs.
For 2017 compared to 2016, the increase in collaboration costs and expenses was primarily due to higher Branded Pharmaceutical Drug Fee expenses and an increase in RITUXAN selling and marketing costs, partially offset by a decrease in GAZYVA research and development costs.
We are aware of anti-CD20 molecules, including biosimilars, in development that if successfully developed and approved, may compete with RITUXAN in the oncology market. In 2018 the FDA approved a rituximab biosimilar in the U.S. A biosimilar of RITUXAN could come to market in the U.S. in 2019, which may adversely affect the pre-tax profits of our collaboration arrangements with Genentech, which would, in turn, adversely affect our co-promotion profits in the U.S. in future years.
Other Revenues from Anti-CD20 Therapeutic Programs
Other revenues from anti-CD20 therapeutic programs consist of royalty revenues on sales of OCREVUS and our share of pre-tax co-promotion profits from RITUXAN in Canada.
For 2018 compared to 2017, the increase in other revenues from anti-CD20 therapeutic programs was primarily due to the launch of OCREVUS in the second quarter of 2017 and subsequent sales growth. Royalty revenues recognized on sales of OCREVUS for the years ended December 31, 2018 and 2017, totaled $478.3 million and $159.3 million, respectively.
For 2017 compared to 2016, other revenues from anti-CD20 therapeutic programs increased primarily due to the launch of OCREVUS in the second quarter of 2017.
OCREVUS
In March 2017 the FDA approved OCREVUS for the treatment of RMS and PPMS. Pursuant to the terms of our collaboration arrangements with Genentech, we receive a tiered royalty on U.S. net sales from 13.5% and increasing up to 24% if annual net sales exceed $900.0 million. There will be a 50% reduction to these royalties if a biosimilar to OCREVUS is approved in the U.S.
In addition, we receive a gross 3% royalty on net sales of OCREVUS outside the U.S., with the royalty period lasting 11 years from the first commercial sale of OCREVUS on a country-by-country basis. OCREVUS has been approved for treatment of RMS and PPMS in the E.U. and certain other countries.
The commercialization of OCREVUS does not impact the percentage of the co-promotion profits we receive for RITUXAN or GAZYVA. Genentech is solely responsible for development and commercialization of OCREVUS and funding future costs. Genentech cannot develop OCREVUS in CLL, non-Hodgkin's lymphoma or rheumatoid arthritis. OCREVUS royalty revenues were based on our estimates from third party and market research data of OCREVUS sales occurring during the corresponding period. Differences between actual and estimated royalty revenues will be adjusted for in the period in which they become known, which is expected to be the following quarter.
For additional information on our relationship with Genentech, including information regarding the pre-tax profit-sharing formula and its impact on future revenues from anti-CD20 therapeutic programs, please read Note 19, Collaborative and Other Relationships, to our consolidated financial statements included in this report.
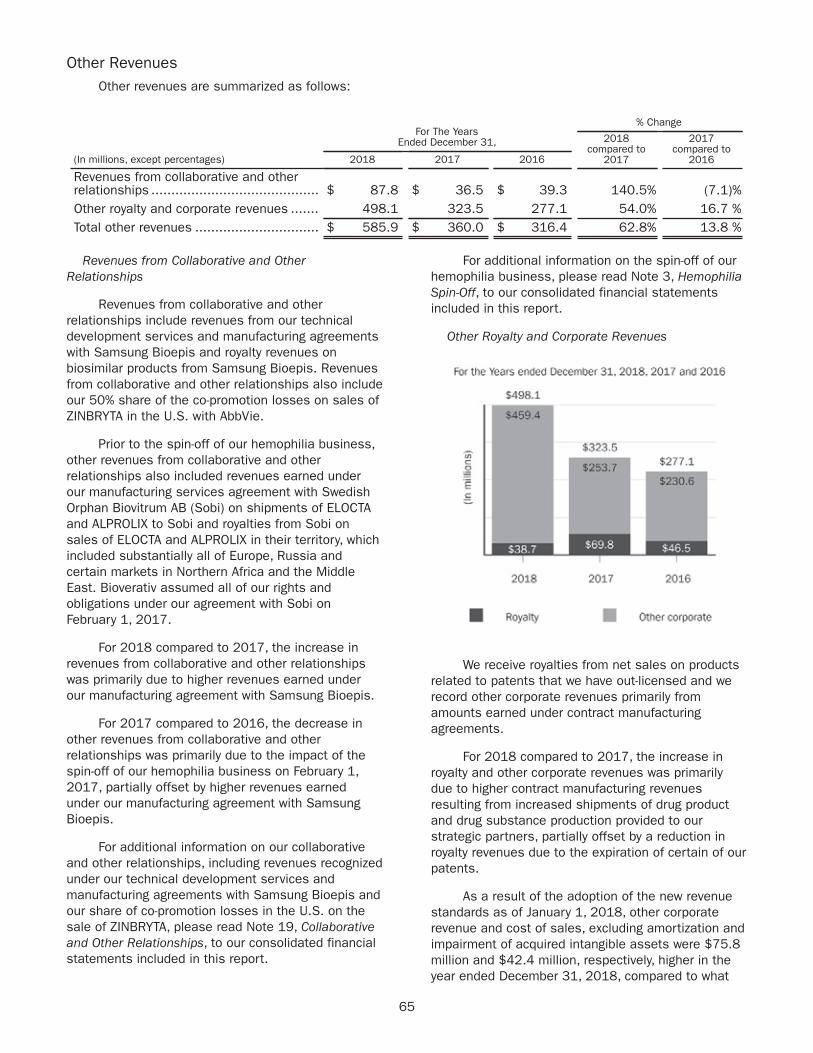
65
Other RevenuesOther revenues are summarized as follows:
For The Years Ended December 31,
% Change
2018compared to
2017
2017compared to
2016(In millions, except percentages) 2018 2017 2016
Revenues from collaborative and otherrelationships .......................................... $ 87.8 $ 36.5 $ 39.3 140.5% (7.1)%Other royalty and corporate revenues ....... 498.1 323.5 277.1 54.0% 16.7 %Total other revenues ............................... $ 585.9 $ 360.0 $ 316.4 62.8% 13.8 %
Revenues from Collaborative and Other Relationships
Revenues from collaborative and other relationships include revenues from our technical development services and manufacturing agreements with Samsung Bioepis and royalty revenues on biosimilar products from Samsung Bioepis. Revenues from collaborative and other relationships also include our 50% share of the co-promotion losses on sales of ZINBRYTA in the U.S. with AbbVie.
Prior to the spin-off of our hemophilia business, other revenues from collaborative and other relationships also included revenues earned under our manufacturing services agreement with Swedish Orphan Biovitrum AB (Sobi) on shipments of ELOCTA and ALPROLIX to Sobi and royalties from Sobi on sales of ELOCTA and ALPROLIX in their territory, which included substantially all of Europe, Russia and certain markets in Northern Africa and the Middle East. Bioverativ assumed all of our rights and obligations under our agreement with Sobi on February 1, 2017.
For 2018 compared to 2017, the increase in revenues from collaborative and other relationships was primarily due to higher revenues earned under our manufacturing agreement with Samsung Bioepis.
For 2017 compared to 2016, the decrease in other revenues from collaborative and other relationships was primarily due to the impact of the spin-off of our hemophilia business on February 1, 2017, partially offset by higher revenues earned under our manufacturing agreement with Samsung Bioepis.
For additional information on our collaborative and other relationships, including revenues recognized under our technical development services and manufacturing agreements with Samsung Bioepis and our share of co-promotion losses in the U.S. on the sale of ZINBRYTA, please read Note 19, Collaborative and Other Relationships, to our consolidated financial statements included in this report.
For additional information on the spin-off of our hemophilia business, please read Note 3, Hemophilia Spin-Off, to our consolidated financial statements included in this report.
Other Royalty and Corporate Revenues
We receive royalties from net sales on products related to patents that we have out-licensed and we record other corporate revenues primarily from amounts earned under contract manufacturing agreements.
For 2018 compared to 2017, the increase in royalty and other corporate revenues was primarily due to higher contract manufacturing revenues resulting from increased shipments of drug product and drug substance production provided to our strategic partners, partially offset by a reduction in royalty revenues due to the expiration of certain of our patents.
As a result of the adoption of the new revenue standards as of January 1, 2018, other corporate revenue and cost of sales, excluding amortization and impairment of acquired intangible assets were $75.8 million and $42.4 million, respectively, higher in the year ended December 31, 2018, compared to what
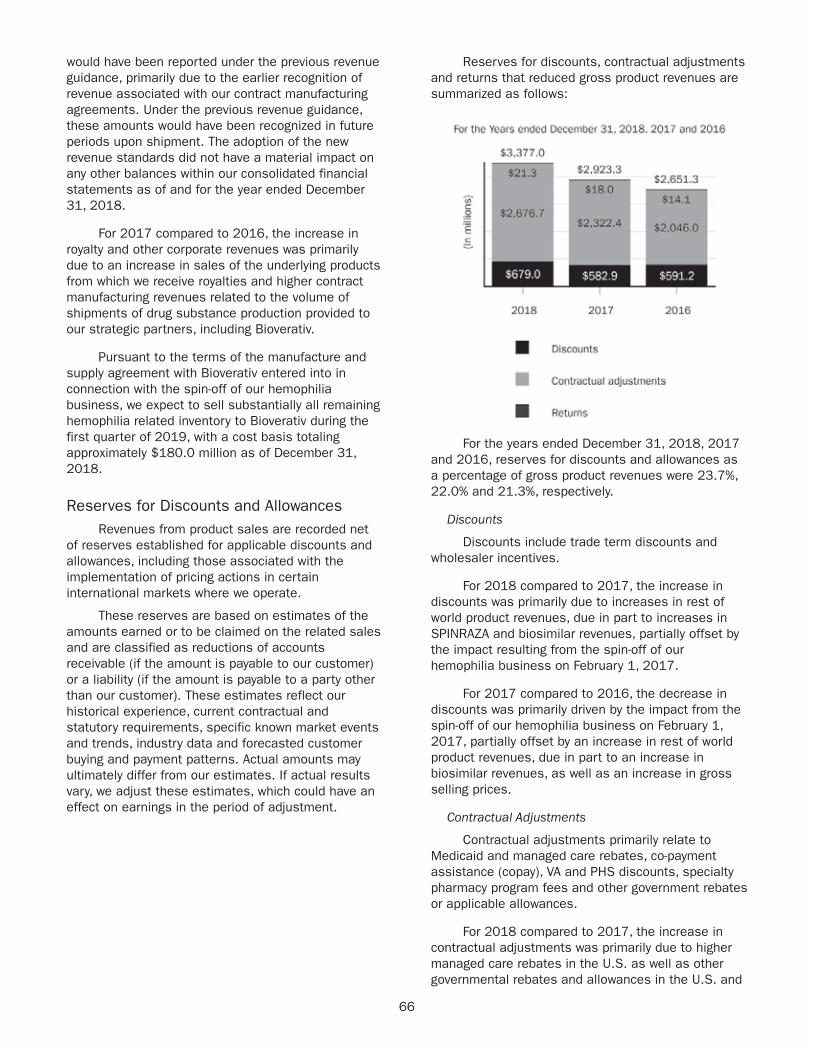
66
would have been reported under the previous revenue guidance, primarily due to the earlier recognition of revenue associated with our contract manufacturing agreements. Under the previous revenue guidance, these amounts would have been recognized in future periods upon shipment. The adoption of the new revenue standards did not have a material impact on any other balances within our consolidated financial statements as of and for the year ended December 31, 2018.
For 2017 compared to 2016, the increase in royalty and other corporate revenues was primarily due to an increase in sales of the underlying products from which we receive royalties and higher contract manufacturing revenues related to the volume of shipments of drug substance production provided to our strategic partners, including Bioverativ.
Pursuant to the terms of the manufacture and supply agreement with Bioverativ entered into in connection with the spin-off of our hemophilia business, we expect to sell substantially all remaining hemophilia related inventory to Bioverativ during the first quarter of 2019, with a cost basis totaling approximately $180.0 million as of December 31, 2018.
Reserves for Discounts and AllowancesRevenues from product sales are recorded net
of reserves established for applicable discounts and allowances, including those associated with the implementation of pricing actions in certain international markets where we operate.
These reserves are based on estimates of the amounts earned or to be claimed on the related sales and are classified as reductions of accounts receivable (if the amount is payable to our customer) or a liability (if the amount is payable to a party other than our customer). These estimates reflect our historical experience, current contractual and statutory requirements, specific known market events and trends, industry data and forecasted customer buying and payment patterns. Actual amounts may ultimately differ from our estimates. If actual results vary, we adjust these estimates, which could have an effect on earnings in the period of adjustment.
Reserves for discounts, contractual adjustments and returns that reduced gross product revenues are summarized as follows:
For the years ended December 31, 2018, 2017 and 2016, reserves for discounts and allowances as a percentage of gross product revenues were 23.7%, 22.0% and 21.3%, respectively.
Discounts
Discounts include trade term discounts and wholesaler incentives.
For 2018 compared to 2017, the increase in discounts was primarily due to increases in rest of world product revenues, due in part to increases in SPINRAZA and biosimilar revenues, partially offset by the impact resulting from the spin-off of our hemophilia business on February 1, 2017.
For 2017 compared to 2016, the decrease in discounts was primarily driven by the impact from the spin-off of our hemophilia business on February 1, 2017, partially offset by an increase in rest of world product revenues, due in part to an increase in biosimilar revenues, as well as an increase in gross selling prices.
Contractual Adjustments
Contractual adjustments primarily relate to Medicaid and managed care rebates, co-payment assistance (copay), VA and PHS discounts, specialty pharmacy program fees and other government rebates or applicable allowances.
For 2018 compared to 2017, the increase in contractual adjustments was primarily due to higher managed care rebates in the U.S. as well as other governmental rebates and allowances in the U.S. and

67
rest of world, due in part to an increase in SPINRAZA sales volumes worldwide and an increase in gross selling prices in the U.S. These increases were partially offset by the impact from the spin-off of our hemophilia business on February 1, 2017.
For 2017 compared to 2016, the increase in contractual adjustments was primarily due to higher managed care rebates and Medicaid and other governmental rebates and allowances in the U.S., due in part to an increase in gross selling prices and the launch of SPINRAZA in the U.S. in the fourth quarter of 2016, partially offset by the impact from the spin-off of our hemophilia business on February 1, 2017.
Returns
Product return reserves are established for returns made by wholesalers. In accordance with contractual terms, wholesalers are permitted to return
product for reasons such as damaged or expired product. The majority of wholesaler returns are due to product expiration. Provisions for product returns are recognized in the period the related revenue is recognized, resulting in a reduction to product sales.
For 2018 compared to 2017, the increase in return reserves was primarily due to the voluntary worldwide withdrawal of ZINBRYTA for RMS, which we and AbbVie announced in March 2018.
For 2017 compared to 2016, return provisions were relatively consistent.
For additional information on our revenue reserves, please read Note 5, Revenues, to our consolidated financial statements included in this report.
Cost and ExpensesA summary of total cost and expenses is as follows:
For the Years Ended
December 31,
% Change
2018 compared to
2017
2017 compared to
2016(In millions, except percentages) 2018 2017 2016
Cost of sales, excluding amortization andimpairment of acquired intangible assets. $ 1,816.3 $ 1,630.0 $ 1,478.7 11.4 % 10.2 %Research and development..................... 2,597.2 2,253.6 1,973.3 15.2 % 14.2 %Selling, general and administrative .......... 2,106.3 1,933.9 1,946.6 8.9 % (0.7)%Amortization and impairment of acquiredintangible assets ................................... 747.3 814.7 385.6 (8.3)% 111.3 %Collaboration profit (loss) sharing ............ 185.0 112.3 10.2 64.7 % **Acquired in-process research anddevelopment.......................................... 112.5 120.0 — (6.3)% **Restructuring charges............................. 12.0 0.9 33.1 ** (97.3)%(Gain) loss on fair value remeasurementof contingent consideration..................... (12.3) 62.7 14.8 (119.6)% 323.6 %TECFIDERA litigation settlement charge.... — — 454.8 ** (100.0)%
Total cost and expenses ................... $ 7,564.3 $ 6,928.1 $ 6,297.1 9.2 % 10.0 %** Percentage not meaningful.
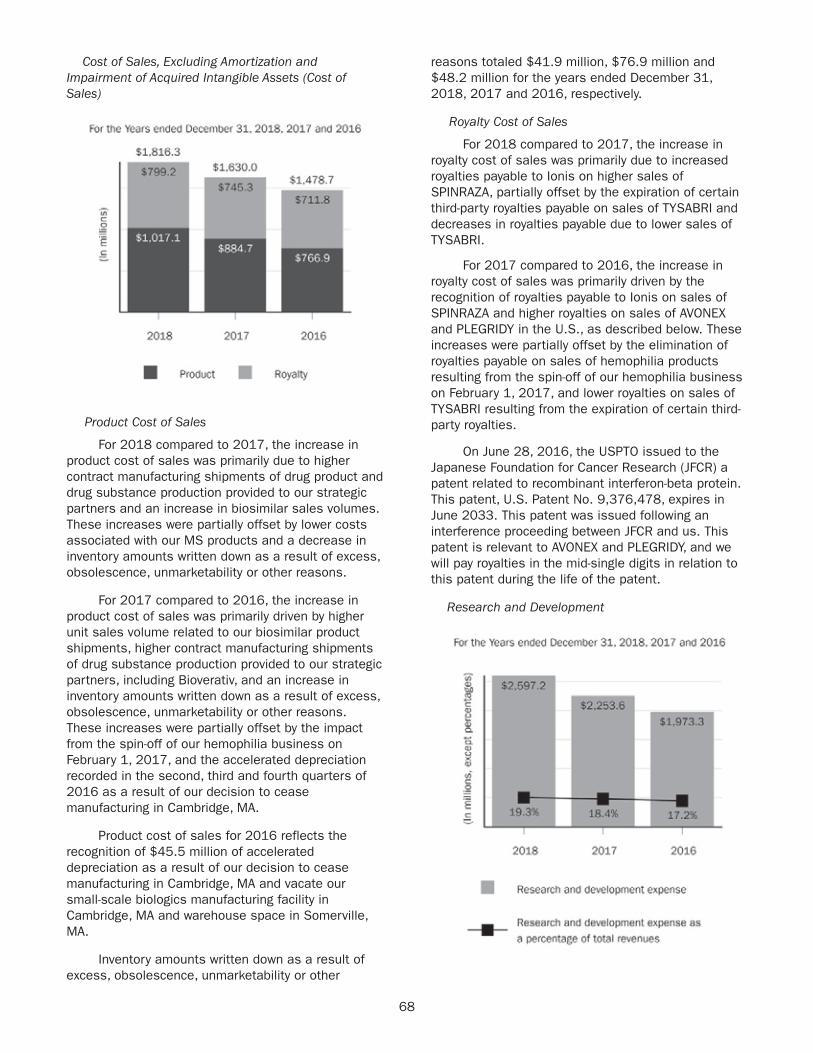
68
Cost of Sales, Excluding Amortization and Impairment of Acquired Intangible Assets (Cost of Sales)
Product Cost of Sales
For 2018 compared to 2017, the increase in product cost of sales was primarily due to higher contract manufacturing shipments of drug product and drug substance production provided to our strategic partners and an increase in biosimilar sales volumes. These increases were partially offset by lower costs associated with our MS products and a decrease in inventory amounts written down as a result of excess, obsolescence, unmarketability or other reasons.
For 2017 compared to 2016, the increase in product cost of sales was primarily driven by higher unit sales volume related to our biosimilar product shipments, higher contract manufacturing shipments of drug substance production provided to our strategic partners, including Bioverativ, and an increase in inventory amounts written down as a result of excess, obsolescence, unmarketability or other reasons. These increases were partially offset by the impact from the spin-off of our hemophilia business on February 1, 2017, and the accelerated depreciation recorded in the second, third and fourth quarters of 2016 as a result of our decision to cease manufacturing in Cambridge, MA.
Product cost of sales for 2016 reflects the recognition of $45.5 million of accelerated depreciation as a result of our decision to cease manufacturing in Cambridge, MA and vacate our small-scale biologics manufacturing facility in Cambridge, MA and warehouse space in Somerville, MA.
Inventory amounts written down as a result of excess, obsolescence, unmarketability or other
reasons totaled $41.9 million, $76.9 million and $48.2 million for the years ended December 31, 2018, 2017 and 2016, respectively.
Royalty Cost of Sales
For 2018 compared to 2017, the increase in royalty cost of sales was primarily due to increased royalties payable to Ionis on higher sales of SPINRAZA, partially offset by the expiration of certain third-party royalties payable on sales of TYSABRI and decreases in royalties payable due to lower sales of TYSABRI.
For 2017 compared to 2016, the increase in royalty cost of sales was primarily driven by the recognition of royalties payable to Ionis on sales of SPINRAZA and higher royalties on sales of AVONEX and PLEGRIDY in the U.S., as described below. These increases were partially offset by the elimination of royalties payable on sales of hemophilia products resulting from the spin-off of our hemophilia business on February 1, 2017, and lower royalties on sales of TYSABRI resulting from the expiration of certain third-party royalties.
On June 28, 2016, the USPTO issued to the Japanese Foundation for Cancer Research (JFCR) a patent related to recombinant interferon-beta protein. This patent, U.S. Patent No. 9,376,478, expires in June 2033. This patent was issued following an interference proceeding between JFCR and us. This patent is relevant to AVONEX and PLEGRIDY, and we will pay royalties in the mid-single digits in relation to this patent during the life of the patent.
Research and Development

69
We support our drug discovery and development efforts through the commitment of significant resources to discovery, research and development programs and business development opportunities.
A significant amount of our research and development costs consist of indirect costs incurred in support of overall research and development activities and non-specific programs, including activities that benefit multiple programs, such as management costs, as well as depreciation,
information technology and facility-based expenses. These costs are considered other research and development costs in the table above and are not allocated to a specific program or stage.
Research and development expense incurred in support of our marketed products includes costs associated with product lifecycle management activities including, if applicable, costs associated with the development of new indications for existing products. Late stage programs are programs in Phase 3 development or in registration stage. Early stage programs are programs in Phase 1 or Phase 2 development. Research and discovery represents costs incurred to support our discovery research and translational science efforts. Costs are reflected in the development stage based upon the program status when incurred. Therefore, the same program could be reflected in different development stages in the same year. For several of our programs, the research and development activities are part of our collaborative and other relationships. Our costs reflect our share of the total costs incurred.
For 2018 compared to 2017, the increase in research and development expense was primarily due to increases in milestone and upfront expenses, costs incurred in connection with our early and late stage programs and increased costs incurred in connection with research and discovery. These increases were partially offset by decreased costs incurred with our marketed products.
For 2017 compared to 2016, the increase in research and development expense was primarily related to milestone and upfront expenses and costs incurred in connection with our early stage and late stage programs, partially offset by decreased costs incurred in connection with our marketed products.
We intend to continue committing significant resources to targeted research and development opportunities where there is a significant unmet need and where a drug candidate has the potential to be highly differentiated.
Milestone and Upfront Expenses
Research and development expense for 2018 includes:
• $486.2 million net charge to research and development expense upon the closing of the 2018 Ionis Agreement;
• $35.0 million charge to research and development expense upon the exercise of our option to obtain a worldwide, exclusive, royalty-bearing license from Ionis to develop and commercialize BIIB067; and
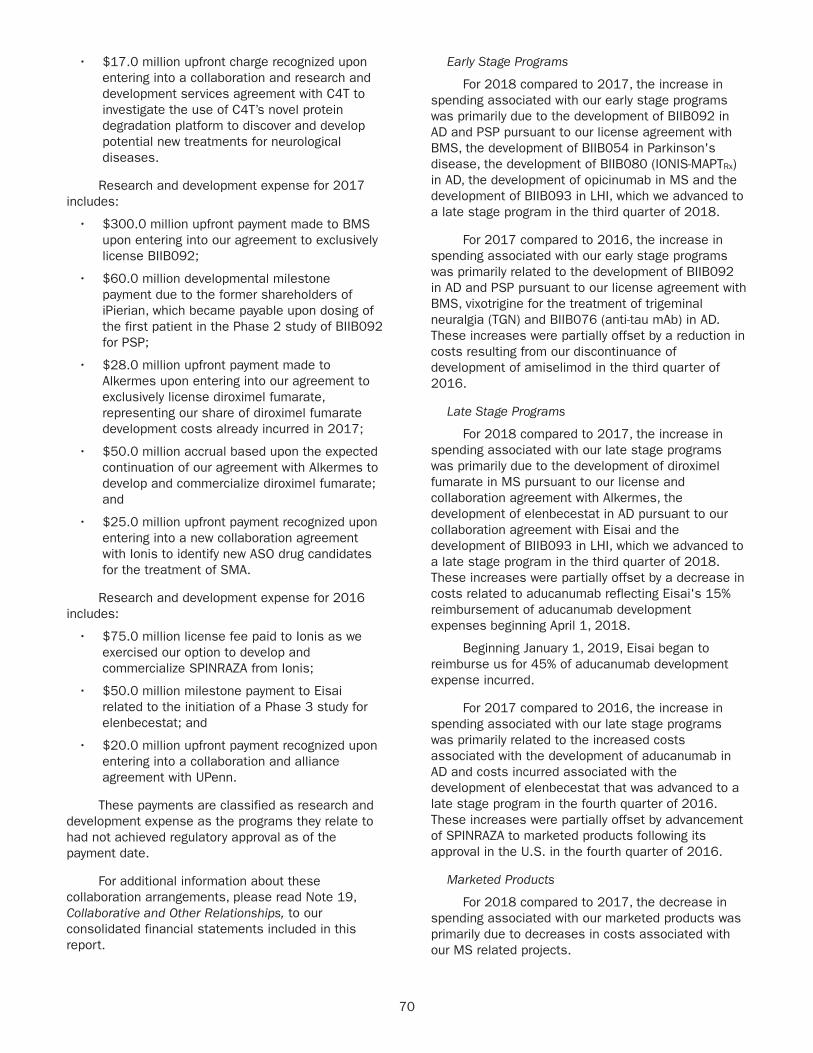
70
• $17.0 million upfront charge recognized upon entering into a collaboration and research and development services agreement with C4T to investigate the use of C4T’s novel protein degradation platform to discover and develop potential new treatments for neurological diseases.
Research and development expense for 2017 includes:
• $300.0 million upfront payment made to BMS upon entering into our agreement to exclusively license BIIB092;
• $60.0 million developmental milestone payment due to the former shareholders of iPierian, which became payable upon dosing of the first patient in the Phase 2 study of BIIB092 for PSP;
• $28.0 million upfront payment made to Alkermes upon entering into our agreement to exclusively license diroximel fumarate, representing our share of diroximel fumarate development costs already incurred in 2017;
• $50.0 million accrual based upon the expected continuation of our agreement with Alkermes to develop and commercialize diroximel fumarate; and
• $25.0 million upfront payment recognized upon entering into a new collaboration agreement with Ionis to identify new ASO drug candidates for the treatment of SMA.
Research and development expense for 2016 includes:
• $75.0 million license fee paid to Ionis as we exercised our option to develop and commercialize SPINRAZA from Ionis;
• $50.0 million milestone payment to Eisai related to the initiation of a Phase 3 study for elenbecestat; and
• $20.0 million upfront payment recognized upon entering into a collaboration and alliance agreement with UPenn.
These payments are classified as research and development expense as the programs they relate to had not achieved regulatory approval as of the payment date.
For additional information about these collaboration arrangements, please read Note 19, Collaborative and Other Relationships, to our consolidated financial statements included in this report.
Early Stage Programs
For 2018 compared to 2017, the increase in spending associated with our early stage programs was primarily due to the development of BIIB092 in AD and PSP pursuant to our license agreement with BMS, the development of BIIB054 in Parkinson's disease, the development of BIIB080 (IONIS-MAPTRx) in AD, the development of opicinumab in MS and the development of BIIB093 in LHI, which we advanced to a late stage program in the third quarter of 2018.
For 2017 compared to 2016, the increase in spending associated with our early stage programs was primarily related to the development of BIIB092 in AD and PSP pursuant to our license agreement with BMS, vixotrigine for the treatment of trigeminal neuralgia (TGN) and BIIB076 (anti-tau mAb) in AD. These increases were partially offset by a reduction in costs resulting from our discontinuance of development of amiselimod in the third quarter of 2016.
Late Stage Programs
For 2018 compared to 2017, the increase in spending associated with our late stage programs was primarily due to the development of diroximel fumarate in MS pursuant to our license and collaboration agreement with Alkermes, the development of elenbecestat in AD pursuant to our collaboration agreement with Eisai and the development of BIIB093 in LHI, which we advanced to a late stage program in the third quarter of 2018. These increases were partially offset by a decrease in costs related to aducanumab reflecting Eisai's 15% reimbursement of aducanumab development expenses beginning April 1, 2018.
Beginning January 1, 2019, Eisai began to reimburse us for 45% of aducanumab development expense incurred.
For 2017 compared to 2016, the increase in spending associated with our late stage programs was primarily related to the increased costs associated with the development of aducanumab in AD and costs incurred associated with the development of elenbecestat that was advanced to a late stage program in the fourth quarter of 2016. These increases were partially offset by advancement of SPINRAZA to marketed products following its approval in the U.S. in the fourth quarter of 2016.
Marketed Products
For 2018 compared to 2017, the decrease in spending associated with our marketed products was primarily due to decreases in costs associated with our MS related projects.
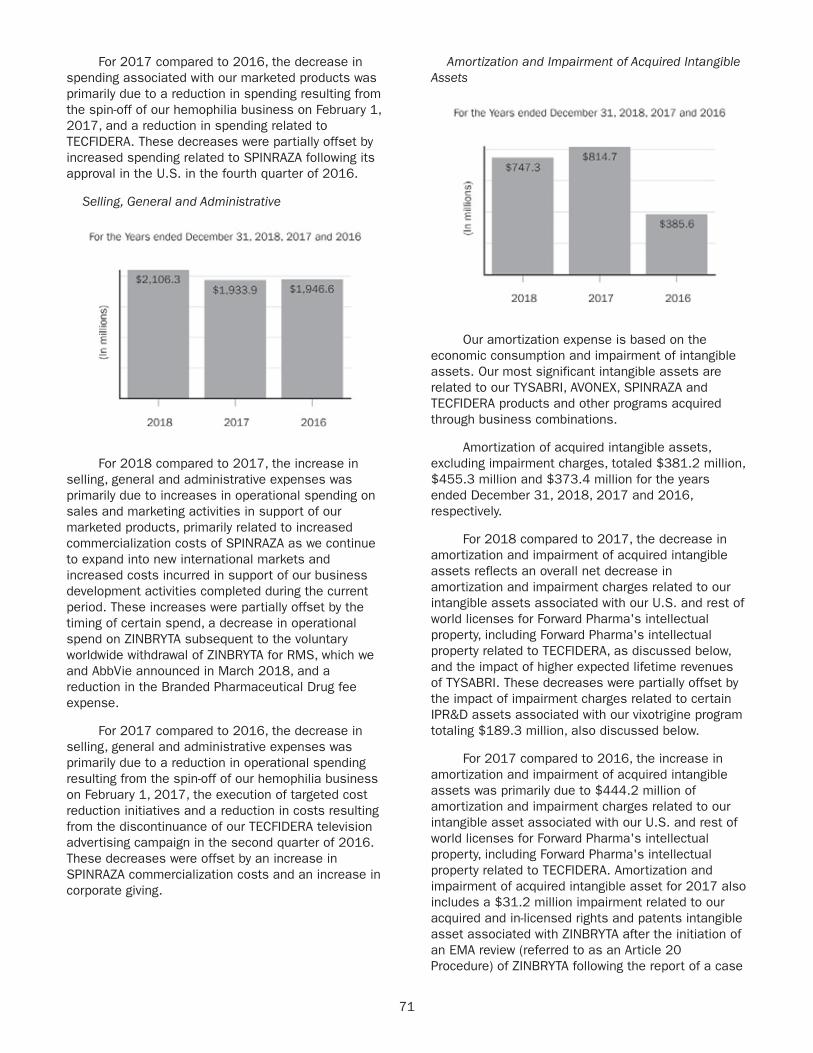
71
For 2017 compared to 2016, the decrease in spending associated with our marketed products was primarily due to a reduction in spending resulting from the spin-off of our hemophilia business on February 1, 2017, and a reduction in spending related to TECFIDERA. These decreases were partially offset by increased spending related to SPINRAZA following its approval in the U.S. in the fourth quarter of 2016.
Selling, General and Administrative
For 2018 compared to 2017, the increase in selling, general and administrative expenses was primarily due to increases in operational spending on sales and marketing activities in support of our marketed products, primarily related to increased commercialization costs of SPINRAZA as we continue to expand into new international markets and increased costs incurred in support of our business development activities completed during the current period. These increases were partially offset by the timing of certain spend, a decrease in operational spend on ZINBRYTA subsequent to the voluntary worldwide withdrawal of ZINBRYTA for RMS, which we and AbbVie announced in March 2018, and a reduction in the Branded Pharmaceutical Drug fee expense.
For 2017 compared to 2016, the decrease in selling, general and administrative expenses was primarily due to a reduction in operational spending resulting from the spin-off of our hemophilia business on February 1, 2017, the execution of targeted cost reduction initiatives and a reduction in costs resulting from the discontinuance of our TECFIDERA television advertising campaign in the second quarter of 2016. These decreases were offset by an increase in SPINRAZA commercialization costs and an increase in corporate giving.
Amortization and Impairment of Acquired Intangible Assets
Our amortization expense is based on the economic consumption and impairment of intangible assets. Our most significant intangible assets are related to our TYSABRI, AVONEX, SPINRAZA and TECFIDERA products and other programs acquired through business combinations.
Amortization of acquired intangible assets, excluding impairment charges, totaled $381.2 million, $455.3 million and $373.4 million for the years ended December 31, 2018, 2017 and 2016, respectively.
For 2018 compared to 2017, the decrease in amortization and impairment of acquired intangible assets reflects an overall net decrease in amortization and impairment charges related to our intangible assets associated with our U.S. and rest of world licenses for Forward Pharma's intellectual property, including Forward Pharma's intellectual property related to TECFIDERA, as discussed below, and the impact of higher expected lifetime revenues of TYSABRI. These decreases were partially offset by the impact of impairment charges related to certain IPR&D assets associated with our vixotrigine program totaling $189.3 million, also discussed below.
For 2017 compared to 2016, the increase in amortization and impairment of acquired intangible assets was primarily due to $444.2 million of amortization and impairment charges related to our intangible asset associated with our U.S. and rest of world licenses for Forward Pharma's intellectual property, including Forward Pharma's intellectual property related to TECFIDERA. Amortization and impairment of acquired intangible asset for 2017 also includes a $31.2 million impairment related to our acquired and in-licensed rights and patents intangible asset associated with ZINBRYTA after the initiation of an EMA review (referred to as an Article 20 Procedure) of ZINBRYTA following the report of a case
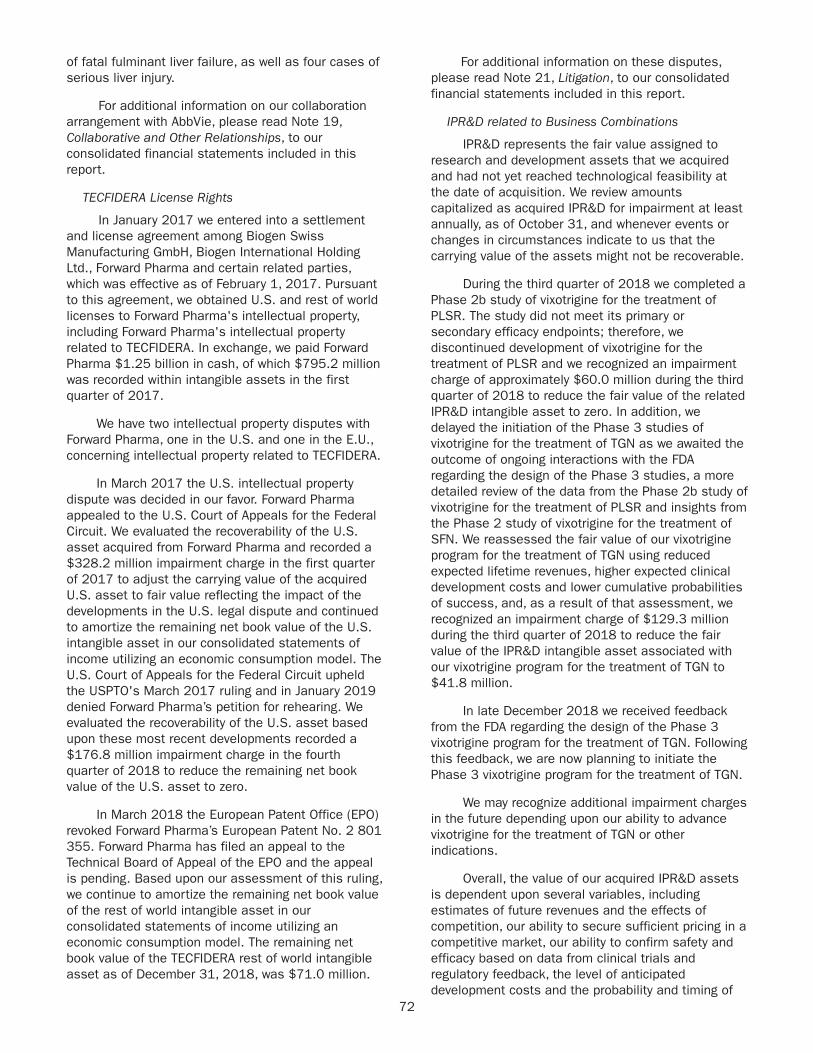
72
of fatal fulminant liver failure, as well as four cases of serious liver injury.
For additional information on our collaboration arrangement with AbbVie, please read Note 19, Collaborative and Other Relationships, to our consolidated financial statements included in this report.
TECFIDERA License Rights
In January 2017 we entered into a settlement and license agreement among Biogen Swiss Manufacturing GmbH, Biogen International Holding Ltd., Forward Pharma and certain related parties, which was effective as of February 1, 2017. Pursuant to this agreement, we obtained U.S. and rest of world licenses to Forward Pharma's intellectual property, including Forward Pharma's intellectual property related to TECFIDERA. In exchange, we paid Forward Pharma $1.25 billion in cash, of which $795.2 million was recorded within intangible assets in the first quarter of 2017.
We have two intellectual property disputes with Forward Pharma, one in the U.S. and one in the E.U., concerning intellectual property related to TECFIDERA.
In March 2017 the U.S. intellectual property dispute was decided in our favor. Forward Pharma appealed to the U.S. Court of Appeals for the Federal Circuit. We evaluated the recoverability of the U.S. asset acquired from Forward Pharma and recorded a $328.2 million impairment charge in the first quarter of 2017 to adjust the carrying value of the acquired U.S. asset to fair value reflecting the impact of the developments in the U.S. legal dispute and continued to amortize the remaining net book value of the U.S. intangible asset in our consolidated statements of income utilizing an economic consumption model. The U.S. Court of Appeals for the Federal Circuit upheld the USPTO's March 2017 ruling and in January 2019 denied Forward Pharma’s petition for rehearing. We evaluated the recoverability of the U.S. asset based upon these most recent developments recorded a $176.8 million impairment charge in the fourth quarter of 2018 to reduce the remaining net book value of the U.S. asset to zero.
In March 2018 the European Patent Office (EPO) revoked Forward Pharma’s European Patent No. 2 801 355. Forward Pharma has filed an appeal to the Technical Board of Appeal of the EPO and the appeal is pending. Based upon our assessment of this ruling, we continue to amortize the remaining net book value of the rest of world intangible asset in our consolidated statements of income utilizing an economic consumption model. The remaining net book value of the TECFIDERA rest of world intangible asset as of December 31, 2018, was $71.0 million.
For additional information on these disputes, please read Note 21, Litigation, to our consolidated financial statements included in this report.
IPR&D related to Business Combinations
IPR&D represents the fair value assigned to research and development assets that we acquired and had not yet reached technological feasibility at the date of acquisition. We review amounts capitalized as acquired IPR&D for impairment at least annually, as of October 31, and whenever events or changes in circumstances indicate to us that the carrying value of the assets might not be recoverable.
During the third quarter of 2018 we completed a Phase 2b study of vixotrigine for the treatment of PLSR. The study did not meet its primary or secondary efficacy endpoints; therefore, we discontinued development of vixotrigine for the treatment of PLSR and we recognized an impairment charge of approximately $60.0 million during the third quarter of 2018 to reduce the fair value of the related IPR&D intangible asset to zero. In addition, we delayed the initiation of the Phase 3 studies of vixotrigine for the treatment of TGN as we awaited the outcome of ongoing interactions with the FDA regarding the design of the Phase 3 studies, a more detailed review of the data from the Phase 2b study of vixotrigine for the treatment of PLSR and insights from the Phase 2 study of vixotrigine for the treatment of SFN. We reassessed the fair value of our vixotrigine program for the treatment of TGN using reduced expected lifetime revenues, higher expected clinical development costs and lower cumulative probabilities of success, and, as a result of that assessment, we recognized an impairment charge of $129.3 million during the third quarter of 2018 to reduce the fair value of the IPR&D intangible asset associated with our vixotrigine program for the treatment of TGN to $41.8 million.
In late December 2018 we received feedback from the FDA regarding the design of the Phase 3 vixotrigine program for the treatment of TGN. Following this feedback, we are now planning to initiate the Phase 3 vixotrigine program for the treatment of TGN.
We may recognize additional impairment charges in the future depending upon our ability to advance vixotrigine for the treatment of TGN or other indications.
Overall, the value of our acquired IPR&D assets is dependent upon several variables, including estimates of future revenues and the effects of competition, our ability to secure sufficient pricing in a competitive market, our ability to confirm safety and efficacy based on data from clinical trials and regulatory feedback, the level of anticipated development costs and the probability and timing of
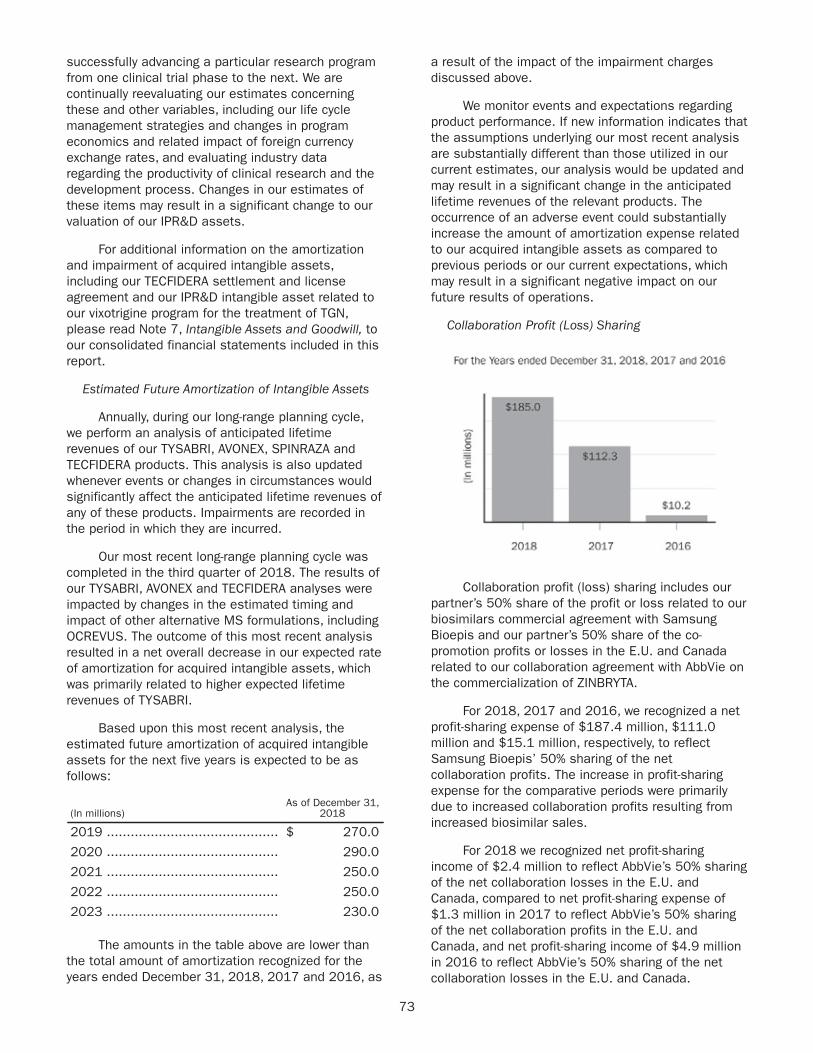
73
successfully advancing a particular research program from one clinical trial phase to the next. We are continually reevaluating our estimates concerning these and other variables, including our life cycle management strategies and changes in program economics and related impact of foreign currency exchange rates, and evaluating industry data regarding the productivity of clinical research and the development process. Changes in our estimates of these items may result in a significant change to our valuation of our IPR&D assets.
For additional information on the amortization and impairment of acquired intangible assets, including our TECFIDERA settlement and license agreement and our IPR&D intangible asset related to our vixotrigine program for the treatment of TGN, please read Note 7, Intangible Assets and Goodwill, to our consolidated financial statements included in this report.
Estimated Future Amortization of Intangible Assets
Annually, during our long-range planning cycle, we perform an analysis of anticipated lifetime revenues of our TYSABRI, AVONEX, SPINRAZA and TECFIDERA products. This analysis is also updated whenever events or changes in circumstances would significantly affect the anticipated lifetime revenues of any of these products. Impairments are recorded in the period in which they are incurred.
Our most recent long-range planning cycle was completed in the third quarter of 2018. The results of our TYSABRI, AVONEX and TECFIDERA analyses were impacted by changes in the estimated timing and impact of other alternative MS formulations, including OCREVUS. The outcome of this most recent analysis resulted in a net overall decrease in our expected rate of amortization for acquired intangible assets, which was primarily related to higher expected lifetime revenues of TYSABRI.
Based upon this most recent analysis, the estimated future amortization of acquired intangible assets for the next five years is expected to be as follows:
(In millions)As of December 31,
2018
2019 ........................................... $ 270.0
2020 ........................................... 290.0
2021 ........................................... 250.0
2022 ........................................... 250.0
2023 ........................................... 230.0
The amounts in the table above are lower than the total amount of amortization recognized for the years ended December 31, 2018, 2017 and 2016, as
a result of the impact of the impairment charges discussed above.
We monitor events and expectations regarding product performance. If new information indicates that the assumptions underlying our most recent analysis are substantially different than those utilized in our current estimates, our analysis would be updated and may result in a significant change in the anticipated lifetime revenues of the relevant products. The occurrence of an adverse event could substantially increase the amount of amortization expense related to our acquired intangible assets as compared to previous periods or our current expectations, which may result in a significant negative impact on our future results of operations.
Collaboration Profit (Loss) Sharing
Collaboration profit (loss) sharing includes our partner’s 50% share of the profit or loss related to our biosimilars commercial agreement with Samsung Bioepis and our partner’s 50% share of the co-promotion profits or losses in the E.U. and Canada related to our collaboration agreement with AbbVie on the commercialization of ZINBRYTA.
For 2018, 2017 and 2016, we recognized a net profit-sharing expense of $187.4 million, $111.0 million and $15.1 million, respectively, to reflect Samsung Bioepis’ 50% sharing of the net collaboration profits. The increase in profit-sharing expense for the comparative periods were primarily due to increased collaboration profits resulting from increased biosimilar sales.
For 2018 we recognized net profit-sharing income of $2.4 million to reflect AbbVie’s 50% sharing of the net collaboration losses in the E.U. and Canada, compared to net profit-sharing expense of $1.3 million in 2017 to reflect AbbVie’s 50% sharing of the net collaboration profits in the E.U. and Canada, and net profit-sharing income of $4.9 million in 2016 to reflect AbbVie’s 50% sharing of the net collaboration losses in the E.U. and Canada.
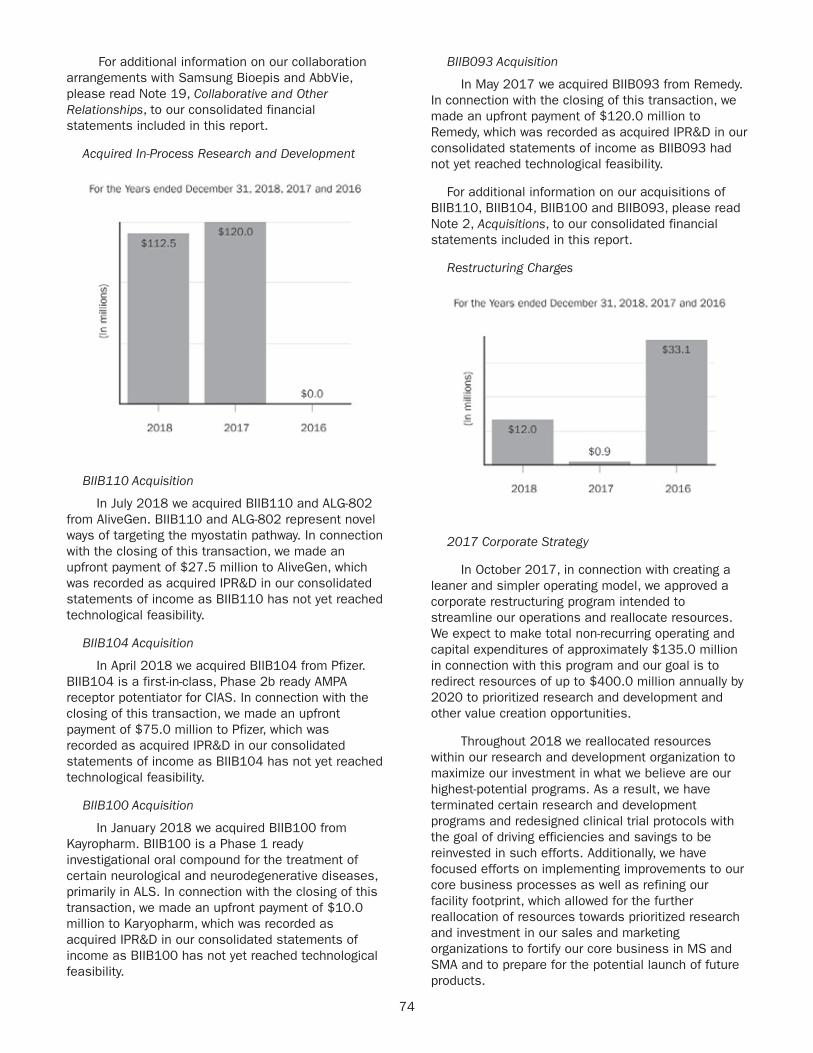
74
For additional information on our collaboration arrangements with Samsung Bioepis and AbbVie, please read Note 19, Collaborative and Other Relationships, to our consolidated financial statements included in this report.
Acquired In-Process Research and Development
BIIB110 Acquisition
In July 2018 we acquired BIIB110 and ALG-802 from AliveGen. BIIB110 and ALG-802 represent novel ways of targeting the myostatin pathway. In connection with the closing of this transaction, we made an upfront payment of $27.5 million to AliveGen, which was recorded as acquired IPR&D in our consolidated statements of income as BIIB110 has not yet reached technological feasibility.
BIIB104 Acquisition
In April 2018 we acquired BIIB104 from Pfizer. BIIB104 is a first-in-class, Phase 2b ready AMPA receptor potentiator for CIAS. In connection with the closing of this transaction, we made an upfront payment of $75.0 million to Pfizer, which was recorded as acquired IPR&D in our consolidated statements of income as BIIB104 has not yet reached technological feasibility.
BIIB100 Acquisition
In January 2018 we acquired BIIB100 from Kayropharm. BIIB100 is a Phase 1 ready investigational oral compound for the treatment of certain neurological and neurodegenerative diseases, primarily in ALS. In connection with the closing of this transaction, we made an upfront payment of $10.0 million to Karyopharm, which was recorded as acquired IPR&D in our consolidated statements of income as BIIB100 has not yet reached technological feasibility.
BIIB093 Acquisition
In May 2017 we acquired BIIB093 from Remedy. In connection with the closing of this transaction, we made an upfront payment of $120.0 million to Remedy, which was recorded as acquired IPR&D in our consolidated statements of income as BIIB093 had not yet reached technological feasibility.
For additional information on our acquisitions of BIIB110, BIIB104, BIIB100 and BIIB093, please read Note 2, Acquisitions, to our consolidated financial statements included in this report.
Restructuring Charges
2017 Corporate Strategy
In October 2017, in connection with creating a leaner and simpler operating model, we approved a corporate restructuring program intended to streamline our operations and reallocate resources. We expect to make total non-recurring operating and capital expenditures of approximately $135.0 million in connection with this program and our goal is to redirect resources of up to $400.0 million annually by 2020 to prioritized research and development and other value creation opportunities.
Throughout 2018 we reallocated resources within our research and development organization to maximize our investment in what we believe are our highest-potential programs. As a result, we have terminated certain research and development programs and redesigned clinical trial protocols with the goal of driving efficiencies and savings to be reinvested in such efforts. Additionally, we have focused efforts on implementing improvements to our core business processes as well as refining our facility footprint, which allowed for the further reallocation of resources towards prioritized research and investment in our sales and marketing organizations to fortify our core business in MS and SMA and to prepare for the potential launch of future products.

75
For the years ended December 31, 2018 and 2017, we recognized charges of $22.9 million and $19.4 million related to this effort, respectively, of which $12.0 million and $0.9 million, respectively, are reflected as restructuring charges and $10.9 million and $18.5 million, respectively, are included in selling, general and administrative expenses in our consolidated statements of income. These restructuring charges were primarily related to severance.
Restructuring charges incurred to date under this program have been substantially paid in cash as of December 31, 2018.
2016 Restructuring Charges
During the third quarter of 2016 we initiated cost saving measures primarily intended to realign our organizational structure due to the changes in roles and workforce resulting from our decision to spin-off our hemophilia business, and to achieve further targeted cost reductions. For the year ended December 31, 2016, we recognized charges totaling $17.7 million related to this effort. These amounts, which were substantially incurred and paid by the end of 2016, were primarily related to severance and are reflected in restructuring charges in our consolidated statements of income.
Cambridge, MA Manufacturing Facility
In June 2016 following an evaluation of our current and future manufacturing capabilities and capacity needs, we decided to cease manufacturing and vacate our 67,000 square foot small-scale biologics manufacturing facility in Cambridge, MA and close and vacate our 46,000 square foot warehouse space in Somerville, MA.
In December 2016 we subleased our rights to the Cambridge, MA manufacturing facility to Brammer Bio MA, LLC (Brammer). Brammer also purchased from us certain manufacturing equipment, leasehold improvements and other assets in exchange for shares of Brammer common LLC interests and assumed manufacturing operations effective January 1, 2017. In December 2016 we closed and vacated our warehouse space in Somerville, MA.
Our departure from these facilities shortened the expected useful lives of certain leasehold improvements and other assets at these facilities. As a result, we recorded additional depreciation expense to reflect the assets’ new shorter useful lives. For the year ended December 31, 2016, we recognized approximately $45.5 million of this additional depreciation, which was recorded as cost of sales in our consolidated statements of income.
In the fourth quarter of 2016 we also recognized charges totaling $7.4 million for severance costs
related to certain employees separated from Biogen in connection with our departure from these facilities. These amounts were substantially incurred and paid by the end of first quarter of 2017 and are reflected in restructuring charges in our consolidated statements of income for the year ended December 31, 2016.
2015 Restructuring Charges
Restructuring charges for the year ended December 31, 2016, include $8.0 million of expense related to our 2015 restructuring program.
(Gain) Loss on Fair Value Remeasurement of Contingent Consideration
Consideration payable for certain of our business combinations includes future payments that are contingent upon the occurrence of a particular event or events. We record an obligation for such contingent consideration payments at fair value on the acquisition date. We then revalue our contingent consideration obligations each reporting period. Changes in the fair value of our contingent consideration obligations, other than changes due to payments, are recognized as a (gain) loss on fair value remeasurement of contingent consideration in our consolidated statements of income.
The gain on fair value remeasurement of contingent consideration for 2018 was primarily due to delays in the expected timing of achievement of milestones related to our vixotrigine program for the treatment of TGN and an increase in discount rates used to revalue our contingent consideration liabilities, partially offset by the passage of time. For additional information on our IPR&D intangible asset related to our vixotrigine program for the treatment of TGN, please read Note 7, Intangible Assets and Goodwill, to our consolidated financial statements included in this report.
The loss on fair value remeasurement of contingent consideration for 2017 was primarily due to the increase in the probability of achieving certain

76
developmental milestones based upon the progression of the underlying clinical programs.
The loss on fair value remeasurement of contingent consideration for 2016 was primarily due to changes in the probability of achieving certain developmental milestones based upon the progression of the underlying clinical programs and changes in the discount rate.
TECFIDERA Litigation Settlement Charge
As described above under Amortization and Impairment of Acquired Intangible Assets - TECFIDERA License Rights, in January 2017 we entered into a settlement and license agreement with Forward Pharma pursuant to which we obtained U.S. and rest of world licenses to Forward Pharma’s intellectual property, including Forward Pharma’s intellectual property related to TECFIDERA. In exchange, we paid Forward Pharma $1.25 billion in cash. During the fourth quarter of 2016, we recognized a pre-tax charge of $454.8 million and, in the first quarter of 2017, we recognized an intangible asset of $795.2 million related to this agreement. The pre-tax charge recognized in the fourth quarter of 2016 represented the fair value of our licenses to Forward Pharma’s intellectual property for the period April 2014, when we started selling TECFIDERA, through December 31, 2016.
For additional information on our TECFIDERA settlement and license agreement, please read Note 7, Intangible Assets and Goodwill, to our consolidated financial statements included in this report.
Other Income (Expense), Net
Effective January 1, 2018, other income (expense), net for the year ended December 31, 2018, reflects the recognition of net gains (losses) recorded in relation to changes in the fair value of our strategic investments following our adoption of Accounting Standards Update (ASU) No. 2016-01, Financial Instruments - Overall (Subtopic 825-10): Recognition and Measurement of Financial Assets and Financial Liabilities. Changes in the fair value of our strategic investments could have a significant impact on our results of operations in any given period. For 2018 net gains (losses) recognized in relation to the changes in fair value of our strategic investments totaled $128.0 million, which are reflected in the net gains discussed below. Prior to the adoption of this standard, we recognized changes in fair value of our strategic investment in accumulated other comprehensive income (loss), net.
For 2018 compared to 2017, the change in other income (expense), net was primarily due to the recognition of net gains totaling $119.5 million recorded in 2018 in relation to our investment portfolio as compared to net losses totaling $36.3 million in 2017. The change in other income (expense), net for 2018, compared to 2017, was also due to a decrease in interest expense due to the redemption in November 2017 of our 6.875% Senior Notes due March 1, 2018, and an increase in capitalized interest costs, which was primarily related to the ongoing construction of our manufacturing facility in Solothurn, Switzerland as well as an increase in interest income primarily due to higher interest rates. These comparative net increases were partially offset by foreign exchange losses recognized in 2018 compared to gains recognized in 2017.
For 2017 compared to 2016, the change in other income (expense), net was primarily due to an increase in foreign currency exchange gains, an increase in interest income, primarily due to higher interest rates, and a decrease in interest expense
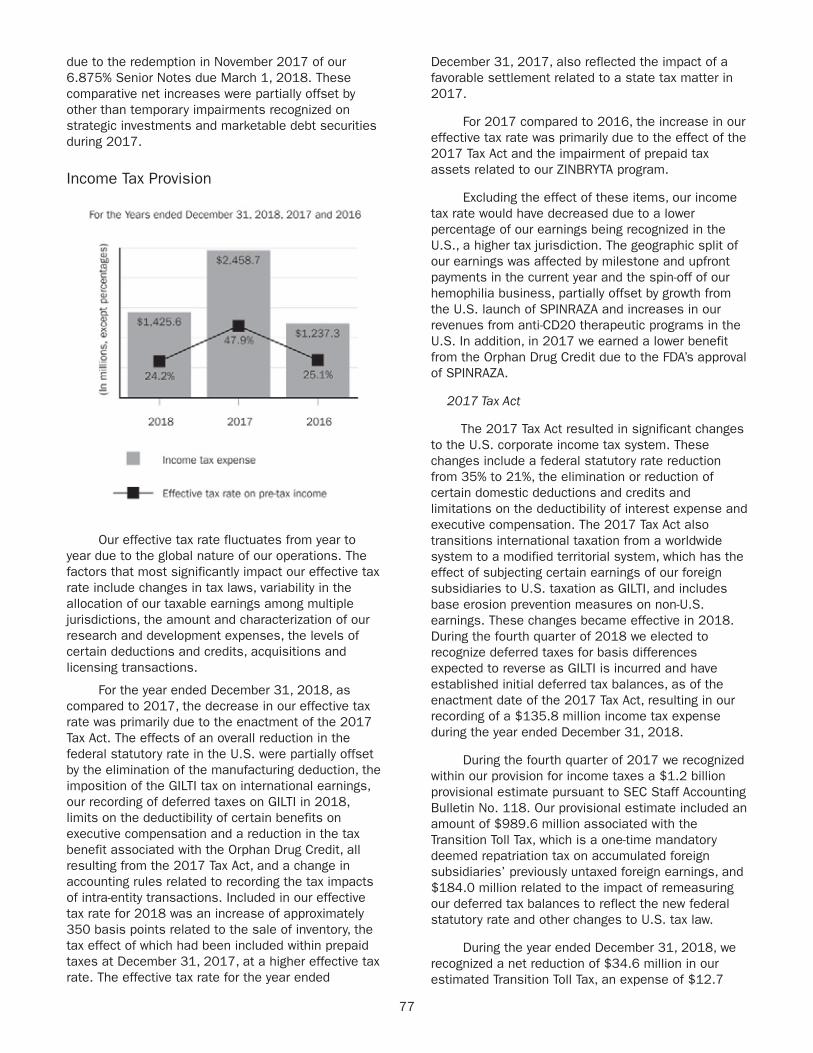
77
due to the redemption in November 2017 of our 6.875% Senior Notes due March 1, 2018. These comparative net increases were partially offset by other than temporary impairments recognized on strategic investments and marketable debt securities during 2017.
Income Tax Provision
Our effective tax rate fluctuates from year to year due to the global nature of our operations. The factors that most significantly impact our effective tax rate include changes in tax laws, variability in the allocation of our taxable earnings among multiple jurisdictions, the amount and characterization of our research and development expenses, the levels of certain deductions and credits, acquisitions and licensing transactions.
For the year ended December 31, 2018, as compared to 2017, the decrease in our effective tax rate was primarily due to the enactment of the 2017 Tax Act. The effects of an overall reduction in the federal statutory rate in the U.S. were partially offset by the elimination of the manufacturing deduction, the imposition of the GILTI tax on international earnings, our recording of deferred taxes on GILTI in 2018, limits on the deductibility of certain benefits on executive compensation and a reduction in the tax benefit associated with the Orphan Drug Credit, all resulting from the 2017 Tax Act, and a change in accounting rules related to recording the tax impacts of intra-entity transactions. Included in our effective tax rate for 2018 was an increase of approximately 350 basis points related to the sale of inventory, the tax effect of which had been included within prepaid taxes at December 31, 2017, at a higher effective tax rate. The effective tax rate for the year ended
December 31, 2017, also reflected the impact of a favorable settlement related to a state tax matter in 2017.
For 2017 compared to 2016, the increase in our effective tax rate was primarily due to the effect of the 2017 Tax Act and the impairment of prepaid tax assets related to our ZINBRYTA program.
Excluding the effect of these items, our income tax rate would have decreased due to a lower percentage of our earnings being recognized in the U.S., a higher tax jurisdiction. The geographic split of our earnings was affected by milestone and upfront payments in the current year and the spin-off of our hemophilia business, partially offset by growth from the U.S. launch of SPINRAZA and increases in our revenues from anti-CD20 therapeutic programs in the U.S. In addition, in 2017 we earned a lower benefit from the Orphan Drug Credit due to the FDA’s approval of SPINRAZA.
2017 Tax Act
The 2017 Tax Act resulted in significant changes to the U.S. corporate income tax system. These changes include a federal statutory rate reduction from 35% to 21%, the elimination or reduction of certain domestic deductions and credits and limitations on the deductibility of interest expense and executive compensation. The 2017 Tax Act also transitions international taxation from a worldwide system to a modified territorial system, which has the effect of subjecting certain earnings of our foreign subsidiaries to U.S. taxation as GILTI, and includes base erosion prevention measures on non-U.S. earnings. These changes became effective in 2018. During the fourth quarter of 2018 we elected to recognize deferred taxes for basis differences expected to reverse as GILTI is incurred and have established initial deferred tax balances, as of the enactment date of the 2017 Tax Act, resulting in our recording of a $135.8 million income tax expense during the year ended December 31, 2018.
During the fourth quarter of 2017 we recognized within our provision for income taxes a $1.2 billion provisional estimate pursuant to SEC Staff Accounting Bulletin No. 118. Our provisional estimate included an amount of $989.6 million associated with the Transition Toll Tax, which is a one-time mandatory deemed repatriation tax on accumulated foreign subsidiaries’ previously untaxed foreign earnings, and $184.0 million related to the impact of remeasuring our deferred tax balances to reflect the new federal statutory rate and other changes to U.S. tax law.
During the year ended December 31, 2018, we recognized a net reduction of $34.6 million in our estimated Transition Toll Tax, an expense of $12.7
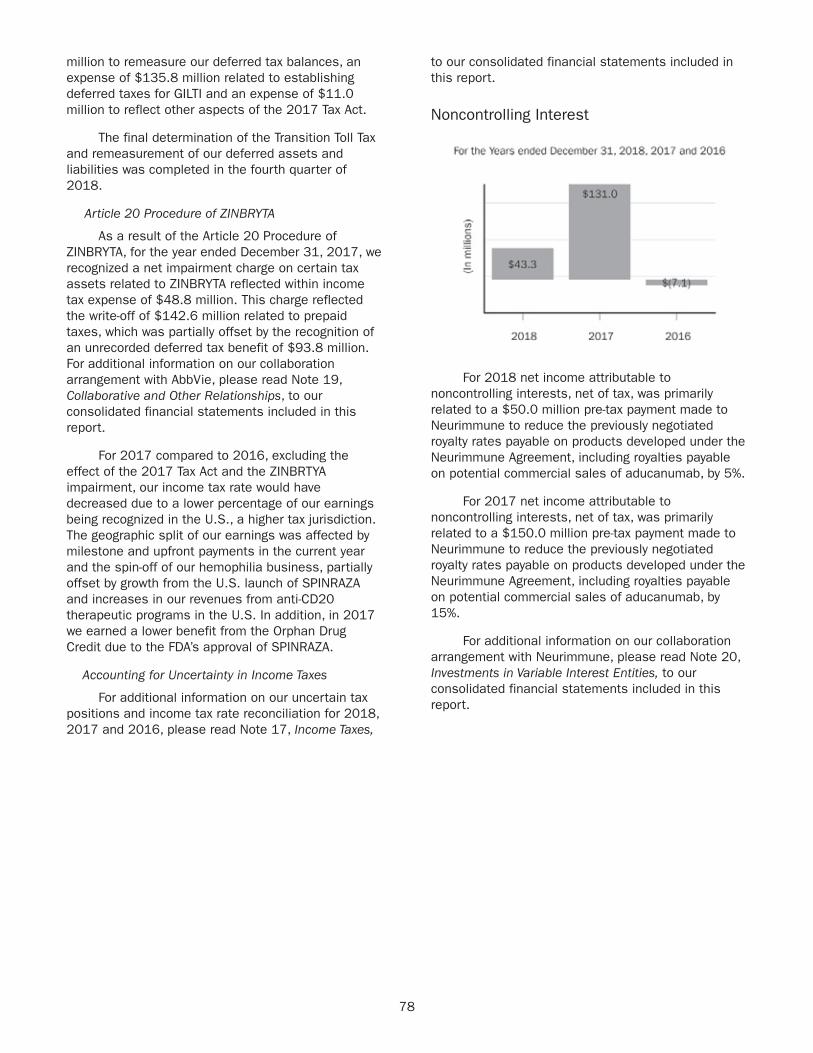
78
million to remeasure our deferred tax balances, an expense of $135.8 million related to establishing deferred taxes for GILTI and an expense of $11.0 million to reflect other aspects of the 2017 Tax Act.
The final determination of the Transition Toll Tax and remeasurement of our deferred assets and liabilities was completed in the fourth quarter of 2018.
Article 20 Procedure of ZINBRYTA
As a result of the Article 20 Procedure of ZINBRYTA, for the year ended December 31, 2017, we recognized a net impairment charge on certain tax assets related to ZINBRYTA reflected within income tax expense of $48.8 million. This charge reflected the write-off of $142.6 million related to prepaid taxes, which was partially offset by the recognition of an unrecorded deferred tax benefit of $93.8 million. For additional information on our collaboration arrangement with AbbVie, please read Note 19, Collaborative and Other Relationships, to our consolidated financial statements included in this report.
For 2017 compared to 2016, excluding the effect of the 2017 Tax Act and the ZINBRTYA impairment, our income tax rate would have decreased due to a lower percentage of our earnings being recognized in the U.S., a higher tax jurisdiction. The geographic split of our earnings was affected by milestone and upfront payments in the current year and the spin-off of our hemophilia business, partially offset by growth from the U.S. launch of SPINRAZA and increases in our revenues from anti-CD20 therapeutic programs in the U.S. In addition, in 2017 we earned a lower benefit from the Orphan Drug Credit due to the FDA’s approval of SPINRAZA.
Accounting for Uncertainty in Income Taxes
For additional information on our uncertain tax positions and income tax rate reconciliation for 2018, 2017 and 2016, please read Note 17, Income Taxes,
to our consolidated financial statements included in this report.
Noncontrolling Interest
For 2018 net income attributable to noncontrolling interests, net of tax, was primarily related to a $50.0 million pre-tax payment made to Neurimmune to reduce the previously negotiated royalty rates payable on products developed under the Neurimmune Agreement, including royalties payable on potential commercial sales of aducanumab, by 5%.
For 2017 net income attributable to noncontrolling interests, net of tax, was primarily related to a $150.0 million pre-tax payment made to Neurimmune to reduce the previously negotiated royalty rates payable on products developed under the Neurimmune Agreement, including royalties payable on potential commercial sales of aducanumab, by 15%.
For additional information on our collaboration arrangement with Neurimmune, please read Note 20, Investments in Variable Interest Entities, to our consolidated financial statements included in this report.

79
Financial Condition, Liquidity and Capital ResourcesOur financial condition is summarized as follows:
As of December 31, % Change
(In millions, except percentages) 2018 2017
2018 compared to
2017
Financial assets:Cash and cash equivalents ....................................................... $ 1,224.6 $ 1,573.8 (22.2)%Marketable securities — current ............................................... 2,313.4 2,115.2 9.4 %Marketable securities — non-current ......................................... 1,375.9 3,057.3 (55.0)%
Total cash, cash equivalents and marketable securities .......... $ 4,913.9 $ 6,746.3 (27.2)%Borrowings:Current portion of notes payable and other financingarrangements .......................................................................... $ — $ 3.2 (100.0)%Notes payable and other financing arrangements........................ 5,936.5 5,935.0 — %
Total borrowings ................................................................... $ 5,936.5 $ 5,938.2 — %Working Capital:Current assets ......................................................................... $ 7,640.9 $ 7,873.3 (3.0)%Current liabilities...................................................................... (3,295.2) (3,368.2) (2.2)%
Total working capital ............................................................. $ 4,345.7 $ 4,505.1 (3.5)%
For the year ended December 31, 2018, certain significant cash flows were as follows:
• $6.2 billion in net cash flows provided by operating activities, net of:
$1.0 billion in total net payments for income taxes;
$375.0 million in an upfront payment made to Ionis upon the closing of the 2018 Ionis Agreement and a $162.1 million expense reflecting the premium paid for the purchase of Ionis’ common stock;
• $4.4 billion used for share repurchases;
• $1.5 billion in contingent payments made to former shareholders of Fumapharm AG and holders of their rights;
• $770.6 million used for purchases of property, plant and equipment;
• $676.6 million payment made to Samsung BioLogics upon the closing of the share purchase transaction increasing our ownership percentage in Samsung Bioepis to approximately 49.9%;
• $462.9 million payment made to Ionis reflecting the fair value of the common stock purchased upon the closing the 2018 Ionis Agreement; and
• $112.5 million in payments made for the acquisitions of BIIB100, BIIB104 and BIIB110.
For the year ended December 31, 2017, certain significant cash flows were as follows:
• $4.6 billion in net cash flows provided by operating activities, net of:
$1.1 billion in total net payments for income taxes;
$463.0 million in upfront and milestone payments made to BMS, iPierian, Eisai, Alkermes and Ionis; and
$454.8 million payment made to Forward Pharma for the litigation settlement charge that was accrued as of December 31, 2016;
• $1.4 billion used for share repurchases;
• $1.2 billion in contingent payments made to former shareholders of Fumapharm AG and holders of their rights;
• $867.4 million used for purchases of property, plant and equipment;
• $795.2 million payment made to Forward Pharma to license Forward Pharma’s intellectual property, including Forward Pharma’s intellectual property related to TECFIDERA;
• $557.7 million payment made for the redemption of our 6.875% Senior Notes due March 1, 2018, prior to their maturity;
• $302.7 million net cash contribution made in connection with the spin-off of our hemophilia business;

80
• $295.0 million in upfront and milestone payments made to Remedy, Ionis and Samsung Bioepis; and
• $132.4 million payment, net of tax, made to Neurimmune in exchange for a 15% reduction in the previously negotiated royalty rates payable on products developed under the Neurimmune Agreement, including royalties payable on potential commercial sales of aducanumab.
Overview
We have historically financed our operating and capital expenditures primarily through cash flows earned through our operations. We expect to continue funding our current and planned operating requirements principally through our cash flows from operations, as well as our existing cash resources. We believe that our existing funds, when combined with cash generated from operations and our access to additional financing resources, if needed, are sufficient to satisfy our operating, working capital, strategic alliance, milestone payment, capital expenditure and debt service requirements for the foreseeable future. In addition, we may choose to opportunistically return cash to shareholders and pursue other business initiatives, including acquisition and licensing activities. We may, from time to time, also seek additional funding through a combination of new collaborative agreements, strategic alliances and additional equity and debt financings or from other sources should we identify a significant new opportunity.
Tax Reform
The 2017 Tax Act resulted in significant changes to the U.S. corporate income tax system.
The 2017 Tax Act eliminated the deferral of U.S. income tax on the historical unrepatriated earnings by imposing the Transition Toll Tax, which is a one-time mandatory deemed repatriation tax on accumulated foreign subsidiaries’ previously untaxed foreign earnings. The Transition Toll Tax was assessed on our share of our foreign corporations’ accumulated foreign earnings that have not previously been taxed.
At December 31, 2018, we considered none of our earnings to be permanently reinvested outside the U.S. and therefore recorded deferred tax liabilities associated with an estimate of the total withholding taxes expected as a result of our repatriation of earnings. Other than for earnings, we are permanently reinvested for book/tax basis differences related to foreign subsidiaries. These differences are estimated to total approximately $1.5 billion and primarily arose through the impacts of purchase accounting. These basis differences could reverse through sales of the foreign subsidiaries, as well as various other events,
none of which are considered probable as of December 31, 2018. The residual U.S. tax liability, if these differences would reverse, would be between $0.3 billion to $0.4 billion as of December 31, 2018.
As of December 31, 2018 and 2017, we have accrued income tax liabilities of $697.0 million and $989.6 million, respectively, under the Transition Toll Tax. The decrease in this liability is primarily attributed to our 2018 Transition Toll Tax payment of $85.0 million, the application by the IRS of an approximately $150.0 million overpayment against the accrual and the net reduction of approximately $34.6 million in our estimated Transition Toll Tax. Of the amounts accrued as of December 31, 2018, no amounts are expected to be paid within one year due to the overpayment discussed above. The Transition Toll Tax will be paid in installments over an eight-year period, which started in 2018, and will not accrue interest. For additional information on the 2017 Tax Act, please read Note 17, Income Taxes, to our consolidated financial statements included in this report.
After repatriating approximately $3.5 billion during the first quarter of 2018 as a result of the 2017 Tax Act, approximately 51% of our total cash, cash equivalents and marketable securities at the end of the year were held in the U.S.
For additional information on certain risks that could negatively impact our financial position or future results of operations, please read Item 1A. Risk Factors and Item 7A. Quantitative and Qualitative Disclosures About Market Risk included in this report.
Share Repurchase Programs
In August 2018 our Board of Directors authorized our 2018 Share Repurchase Program, which is a program to repurchase up to $3.5 billion of our common stock. Our 2018 Share Repurchase program does not have an expiration date. All share repurchases under our 2018 Share Repurchase Program will be retired. Under our 2018 Share Repurchase Program, we repurchased and retired approximately 4.3 million shares of our common stock at a cost of approximately $1.4 billion during the year ended December 31, 2018.
In July 2016 our Board of Directors authorized our 2016 Share Repurchase Program, which is a program to repurchase up to $5.0 billion of our common stock. Our 2016 Share Repurchase Program was completed as of June 30, 2018. All share repurchases under our 2016 Share Repurchase Program were retired. Under our 2016 Share Repurchase Program, we repurchased and retired approximately 10.5 million, 3.7 million and 3.3 million shares of common stock at a cost of approximately $3.0 billion, $1.0 billion and $1.0 billion during the
81
years ended December 31, 2018, 2017 and 2016, respectively.
In February 2011 our Board of Directors authorized our 2011 Share Repurchase Program, which is a program to repurchase up to 20.0 million shares of our common stock. Our 2011 Share Repurchase Program was completed as of March 31, 2017. Share repurchases under our 2011 Share Repurchase Program were principally used to offset common stock issuances under our share-based compensation programs. Under our 2011 Share Repurchase Program, we repurchased approximately 1.2 million shares of common stock at a cost of $365.4 million during the year ended December 31, 2017. We did not repurchase any shares of common stock under our 2011 Share Repurchase Program during the year ended December 31, 2016.
Cash, Cash Equivalents and Marketable Securities
Until required for another use in our business, we typically invest our cash reserves in bank deposits, certificates of deposit, commercial paper, corporate notes, U.S. and foreign government instruments and other interest-bearing marketable debt instruments in accordance with our investment policy. It is our policy to mitigate credit risk in our cash reserves and marketable securities by maintaining a well-diversified portfolio that limits the amount of exposure as to institution, maturity and investment type.
As of December 31, 2018, we had cash, cash equivalents and marketable securities totaling approximately $4.9 billion compared to approximately $6.7 billion as of December 31, 2017. The net decrease in cash, cash equivalents and marketable securities at December 31, 2018, from December 31, 2017, was primarily due to cash used for share repurchases, contingent payments made to former shareholders of Fumapharm AG and holders of their rights, the payment made to Ionis upon the closing of the 2018 Ionis Agreement, net purchases of property, plant and equipment, payment made to Samsung BioLogics upon the closing of the share purchase transaction increasing our ownership percentage in Samsung Bioepis to approximately 49.9%, the upfront payments made to Karyopharm, Pfizer and AliveGen upon the acquisitions of BIIB100, BIIB104 and BIIB110, respectively, and the payment made to Ionis for the option exercise for BIIB067. These decreases were partially offset by cash flows from operations.
In addition, investments and other assets in our consolidated balance sheet as of December 31, 2018, includes the carrying value of our investment in Samsung Bioepis of $680.6 million. As Samsung Bioepis is a privately-held entity, our ability to liquidate our investment in Samsung Bioepis, may be limited and we may realize significantly less than the value of
such investment. Investments in other assets, as of December 31, 2018, also includes an asset of $563.8 million reflecting the fair value of our investment in Ionis’ common stock, which is subject to certain holding period restrictions.
For additional information on our acquisitions of BIIB100, BIIB104 and BIIB110, please read Note 2, Acquisitions, to our consolidated financial statements included in this report. For additional information on the 2018 Ionis Agreement, the additional investment in Samsung Bioepis and the option exercise for BIIB067, please read Note 19, Collaborative and Other Relationships, to our consolidated financial statements included in this report.
Borrowings
The following is a summary of our principal indebtedness as of December 31, 2018:
• $1.5 billion aggregate principal amount of 2.90% Senior Notes due September 15, 2020, valued at 99.792% of par;
• $1.0 billion aggregate principal amount of 3.625% Senior Notes due September 15, 2022, valued at 99.920% of par;
• $1.75 billion aggregate principal amount of 4.05% Senior Notes due September 15, 2025, valued at 99.764% of par; and
• $1.75 billion aggregate principal amount of 5.20% Senior Notes due September 15, 2045, valued at 99.294% of par.
These Senior Notes were issued at discount and are amortized as additional interest expense over the period from issuance through maturity.
During the third quarter of 2015 we entered into a $1.0 billion, five-year senior unsecured revolving credit facility under which we are permitted to draw funds for working capital and general corporate purposes. The terms of the revolving credit facility include a financial covenant that requires us not to exceed a maximum consolidated leverage ratio. As of December 31, 2018, we had no outstanding borrowings and were in compliance with all covenants under this facility.
In connection with our 2006 distribution agreement with Fumedica AG, we issued notes totaling 61.4 million Swiss Francs that were payable to Fumedica AG in varying amounts from June 2008 through June 2018. In June 2018 we redeemed our remaining note payable to Fumedica AG, which had a carrying value of 3.1 million Swiss Francs ($3.2 million) as of December 31, 2017.
82
For a summary of the fair values of our outstanding borrowings as of December 31, 2018 and 2017, please read Note 8, Fair Value Measurements, to our consolidated financial statements included in this report.
Working Capital
Working capital is defined as current assets less current liabilities. The change in working capital at December 31, 2018, from December 31, 2017, reflects a decrease in total current assets of $232.4 million and a decrease in total current liabilities of $73.0 million.
The net decrease in total current assets was primarily due to a decrease in prepaid taxes related to intra-entity inventory transactions, partially offset by an increase in accounts receivable, net related to our ongoing operations.
The net decrease in total current liabilities was primarily due to a reduction in accrued expenses and other and a decrease in accounts payable. The net decrease in accrued expenses and other was due to a decrease in the accrual of contingent payments related to FUMADERM and TECFIDERA (together, the Fumapharm Products), a decrease in accrued contingent consideration due to the milestone payment made to the former shareholders of Stromedix Inc. (Stromedix) and a decrease in our derivative liabilities. These decreases were partially offset by an increase in our accrued revenue related rebates due primarily to an increase in SPINRAZA and biosimilars revenues and an increase in accrued collaboration expenses due to an increase in expenses related to our collaboration with Samsung Bioepis.
Cash Flows
The following table summarizes our cash flow activity:
For the Years Ended
December 31,
% Change
2018 compared to
2017
2017 compared to
2016(In millions, except percentages) 2018 2017 2016
Net cash flows provided by operatingactivities................................................ $ 6,187.7 $ 4,551.0 $ 4,587.2 36.0 % (0.8)%Net cash flows used in investingactivities................................................ $ (2,046.3) $ (2,963.1) $ (2,484.8) (30.9)% 19.2 %Net cash flows used in financingactivities................................................ $ (4,472.0) $ (2,380.0) $ (1,052.6) 87.9 % 126.1 %
Operating Activities
Cash flows from operating activities represent the cash receipts and disbursements related to all of our activities other than investing and financing activities. We expect cash provided from operating activities will continue to be our primary source of funds to finance operating needs and capital expenditures for the foreseeable future.
Operating cash flow is derived by adjusting our net income for:
• non-cash operating items such as depreciation and amortization, impairment charges, acquired IPR&D and share-based compensation;
• changes in operating assets and liabilities which reflect timing differences between the receipt and payment of cash associated with transactions and when they are recognized in results of operations; and
• changes in the fair value of contingent payments associated with our acquisitions of businesses and payments related to collaborations.
For 2018 compared to 2017, the increase in net cash flows provided by operating activities was primarily due to an increase in net income, improved collections from customers and collaborators, higher relative accruals for revenue-related reserves and lower overall cash income taxes paid. These factors were partially offset by higher spending related to business development activities discussed below.
The net cash flows provided by operating activities for the year ended December 31, 2018, were reduced by the $375.0 million upfront payment made to Ionis upon the closing of the 2018 Ionis Agreement and the $162.1 million charge reflecting the premium paid for the purchase of Ionis’ common stock compared to payments totaling $463.0 million in 2017 to BMS, iPierian, Eisai, Alkermes and Ionis.
The net cash flows provided by operating activities for the year ended December 31, 2017, were reduced by the $454.8 million payment made to Forward Pharma for the litigation settlement charge in the first quarter of 2017 that was accrued as of December 31, 2016.
83
For 2017 compared to 2016, net cash flows provided by operations were relatively consistent. Higher sales and lower income tax payments were offset by the $454.8 million payment related to our settlement and license agreement with Forward Pharma, which had been accrued as of December 31, 2016, and the timing of customer payments, including amounts due in connection with anti-CD20 therapeutic programs.
For 2017 compared to 2016, net income was lower primarily due to the Transition Toll Tax under the 2017 Tax Act and higher depreciation and amortization.
Investing Activities
For 2018 compared to 2017, the decrease in net cash flows used in investing activities was primarily due to:
• higher net proceeds of marketable securities;
• the 2017 $795.2 million payment made to Forward Pharma to license Forward Pharma’s intellectual property, including Forward Pharma’s intellectual property related to TECFIDERA; and
• a decrease in purchases of property, plant and equipment.
These changes were partially offset by the following increases to investing activity:
• the $676.6 million payment made to Samsung BioLogics upon the closing of the share purchase transaction increasing our ownership percentage in Samsung Bioepis to approximately 49.9%;
• the $462.9 million payment made to Ionis reflecting the fair value of the common stock purchased upon the closing of the 2018 Ionis Agreement; and
• an increase in contingent payments made to former shareholders of Fumapharm AG and holders of their rights.
For 2017 compared to 2016, the increase in net cash flows used in investing activities was primarily due to:
• the $795.2 million payment made to Forward Pharma to license Forward Pharma’s intellectual property, including Forward Pharma’s intellectual property related to TECFIDERA;
• an increase in purchases of property, plant and equipment primarily related to the construction of our Solothurn, Switzerland facility;
• $175.0 million in milestone payments made to Ionis and Samsung Bioepis; and
• the $120.0 million payment made to Remedy for the acquisition of BIIB093.
These increases were partially offset by an increase in net proceeds of marketable securities.
Financing Activities
For 2018 compared to 2017, the increase in net cash flows used in financing activities was primarily due to an increase in cash used for share repurchases. The effect of the increase in share repurchases was partially offset by lower repayment of outstanding debt, the contribution made in connection with the spin-off of our hemophilia business in the first quarter of 2017 and lower net distributions to noncontrolling interest reflecting the payments made to Neurimmune in October 2017 and May 2018.
For 2017 compared to 2016, the increase in net cash flows used in financing activities was primarily due to an increase in cash used for share repurchases, the payment made for the redemption of our 6.875% Senior Notes due March 1, 2018, prior to their maturity, the net cash contribution made in connection with the spin-off of our hemophilia business on February 1, 2017, and the net distributions to noncontrolling interest, including the payment made to Neurimmune in exchange for a reduction of 15% in the previously negotiated royalty rates payable on products developed under the Neurimmune Agreement, including royalties payable on potential commercial sales of aducanumab.
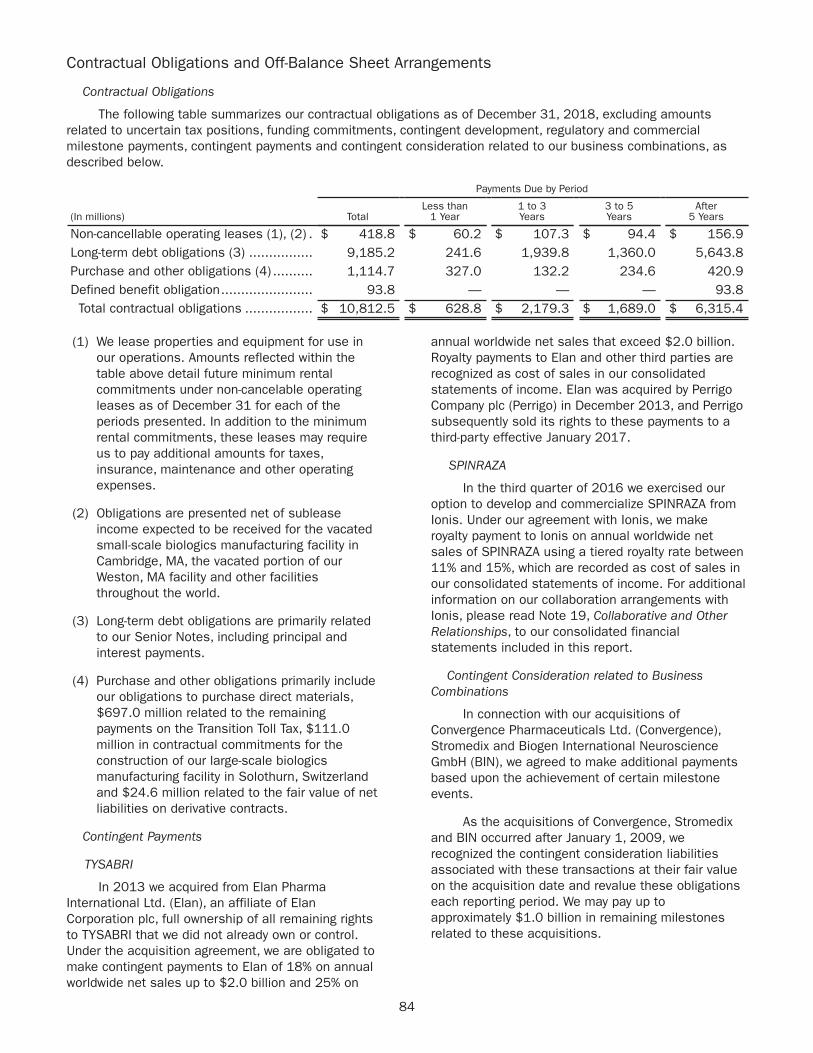
84
Contractual Obligations and Off-Balance Sheet Arrangements
Contractual Obligations
The following table summarizes our contractual obligations as of December 31, 2018, excluding amounts related to uncertain tax positions, funding commitments, contingent development, regulatory and commercial milestone payments, contingent payments and contingent consideration related to our business combinations, as described below.
Payments Due by Period
(In millions) TotalLess than
1 Year1 to 3Years
3 to 5Years
After5 Years
Non-cancellable operating leases (1), (2) . $ 418.8 $ 60.2 $ 107.3 $ 94.4 $ 156.9Long-term debt obligations (3) ................ 9,185.2 241.6 1,939.8 1,360.0 5,643.8Purchase and other obligations (4) .......... 1,114.7 327.0 132.2 234.6 420.9Defined benefit obligation....................... 93.8 — — — 93.8Total contractual obligations ................. $ 10,812.5 $ 628.8 $ 2,179.3 $ 1,689.0 $ 6,315.4
(1) We lease properties and equipment for use in our operations. Amounts reflected within the table above detail future minimum rental commitments under non-cancelable operating leases as of December 31 for each of the periods presented. In addition to the minimum rental commitments, these leases may require us to pay additional amounts for taxes, insurance, maintenance and other operating expenses.
(2) Obligations are presented net of sublease income expected to be received for the vacated small-scale biologics manufacturing facility in Cambridge, MA, the vacated portion of our Weston, MA facility and other facilities throughout the world.
(3) Long-term debt obligations are primarily related to our Senior Notes, including principal and interest payments.
(4) Purchase and other obligations primarily include our obligations to purchase direct materials, $697.0 million related to the remaining payments on the Transition Toll Tax, $111.0 million in contractual commitments for the construction of our large-scale biologics manufacturing facility in Solothurn, Switzerland and $24.6 million related to the fair value of net liabilities on derivative contracts.
Contingent Payments
TYSABRI
In 2013 we acquired from Elan Pharma International Ltd. (Elan), an affiliate of Elan Corporation plc, full ownership of all remaining rights to TYSABRI that we did not already own or control. Under the acquisition agreement, we are obligated to make contingent payments to Elan of 18% on annual worldwide net sales up to $2.0 billion and 25% on
annual worldwide net sales that exceed $2.0 billion. Royalty payments to Elan and other third parties are recognized as cost of sales in our consolidated statements of income. Elan was acquired by Perrigo Company plc (Perrigo) in December 2013, and Perrigo subsequently sold its rights to these payments to a third-party effective January 2017.
SPINRAZA
In the third quarter of 2016 we exercised our option to develop and commercialize SPINRAZA from Ionis. Under our agreement with Ionis, we make royalty payment to Ionis on annual worldwide net sales of SPINRAZA using a tiered royalty rate between 11% and 15%, which are recorded as cost of sales in our consolidated statements of income. For additional information on our collaboration arrangements with Ionis, please read Note 19, Collaborative and Other Relationships, to our consolidated financial statements included in this report.
Contingent Consideration related to Business Combinations
In connection with our acquisitions of Convergence Pharmaceuticals Ltd. (Convergence), Stromedix and Biogen International Neuroscience GmbH (BIN), we agreed to make additional payments based upon the achievement of certain milestone events.
As the acquisitions of Convergence, Stromedix and BIN occurred after January 1, 2009, we recognized the contingent consideration liabilities associated with these transactions at their fair value on the acquisition date and revalue these obligations each reporting period. We may pay up to approximately $1.0 billion in remaining milestones related to these acquisitions.

85
Fumapharm AG
In 2006 we acquired Fumapharm AG. As part of this acquisition we acquired FUMADERM and TECFIDERA (together, the Fumapharm Products). We paid $220.0 million upon closing of the transaction and agreed to pay an additional $15.0 million if a Fumapharm Product was approved for MS in the U.S. or E.U. In the second quarter of 2013 TECFIDERA was approved in the U.S. for MS by the FDA and we made the $15.0 million contingent payment. We are also required to make additional contingent payments to former shareholders of Fumapharm AG and holders of their rights based on the attainment of certain cumulative sales levels of Fumapharm Products and the level of total net sales of Fumapharm Products in the prior 12-month period, as defined in the acquisition agreement, until such time as the cumulative sales level reached $20.0 billion, at which time no further contingent payments are due. These payments are accounted for as an increase to goodwill as incurred, in accordance with the accounting standard applicable to business combinations when we acquired Fumapharm AG. Any portion of the payment that is tax deductible was recorded as a reduction to goodwill. Payments are due within 60 days following the end of the quarter in which the applicable cumulative sales level was reached.
During 2018 we paid $1.5 billion in contingent payments as we reached the $15.0 billion and $16.0 billion cumulative sales levels related to the Fumapharm Products in the fourth quarter of 2017 and the $17.0 billion, $18.0 billion and $19.0 billion cumulative sales levels related to the Fumapharm Products in the first, second and third quarters of 2018, respectively. In the fourth quarter of 2018 we achieved the $20.0 billion cumulative sales level threshold and accrued our last $300.0 million contingent payment related to the Fumapharm Products, which will be paid in the first quarter of 2019.
Contingent Development, Regulatory and Commercial Milestone Payments
Based on our development plans as of December 31, 2018, we could make potential future milestone payments to third parties of up to approximately $5.0 billion, including approximately $0.7 billion in development milestones, approximately $1.8 billion in regulatory milestones and approximately $2.5 billion in commercial milestones, as part of our various collaborations, including licensing and development programs. Payments under these agreements generally become due and payable upon achievement of certain development, regulatory or commercial milestones. Because the achievement of these milestones was not considered probable as
of December 31, 2018, such contingencies have not been recorded in our financial statements. Amounts related to contingent milestone payments are not considered contractual obligations as they are contingent on the successful achievement of certain development, regulatory approval or commercial milestones.
Provided various development, regulatory or commercial milestones are achieved, we anticipate that we may pay approximately $250.0 million of milestone payments in 2019.
Other Funding Commitments
As of December 31, 2018, we have several ongoing clinical studies in various clinical trial stages. Our most significant clinical trial expenditures are to contract research organizations (CROs). The contracts with CROs are generally cancellable, with notice, at our option. We recorded accrued expenses of approximately $27.0 million in our consolidated balance sheet for expenditures incurred by CROs as of December 31, 2018. We have approximately $655.0 million in cancellable future commitments based on existing CRO contracts as of December 31, 2018.
Tax Related Obligations
We exclude liabilities pertaining to uncertain tax positions from our summary of contractual obligations as we cannot make a reliable estimate of the period of cash settlement with the respective taxing authorities. As of December 31, 2018, we have $117.7 million of net liabilities associated with uncertain tax positions.
As of December 31, 2018 and 2017, we have accrued income tax liabilities of $697.0 million and $989.6 million, respectively, under the Transition Toll Tax. Of the amounts accrued as of December 31, 2018, no amounts are expected to be paid within one year due to a $150.0 million overpayment of taxes in the current year. The Transition Toll Tax will be paid in installments over an eight-year period, which started in 2018, and will not accrue interest.
Other Off-Balance Sheet Arrangements
We do not have any relationships with entities often referred to as structured finance or special purpose entities that were established for the purpose of facilitating off-balance sheet arrangements. As such, we are not exposed to any financing, liquidity, market or credit risk that could arise if we had engaged in such relationships. We consolidate variable interest entities if we are the primary beneficiary.

86
Legal MattersFor a discussion of legal matters as of
December 31, 2018, please read Note 21, Litigation, to our consolidated financial statements included in this report.
Critical Accounting EstimatesThe preparation of our consolidated financial
statements, which have been prepared in accordance with accounting principles generally accepted in the U.S. (U.S. GAAP), requires us to make estimates, judgments and assumptions that may affect the reported amounts of assets, liabilities, equity, revenues and expenses and related disclosure of contingent assets and liabilities. On an ongoing basis we evaluate our estimates, judgments and methodologies. We base our estimates on historical experience and on various other assumptions that we believe are reasonable, the results of which form the basis for making judgments about the carrying values of assets, liabilities and equity and the amount of revenues and expenses. Actual results may differ from these estimates. Other significant accounting policies are outlined in Note 1, Summary of Significant Accounting Policies, to our consolidated financial statements included in this report.
Revenue Recognition
In May 2014 the Financial Accounting Standards Board (FASB) issued ASU No. 2014-09, Revenue from Contracts with Customers (Topic 606), which supersedes all existing revenue recognition requirements, including most industry specific guidance. This standard requires a company to recognize revenues when it transfers goods or services to customers in an amount that reflects the consideration that the company expects to receive for those goods or services.
The FASB subsequently issued the following amendments to ASU 2014-09 that have the same effective date and transition date: ASU No. 2016-08, Revenue from Contract with Customers (Topic 606): Principal versus Agent Considerations; ASU No. 2016-10, Revenue from Contracts with Customers (Topic 606): Identifying Performance Obligations and Licensing; ASU No. 2016-12, Revenue from Contracts with Customers (Topic 606): Narrow-Scope Improvements and Practical Expedients; and ASU No. 2016-20, Technical Corrections and Improvements to Topic 606, Revenue from Contracts with Customers. We adopted these amendments with ASU 2014-09 (collectively, the new revenue standards).
The new revenue standards became effective for us on January 1, 2018, and were adopted using the modified retrospective method. The adoption of the new revenue standards as of January 1, 2018, did not
result in a significant change to our revenue recognition as the majority of our revenues continue to be recognized when the customer takes control of our product. As we did not identify any accounting changes that impacted the amount of reported revenues with respect to our product revenues, revenues from anti-CD20 therapeutic programs or other revenues, no adjustment to retained earnings was required upon adoption. However, the adoption of the new revenue standards will result in a change in the timing of revenue recognition related to certain of our contract manufacturing activities based upon the terms of the underlying agreements.
Under the new revenue standards, we recognize revenues when our customer obtains control of promised goods or services, in an amount that reflects the consideration which we expect to receive in exchange for those goods or services. We recognize revenues following the five-step model prescribed under ASU 2014-09: (i) identify contract(s) with a customer; (ii) identify the performance obligations in the contract; (iii) determine the transaction price; (iv) allocate the transaction price to the performance obligations in the contract; and (v) recognize revenues when (or as) we satisfy the performance obligation.
Product Revenues
In the U.S., we sell our products primarily to wholesale distributors and specialty pharmacy providers. In other countries, we sell our products primarily to wholesale distributors, hospitals, pharmacies and other third-party distribution partners. These customers subsequently resell our products to health care providers and patients. In addition, we enter into arrangements with health care providers and payors that provide for government-mandated or privately-negotiated discounts and allowances related to our products.
Revenues from product sales are recognized when the customer obtains control of our product, which occurs at a point in time, typically upon delivery to the customer. We expense incremental costs of obtaining a contract as and when incurred if the expected amortization period of the asset that we would have recognized is one year or less or the amount is immaterial.
Reserves for Discounts and Allowances
Revenues from product sales are recorded net of reserves established for applicable discounts and allowances that are offered within contracts with our customers, health care providers or payors, including those associated with the implementation of pricing actions in certain of the international markets in which we operate. Our process for estimating reserves established for these variable consideration
87
components do not differ materially from our historical practices.
Product revenue reserves, which are classified as a reduction in product revenues, are generally characterized in the following categories: discounts, contractual adjustments and returns.
These reserves are based on estimates of the amounts earned or to be claimed on the related sales and are classified as reductions of accounts receivable (if the amount is payable to our customer) or a liability (if the amount is payable to a party other than our customer). Our estimates of reserves established for variable consideration are calculated based upon a consistent application of our methodology utilizing the expected value method. These estimates reflect our historical experience, current contractual and statutory requirements, specific known market events and trends, industry data and forecasted customer buying and payment patterns. The transaction price, which includes variable consideration reflecting the impact of discounts and allowances, may be subject to constraint and is included in the net sales price only to the extent that it is probable that a significant reversal of the amount of cumulative revenues recognized will not occur in a future period. Actual amounts may ultimately differ from our estimates. If actual results vary, we adjust these estimates, which could have an effect on earnings in the period of adjustment.
In addition to the discounts, rebates and product returns, we also maintain certain customer service contracts with distributors and other customers in the distribution channel that provide us with inventory management, data and distribution services, which are generally reflected as a reduction of revenues. To the extent we can demonstrate a separable benefit and fair value for these services we classify these payments in selling, general and administrative expenses.
For additional information on our revenues, please read Note 5, Revenues, to our consolidated financial statements included in this report.
Acquired Intangible Assets, including IPR&D
When we purchase a business, the acquired IPR&D is measured at fair value, capitalized as an intangible asset and tested for impairment at least annually, as of October 31, until commercialization, after which time the IPR&D is amortized over its estimated useful life. If we acquire an asset or group of assets that do not meet the definition of a business under applicable accounting standards, the acquired IPR&D is expensed on its acquisition date. Future costs to develop these assets are recorded to
research and development expense as they are incurred.
We have acquired, and expect to continue to acquire, intangible assets through the acquisition of biotechnology companies or through the consolidation of variable interest entities. These intangible assets primarily consist of technology associated with human therapeutic products and IPR&D product candidates. When significant identifiable intangible assets are acquired, we generally engage an independent third-party valuation firm to assist in determining the fair values of these assets as of the acquisition date. Management will determine the fair value of less significant identifiable intangible assets acquired. Discounted cash flow models are typically used in these valuations, and these models require the use of significant estimates and assumptions including but not limited to:
• estimating the timing of and expected costs to complete the in-process projects;
• projecting regulatory approvals;
• estimating future cash flows from product sales resulting from completed products and in process projects; and
• developing appropriate discount rates and probability rates by project.
We believe the fair values assigned to the intangible assets acquired are based upon reasonable estimates and assumptions given available facts and circumstances as of the acquisition dates.
If these projects are not successfully developed, the sales and profitability of the company may be adversely affected in future periods. Additionally, the value of the acquired intangible assets may become impaired. We believe that the foregoing assumptions used in the IPR&D analysis were reasonable. No assurance can be given that the underlying assumptions used to estimate expected project sales, development costs or profitability, or the events associated with such projects, will transpire as estimated.
Impairment and Amortization of Long-lived Assets and Accounting for Goodwill
Long-lived Assets Other than Goodwill
Long-lived assets to be held and used include property, plant and equipment as well as intangible assets, including IPR&D and trademarks. Property, plant and equipment are reviewed for impairment whenever events or changes in circumstances indicate that the carrying amount of the assets may not be recoverable. We review our intangible assets

88
with indefinite lives for impairment annually, as of October 31, and whenever events or changes in circumstances indicate that the carrying value of an asset may not be recoverable.
When performing our impairment assessment, we calculate the fair value using the same methodology as described above under Acquired Intangible Assets, including IPR&D. If the carrying value of our acquired IPR&D exceeds its fair value, then the intangible asset is written-down to its fair value. Changes in the estimates and assumptions used in determining the fair value of our acquired IPR&D could result in an impairment. Impairments are recorded within amortization and impairment of acquired intangible assets in our consolidated statements of income. Assets that have previously been impaired, including our vixotrigine program for the treatment of neuropathic pain, such as TGN, could become further impaired in the future.
Our most significant intangible assets are our acquired and in-licensed rights and patents and developed technology. Acquired and in-licensed rights and patents primarily relate to our acquisition of all remaining rights to TYSABRI from Elan and obtaining the fair value of the U.S. and rest of world licenses to Forward Pharma’s intellectual property, including Forward Pharma’s intellectual property related to TECFIDERA. Developed technology primarily relates to our AVONEX product, which was recorded in connection with the merger of Biogen, Inc. and IDEC Pharmaceuticals Corporation in 2003. We amortize the intangible assets related to our TYSABRI, AVONEX, SPINRAZA and TECFIDERA products using the economic consumption method based on revenues generated from the products underlying the related intangible assets. An analysis of the anticipated lifetime revenues of TYSABRI, AVONEX, SPINRAZA and TECFIDERA is performed annually during our long-range planning cycle and whenever events or changes in circumstances would significantly affect the anticipated lifetime revenues of our TYSABRI, AVONEX, SPINRAZA or TECFIDERA products.
For additional information on the impairment charges related to our long-lived assets during 2018, 2017 and 2016, please read Note 7, Intangible Assets and Goodwill, to our consolidated financial statements included in this report.
Goodwill
Goodwill relates largely to amounts that arose in connection with the merger of Biogen, Inc. and IDEC Pharmaceuticals Corporation in 2003 and amounts that are being paid in connection with the acquisition of Fumapharm AG. Our goodwill balances represent the difference between the purchase price and the fair value of the identifiable tangible and intangible net
assets when accounted for using the purchase method of accounting.
We assess our goodwill balance within our single reporting unit annually, as of October 31, and whenever events or changes in circumstances indicate the carrying value of goodwill may not be recoverable to determine whether any impairment in this asset may exist and, if so, the extent of such impairment. We compare the fair value of our reporting unit to its carrying value. If the carrying value of the net assets assigned to the reporting unit exceeds the fair value of our reporting unit, we would record an impairment loss equal to the difference.
We completed our required annual impairment test in the fourth quarters of 2018, 2017 and 2016 and determined in each of those periods that the carrying value of goodwill was not impaired. In each year, the fair value of our reporting unit, which includes goodwill, was significantly in excess of the carrying value of our reporting unit.
Investments, including Fair Value Measurements and Impairment
We invest in various types of securities, including short-term and long-term marketable securities, principally corporate notes, government securities including government sponsored enterprise mortgage-backed securities and credit card and auto loan asset-backed securities, in which our excess cash balances are invested. We also invest in equity securities of certain biotechnology companies and venture capital funds where the underlying investments are in equity securities of certain biotechnology companies.
In accordance with the accounting standard for fair value measurements, we have classified our financial assets as Level 1, 2 or 3 within the fair value hierarchy. Fair values determined by Level 1 inputs utilize quoted prices (unadjusted) in active markets for identical assets that we have the ability to access. Fair values determined by Level 2 inputs utilize data points that are observable such as quoted prices, interest rates, yield curves, foreign currency spot rates and option pricing valuation models. Fair values determined by Level 3 inputs utilize unobservable data points for the asset.
As discussed in Note 8, Fair Value Measurements, to our consolidated financial statements included in this report, a majority of our financial assets have been classified as Level 2. These assets have been initially valued at the transaction price and subsequently valued, at the end of each reporting period, utilizing third-party pricing services or option pricing valuation models. The pricing services use many observable market inputs to determine value, including reportable trades,

89
benchmark yields, credit spreads, broker/dealer quotes, bids, offers, current spot rates and other industry and economic events. We validate the prices provided by our third-party pricing services by understanding the models used, obtaining market values from other pricing sources and analyzing pricing data in certain instances. The option pricing valuation models use assumptions within the model, including the term, stock price volatility, constant maturity risk-free interest rate and dividend yield.
Changes in our fair value measurements could have a significant impact on our results of operations in any given period.
Impairment
We conduct periodic reviews to identify and evaluate each investment that has an unrealized loss, in accordance with the meaning of other-than-temporary impairment and its application to certain investments. An unrealized loss exists when the current fair value of an individual security is less than its amortized cost basis. Unrealized losses on available-for-sale debt securities that are determined to be temporary, and not related to credit loss, are recorded, net of tax, in accumulated other comprehensive income.
For available-for-sale debt securities with unrealized losses, management performs an analysis to assess whether we intend to sell or whether we would more likely than not be required to sell the security before the expected recovery of the amortized cost basis. Where we intend to sell a security, or may be required to do so, the security’s decline in fair value is deemed to be other-than-temporary and the full amount of the unrealized loss is reflected within earnings as an impairment loss.
Regardless of our intent to sell a security, we perform additional analysis on all securities with unrealized losses to evaluate losses associated with the creditworthiness of the security. Credit losses are identified where we do not expect to receive cash flows sufficient to recover the amortized cost basis of a security and are reflected within earnings as an impairment loss.
Share-Based Compensation
We make certain assumptions in order to value and record expense associated with awards made under our share-based compensation arrangements. Changes in these assumptions may lead to variability with respect to the amount of expense we recognize in connection with share-based payments.
Determining the appropriate valuation model and related assumptions requires judgment, and includes estimating the expected market price of our stock on vesting date and stock price volatility as well as the
term of the expected awards. Determining the appropriate amount to expense based on the anticipated achievement of performance targets requires judgment, including forecasting the achievement of future financial targets. The estimate of expense is revised periodically based on the probability of achieving the required performance targets and adjustments are made throughout the term as appropriate. The cumulative impact of any revision is reflected in the period of change.
We also estimate forfeitures over the requisite service period when recognizing share-based compensation expense based on historical rates and forward-looking factors. These estimates are adjusted to the extent that actual forfeitures differ, or are expected to materially differ, from our estimates.
Contingent Consideration
For acquisitions completed before January 1, 2009, we record contingent consideration resulting from a business combination when the contingency is resolved. For acquisitions of a business completed after January 1, 2009, we record contingent consideration resulting from a business combination at its fair value on the acquisition date. Each reporting period thereafter, we revalue these obligations and record increases or decreases in their fair value as an adjustment to contingent consideration expense in our consolidated statements of income. Changes in the fair value of our contingent consideration obligations can result from changes to one or multiple inputs, including adjustments to the discount rates and achievement and timing of any cumulative sales-based and development milestones or changes in the probability of certain clinical events and changes in the assumed probability associated with regulatory approval. These fair value measurements represent Level 3 measurements as they are based on significant inputs not observable in the market.
Significant judgment is employed in determining the appropriateness of these assumptions as of the acquisition date and for each subsequent period. Accordingly, changes in assumptions described above, could have a material impact on the amount of contingent consideration expense we record in any given period.
Income Taxes
We prepare and file income tax returns based on our interpretation of each jurisdiction’s tax laws and regulations. In preparing our consolidated financial statements, we estimate our income tax liability in each of the jurisdictions in which we operate by estimating our actual current tax expense together with assessing temporary differences resulting from differing treatment of items for tax and financial

90
reporting purposes. These differences result in deferred tax assets and liabilities, which are included in our consolidated balance sheets. Upon our election in the fourth quarter of 2018 to record deferred taxes for GILTI, we have included amounts related to U.S. GILTI taxes within temporary difference. Significant management judgment is required in assessing the realizability of our deferred tax assets. In performing this assessment, we consider whether it is more likely than not that some portion or all of the deferred tax assets will not be realized. The ultimate realization of deferred tax assets is dependent upon the generation of future taxable income during the periods in which those temporary differences become deductible. In making this determination, under the applicable financial accounting standards, we are allowed to consider the scheduled reversal of deferred tax liabilities, projected future taxable income and the effects of tax planning strategies. Our estimates of future taxable income include, among other items, our estimates of future income tax deductions related to the exercise of stock options. In the event that actual results differ from our estimates, we adjust our estimates in future periods and we may need to establish a valuation allowance, which could materially impact our consolidated financial position and results of operations.
In October 2016 the FASB issued ASU No. 2016-16, Income Taxes (Topic 740): Intra-Entity Transfer of Assets Other Than Inventory. This standard eliminates the deferral of the tax effects of intra-entity asset transfers other than inventory. As a result, the income tax consequences from the intra-entity transfer of an asset other than inventory and associated changes to deferred taxes will be recognized when the transfer occurs.
We adopted this standard on January 1, 2018, using the modified retrospective method, through a cumulative-effect adjustment to retained earnings as of that date. Upon adoption, we recognized additional deferred tax assets of approximately $2.0 billion, offset by a corresponding increase to deferred tax liabilities of approximately $1.5 billion and an increase to retained earnings of approximately $0.5 billion. In the fourth quarter of 2018, when we elected to begin recognizing deferred taxes on the GILTI tax calculation, we recorded an additional deferred tax liability of $0.4 billion with a corresponding reduction to our retained earnings as these differences are related to inter-entity transactions. We will recognize incremental deferred income tax expense thereafter as these deferred tax assets and liabilities are utilized.
For additional information on ASU 2016-16, please read Note 17, Income Taxes, to our
consolidated financial statements included in this report.
We account for uncertain tax positions using a “more-likely-than-not” threshold for recognizing and resolving uncertain tax positions. We evaluate uncertain tax positions on a quarterly basis and consider various factors including, but not limited to, changes in tax law, the measurement of tax positions taken or expected to be taken in tax returns, the effective settlement of matters subject to audit, information obtained during in process audit activities and changes in facts or circumstances related to a tax position. We adjust the level of the liability to reflect any subsequent changes in the relevant facts surrounding the uncertain positions. Our liabilities for uncertain tax positions can be relieved only if the contingency becomes legally extinguished, through either payment to the taxing authority or the expiration of the statute of limitations, the recognition of the benefits associated with the position meet the “more-likely-than-not” threshold or the liability becomes effectively settled through the examination process. We consider matters to be effectively settled once the taxing authority has completed all of its required or expected examination procedures, including all appeals and administrative reviews, we have no plans to appeal or litigate any aspect of the tax position and we believe that it is highly unlikely that the taxing authority would examine or re-examine the related tax position. We also accrue for potential interest and penalties related to unrecognized tax benefits in income tax expense.
We earn a significant amount of our operating income outside the U.S. As a result, a portion of our cash, cash equivalents and marketable securities are held by foreign subsidiaries.
The 2017 Tax Act resulted in significant changes to the U.S. corporate income tax system.
The 2017 Tax Act eliminated the deferral of U.S. income tax on the historical unrepatriated earnings by imposing the Transition Toll Tax, which is a one-time mandatory deemed repatriation tax on accumulated foreign subsidiaries’ previously untaxed foreign earnings. The Transition Toll Tax was assessed on our share of our foreign corporations’ accumulated foreign earnings that were not previously taxed.
As of December 31, 2018 and 2017, we have accrued income tax liabilities of $697.0 million and $989.6 million, respectively, under the Transition Toll Tax. Of the amounts accrued as of December 31, 2018, no amounts are expected to be paid within one year due to a $150.0 million overpayment of taxes in the current year. The Transition Toll Tax will be paid in installments over an eight-year period, which started in 2018, and will not accrue interest.
91
New Accounting StandardsFor a discussion of new accounting standards
and their expected impact on our consolidated financial statements or disclosures, please read Note 1, Summary of Significant Accounting Policies, to our consolidated financial statements included in this report.
Item 7A. Quantitative and Qualitative Disclosures About Market Risk
We are subject to certain risks that may affect our results of operations, cash flows and fair values of assets and liabilities, including volatility in foreign currency exchange rates, interest rate movements, pricing pressures worldwide and weak economic conditions in the foreign markets in which we operate. We manage the impact of foreign currency exchange rates and interest rates through various financial instruments, including derivative instruments such as foreign currency forward contracts, interest rate lock contracts and interest rate swap contracts. We do not enter into financial instruments for trading or speculative purposes. The counterparties to these contracts are major financial institutions, and there is no significant concentration of exposure with any one counterparty.
Foreign Currency Exchange Risk
Our results of operations are subject to foreign currency exchange rate fluctuations due to the global nature of our operations. We have operations or maintain distribution relationships in the U.S., Europe, Canada, Asia, and Central and South America. In addition, we recognize our share of pre-tax co-promotion profits on RITUXAN in Canada. As a result, our consolidated financial position, results of operations and cash flows can be affected by market fluctuations in foreign currency exchange rates, primarily with respect to the Euro, British pound sterling, Canadian dollar, Swiss franc, Danish krone and Japanese yen.
While the financial results of our global activities are reported in U.S. dollars, the functional currency for most of our foreign subsidiaries is their respective local currency. Fluctuations in the foreign currency exchange rates of the countries in which we do business will affect our operating results, often in ways that are difficult to predict. In particular, as the U.S. dollar strengthens versus other currencies, the value of the non-U.S. revenues will decline when reported in U.S. dollars. The impact to net income as a result of a strengthening U.S. dollar will be partially mitigated by the value of non-U.S. expenses, which will also decline when reported in U.S. dollars. As the U.S. dollar weakens versus other currencies, the
value of the non-U.S. revenues and expenses will increase when reported in U.S. dollars.
We have established revenue and operating expense hedging and balance sheet risk management programs to protect against volatility of future foreign currency cash flows and changes in fair value caused by volatility in foreign currency exchange rates.
During the second quarter of 2018 the International Practices Task Force of the Center for Audit Quality categorized Argentina as a country with a projected three-year cumulative inflation rate greater than 100%, which indicated that Argentina’s economy is highly inflationary. This categorization did not have a material impact on our results of operations or financial position as of December 31, 2018, and is not expected to have a material impact on our results of operations or financial position in the future.
Revenue and Operating Expense Hedging Program
Our foreign currency hedging program is designed to mitigate, over time, a portion of the impact resulting from volatility in exchange rate changes on revenues and operating expenses. We use foreign currency forward contracts to manage foreign currency risk, with the majority of our forward contracts used to hedge certain forecasted revenue and operating expense transactions denominated in foreign currencies in the next 12 months. We do not engage in currency speculation. For a more detailed disclosure of our revenue and operating expense hedging program, please read Note 10, Derivative Instruments, to our consolidated financial statements included in this report.
Our ability to mitigate the impact of foreign currency exchange rate changes on revenues and net income diminishes as significant foreign currency exchange rate fluctuations are sustained over extended periods of time. In particular, devaluation or significant deterioration of foreign currency exchange rates are difficult to mitigate and likely to negatively impact earnings. The cash flows from these contracts are reported as operating activities in our consolidated statements of cash flows.
Balance Sheet Risk Management Hedging Program
We also use forward contracts to mitigate the foreign currency exposure related to certain balance sheet items. The primary objective of our balance sheet risk management program is to mitigate the exposure of foreign currency denominated net monetary assets and liabilities of foreign affiliates. In these instances, we principally utilize currency forward contracts. We have not elected hedge accounting for the balance sheet related items. The cash flows from these contracts are reported as operating activities in our consolidated statements of cash flows.
92
The following quantitative information includes the impact of currency movements on forward contracts used in our revenue, operating expense and balance sheet hedging programs. As of December 31, 2018 and 2017, a hypothetical adverse 10% movement in foreign currency exchange rates compared to the U.S. dollar across all maturities would result in a hypothetical decrease in the fair value of forward contracts of approximately $290.0 million and $286.0 million, respectively. The estimated fair value change was determined by measuring the impact of the hypothetical exchange rate movement on outstanding forward contracts. Our use of this methodology to quantify the market risk of such instruments is subject to assumptions and actual impact could be significantly different. The quantitative information about market risk is limited because it does not take into account all foreign currency operating transactions.
Net Investment Hedge Program
Our net investment hedging program is designed to mitigate currency fluctuations between the U.S. dollar and South Korean won as a result of exercising our option to increase our ownership percentage in Samsung Bioepis to approximately 49.9%. We entered into foreign currency forward contracts to manage the foreign currency risk with our forward contracts used to hedge changes in the spot rate over the next 10 months. As of December 31, 2018, a hypothetical adverse 10% movement would result in a hypothetical decrease in fair value of approximately $64.0 million. The estimated fair value was determined by measuring the impact of the hypothetical spot rate movement on outstanding forward contracts.
Interest Rate Risk
Our investment portfolio includes cash equivalents and short-term investments. The fair value of our marketable securities is subject to change as a result of potential changes in market interest rates. The potential change in fair value for interest rate sensitive instruments has been assessed on a hypothetical 100 basis point adverse movement across all maturities. As of December 31, 2018 and 2017, we estimate that such hypothetical 100 basis point adverse movement would result in a hypothetical loss in fair value of approximately $19.0 million and $50.0 million, respectively, to our interest rate sensitive instruments. The fair values of our investments were determined using third-party pricing services or other market observable data.
To achieve a desired mix of fixed and floating interest rate debt, we entered into interest rate swap contracts during 2015 for certain of our fixed-rate debt. These derivative contracts effectively converted a fixed-rate interest coupon to a floating-rate LIBOR-based coupon over the life of the respective note. As
of December 31, 2018 and 2017, a 100 basis-point adverse movement (increase in LIBOR) would increase annual interest expense by approximately $6.8 million.
Pricing Pressure
Governments in certain international markets in which we operate have implemented measures, and may in the future implement new or additional measures, to reduce health care costs to limit the overall level of government expenditures. These measures vary by country and may include, among other things, patient access restrictions, suspensions on price increases, prospective and possible retroactive price reductions and other recoupments and increased mandatory discounts or rebates, recoveries of past price increases and greater importation of drugs from lower-cost countries. In addition, certain countries set prices by reference to the prices in other countries where our products are marketed. Thus, our inability to obtain and maintain adequate prices in a particular country may adversely affect our ability to secure acceptable prices in existing and potential new markets, which may limit market growth. The continued implementation of pricing actions throughout Europe may also lead to higher levels of parallel trade.
In the U.S., federal and state legislatures, health agencies and third-party payors continue to focus on containing the cost of health care. Legislative and regulatory proposals, enactments to reform health care insurance programs and increasing pressure from social sources could significantly influence the way our products are prescribed and purchased. It is possible that additional federal health care reform measures will be adopted in the future, which could result in increased pricing pressure and reduced reimbursement for our products and otherwise have an adverse impact on our consolidated financial position or results of operations. There is also significant economic pressure on state budgets that may result in states increasingly seeking to achieve budget savings through mechanisms that limit coverage or payment for our drugs. Managed care organizations are also continuing to seek price discounts and, in some cases, impose restrictions on the coverage of certain drugs.
Our products are also susceptible to increasing competition in many markets from generics, biosimilars, prodrugs and other products approved under alternative regulatory pathways. Generic versions of drugs, biosimilars and other products approved under alternative regulatory pathways are likely to be sold at substantially lower prices than branded products. Accordingly, the introduction of such products, as well as other lower-priced competing products, may significantly reduce both the

93
price that we receive for branded products and the volume of branded products that we sell, which will negatively impact our revenues.
Credit Risk
We are subject to credit risk from our accounts receivable related to our product sales. The majority of our accounts receivable arise from product sales in the U.S. and Europe with concentrations of credit risk limited due to the wide variety of customers and markets using our products, as well as their dispersion across many different geographic areas. Our accounts receivable are primarily due from wholesale and other third-party distributors, public hospitals, pharmacies and other government entities. We monitor the financial performance and creditworthiness of our customers so that we can properly assess and respond to changes in their credit profile. We operate in certain countries where weakness in economic conditions can result in extended collection periods. We continue to monitor these conditions, including the volatility associated with international economies and the relevant financial markets, and assess their possible impact on our business. To date, we have not experienced any significant losses with respect to the collection of our accounts receivable.
Credit and economic conditions in the E.U. continue to remain uncertain, which has, from time to time, led to long collection periods for our accounts receivable and greater collection risk in certain countries.
We believe that our allowance for doubtful accounts was adequate as of December 31, 2018 and 2017. However, if significant changes occur in the availability of government funding or the reimbursement practices of these or other governments, we may not be able to collect on amounts due to us from customers in such countries and our results of operations could be adversely affected.
Item 8. Financial Statements and Supplementary Data
The information required by this Item 8 is contained on pages F-1 through F-83 of this report and is incorporated herein by reference.
Item 9. Changes in and Disagreements with Accountants on Accounting and Financial Disclosure
None.
Item 9A. Controls and Procedures
Disclosure Controls and Procedures and Internal Control over Financial Reporting
Controls and Procedures
We have carried out an evaluation, under the supervision and with the participation of our management, including our principal executive officer and principal financial officer, of the effectiveness of the design and operation of our disclosure controls and procedures (as defined in Rules 13a-15(e) and 15d-15(e) under the Securities Exchange Act of 1934, as amended), as of December 31, 2018. Based upon that evaluation, our principal executive officer and principal financial officer concluded that, as of the end of the period covered by this report, our disclosure controls and procedures are effective in ensuring that (a) the information required to be disclosed by us in the reports that we file or submit under the Securities Exchange Act is recorded, processed, summarized and reported within the time periods specified in the SEC’s rules and forms and (b) such information is accumulated and communicated to our management, including our principal executive officer and principal financial officer, as appropriate to allow timely decisions regarding required disclosure. In designing and evaluating our disclosure controls and procedures, our management recognized that any controls and procedures, no matter how well designed and operated, can provide only reasonable assurance of achieving the desired control objectives, and our management necessarily was required to apply its judgment in evaluating the cost-benefit relationship of possible controls and procedures.
Changes in Internal Control over Financial Reporting
There were no changes in our internal control over financial reporting during the quarter ended December 31, 2018, that have materially affected, or are reasonably likely to materially affect, our internal control over financial reporting.
Management’s Annual Report on Internal Control over Financial Reporting
Our management is responsible for establishing and maintaining adequate internal control over our financial reporting. Internal control over financial reporting is defined in Rules 13a-15(f) and 15d-15(f) under the Securities Exchange Act as a process designed by, or under the supervision of, a company’s principal executive and principal financial officers and effected by a company’s board of directors, management and other personnel to provide reasonable assurance regarding the reliability of financial reporting and the preparation of financial statements for external purposes in accordance with
94
U.S. GAAP. Our internal control over financial reporting includes those policies and procedures that:
• pertain to the maintenance of records that, in reasonable detail, accurately and fairly reflect our transactions and dispositions of our assets;
• provide reasonable assurance that transactions are recorded as necessary to permit preparation of financial statements in accordance with U.S. GAAP, and that our receipts and expenditures are being made only in accordance with authorizations of our management and directors; and
• provide reasonable assurance regarding prevention or timely detection of unauthorized acquisition, use or disposition of our assets that could have a material effect on our financial statements.
Because of its inherent limitations, internal control over financial reporting may not prevent or detect misstatements. Projections of any evaluation of effectiveness to future periods are subject to the risk that controls may become inadequate because of changes in conditions, or that the degree of compliance with the policies or procedures may deteriorate.
Our management assessed the effectiveness of our internal control over financial reporting as of December 31, 2018. In making this assessment, management used the criteria set forth by the Committee of Sponsoring Organizations of the Treadway Commission (COSO) in its 2013 Internal Control — Integrated Framework.
Based on our assessment, our management has concluded that, as of December 31, 2018, our internal control over financial reporting is effective based on those criteria.
The effectiveness of our internal control over financial reporting as of December 31, 2018, has been audited by PricewaterhouseCoopers LLP, an independent registered public accounting firm, as stated in their attestation report, which is included herein.
Item 9B. Other InformationNone.
95
PART III
Item 10. Directors, Executive Officers and Corporate Governance
The information concerning our executive officers is set forth under the heading Our Executive Officers in Item 1 of this report. The text of our code of business conduct, which includes the code of ethics that applies to our principal executive officer, principal financial officer, principal accounting officer or controller, and persons performing similar functions, is posted on our website, www.biogen.com, under the “Corporate Governance” subsection of the “Investors” section of the site. We intend to make all required disclosures regarding any amendments to, or waivers from, provisions of our code of business conduct at the same location of our website.
The response to the remainder of this item is incorporated by reference from the discussion responsive thereto in the sections entitled “Proposal 1 - Election of Directors,” “Corporate Governance at Biogen,” “Stock Ownership - Section 16(a) Beneficial Ownership Reporting Compliance” and “Miscellaneous - Stockholder Proposals” contained in the proxy statement for our 2019 annual meeting of stockholders.
Item 11. Executive CompensationThe response to this item is incorporated by
reference from the discussion responsive thereto in the sections entitled “Executive Compensation Matters” and “Corporate Governance at Biogen” contained in the proxy statement for our 2019 annual meeting of stockholders.
Item 12. Security Ownership of Certain Beneficial Owners and Management and Related Stockholder Matters
The response to this item is incorporated by reference from the discussion responsive thereto in the sections entitled “Stock Ownership” and “Equity Compensation Plan Information” contained in the proxy statement for our 2019 annual meeting of stockholders.
Item 13. Certain Relationships and Related Transactions, and Director Independence
The response to this item is incorporated by reference from the discussion responsive thereto in the sections entitled “Certain Relationships and Related Person Transactions” and “Corporate Governance at Biogen” contained in the proxy statement for our 2019 annual meeting of stockholders.
Item 14. Principal Accountant Fees and Services
The response to this item is incorporated by reference from the discussion responsive thereto in the section entitled “Proposal 2 - Ratification of the Selection of our Independent Registered Public Accounting Firm” contained in the proxy statement for our 2019 annual meeting of stockholders.

96
PART IV
Item 15. Exhibits and Financial Statement Schedules
a. (1) Consolidated Financial Statements:
The following financial statements are filed as part of this report:
Financial Statements Page Number
Consolidated Statements of Income F-2Consolidated Statements of Comprehensive Income F-3Consolidated Balance Sheets F-4Consolidated Statements of Cash Flows F-5Consolidated Statements of Equity F-6Notes to Consolidated Financial Statements F-9Report of Independent Registered Public Accounting Firm F-83
Certain totals may not sum due to rounding.
(2) Exhibits
The exhibits listed on the Exhibit Index beginning on page 97, which is incorporated herein by reference, are filed or furnished as part of this report or are incorporated into this report by reference.
(3) Financial Statement Schedules
Schedules are omitted because they are not applicable, or are not required, or because the information is included in the consolidated financial statements and notes thereto.
Item 16. Form 10-K SummaryNot applicable.
97
EXHIBIT INDEX
Exhibit No. Description
2.1† Asset Purchase Agreement among Biogen Idec International Holding Ltd., Elan Pharma International Limited and Elan Pharmaceuticals, Inc., dated as of February 5, 2013. Filed as Exhibit 2.1 to our Current Report on Form 8-K/A filed on February 12, 2013.
2.2 Separation Agreement between Biogen Inc. and Bioverativ Inc. dated as of January 31, 2017. Filed as Exhibit 2.1 to our Current Report on Form 8-K filed on February 2, 2017.
3.1
Amended and Restated Certificate of Incorporation, as amended. Filed as Exhibit 3.1 to our Quarterly Report on Form 10-Q for the quarter ended June 30, 2012.
3.2 Certificate of Amendment to the Certificate of Incorporation. Filed as Exhibit 3.1 to our Current Report on Form 8-K filed on March 27, 2015.
3.3
Fourth Amended and Restated Bylaws. Filed as Exhibit 3.1 to our Current Report on Form 8-K filed on June 9, 2017.
4.1
Reference is made to Exhibit 3.1 for a description of the rights, preferences and privileges of our Series A Preferred Stock and Series X Junior Participating Preferred Stock.
4.2 Indenture between Biogen Inc. and U.S. Bank National Association, dated as of September 15, 2015. Filed as Exhibit 4.1 to our Current Report on Form 8-K filed on September 16, 2015.
4.3 First Supplemental Indenture between Biogen Inc. and U.S. Bank National Association, dated September 15, 2015. Filed as Exhibit 4.2 to our Current Report on Form 8-K filed on September 16, 2015.
10.1
Credit Agreement between Biogen Inc., Bank of America, N.A., Goldman Sachs Bank USA and other lenders party thereto, dated August 28, 2015. Filed as Exhibit 10.1 to our Current Report on Form 8-K filed on September 1, 2015.
10.2†
Second Amended and Restated Collaboration Agreement between Biogen Idec Inc. and Genentech, Inc., dated as of October 18, 2010. Filed as Exhibit 10.5 to our Annual Report on Form 10-K for the year ended December 31, 2010.
10.3†
Letter Agreement regarding GA101 financial terms between Biogen Idec Inc. and Genentech, Inc., dated October 18, 2010. Filed as Exhibit 10.6 to our Annual Report on Form 10-K for the year ended December 31, 2010.
10.4 Settlement and License Agreement, dated January 17, 2017, between Biogen Swiss Manufacturing GmbH, Biogen International Holdings ltd., Forward Pharma A/S and other parties thereto. Filed as Exhibit 10.1 to our Current Report on Form 8-K filed on February 1, 2017.
10.5*
Biogen Inc. 2017 Omnibus Equity Plan. Filed as Appendix B to our Definitive Proxy Statement on Schedule 14A filed on April 26, 2017.
10.6*
Form of restricted stock unit award agreement under the Biogen Inc. 2017 Omnibus Equity Plan. Filed as Exhibit 10.2 to our Quarterly Report on Form 10-Q for the quarter ended June 30, 2017.
10.7* Form of market stock unit award agreement under the Biogen Inc. 2017 Omnibus Equity Plan. Filed as Exhibit 10.3 to our Quarterly Report on Form 10-Q for the quarter ended June 30, 2017.
10.8*
Form of performance unit award agreement under the Biogen Inc. 2017 Omnibus Equity Plan. Filed as Exhibit 10.4 to our Quarterly Report on Form 10-Q for the quarter ended June 30, 2017.
10.9*
Form of cash-settled performance unit award agreement under the Biogen Inc. 2017 Omnibus Equity Plan. Filed as Exhibit 10.5 to our Quarterly Report on Form 10-Q for the quarter ended June 30, 2017.
10.10*
Form of performance stock units award agreement (cash-settled) under the Biogen Inc. 2017 Omnibus Equity Plan. Filed as Exhibit 10.10 to our Annual Report on Form 10-K for the year ended December 31, 2017.
10.11* Form of performance stock units award agreement under the Biogen Inc. 2017 Omnibus Equity Plan. Filed as Exhibit 10.11 to our Annual Report on Form 10-K for the year ended December 31, 2017.
10.12* Form of performance stock units award agreement under the Biogen Inc. 2017 Omnibus Equity Plan. Filed as Exhibit 10.1 to our Quarterly Report on Form 10-Q for the quarter ended March 31, 2018.
98
Exhibit No. Description
10.13* Form of performance stock units award agreement (cash settled) under the Biogen Inc. 2017 Omnibus Equity Plan. Filed as Exhibit 10.2 to our Quarterly Report on Form 10-Q for the quarter ended March 31, 2018.
10.14* Form of restricted stock unit award agreement (2018 one-time transition grant) under the Biogen Inc. 2017 Omnibus Equity Plan. Filed as Exhibit 10.3 to our Quarterly Report on Form 10-Q for the quarter ended March 31, 2018.
10.15*
Biogen Idec Inc. 2008 Amended and Restated Omnibus Equity Plan. Filed as Exhibit 10.1 to our Quarterly Report on Form 10-Q for the quarter ended March 31, 2014.
10.16*
Form of performance unit award agreement under the Biogen Idec Inc. 2008 Omnibus Equity Plan. Filed as Exhibit 10.2 to our Quarterly Report on Form 10-Q for the quarter ended March 31, 2014.
10.17*
Form of market stock unit award agreement under the Biogen Idec Inc. 2008 Omnibus Equity Plan. Filed as Exhibit 10.3 to our Quarterly Report on Form 10-Q for the quarter ended March 31, 2014.
10.18*
Form of restricted stock unit award agreement under the Biogen Idec Inc. 2008 Omnibus Equity Plan. Filed as Exhibit 10.1 to our Current Report on Form 8-K filed on August 1, 2008.
10.19*
Form of nonqualified stock option award agreement under the Biogen Idec Inc. 2008 Omnibus Equity Plan. Filed as Exhibit 10.2 to our Current Report on Form 8-K filed on August 1, 2008.
10.20*
Form of cash-settled performance shares award agreement under the Biogen Idec Inc. 2008 Omnibus Equity Plan. Filed as Exhibit 10.1 to our Quarterly Report on Form 10-Q for the quarter ended March 31, 2010.
10.21*
Biogen Inc. 2006 Non-Employee Directors Equity Plan, as amended. Filed as Exhibit 10.1 to our Quarterly Report on Form 10-Q for the quarter ended March 31, 2015.
10.22*
Biogen Inc. 2015 Employee Stock Purchase Plan. Filed as Appendix A to our Definitive Proxy Statement on Schedule 14A filed on April 30, 2015.
10.23*
Biogen Idec Inc. 2008 Performance-Based Management Incentive Plan. Filed as Appendix B to our Definitive Proxy Statement on Schedule 14A filed on May 8, 2008.
10.24*
Biogen Idec Inc. Voluntary Executive Supplemental Savings Plan, as amended and restated effective January 1, 2004. Filed as Exhibit 10.13 to our Annual Report on Form 10-K for the year ended December 31, 2003.
10.25*
Biogen Idec Inc. Supplemental Savings Plan, as amended. Filed as Exhibit 10.23 to our Annual Report on Form 10-K for the year ended December 31, 2015.
10.26*
Biogen Idec Inc. Voluntary Board of Directors Savings Plan, as amended. Filed as Exhibit 10.24 to our Annual Report on Form 10-K for the year ended December 31, 2015.
10.27*
Biogen Idec Inc. Executive Severance Policy - U.S. Executive Vice President, as amended effective January 1, 2014. Filed as Exhibit 10.39 to our Annual Report on Form 10-K for the year ended December 31, 2013.
10.28*
Biogen Idec Inc. Executive Severance Policy - International Executive Vice President, as amended effective January 1, 2014. Filed as Exhibit 10.40 to our Annual Report on Form 10-K for the year ended December 31, 2013.
10.29*
Biogen Idec Inc. Executive Severance Policy - U.S. Senior Vice President, as amended effective October 13, 2008. Filed as Exhibit 10.53 to our Annual Report on Form 10-K for the year ended December 31, 2008.
10.30* Biogen Idec Inc. Executive Severance Policy - International Senior Vice President, as amended effective October 13, 2008. Filed as Exhibit 10.54 to our Annual Report on Form 10-K for the year ended December 31, 2008.
10.31*+ Annual Retainer Summary for Board of Directors.10.32* Form of indemnification agreement for directors and executive officers. Filed as Exhibit
10.1 to our Current Report on Form 8-K filed on June 7, 2011.10.33* Employment Agreement between Biogen Inc. and Michel Vounatsos dated December 18,
2016 and effective as of January 6, 2017. Filed as Exhibit 10.1 to our Current Report on Form 8-K filed on December 19, 2016.
10.34* Letter regarding employment arrangement of Jeffrey Capello dated November 14, 2017. Filed as Exhibit 10.31 to our Annual Report on Form 10-K for the year ended December 31, 2017.
99
Exhibit No. Description
10.35* Letter regarding employment arrangement of Gregory Covino dated February 25, 2012. Filed as Exhibit 10.32 to our Annual Report on Form 10-K for the year ended December 31, 2017.
10.36* Letter regarding employment arrangement of Michael Ehlers dated April 16, 2016. Filed as Exhibit 10.33 to our Annual Report on Form 10-K for the year ended December 31, 2017.
10.37* Letter regarding employment arrangement of Susan Alexander dated December 13, 2005. Filed as Exhibit 10.58 to our Annual Report on Form 10-K for the year ended December 31, 2009.
10.38* Letter regarding employment arrangement for Paul McKenzie dated December 14, 2015. Filed as Exhibit 10.4 to our Quarterly Report on Form 10-Q for the quarter ended March 31, 2018.
10.39* Employment Agreement between Biogen Idec. Inc. and George A. Scangos amended as of August 23, 2013. Filed as Exhibit 10.1 to our Current Report on Form 8-K filed on August 26, 2013.
10.40* Letter regarding employment arrangement of Paul J. Clancy dated August 17, 2007. Filed as Exhibit 10.49 to our Annual Report on Form 10-K for the year ended December 31, 2007.
10.41* Letter regarding employment arrangement of Kenneth DiPietro dated December 12, 2011. Filed as Exhibit 10.49 to our Annual Report on Form 10-K for the year ended December 31, 2012.
21+ Subsidiaries. 23+ Consent of PricewaterhouseCoopers LLP, an Independent Registered Public Accounting Firm.31.1+
Certification of the Chief Executive Officer pursuant to Section 302 of the Sarbanes-Oxley Act of 2002.
31.2+
Certification of the Chief Financial Officer pursuant to Section 302 of the Sarbanes-Oxley Act of 2002.
32.1++
Certification of the Chief Executive Officer and the Chief Financial Officer pursuant to Section 906 of the Sarbanes-Oxley Act of 2002.
101++
The following materials from Biogen Inc.’s Annual Report on Form 10-K for the year ended December 31, 2018, formatted in XBRL (Extensible Business Reporting Language): (i) the Consolidated Statements of Income, (ii) the Consolidated Statements of Comprehensive Income, (iii) the Consolidated Balance Sheets, (iv) the Consolidated Statements of Cash Flows, (v) the Consolidated Statements of Equity and (vi) Notes to Consolidated Financial Statements.
^ References to “our” filings mean filings made by Biogen Inc. and filings made by IDEC Pharmaceuticals Corporation prior to the merger with Biogen, Inc. Unless otherwise indicated exhibits were previously filed with the SEC under Commission File Number 0-19311 and are incorporated herein by reference.
* Management contract or compensatory plan or arrangement.
† Confidential treatment has been granted or requested with respect to portions of this exhibit.
+ Filed herewith.
+ + Furnished herewith.
100
SIGNATURESPursuant to the requirements of Section 13 or 15(d) of the Securities Exchange Act of 1934, the registrant has
duly caused this report to be signed on its behalf by the undersigned, thereunto duly authorized.
BIOGEN INC.
By: /S/ MICHEL VOUNATSOS
Michel VounatsosChief Executive Officer
Date: February 6, 2019
101
Pursuant to the requirements of the Securities Exchange Act of 1934, this report has been signed below by the following persons on behalf of the registrant and in the capacities and on the dates indicated.
Name Capacity Date
/S/ MICHEL VOUNATSOS Director and Chief Executive Officer(principal executive officer)
February 6, 2019Michel Vounatsos
/S/ JEFFREY D. CAPELLO Executive Vice President and ChiefFinancial Officer (principal financial
officer) February 6, 2019
Jeffrey D. Capello
/S/ ROBIN C. KRAMER Vice President, Chief AccountingOfficer (principal accounting officer) February 6, 2019
Robin C. Kramer
/S/ STELIOS PAPADOPOULOS Director and Chairman of the Board ofDirectors
February 6, 2019Stelios Papadopoulos
/S/ ALEXANDER J. DENNER Director February 6, 2019 Alexander J. Denner
/S/ CAROLINE D. DORSA Director February 6, 2019Caroline D. Dorsa
/S/ NANCY L. LEAMING Director February 6, 2019Nancy L. Leaming
/S/ RICHARD C. MULLIGAN Director February 6, 2019Richard C. Mulligan
/S/ ROBERT W. PANGIA Director February 6, 2019Robert W. Pangia
/S/ BRIAN S. POSNER Director February 6, 2019Brian S. Posner
/S/ ERIC K. ROWINSKYDirector February 6, 2019
Eric K. Rowinsky
/S/ LYNN SCHENK Director February 6, 2019Lynn Schenk
/S/ STEPHEN A. SHERWIN Director February 6, 2019Stephen A. Sherwin

F- 1
BIOGEN INC. AND SUBSIDIARIESCONSOLIDATED FINANCIAL STATEMENTS
Page Number
Consolidated Statements of Income F-2Consolidated Statements of Comprehensive Income F-3Consolidated Balance Sheets F-4Consolidated Statements of Cash Flows F-5Consolidated Statements of Equity F-6Notes to Consolidated Financial Statements F-9Report of Independent Registered Public Accounting Firm F-83
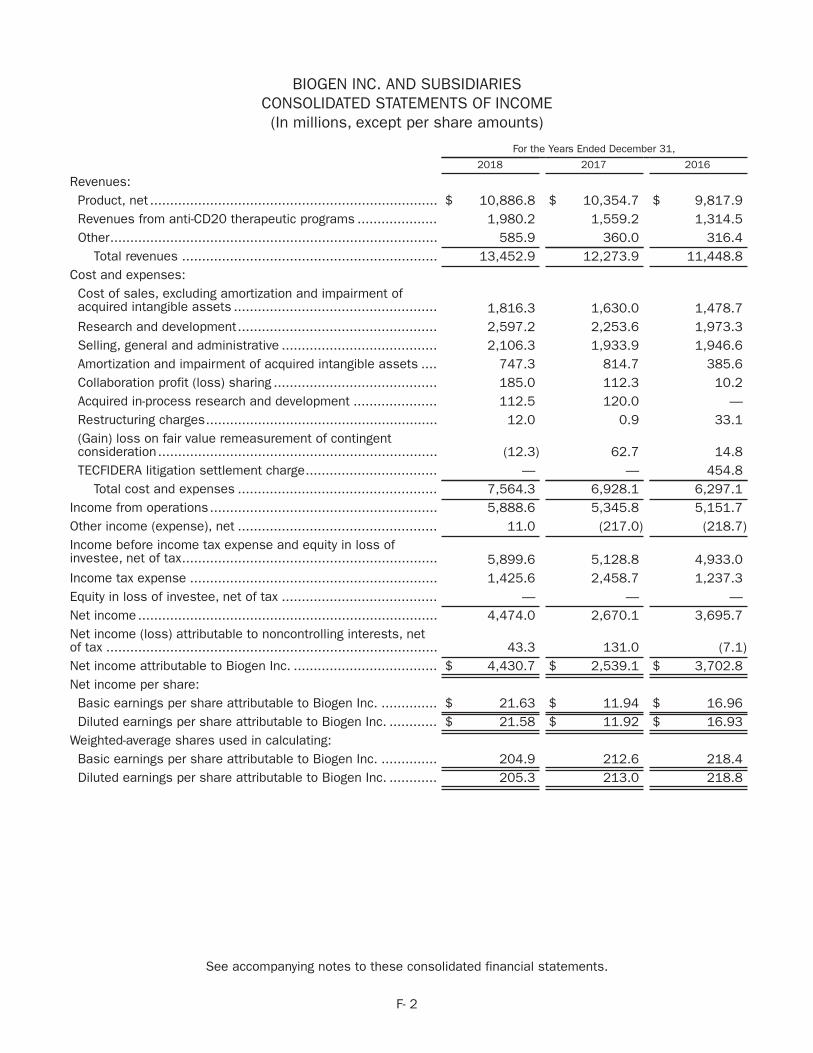
F- 2
BIOGEN INC. AND SUBSIDIARIESCONSOLIDATED STATEMENTS OF INCOME(In millions, except per share amounts)
For the Years Ended December 31,
2018 2017 2016
Revenues:Product, net ........................................................................ $ 10,886.8 $ 10,354.7 $ 9,817.9Revenues from anti-CD20 therapeutic programs .................... 1,980.2 1,559.2 1,314.5Other.................................................................................. 585.9 360.0 316.4
Total revenues ................................................................ 13,452.9 12,273.9 11,448.8Cost and expenses:Cost of sales, excluding amortization and impairment ofacquired intangible assets ................................................... 1,816.3 1,630.0 1,478.7Research and development.................................................. 2,597.2 2,253.6 1,973.3Selling, general and administrative ....................................... 2,106.3 1,933.9 1,946.6Amortization and impairment of acquired intangible assets .... 747.3 814.7 385.6Collaboration profit (loss) sharing ......................................... 185.0 112.3 10.2Acquired in-process research and development ..................... 112.5 120.0 —Restructuring charges.......................................................... 12.0 0.9 33.1(Gain) loss on fair value remeasurement of contingentconsideration...................................................................... (12.3) 62.7 14.8TECFIDERA litigation settlement charge................................. — — 454.8
Total cost and expenses .................................................. 7,564.3 6,928.1 6,297.1Income from operations......................................................... 5,888.6 5,345.8 5,151.7Other income (expense), net .................................................. 11.0 (217.0) (218.7)Income before income tax expense and equity in loss ofinvestee, net of tax................................................................ 5,899.6 5,128.8 4,933.0Income tax expense .............................................................. 1,425.6 2,458.7 1,237.3Equity in loss of investee, net of tax ....................................... — — —Net income........................................................................... 4,474.0 2,670.1 3,695.7Net income (loss) attributable to noncontrolling interests, netof tax ................................................................................... 43.3 131.0 (7.1)Net income attributable to Biogen Inc. .................................... $ 4,430.7 $ 2,539.1 $ 3,702.8Net income per share:Basic earnings per share attributable to Biogen Inc. .............. $ 21.63 $ 11.94 $ 16.96Diluted earnings per share attributable to Biogen Inc. ............ $ 21.58 $ 11.92 $ 16.93
Weighted-average shares used in calculating:Basic earnings per share attributable to Biogen Inc. .............. 204.9 212.6 218.4Diluted earnings per share attributable to Biogen Inc. ............ 205.3 213.0 218.8
See accompanying notes to these consolidated financial statements.
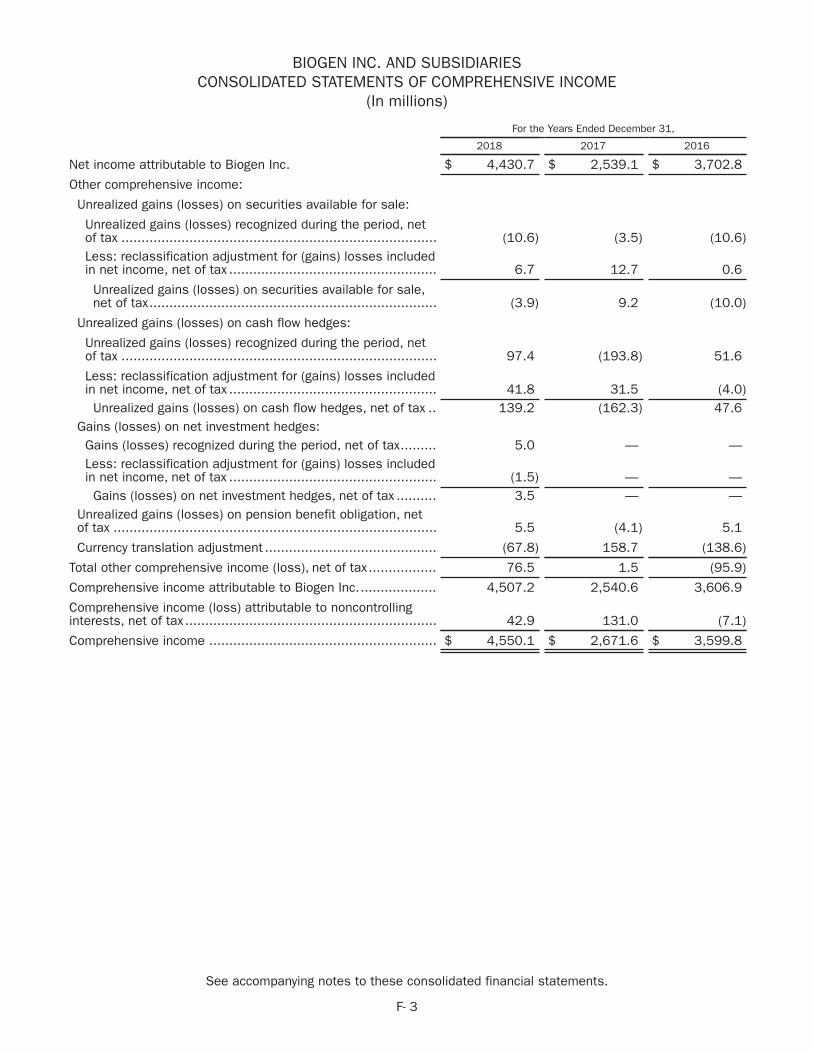
F- 3
BIOGEN INC. AND SUBSIDIARIESCONSOLIDATED STATEMENTS OF COMPREHENSIVE INCOME
(In millions)
For the Years Ended December 31,
2018 2017 2016
Net income attributable to Biogen Inc. $ 4,430.7 $ 2,539.1 $ 3,702.8
Other comprehensive income:
Unrealized gains (losses) on securities available for sale:
Unrealized gains (losses) recognized during the period, netof tax ............................................................................... (10.6) (3.5) (10.6)Less: reclassification adjustment for (gains) losses includedin net income, net of tax .................................................... 6.7 12.7 0.6
Unrealized gains (losses) on securities available for sale,net of tax........................................................................ (3.9) 9.2 (10.0)
Unrealized gains (losses) on cash flow hedges:
Unrealized gains (losses) recognized during the period, netof tax ............................................................................... 97.4 (193.8) 51.6
Less: reclassification adjustment for (gains) losses includedin net income, net of tax .................................................... 41.8 31.5 (4.0)
Unrealized gains (losses) on cash flow hedges, net of tax .. 139.2 (162.3) 47.6Gains (losses) on net investment hedges:Gains (losses) recognized during the period, net of tax......... 5.0 — —Less: reclassification adjustment for (gains) losses includedin net income, net of tax .................................................... (1.5) — —Gains (losses) on net investment hedges, net of tax .......... 3.5 — —
Unrealized gains (losses) on pension benefit obligation, netof tax ................................................................................. 5.5 (4.1) 5.1
Currency translation adjustment ........................................... (67.8) 158.7 (138.6)
Total other comprehensive income (loss), net of tax................. 76.5 1.5 (95.9)
Comprehensive income attributable to Biogen Inc.................... 4,507.2 2,540.6 3,606.9
Comprehensive income (loss) attributable to noncontrollinginterests, net of tax ............................................................... 42.9 131.0 (7.1)
Comprehensive income ......................................................... $ 4,550.1 $ 2,671.6 $ 3,599.8
See accompanying notes to these consolidated financial statements.
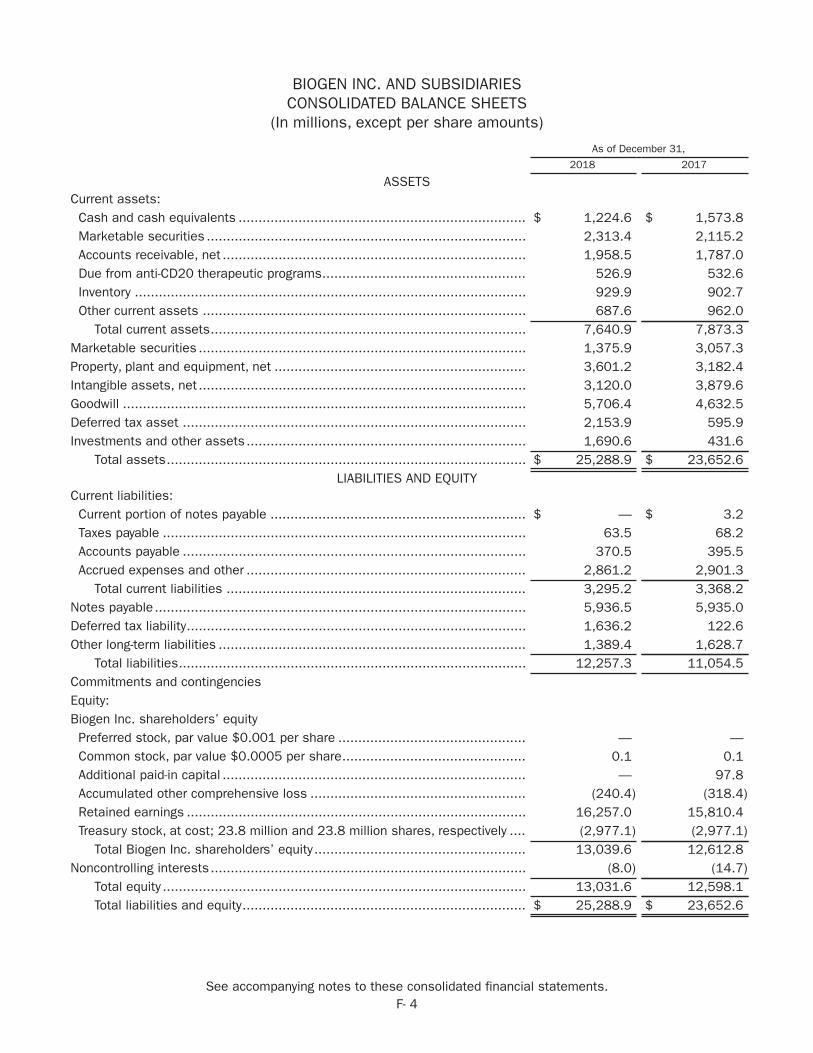
F- 4
BIOGEN INC. AND SUBSIDIARIESCONSOLIDATED BALANCE SHEETS
(In millions, except per share amounts)
As of December 31,
2018 2017
ASSETSCurrent assets:Cash and cash equivalents ........................................................................ $ 1,224.6 $ 1,573.8Marketable securities ................................................................................ 2,313.4 2,115.2Accounts receivable, net ............................................................................ 1,958.5 1,787.0Due from anti-CD20 therapeutic programs................................................... 526.9 532.6Inventory .................................................................................................. 929.9 902.7Other current assets ................................................................................. 687.6 962.0
Total current assets............................................................................... 7,640.9 7,873.3Marketable securities .................................................................................. 1,375.9 3,057.3Property, plant and equipment, net ............................................................... 3,601.2 3,182.4Intangible assets, net .................................................................................. 3,120.0 3,879.6Goodwill ..................................................................................................... 5,706.4 4,632.5Deferred tax asset ...................................................................................... 2,153.9 595.9Investments and other assets ...................................................................... 1,690.6 431.6
Total assets.......................................................................................... $ 25,288.9 $ 23,652.6LIABILITIES AND EQUITY
Current liabilities:Current portion of notes payable ................................................................ $ — $ 3.2Taxes payable ........................................................................................... 63.5 68.2Accounts payable ...................................................................................... 370.5 395.5Accrued expenses and other ...................................................................... 2,861.2 2,901.3
Total current liabilities ........................................................................... 3,295.2 3,368.2Notes payable............................................................................................. 5,936.5 5,935.0Deferred tax liability..................................................................................... 1,636.2 122.6Other long-term liabilities ............................................................................. 1,389.4 1,628.7
Total liabilities....................................................................................... 12,257.3 11,054.5Commitments and contingenciesEquity:Biogen Inc. shareholders’ equityPreferred stock, par value $0.001 per share ............................................... — —Common stock, par value $0.0005 per share.............................................. 0.1 0.1Additional paid-in capital ............................................................................ — 97.8Accumulated other comprehensive loss ...................................................... (240.4) (318.4)Retained earnings ..................................................................................... 16,257.0 15,810.4Treasury stock, at cost; 23.8 million and 23.8 million shares, respectively .... (2,977.1) (2,977.1)
Total Biogen Inc. shareholders’ equity ..................................................... 13,039.6 12,612.8Noncontrolling interests ............................................................................... (8.0) (14.7)
Total equity ........................................................................................... 13,031.6 12,598.1Total liabilities and equity....................................................................... $ 25,288.9 $ 23,652.6
See accompanying notes to these consolidated financial statements.
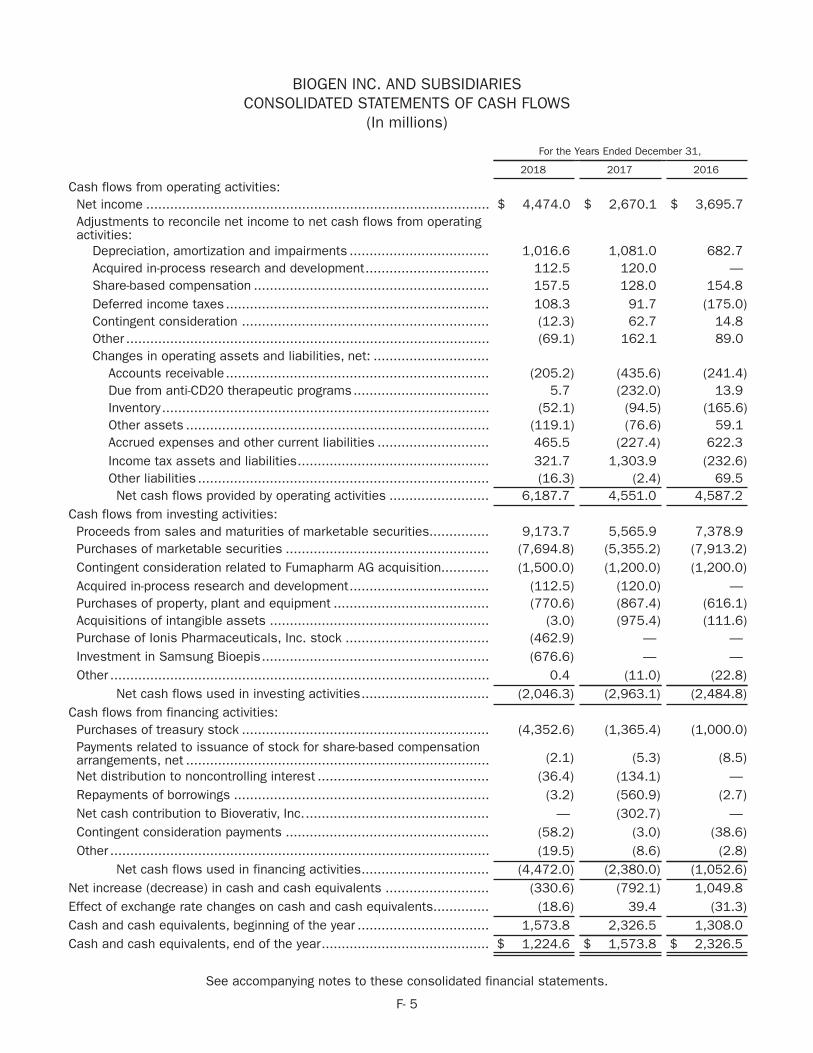
F- 5
BIOGEN INC. AND SUBSIDIARIESCONSOLIDATED STATEMENTS OF CASH FLOWS
(In millions)
For the Years Ended December 31,
2018 2017 2016
Cash flows from operating activities:Net income ...................................................................................... $ 4,474.0 $ 2,670.1 $ 3,695.7Adjustments to reconcile net income to net cash flows from operatingactivities:
Depreciation, amortization and impairments ................................... 1,016.6 1,081.0 682.7Acquired in-process research and development............................... 112.5 120.0 —Share-based compensation ........................................................... 157.5 128.0 154.8Deferred income taxes .................................................................. 108.3 91.7 (175.0)Contingent consideration .............................................................. (12.3) 62.7 14.8Other ........................................................................................... (69.1) 162.1 89.0Changes in operating assets and liabilities, net: .............................
Accounts receivable.................................................................. (205.2) (435.6) (241.4)Due from anti-CD20 therapeutic programs.................................. 5.7 (232.0) 13.9Inventory.................................................................................. (52.1) (94.5) (165.6)Other assets ............................................................................ (119.1) (76.6) 59.1Accrued expenses and other current liabilities ............................ 465.5 (227.4) 622.3Income tax assets and liabilities................................................ 321.7 1,303.9 (232.6)Other liabilities ......................................................................... (16.3) (2.4) 69.5Net cash flows provided by operating activities ......................... 6,187.7 4,551.0 4,587.2
Cash flows from investing activities:Proceeds from sales and maturities of marketable securities............... 9,173.7 5,565.9 7,378.9Purchases of marketable securities ................................................... (7,694.8) (5,355.2) (7,913.2)Contingent consideration related to Fumapharm AG acquisition............ (1,500.0) (1,200.0) (1,200.0)Acquired in-process research and development................................... (112.5) (120.0) —Purchases of property, plant and equipment ....................................... (770.6) (867.4) (616.1)Acquisitions of intangible assets ....................................................... (3.0) (975.4) (111.6)Purchase of Ionis Pharmaceuticals, Inc. stock .................................... (462.9) — —Investment in Samsung Bioepis......................................................... (676.6) — —Other ............................................................................................... 0.4 (11.0) (22.8)
Net cash flows used in investing activities................................ (2,046.3) (2,963.1) (2,484.8)Cash flows from financing activities:Purchases of treasury stock .............................................................. (4,352.6) (1,365.4) (1,000.0)Payments related to issuance of stock for share-based compensationarrangements, net ............................................................................ (2.1) (5.3) (8.5)Net distribution to noncontrolling interest ........................................... (36.4) (134.1) —Repayments of borrowings ................................................................ (3.2) (560.9) (2.7)Net cash contribution to Bioverativ, Inc............................................... — (302.7) —Contingent consideration payments ................................................... (58.2) (3.0) (38.6)Other ............................................................................................... (19.5) (8.6) (2.8)
Net cash flows used in financing activities................................ (4,472.0) (2,380.0) (1,052.6)Net increase (decrease) in cash and cash equivalents .......................... (330.6) (792.1) 1,049.8Effect of exchange rate changes on cash and cash equivalents.............. (18.6) 39.4 (31.3)Cash and cash equivalents, beginning of the year ................................. 1,573.8 2,326.5 1,308.0Cash and cash equivalents, end of the year.......................................... $ 1,224.6 $ 1,573.8 $ 2,326.5
See accompanying notes to these consolidated financial statements.
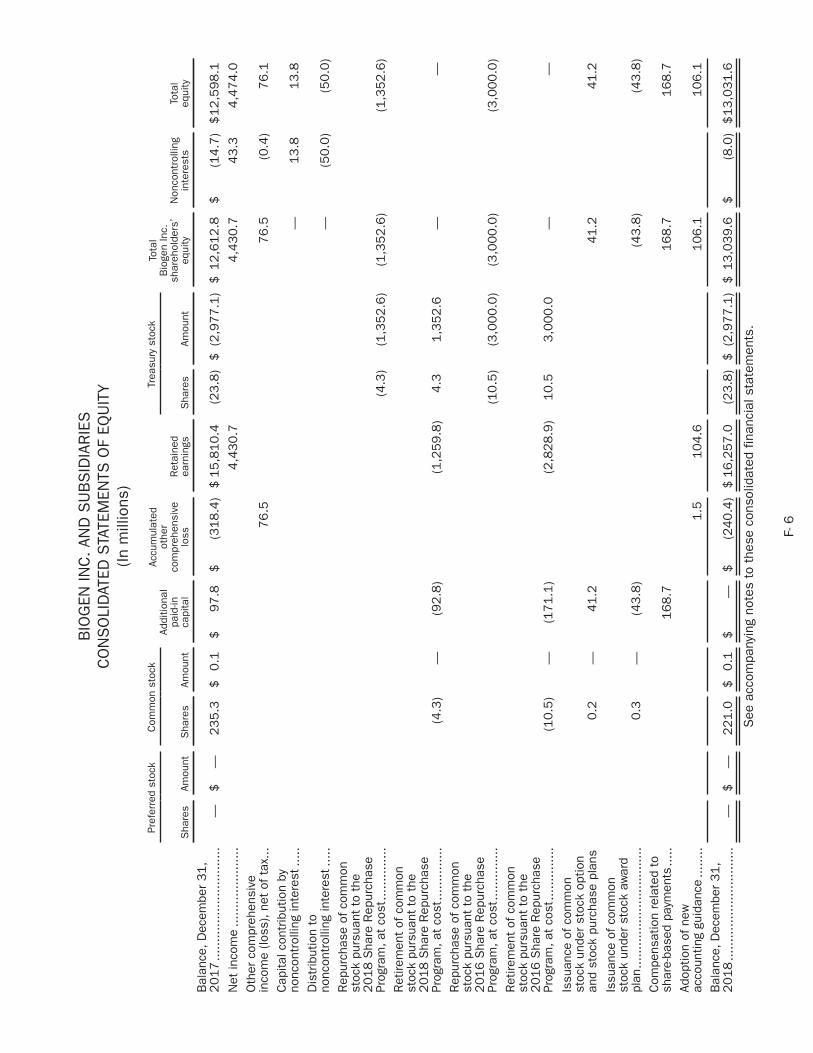
F- 6
BIO
GEN
INC
. AN
D S
UB
SID
IAR
IES
CO
NS
OLI
DAT
ED S
TATE
MEN
TS O
F EQ
UIT
Y(In
mill
ions
)
Pr
efer
red
stoc
kC
omm
on s
tock
Addi
tiona
lpa
id-in
capi
tal
Accu
mul
ated
othe
rco
mpr
ehen
sive
loss
Ret
aine
dea
rnin
gs
Trea
sury
sto
ckTo
tal
Bio
gen
Inc.
shar
ehol
ders
’eq
uity
Non
cont
rolli
ngin
tere
sts
Tota
leq
uity
S
hare
sAm
ount
Sha
res
Amou
ntS
hare
sAm
ount
Bal
ance
, Dec
embe
r 31,
2017
....
....
....
....
....
....
....
..—
$—
235
.3$
0.1
$9
7.8
$(3
18
.4)
$1
5,8
10
.4(2
3.8
)$
(2,9
77
.1)
$1
2,6
12
.8$
(14
.7)
$1
2,5
98
.1
Net
inco
me
....
....
....
....
....
.4
,43
0.7
4,4
30
.74
3.3
4,4
74
.0O
ther
com
preh
ensi
vein
com
e (lo
ss),
net
of t
ax..
.7
6.5
76
.5(0
.4)
76
.1C
apita
l con
trib
utio
n by
nonc
ontr
ollin
g in
tere
st..
...
—1
3.8
13
.8D
istr
ibut
ion
tono
ncon
trol
ling
inte
rest
....
.—
(50
.0)
(50
.0)
Rep
urch
ase
of c
omm
onst
ock
purs
uant
to
the
20
18
Sha
re R
epur
chas
ePr
ogra
m, a
t co
st..
....
....
....
(4.3
)(1
,35
2.6
)(1
,35
2.6
)(1
,35
2.6
)R
etire
men
t of
com
mon
stoc
k pu
rsua
nt t
o th
e2
01
8 S
hare
Rep
urch
ase
Prog
ram
, at
cost
....
....
....
..(4
.3)
—(9
2.8
)(1
,25
9.8
)4
.31
,35
2.6
——
Rep
urch
ase
of c
omm
onst
ock
purs
uant
to
the
20
16
Sha
re R
epur
chas
ePr
ogra
m, a
t co
st..
....
....
....
(10
.5)
(3,0
00
.0)
(3,0
00
.0)
(3,0
00
.0)
Ret
irem
ent
of c
omm
onst
ock
purs
uant
to
the
20
16
Sha
re R
epur
chas
ePr
ogra
m, a
t co
st..
....
....
....
(10.5
)—
(17
1.1
)(2
,82
8.9
)1
0.5
3,0
00
.0—
—
Issu
ance
of
com
mon
stoc
k un
der
stoc
k op
tion
and
stoc
k pu
rcha
se p
lans
0.2
—4
1.2
41
.24
1.2
Issu
ance
of
com
mon
stoc
k un
der
stoc
k aw
ard
plan
....
....
....
....
....
....
....
....
0.3
—(4
3.8
)(4
3.8
)(4
3.8
)C
ompe
nsat
ion
rela
ted
tosh
are-
base
d pa
ymen
ts..
...
16
8.7
16
8.7
16
8.7
Adop
tion
of n
ewac
coun
ting
guid
ance
....
....
1.5
10
4.6
10
6.1
10
6.1
Bal
ance
, Dec
embe
r 31,
2018
....
....
....
....
....
....
....
..—
$—
221.0
$0
.1$
—$
(24
0.4
)$
16
,25
7.0
(23
.8)
$(2
,97
7.1
)$
13
,03
9.6
$(8
.0)
$1
3,0
31
.6
See
acc
ompa
nyin
g no
tes
to t
hese
con
solid
ated
fin
anci
al s
tate
men
ts.
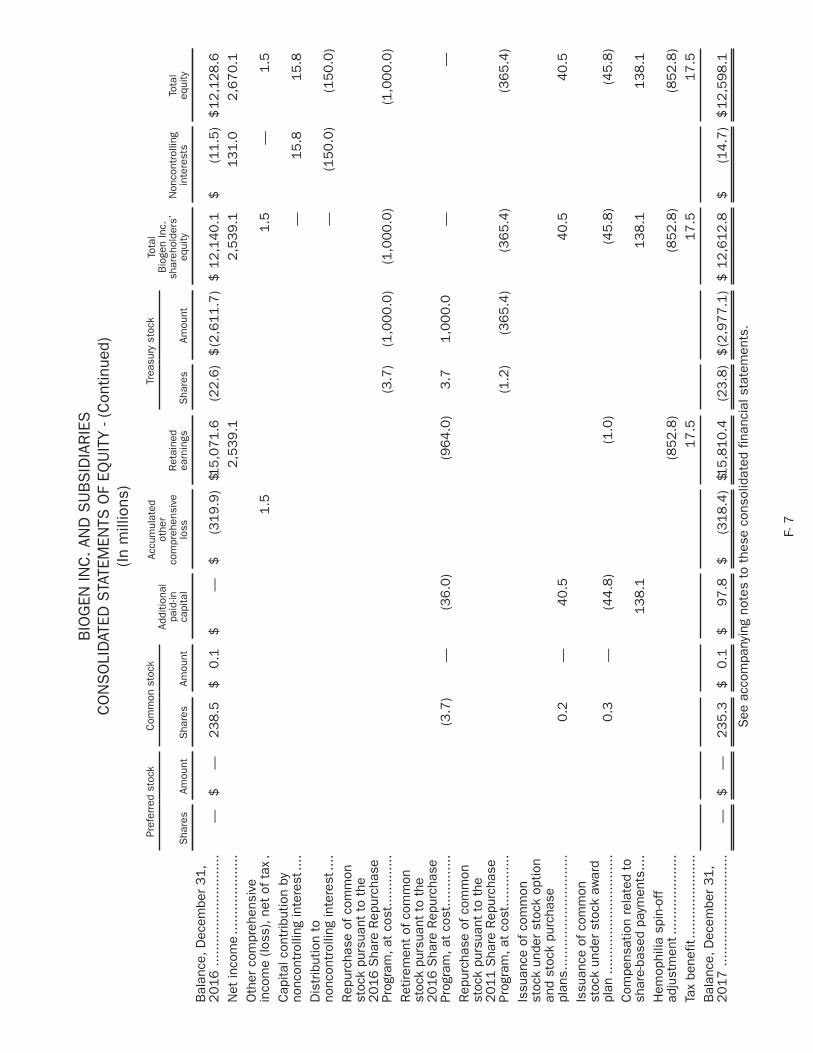
F- 7
BIO
GEN
INC
. AN
D S
UB
SID
IAR
IES
CO
NS
OLI
DAT
ED S
TATE
MEN
TS O
F EQ
UIT
Y - (
Con
tinue
d)(In
mill
ions
)
Pr
efer
red
stoc
kC
omm
on s
tock
Addi
tiona
lpa
id-in
capi
tal
Accu
mul
ated
othe
rco
mpr
ehen
sive
loss
Ret
aine
dea
rnin
gs
Trea
sury
sto
ckTo
tal
Bio
gen
Inc.
shar
ehol
ders
’eq
uity
Non
cont
rolli
ngin
tere
sts
Tota
leq
uity
Sha
res
Amou
ntS
hare
sAm
ount
Sha
res
Amou
nt
Bal
ance
, Dec
embe
r 3
1,
2016
....
....
....
....
....
....
....
—$
—238.5
$0.1
$—
$(3
19.9
)$1
5,0
71.6
(22.6
)$
(2,6
11.7
)$
12,1
40.1
$(1
1.5
)$
12,1
28.6
Net
inco
me
....
....
....
....
....
2,5
39.1
2,5
39.1
131.0
2,6
70.1
Oth
er c
ompr
ehen
sive
inco
me
(loss
), ne
t of
tax
.1
.51.5
—1.5
Cap
ital c
ontr
ibut
ion
byno
ncon
trol
ling
inte
rest
....
—15.8
15.8
Dis
trib
utio
n to
nonc
ontr
ollin
g in
tere
st..
..—
(150.0
)(1
50.0
)R
epur
chas
e of
com
mon
stoc
k pu
rsua
nt t
o th
e2016 S
hare
Rep
urch
ase
Prog
ram
, at
cost
....
....
....
.(3
.7)
(1,0
00.0
)(1
,000.0
)(1
,000.0
)R
etire
men
t of
com
mon
stoc
k pu
rsua
nt t
o th
e2016 S
hare
Rep
urch
ase
Prog
ram
, at
cost
....
....
....
.(3
.7)
—(3
6.0
)(9
64.0
)3.7
1,0
00.0
——
Rep
urch
ase
of c
omm
onst
ock
purs
uant
to
the
2011 S
hare
Rep
urch
ase
Prog
ram
, at
cost
....
....
....
.(1
.2)
(365.4
)(3
65.4
)(3
65.4
)Is
suan
ce o
f co
mm
onst
ock
unde
r st
ock
optio
nan
d st
ock
purc
hase
plan
s...
....
....
....
....
....
....
..0.2
—40.5
40.5
40.5
Issu
ance
of
com
mon
stoc
k un
der
stoc
k aw
ard
plan
....
....
....
....
....
....
....
..0.3
—(4
4.8
)(1
.0)
(45.8
)(4
5.8
)C
ompe
nsat
ion
rela
ted
tosh
are-
base
d pa
ymen
ts..
..138.1
138.1
138.1
Hem
ophi
lia s
pin-
off
adju
stm
ent.
....
....
....
....
...
(852.8
)(8
52.8
)(8
52.8
)Ta
x be
nefit
....
....
....
....
....
.17.5
17.5
17.5
Bal
ance
, Dec
embe
r 31,
2017
....
....
....
....
....
....
....
—$
—235.3
$0.1
$97.8
$(3
18.4
)$1
5,8
10.4
(23.8
)$
(2,9
77.1
)$
12,6
12.8
$(1
4.7
)$
12,5
98.1
See
acc
ompa
nyin
g no
tes
to t
hese
con
solid
ated
fin
anci
al s
tate
men
ts.
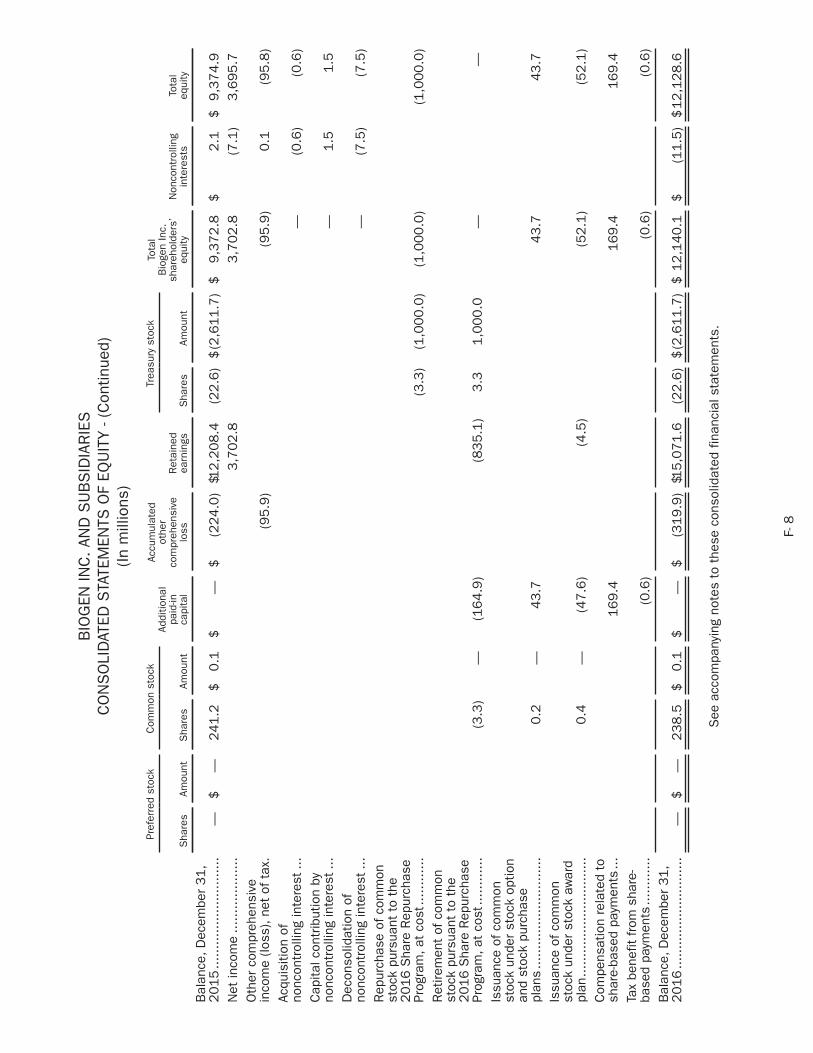
F- 8
BIO
GEN
INC
. AN
D S
UB
SID
IAR
IES
CO
NS
OLI
DAT
ED S
TATE
MEN
TS O
F EQ
UIT
Y - (
Con
tinue
d)(In
mill
ions
)
Pref
erre
d st
ock
Com
mon
sto
ckAd
ditio
nal
paid
-inca
pita
l
Accu
mul
ated
othe
rco
mpr
ehen
sive
loss
Ret
aine
dea
rnin
gs
Trea
sury
sto
ckTo
tal
Bio
gen
Inc.
shar
ehol
ders
’eq
uity
Non
cont
rolli
ngin
tere
sts
Tota
leq
uity
Sha
res
Amou
ntS
hare
sAm
ount
Sha
res
Amou
nt
Bal
ance
, Dec
embe
r 3
1,
2015
....
....
....
....
....
....
....
—$
—241.2
$0.1
$—
$(2
24.0
)$1
2,2
08.4
(22.6
)$
(2,6
11.7
)$
9,3
72.8
$2.1
$9,3
74.9
Net
inco
me
....
....
....
....
...
3,7
02.8
3,7
02.8
(7.1
)3,6
95.7
Oth
er c
ompr
ehen
sive
inco
me
(loss
), ne
t of
tax
.(9
5.9
)(9
5.9
)0.1
(95.8
)Ac
quis
ition
of
nonc
ontr
ollin
g in
tere
st..
.—
(0.6
)(0
.6)
Cap
ital c
ontr
ibut
ion
byno
ncon
trol
ling
inte
rest
...
—1.5
1.5
Dec
onso
lidat
ion
ofno
ncon
trol
ling
inte
rest
...
—(7
.5)
(7.5
)R
epur
chas
e of
com
mon
stoc
k pu
rsua
nt t
o th
e2016 S
hare
Rep
urch
ase
Prog
ram
, at
cost
....
....
....
(3.3
)(1
,000.0
)(1
,000.0
)(1
,000.0
)R
etire
men
t of
com
mon
stoc
k pu
rsua
nt t
o th
e2016 S
hare
Rep
urch
ase
Prog
ram
, at
cost
....
....
....
(3.3
)—
(164.9
)(8
35.1
)3.3
1,0
00.0
——
Issu
ance
of
com
mon
stoc
k un
der
stoc
k op
tion
and
stoc
k pu
rcha
sepl
ans
....
....
....
....
....
....
....
0.2
—43.7
43.7
43.7
Issu
ance
of
com
mon
stoc
k un
der
stoc
k aw
ard
plan
....
....
....
....
....
....
....
..0.4
—(4
7.6
)(4
.5)
(52.1
)(5
2.1
)C
ompe
nsat
ion
rela
ted
tosh
are-
base
d pa
ymen
ts..
.169.4
169.4
169.4
Tax
bene
fit f
rom
sha
re-
base
d pa
ymen
ts..
....
....
..(0
.6)
(0.6
)(0
.6)
Bal
ance
, Dec
embe
r 31,
2016
....
....
....
....
....
....
....
—$
—238.5
$0.1
$—
$(3
19.9
)$1
5,0
71.6
(22.6
)$
(2,6
11.7
)$
12,1
40.1
$(1
1.5
)$
12,1
28.6
See
acc
ompa
nyin
g no
tes
to t
hese
con
solid
ated
fin
anci
al s
tate
men
ts.
BIOGEN INC. AND SUBSIDIARIESNOTES TO CONSOLIDATED FINANCIAL STATEMENTS
F- 9
1. Summary of Significant Accounting Policies
References in these notes to "Biogen," the "company," "we," "us" and "our" refer to Biogen Inc. and its consolidated subsidiaries.
Business Overview
Biogen is a global biopharmaceutical company focused on discovering, developing and delivering worldwide innovative therapies for people living with serious neurological and neurodegenerative diseases, including in our core growth areas of multiple sclerosis (MS) and neuroimmunology, Alzheimer’s disease (AD) and dementia, movement disorders, including Parkinson's disease, and neuromuscular disorders, including spinal muscular atrophy (SMA) and amyotrophic lateral sclerosis (ALS). We are also focused on discovering, developing and delivering worldwide innovative therapies in our emerging growth areas of acute neurology, neurocognitive disorders, pain and ophthalmology. In addition, we are employing innovative technologies to discover potential treatments for rare and genetic disorders, including new ways of treating diseases through gene therapy in our core and emerging growth areas. We also manufacture and commercialize biosimilars of advanced biologics.
Our marketed products include TECFIDERA, AVONEX, PLEGRIDY, TYSABRI and FAMPYRA for the treatment of MS, SPINRAZA for the treatment of SMA and FUMADERM for the treatment of severe plaque psoriasis. We also have certain business and financial rights with respect to RITUXAN for the treatment of non-Hodgkin's lymphoma, chronic lymphocytic leukemia (CLL) and other conditions, RITUXAN HYCELA for the treatment of non-Hodgkin's lymphoma and CLL, GAZYVA for the treatment of CLL and follicular lymphoma, OCREVUS for the treatment of primary progressive MS (PPMS) and relapsing MS (RMS) and other potential anti-CD20 therapies pursuant to our collaboration arrangements with Genentech, Inc. (Genentech), a wholly-owned member of the Roche Group. For additional information on our collaboration arrangements with Genentech, please read Note 19, Collaborative and Other Relationships, to these consolidated financial statements.
We support our drug discovery and development efforts through the commitment of significant resources to discovery, research and development programs and business development opportunities. For over two decades we have led in the research and development of new therapies to treat MS, resulting in our leading portfolio of MS treatments. Now our research is focused on additional improvements in the treatment of MS, such as the development of next generation therapies for MS, with a goal to reverse or possibly repair damage caused by the disease. We are also applying our scientific expertise to solve some of the most challenging and complex diseases, including AD, progressive supranuclear palsy (PSP), Parkinson's disease, ALS, stroke, epilepsy, cognitive impairment associated with schizophrenia (CIAS) and pain.
Our innovative drug development and commercialization activities are complemented by our biosimilar products that expand access to medicines and reduce the cost burden for healthcare systems. We are leveraging our manufacturing capabilities and know-how to develop, manufacture and market biosimilar products through Samsung Bioepis Co., Ltd. (Samsung Bioepis), our joint venture with Samsung BioLogics Co., Ltd. (Samsung BioLogics). Under our commercial agreement, we market and sell BENEPALI, an etanercept biosimilar referencing ENBREL, FLIXABI, an infliximab biosimilar referencing REMICADE, and IMRALDI, an adalimumab biosimilar referencing HUMIRA, in the European Union (E.U.). For additional information on our collaboration arrangement with Samsung Bioepis, please read Note 19, Collaborative and Other Relationships, to these consolidated financial statements.
Hemophilia Spin-Off
On February 1, 2017, we completed the spin-off of our hemophilia business, Bioverativ Inc. (Bioverativ), as an independent, publicly traded company. Our consolidated results of operations and financial position included in these audited consolidated financial statements reflect the financial results of our hemophilia business for all periods through January 31, 2017.
For additional information on the spin-off of our hemophilia business, please read Note 3, Hemophilia Spin-Off, to these consolidated financial statements.

BIOGEN INC. AND SUBSIDIARIESNOTES TO CONSOLIDATED FINANCIAL STATEMENTS — (Continued)
F- 10
Consolidation
Our consolidated financial statements reflect our financial statements, those of our wholly-owned subsidiaries and those of certain variable interest entities where we are the primary beneficiary. For consolidated entities where we own or are exposed to less than 100% of the economics, we record net income (loss) attributable to noncontrolling interests in our consolidated statements of income equal to the percentage of the economic or ownership interest retained in such entities by the respective noncontrolling parties. Intercompany balances and transactions are eliminated in consolidation.
In determining whether we are the primary beneficiary of an entity, we apply a qualitative approach that determines whether we have both (1) the power to direct the economically significant activities of the entity and (2) the obligation to absorb losses of, or the right to receive benefits from, the entity that could potentially be significant to that entity. These considerations impact the way we account for our existing collaborative relationships and other arrangements. We continuously assess whether we are the primary beneficiary of a variable interest entity as changes to existing relationships or future transactions may result in us consolidating or deconsolidating one or more of our collaborators or partners.
Use of Estimates
The preparation of our consolidated financial statements requires us to make estimates, judgments and assumptions that may affect the reported amounts of assets, liabilities, equity, revenues and expenses and related disclosure of contingent assets and liabilities. On an ongoing basis we evaluate our estimates, judgments and methodologies. We base our estimates on historical experience and on various other assumptions that we believe are reasonable, the results of which form the basis for making judgments about the carrying values of assets, liabilities and equity and the amount of revenues and expenses. Actual results may differ from these estimates.
Revenue Recognition
In May 2014 the Financial Accounting Standards Board (FASB) issued Accounting Standards Update (ASU) No. 2014-09, Revenue from Contracts with Customers (Topic 606), which supersedes all existing revenue recognition requirements, including most industry specific guidance. This standard requires a company to recognize revenues when it transfers goods or services to customers in an amount that reflects the consideration that the company expects to receive for those goods or services.
The FASB subsequently issued the following amendments to ASU 2014-09 that have the same effective date and transition date: ASU No. 2016-08, Revenue from Contracts with Customers (Topic 606): Principal versus Agent Considerations; ASU No. 2016-10, Revenue from Contracts with Customers (Topic 606): Identifying Performance Obligations and Licensing; ASU No. 2016-12, Revenue from Contracts with Customers (Topic 606): Narrow-Scope Improvements and Practical Expedients; and ASU No. 2016-20, Technical Corrections and Improvements to Topic 606, Revenue from Contracts with Customers. We adopted these amendments with ASU 2014-09 (collectively, the new revenue standards).
The new revenue standards became effective for us on January 1, 2018, and were adopted using the modified retrospective method. The adoption of the new revenue standards as of January 1, 2018, did not change our revenue recognition as the majority of our revenues continue to be recognized when the customer takes control of our product. As we did not identify any accounting changes that impacted the amount of reported revenues with respect to our product revenues, revenues from anti-CD20 therapeutic programs or other revenues, no adjustment to retained earnings was required upon adoption. However, the adoption of the new revenue standards will result in a change in the timing of revenue recognition related to certain of our contract manufacturing activities based upon the terms of the underlying agreements.
Under the new revenue standards, we recognize revenues when our customer obtains control of promised goods or services, in an amount that reflects the consideration which we expect to receive in exchange for those goods or services. We recognize revenues following the five-step model prescribed under ASU 2014-09: (i) identify contract(s) with a customer; (ii) identify the performance obligations in the contract; (iii) determine the transaction price; (iv) allocate the transaction price to the performance obligations in the contract; and (v) recognize revenues when (or as) we satisfy the performance obligation.
As a result of the new revenue standards, other corporate revenue was higher by $75.8 million and cost of sales, excluding amortization and impairment of acquired intangible assets was higher by $42.4 million for the year ended December 31, 2018, compared to what would have been reported under the previous revenue guidance,
BIOGEN INC. AND SUBSIDIARIESNOTES TO CONSOLIDATED FINANCIAL STATEMENTS — (Continued)
F- 11
primarily due to the earlier recognition of revenue associated with our contract manufacturing agreements. Under the previous revenue guidance, these amounts would have been recognized in future periods upon shipment. The adoption of the new revenue standards did not have a material impact on any other balances within our consolidated financial statements as of and for the year ended December 31, 2018.
Product Revenues
In the United States (U.S.), we sell our products primarily to wholesale distributors and specialty pharmacy providers. In other countries, we sell our products primarily to wholesale distributors, hospitals, pharmacies and other third-party distribution partners. These customers subsequently resell our products to health care providers and patients. In addition, we enter into arrangements with health care providers and payors that provide for government-mandated or privately-negotiated discounts and allowances related to our products.
Revenues from product sales are recognized when the customer obtains control of our product, which occurs at a point in time, typically upon delivery to the customer. We expense incremental costs of obtaining a contract as and when incurred if the expected amortization period of the asset that we would have recognized is one year or less or the amount is immaterial.
Reserves for Discounts and Allowances
Revenues from product sales are recorded net of reserves established for applicable discounts and allowances that are offered within contracts with our customers, health care providers or payors, including those associated with the implementation of pricing actions in certain of the international markets in which we operate. Our process for estimating reserves established for these variable consideration components do not differ materially from our historical practices.
Product revenue reserves, which are classified as a reduction in product revenues, are generally characterized in the following categories: discounts, contractual adjustments and returns.
These reserves are based on estimates of the amounts earned or to be claimed on the related sales and are classified as reductions of accounts receivable (if the amount is payable to our customer) or a liability (if the amount is payable to a party other than our customer). Our estimates of reserves established for variable consideration are calculated based upon a consistent application of our methodology utilizing the expected value method. These estimates reflect our historical experience, current contractual and statutory requirements, specific known market events and trends, industry data and forecasted customer buying and payment patterns. The transaction price, which includes variable consideration reflecting the impact of discounts and allowances, may be subject to constraint and is included in the net sales price only to the extent that it is probable that a significant reversal of the amount of the cumulative revenues recognized will not occur in a future period. Actual amounts may ultimately differ from our estimates. If actual results vary, we adjust these estimates, which could have an effect on earnings in the period of adjustment.
Discounts include trade term discounts and wholesaler incentives. Trade term discounts and wholesaler incentives primarily relate to estimated obligations for credits to be granted to wholesalers for remitting payment on their purchases within established incentive periods and credits to be granted to wholesalers for compliance with various contractually-defined inventory management practices, respectively. We determine these reserves based on our historical experience, including the timing of customer payments.
Contractual adjustments primarily relate to Medicaid and managed care rebates, co-payment (copay) assistance, Veterans Administration (VA) and Public Health Service (PHS) discounts, specialty pharmacy program fees and other governmental rebates or applicable allowances.
• Medicaid rebates relate to our estimated obligations to states under established reimbursement arrangements. Rebate accruals are recorded in the same period the related revenue is recognized, resulting in a reduction of product revenue and the establishment of a liability which is included in other current liabilities. Our liability for Medicaid rebates consists of estimates for claims that a state will make for the current quarter, claims for prior quarters that have been estimated for which an invoice has not been received, invoices received for claims from the prior quarters that have not been paid and an estimate of potential claims that will be made for inventory that exists in the distribution channel at period end.
• Governmental rebates or chargebacks, including VA and PHS discounts, represent our estimated obligations resulting from contractual commitments to sell products to qualified healthcare providers at prices lower

BIOGEN INC. AND SUBSIDIARIESNOTES TO CONSOLIDATED FINANCIAL STATEMENTS — (Continued)
F- 12
than the list prices we charge to wholesalers which provide those products. The wholesaler charges us for the difference between what the wholesaler pays for the products and the ultimate selling price to the qualified healthcare providers. Rebate and chargeback reserves are established in the same period as the related revenue is recognized, resulting in a reduction in product revenue and accounts receivable. Chargeback amounts are generally determined at the time of resale to the qualified healthcare provider from the wholesaler, and we generally issue credits for such amounts within a few weeks of the wholesaler notifying us about the resale. Our reserves for VA, PHS and chargebacks consist of amounts that we expect to issue for inventory that exists at the wholesalers that we expect will be sold to qualified healthcare providers and chargebacks that wholesalers have claimed for which we have not issued a credit.
• Managed care rebates represent our estimated obligations to third parties, primarily pharmacy benefit managers. Rebate accruals are recorded in the same period the related revenue is recognized, resulting in a reduction of product revenue and the establishment of a liability which is included in accrued expenses and other current liabilities. These rebates result from performance-based goals, formulary position and price increase limit allowances (price protection). The calculation of the accrual for these rebates is based on an estimate of the customer’s buying patterns and the resulting applicable contractual rebate rate(s) to be earned over a contractual period.
• Copay assistance represents financial assistance to qualified patients, assisting them with prescription drug co-payments required by insurance. The calculation of the accrual for copay is based on an estimate of claims and the cost per claim that we expect to receive associated with inventory that exists in the distribution channel at period end.
• Other governmental rebates, non-US pharmaceutical taxes or applicable allowances primarily relate to mandatory rebates and discounts in international markets where government-sponsored healthcare systems are the primary payors for healthcare.
Product returns are established for returns expected to be made by wholesalers and are recorded in the period the related revenue is recognized, resulting in a reduction to product revenues. In accordance with contractual terms, wholesalers are permitted to return product for reasons such as damaged or expired product. The majority of wholesaler returns are due to product expiration. Expired product return reserves are estimated through a comparison of historical return data to their related sales on a production lot basis. Historical rates of return are determined for each product and are adjusted for known or expected changes in the marketplace specific to each product.
In addition to discounts, rebates and product returns, we also maintain certain customer service contracts with distributors and other customers in the distribution channel that provide us with inventory management, data and distribution services, which are generally reflected as a reduction of revenues. To the extent we can demonstrate a separable benefit and fair value for these services we classify these payments in selling, general and administrative expenses.
Revenues from Anti-CD20 Therapeutic Programs
Our collaboration with Genentech is within the scope of Accounting Standards Codification (ASC) 808, Collaborative Agreements, which provides guidance on the presentation and disclosure of collaborative arrangements. For purposes of this footnote we refer to RITUXAN and RITUXAN HYCELA collectively as RITUXAN.
Our share of the pre-tax co-promotion profits on RITUXAN and GAZYVA and royalty revenues on the sale of OCREVUS resulted from an exchange of a license. As we do not have future performance obligations under the license or collaboration agreement, revenues are recognized as the underlying sales occur.
Revenues from anti-CD20 therapeutic programs consist of:
(i) our share of pre-tax profits and losses in the U.S. for RITUXAN and GAZYVA; and
(ii) other revenues from anti-CD20 therapeutic programs, which primarily consist of our share of pre-tax co-promotion profits on RITUXAN in Canada and royalty revenues on sales of OCREVUS.
Pre-tax co-promotion profits on RITUXAN and GAZYVA are calculated and paid to us by Genentech in the U.S. Pre-tax co-promotion profits on RITUXAN are calculated and paid to us by the Roche Group in Canada. Pre-tax co-promotion profits consist of U.S. and Canadian net sales to third-party customers less applicable costs to manufacture, third-party royalty expenses, distribution, selling and marketing expenses and joint development
BIOGEN INC. AND SUBSIDIARIESNOTES TO CONSOLIDATED FINANCIAL STATEMENTS — (Continued)
F- 13
expenses incurred by Genentech, the Roche Group and us. Our share of the pre-tax profits on RITUXAN and GAZYVA in the U.S. and pre-tax co-promotion profits on RITUXAN in Canada include estimates that are based on information received from Genentech. These estimates are subject to change and actual results may differ.
For additional information on our relationship with Genentech, please read Note 19, Collaborative and Other Relationships, to these consolidated financial statements.
Other Revenues
Collaborative and Other Relationships
We have a number of significant collaborative and other third-party relationships for revenues and for the development, regulatory approval, commercialization and marketing of certain of our products and product candidates. Where we are the principal on sales transactions with third parties, we recognize revenues, cost of sales and operating expenses on a gross basis in their respective lines in our consolidated statements of income. Where we are not the principal on sales transactions with third parties, we record our share of the revenues, cost of sales and operating expenses on a net basis in collaborative and other relationships included in other revenues in our consolidated statements of income.
Our development and commercialization arrangements with AbbVie Inc. (AbbVie), Genentech and Samsung Bioepis represent collaborative arrangements as each party is an active participant in one or more joint operating activities and is exposed to significant risks and rewards of these arrangements. These arrangements resulted from an exchange of a license and utilize the sales and usage based royalty exception. Therefore, revenues relating to royalties or profit-sharing amounts received are recognized as the underlying sales occur.
For additional information on our collaboration arrangements with AbbVie, Genentech and Samsung Bioepis, please read Note 19, Collaborative and Other Relationships, to these consolidated financial statements.
Royalty Revenues
We receive royalty revenues on sales by our licensees of other products covered under patents that we own. We do not have future performance obligations under these license arrangements. We record these revenues based on estimates of the sales that occurred during the relevant period as a component of other revenues. The relevant period estimates of sales are based on interim data provided by licensees and analysis of historical royalties that have been paid to us, adjusted for any changes in facts and circumstances, as appropriate. Differences between actual and estimated royalty revenues are adjusted for in the period in which they become known, typically the following quarter. Historically, adjustments have not been material when compared to actual amounts paid by licensees.
Other Corporate Revenues
We record other corporate revenues primarily from amounts earned under contract manufacturing agreements. Revenues under contract manufacturing agreements are recognized when the customer obtains control of the product, which may occur at a point in time or over time depending on the terms and conditions of the agreement.
Fair Value Measurements
We have certain financial assets and liabilities recorded at fair value which have been classified as Level 1, 2 or 3 within the fair value hierarchy as described in the accounting standards for fair value measurements.
• Level 1 — Fair values are determined utilizing quoted prices (unadjusted) in active markets for identical assets or liabilities that we have the ability to access;
• Level 2 — Fair values are determined by utilizing quoted prices for identical or similar assets and liabilities in active markets or other market observable inputs such as interest rates, yield curves, foreign currency spot rates and option pricing valuation models; and
• Level 3 — Prices or valuations that require inputs that are both significant to the fair value measurement and unobservable.
The majority of our financial assets have been classified as Level 2. Our financial assets (which include our cash equivalents, marketable debt securities and certain of our marketable equity securities, derivative contracts and plan assets for deferred compensation) have been initially valued at the transaction price and subsequently valued, at the end of each reporting period, utilizing third-party pricing services or option pricing valuation models.
BIOGEN INC. AND SUBSIDIARIESNOTES TO CONSOLIDATED FINANCIAL STATEMENTS — (Continued)
F- 14
The pricing services utilize industry standard valuation models, including both income and market-based approaches and observable market inputs to determine value. These observable market inputs include reportable trades, benchmark yields, credit spreads, broker/dealer quotes, bids, offers, current spot rates and other industry and economic events.
We validate the prices provided by our third-party pricing services by understanding the models used, obtaining market values from other pricing sources and analyzing pricing data in certain instances. The option pricing valuation models use assumptions within the model, including the term, stock price volatility, constant maturity risk-free interest rate and dividend yield. After completing our validation procedures, we did not adjust or override any fair value measurements provided by our pricing services as of December 31, 2018 and 2017.
Other Assets and Liabilities
The carrying amounts reflected in our consolidated balance sheets for current accounts receivable, due from anti-CD20 therapeutic programs, other current assets, accounts payable and accrued expenses and other, approximate fair value due to their short-term maturities.
Cash and Cash Equivalents
We consider only those investments that are highly liquid, readily convertible to cash and that mature within three months from date of purchase to be cash equivalents. As of December 31, 2018 and 2017, cash equivalents were comprised of money market funds, commercial paper, overnight reverse repurchase agreements and other debt securities with maturities less than 90 days from the date of purchase.
Accounts Receivable
The majority of our accounts receivable arise from product sales and primarily represent amounts due from our wholesale and other third-party distributors, public hospitals, pharmacies and other government entities and have standard payment terms that generally require payment within 30 to 90 days.
We do not adjust our receivables for the effects of a significant financing component at contract inception if we expect to collect the receivables in one year or less from the time of sale.
In countries where we have experienced a pattern of payments extending beyond our contractual payment term and we expect to collect receivables greater than one year from the time of sale, we have assessed whether the customer has a significant financing component and discounted our receivables and reduced related revenues over the period of time that we estimate those amounts will be paid using the country’s market-based borrowing rate for such period. The related receivables are classified at the time of sale as non-current assets. We accrete interest income on these receivables, which is recorded as a component of other income (expense), net in our consolidated statements of income.
We provide reserves against trade receivables for estimated losses that may result from a customer's inability to pay. Amounts determined to be uncollectible are charged or written-off against the reserve.
The adoption of the new revenue standards did not change our historical accounting methods for our accounts receivable.
Concentration of Credit Risk
Financial instruments that potentially subject us to concentrations of credit risk include cash and cash equivalents, investments, derivatives and accounts receivable. We attempt to minimize the risks related to cash and cash equivalents and investments by investing in a broad and diverse range of financial instruments as previously defined by us. We have established guidelines related to credit ratings and maturities intended to safeguard principal balances and maintain liquidity. Our investment portfolio is maintained in accordance with our investment policy, which defines allowable investments, specifies credit quality standards and limits the credit exposure of any single issuer. We minimize credit risk resulting from derivative instruments by choosing only highly rated financial institutions as counterparties.
Concentrations of credit risk with respect to receivables, which are typically unsecured, are somewhat mitigated due to the wide variety of customers and markets using our products, as well as their dispersion across many different geographic areas. We monitor the financial performance and creditworthiness of our customers so that we
BIOGEN INC. AND SUBSIDIARIESNOTES TO CONSOLIDATED FINANCIAL STATEMENTS — (Continued)
F- 15
can properly assess and respond to changes in their credit profile. We continue to monitor these conditions and assess their possible impact on our business.
Marketable Securities and Other Investments
Marketable Debt Securities
Available-for-sale marketable debt securities are recorded at fair market value and unrealized gains and losses are included in accumulated other comprehensive income (loss) in equity, net of related tax effects, unless the security has experienced a credit loss, we have determined that we have the intent to sell the security or we have determined that it is more likely than not that we will have to sell the security before its expected recovery. Realized gains and losses are reported in other income (expense), net, on a specific identification basis.
Marketable Equity Securities and Venture Capital Funds
Our marketable equity securities are recorded at fair market value and, beginning January 1, 2018, unrealized gains and losses are included in other income (expense), net in our consolidated statements of income. Prior to January 1, 2018, unrealized gains and losses were included in accumulated other comprehensive income (loss) in equity, net of related tax effects. Our marketable equity securities represent investments in publicly traded equity securities and are included in investments and other assets in our consolidated balance sheets.
Our investments in venture capital funds are recorded at net asset value, which approximates fair value, and, beginning January 1, 2018, unrealized gains and losses are included in other income (expense), net in our consolidated statements of income. Prior to January 1, 2018, these investments were accounted for under the cost method of accounting. The underlying investments of the venture capital funds in which we invest are in equity securities of certain biotechnology companies and are included in investments and other assets in our consolidated balance sheets.
Non-Marketable Equity Securities
We also invest in equity securities of companies whose securities are not publicly traded and where fair value is not readily available. These investments are recorded using either the equity method of accounting or the cost minus impairment adjusted for changes in observable prices, depending on our ownership percentage and other factors that suggest we have significant influence. We monitor these investments to evaluate whether any increase or decline in their value has occurred, based on the implied value of recent company financings, public market prices of comparable companies and general market conditions. These investments are included in investments and other assets in our consolidated balance sheets.
Evaluating Investments for Other-than-Temporary Impairments
We conduct periodic reviews to identify and evaluate each investment that has an unrealized loss, in accordance with the meaning of other-than-temporary impairment and its application to certain investments. An unrealized loss exists when the current fair value of an individual security is less than its amortized cost basis. Unrealized losses on available-for-sale debt securities that are determined to be temporary, and not related to credit loss, are recorded, net of tax, in accumulated other comprehensive income.
For available-for-sale debt securities with unrealized losses, management performs an analysis to assess whether we intend to sell or whether we would more likely than not be required to sell the security before the expected recovery of the amortized cost basis. Where we intend to sell a security, or may be required to do so, the security’s decline in fair value is deemed to be other-than-temporary and the full amount of the unrealized loss is reflected in earnings as an impairment loss.
Regardless of our intent to sell a security, we perform additional analysis on all securities with unrealized losses to evaluate losses associated with the creditworthiness of the security. Credit losses are identified where we do not expect to receive cash flows sufficient to recover the amortized cost basis of a security.
Equity Method of Accounting
In circumstances where we have the ability to exercise significant influence over the operating and financial policies of a company in which we have an investment, we utilize the equity method of accounting for recording investment activity. In assessing whether we exercise significant influence, we consider the nature and magnitude of our investment, the voting and protective rights we hold, any participation in the governance of the other company
BIOGEN INC. AND SUBSIDIARIESNOTES TO CONSOLIDATED FINANCIAL STATEMENTS — (Continued)
F- 16
and other relevant factors such as the presence of a collaborative or other business relationship. Under the equity method of accounting, we record in our results of operations our share of income or loss of the other company. If our share of losses exceeds the carrying value of our investment, we will suspend recognizing additional losses and will continue to do so unless we commit to providing additional funding.
Inventory
Inventories are stated at the lower of cost or net realizable value with cost based on the first-in, first-out method. We classify our inventory costs as long-term when we expect to utilize the inventory beyond our normal operating cycle and include these costs in investments and other assets in our consolidated balance sheets. Inventory that can be used in either the production of clinical or commercial products is expensed as research and development costs when identified for use in a clinical manufacturing campaign.
Capitalization of Inventory Costs
We capitalize inventory costs associated with our products prior to regulatory approval, when, based on management’s judgment, future commercialization is considered probable and the future economic benefit is expected to be realized. We consider numerous attributes in evaluating whether the costs to manufacture a particular product should be capitalized as an asset. We assess the regulatory approval process and where the particular product stands in relation to that approval process, including any known safety or efficacy concerns, potential labeling restrictions and other impediments to approval. We evaluate our anticipated research and development initiatives and constraints relating to the product and the indication in which it will be used. We consider our manufacturing environment including our supply chain in determining logistical constraints that could hamper approval or commercialization. We consider the shelf life of the product in relation to the expected timeline for approval and we consider patent related or contract issues that may prevent or delay commercialization. We also base our judgment on the viability of commercialization, trends in the marketplace and market acceptance criteria. Finally, we consider the reimbursement strategies that may prevail with respect to the product and assess the economic benefit that we are likely to realize. We expense previously capitalized costs related to pre-approval inventory upon a change in such judgment, due to, among other potential factors, a denial or significant delay of approval by necessary regulatory bodies.
Obsolescence and Unmarketable Inventory
We periodically review our inventories for excess or obsolescence and write-down obsolete or otherwise unmarketable inventory to its estimated net realizable value. If the actual net realizable value is less than that estimated by us, or if it is determined that inventory utilization will further diminish based on estimates of demand, additional inventory write-downs may be required. Additionally, our products are subject to strict quality control and monitoring that we perform throughout the manufacturing process. In the event that certain batches or units of product no longer meet quality specifications, we will record a charge to cost of sales to write-down any unmarketable inventory to its estimated net realizable value. In all cases, product inventory is carried at the lower of cost or its estimated net realizable value. Amounts written-down due to unmarketable inventory are charged to cost of sales.
Property, Plant and Equipment
Property, plant and equipment are carried at cost, subject to review for impairment whenever events or changes in circumstances indicate that the carrying amount of the asset may not be recoverable. The cost of normal, recurring, or periodic repairs and maintenance activities related to property, plant and equipment are expensed as incurred. The cost for planned major maintenance activities, including the related acquisition or construction of assets, is capitalized if the repair will result in future economic benefits.
Interest costs incurred during the construction of major capital projects are capitalized until the underlying asset is ready for its intended use, at which point the interest costs are amortized as depreciation expense over the life of the underlying asset. We also capitalize certain direct and incremental costs associated with the validation effort required for licensing by regulatory agencies of new manufacturing equipment for the production of a commercially approved drug. These costs primarily include direct labor and material and are incurred in preparing the equipment for its intended use. The validation costs are either amortized over the life of the related equipment or expensed as cost of sales when the product produced in the validation process is sold.
In addition, we capitalize certain internal use computer software development costs. If the software is an integral part of production assets, these costs are included in machinery and equipment and are amortized on a
BIOGEN INC. AND SUBSIDIARIESNOTES TO CONSOLIDATED FINANCIAL STATEMENTS — (Continued)
F- 17
straight-line basis over the estimated useful lives of the related software, which generally range from three to five years.
We generally depreciate or amortize the cost of our property, plant and equipment using the straight-line method over the estimated useful lives of the respective assets, which are summarized as follows:
Asset Category Useful Lives
Land Not depreciatedBuildings 15 to 40 yearsLeasehold Improvements Lesser of the useful life or the term of the respective leaseFurniture and Fixtures 5 to 7 yearsMachinery and Equipment 5 to 20 yearsComputer Software and Hardware 3 to 5 years
When we dispose of property, plant and equipment, we remove the associated cost and accumulated depreciation from the related accounts in our consolidated balance sheets and include any resulting gain or loss in our consolidated statements of income.
Intangible Assets
Our intangible assets consist of acquired and in-licensed rights and patents, developed technology, out-licensed patents, in-process research and development acquired after January 1, 2009, trademarks and trade names. Our intangible assets are recorded at fair value at the time of their acquisition and are stated in our consolidated balance sheets net of accumulated amortization and impairments, if applicable.
Intangible assets related to acquired and in-licensed rights and patents, developed technology and out-licensed patents are amortized over their estimated useful lives using the economic consumption method if anticipated future revenues can be reasonably estimated. The straight-line method is used when revenues cannot be reasonably estimated. Amortization is recorded within amortization and impairment of acquired intangible assets in our consolidated statements of income.
Acquired and in-licensed rights and patents primarily relate to our acquisition of all remaining rights to TYSABRI from Elan Pharma International, Ltd. (Elan), an affiliate of Elan Corporation, plc. Acquired and in-licensed rights and patents also includes our U.S. and rest of world licenses to Forward Pharma A/S' (Forward Pharma) intellectual property, including Forward Pharma's intellectual property related to TECFIDERA, and other amounts related to our other marketed products and other programs acquired through business combinations. Developed technology primarily relates to our AVONEX product, which was recorded in connection with the merger of Biogen, Inc. and IDEC Pharmaceuticals Corporation in 2003. We amortize the intangible assets related to our TYSABRI, AVONEX, SPINRAZA and TECFIDERA products using the economic consumption method based on revenues generated from the products underlying the related intangible assets. An analysis of the anticipated lifetime revenues of our TYSABRI, AVONEX, SPINRAZA and TECFIDERA products is performed annually during our long-range planning cycle and whenever events or changes in circumstances would significantly affect the anticipated lifetime revenues of our TYSABRI, AVONEX, SPINRAZA and TECFIDERA products.
Intangible assets related to trademarks, trade names and in-process research and development prior to commercialization are not amortized because they have indefinite lives; however, they are subject to review for impairment. We review our intangible assets with indefinite lives for impairment annually, as of October 31, and whenever events or changes in circumstances indicate that the carrying value of an asset may not be recoverable.
Acquired In-process Research and Development (IPR&D)
Acquired IPR&D represents the fair value assigned to research and development assets that have not reached technological feasibility. The value assigned to acquired IPR&D is determined by estimating the costs to develop the acquired technology into commercially viable products, estimating the resulting revenues from the projects and discounting the net cash flows to present value. The revenues and costs projections used to value acquired IPR&D are, as applicable, reduced based on the probability of success of developing a new drug. Additionally, the projections consider the relevant market sizes and growth factors, expected trends in technology and the nature and expected timing of new product introductions by us and our competitors. The rates utilized to discount the net cash flows to their present value are commensurate with the stage of development of the projects and uncertainties in the
BIOGEN INC. AND SUBSIDIARIESNOTES TO CONSOLIDATED FINANCIAL STATEMENTS — (Continued)
F- 18
economic estimates used in the projections. Upon the acquisition of IPR&D, we complete an assessment of whether our acquisition constitutes the purchase of a single asset or a group of assets. We consider multiple factors in this assessment, including the nature of the technology acquired, the presence or absence of separate cash flows, the development process and stage of completion, quantitative significance and our rationale for entering into the transaction.
If we acquire a business as defined under applicable accounting standards, then the acquired IPR&D is capitalized as an intangible asset. If we acquire an asset or group of assets that do not meet the definition of a business under applicable accounting standards, then the acquired IPR&D is expensed on its acquisition date. Future costs to develop these assets are recorded to research and development expense as they are incurred.
When performing our impairment assessment, we calculate the fair value using the same methodology as described above. If the carrying value of our acquired IPR&D exceeds its fair value, then the intangible asset is written-down to its fair value. Changes in estimates and assumptions used in determining the fair value of our acquired IPR&D could result in an impairment. Impairments are recorded within amortization and impairment of acquired intangible assets in our consolidated statements of income. Assets that have been previously impaired, including our vixotrigine (BIIB074) program for the treatment of neuropathic pain, such as trigeminal neuralgia (TGN), could become further impaired in the future.
Goodwill
Goodwill represents the difference between the purchase price and the fair value of the identifiable tangible and intangible net assets when accounted for using the purchase method of accounting. Goodwill is not amortized, but reviewed for impairment. Goodwill is reviewed annually, as of October 31, and whenever events or changes in circumstances indicate that the carrying value of the goodwill may not be recoverable.
We compare the fair value of our reporting unit to its carrying value. If the carrying value of the net assets assigned to the reporting unit exceeds the fair value of our reporting unit, we would record an impairment loss equal to the difference. As described in Note 25, Segment Information, to these consolidated financial statements, we operate in one operating segment, which is our only reporting unit.
Impairment of Long-Lived Assets
Long-lived assets to be held and used, including property, plant and equipment, and definite-lived intangible assets are reviewed for impairment whenever events or changes in circumstances indicate that the carrying amount of the assets or asset group may not be recoverable.
Determination of recoverability is based on an estimate of undiscounted future cash flows resulting from the use of the asset and its eventual disposition. In the event that such cash flows are not expected to be sufficient to recover the carrying amount of the assets, the assets are written-down to their fair values. Long-lived assets to be disposed of are carried at fair value less costs to sell.
Contingent Consideration
The consideration for our acquisitions often includes future payments that are contingent upon the occurrence of a particular event or events. For acquisitions completed before January 1, 2009, we record contingent consideration resulting from a business combination when the contingency is resolved. For acquisitions of a business completed after January 1, 2009, we record an obligation for such contingent payments at fair value on the acquisition date. We estimate the fair value of contingent consideration obligations through valuation models that incorporate probability-adjusted assumptions related to the achievement of the milestones and thus likelihood of making related payments. We revalue our contingent consideration obligations each reporting period. Changes in the fair value of our contingent consideration obligations are recognized in our consolidated statements of income. Changes in the fair value of the contingent consideration obligations can result from changes to one or multiple inputs, including adjustments to the discount rates, changes in the amount or timing of expected expenditures associated with product development, changes in the amount or timing of cash flows and reserves associated with products upon commercialization, changes in the assumed achievement or timing of any cumulative sales-based and development milestones, changes in the probability of certain clinical events and changes in the assumed probability associated with regulatory approval.
Discount rates in our valuation models represent a measure of the credit risk associated with settling the liability. The period over which we discount our contingent obligations is based on the current development stage of
BIOGEN INC. AND SUBSIDIARIESNOTES TO CONSOLIDATED FINANCIAL STATEMENTS — (Continued)
F- 19
the product candidates, our specific development plan for that product candidate adjusted for the probability of completing the development step and when the contingent payments would be triggered. In estimating the probability of success, we utilize data regarding similar milestone events from several sources, including industry studies and our own experience. These fair value measurements are based on significant inputs not observable in the market. Significant judgment is employed in determining the appropriateness of these assumptions as of the acquisition date and for each subsequent period. Accordingly, changes in assumptions could have a material impact on the amount of contingent consideration expense we record in any given period.
Derivative Instruments and Hedging Activities
Cash Flow and Fair Value Derivative Instruments
We recognize all derivative instruments as either assets or liabilities at fair value in our consolidated balance sheets. Changes in the fair value of our derivative instruments are recognized each period in current earnings or accumulated other comprehensive income (loss), depending on whether the derivative instrument is designated as part of a hedge transaction and, if so, the type of hedge transaction. We classify the cash flows from these instruments in the same category as the cash flows from the hedged items. We do not hold or issue derivative instruments for trading or speculative purposes.
We assess at inception and on an ongoing basis, whether the derivative instruments that are used in hedging transactions are highly effective in offsetting the changes in cash flows or fair values of the hedged items. We exclude the forward points portion of the derivative instruments used in a hedging transaction from the effectiveness test and record the fair value gain or loss related to this portion each period in our consolidated statements of income in the same line as the underlying hedged item. If we determine that a forecasted transaction is no longer probable of occurring, we discontinue hedge accounting for the affected portion of the hedge instrument, and any related unrealized gain or loss on the contract is recognized in current earnings.
Net Investment Derivative Instruments
We are exposed to the impact of foreign exchange fluctuations on our investment in the equity of Samsung Bioepis, which is denominated in a currency other than the U.S. dollar, and could adversely impact the U.S. dollar value of this investment. Using derivative instruments, we have hedged our net investment position to mitigate the effects of foreign exchange fluctuations. We recognize these designated net investment hedges as either assets or liabilities, at fair value, in our consolidated balance sheets. We hedge the changes in the spot exchange rate in accumulated other comprehensive income (loss) and exclude changes to the forward rate and amortize the forward points in other income (expense), net in our consolidated statements of income over the term of the contract. We classify the cash flows from these instruments in the same category as the cash flows from the hedged items.
For additional information on our derivative instruments and hedging activities, please read Note 10, Derivative Instruments, to these consolidated financial statements.
Translation of Foreign Currencies
The functional currency for most of our foreign subsidiaries is their local currency. For our non-U.S. subsidiaries that transact in a functional currency other than the U.S. dollar, assets and liabilities are translated at current rates of exchange at the balance sheet date. Income and expense items are translated at the average foreign currency exchange rates for the period. Adjustments resulting from the translation of the financial statements of our foreign operations into U.S. dollars are excluded from the determination of net income and are recorded in accumulated other comprehensive income, a separate component of equity. For subsidiaries where the functional currency of the assets and liabilities differ from the local currency, non-monetary assets and liabilities are translated at the rate of exchange in effect on the date assets were acquired while monetary assets and liabilities are translated at current rates of exchange as of the balance sheet date. Income and expense items are translated at the average foreign currency rates for the period. Translation adjustments of these subsidiaries are included in other income (expense), net in our consolidated statements of income.
Royalty Cost of Sales
We make royalty payments to a number of third parties under license or purchase agreements associated with our acquisition of intellectual property. These royalty payments are typically calculated as a percentage (royalty rate) of the sales of our products in a particular year. That royalty rate may remain constant, increase or decrease within each year based on the total amount of sales during the annual period. Each quarterly period, we estimate our total royalty obligation for the full year and recognize the proportional amount as cost of sales based on actual quarterly
BIOGEN INC. AND SUBSIDIARIESNOTES TO CONSOLIDATED FINANCIAL STATEMENTS — (Continued)
F- 20
sales as a percentage of full year estimated sales. For example, if the level of net sales in any calendar year increases the royalty rate within the year, we will record our cost of sales at an even rate over the year, based on the estimated blended royalty rate.
Accounting for Share-Based Compensation
Our share-based compensation programs grant awards that have included stock options, restricted stock units that vest based on stock performance known as market stock units (MSUs), performance-vested restricted stock units that settle in cash (CSPUs), time-vested restricted stock units (RSUs), performance-vested restricted stock units that can be settled in cash or shares of our common stock (PUs) at the sole discretion of the Compensation and Management Development Committee of our Board of Directors, performance-vested stock units that settle in stock or cash (PSUs) and shares issued under our employee stock purchase plan (ESPP). We charge the estimated fair value of awards against income over the requisite service period, which is generally the vesting period. Where awards are made with non-substantive vesting periods (for instance, where a portion of the award vests upon retirement eligibility), we estimate and recognize expense based on the period from the grant date to the date the employee becomes retirement eligible.
The fair values of our stock option grants are estimated as of the date of grant using a Black-Scholes option valuation model. The estimated fair values of the stock options are then expensed over the options’ vesting periods.
The fair values of our MSUs are estimated using a lattice model with a Monte Carlo simulation. We apply an accelerated attribution method to recognize share-based compensation expense over the applicable service period, net of estimated forfeitures when accounting for our MSUs. The probability of actual shares expected to be earned is considered in the grant date valuation, therefore the expense is not adjusted to reflect the actual units earned.
The fair values of our RSUs are based on the market value of our stock on the date of grant. Compensation expense, net of forfeitures, for RSUs is recognized straight-line over the applicable service period.
We apply an accelerated attribution method to recognize share-based compensation expense when accounting for our CSPUs, PUs and PSUs that settle in cash, and the fair value of the liability is remeasured at the end of each reporting period through expected settlement. Compensation expense associated with CSPUs, PUs and PSUs that settle in cash are based upon the stock price and the number of units expected to be earned after assessing the probability that certain performance criteria will be met and the associated targeted payout level that is forecasted will be achieved, net of estimated forfeitures. Cumulative adjustments are recorded each quarter to reflect changes in the stock price and estimated outcome of the performance-related conditions until the date results are determined and settled.
The fair values of PSUs that settle in stock are based upon the stock price on the date of grant and the number of units expected to be earned after assessing the probability that certain performance criteria will be met and the associated targeted payout level that is forecasted will be achieved, net of estimated forfeitures. Cumulative adjustments are recorded each quarter to reflect the estimated outcome of the performance-related conditions until the date results are determined and settled.
The purchase price of common stock under our ESPP is equal to 85% of the lesser of (i) the fair market value per share of the common stock on the first business day of an offering period and (ii) the fair market value per share of the common stock on the purchase date. The fair value of the discounted purchases made under our ESPP is calculated using the Black-Scholes valuation model. The fair value of the look-back provision plus the 15% discount is recognized as compensation expense over the 90-day purchase period.
Research and Development Expenses
Research and development expenses consist of upfront fees and milestones paid to collaborators and expenses incurred in performing research and development activities, which include compensation and benefits, facilities and overhead expenses, clinical trial expenses and fees paid to contract research organizations (CROs), clinical supply and manufacturing expenses, write-offs of inventory that was previously capitalized in anticipation of product launch and determined to no longer be realizable and other outside expenses. Research and development expenses are expensed as incurred. Payments we make for research and development services prior to the services being rendered are recorded as prepaid assets in our consolidated balance sheets and are expensed as the services are provided. We also accrue the costs of ongoing clinical trials associated with programs that have been

BIOGEN INC. AND SUBSIDIARIESNOTES TO CONSOLIDATED FINANCIAL STATEMENTS — (Continued)
F- 21
terminated or discontinued for which there is no future economic benefit at the time the decision is made to terminate or discontinue the program.
From time to time, we enter into development agreements in which we share expenses with a collaborative partner. We record payments received from our collaborative partners for their share of the development costs as a reduction of research and development expense, except as discussed in Note 19, Collaborative and Other Relationships, to these consolidated financial statements. Because an initial indication has been approved for both RITUXAN and GAZYVA, expenses incurred by Genentech in the ongoing development of RITUXAN and GAZYVA are not recorded as research and development expense, but rather reduce our share of profits recorded as a component of revenues from anti-CD20 therapeutic programs.
For collaborations with commercialized products, if we are the principal, we record revenues and the corresponding operating costs in their respective line items in our consolidated statements of income. If we are not the principal, we record operating costs as a reduction of revenue.
Selling, General and Administrative Expenses
Selling, general and administrative expenses are primarily comprised of compensation and benefits associated with sales and marketing, finance, human resources, legal, information technology and other administrative personnel, outside marketing, advertising and legal expenses and other general and administrative costs.
Advertising costs are expensed as incurred. For the years ended December 31, 2018, 2017 and 2016, advertising costs totaled $90.2 million, $75.2 million and $106.3 million, respectively.
Income Taxes
The provision for income taxes includes federal, state, local and foreign taxes. Income taxes are accounted for under the liability method. Deferred tax assets and liabilities are recognized for the estimated future tax consequences of temporary differences between the financial statement carrying amounts and their respective tax bases. Deferred tax assets and liabilities are measured using enacted tax rates expected to apply to taxable income in the year in which the temporary differences are expected to be recovered or settled. We evaluate the realizability of our deferred tax assets and establish a valuation allowance when it is more likely than not that all or a portion of deferred tax assets will not be realized. In December 2018 we elected to recognize deferred taxes associated with our global intangible low-taxed income (GILTI) tax calculations.
In October 2016 the FASB issued ASU No. 2016-16, Income Taxes (Topic 740): Intra-Entity Transfer of Assets Other Than Inventory. This standard eliminates the deferral of the tax effects of intra-entity asset transfers other than inventory. As a result, the income tax consequences from the intra-entity transfers of assets other than inventory within our consolidated group, both current and deferred, are recorded as a prepaid tax or deferred charge and recognized through our consolidated statements of income when the asset is transferred.
We account for uncertain tax positions using a “more-likely-than-not” threshold for recognizing and resolving uncertain tax positions. We evaluate uncertain tax positions on a quarterly basis and consider various factors including, but not limited to, changes in tax law, the measurement of tax positions taken or expected to be taken in tax returns, the effective settlement of matters subject to audit, information obtained during in process audit activities and changes in facts or circumstances related to a tax position. We also accrue for potential interest and penalties related to unrecognized tax benefits in income tax expense.
Contingencies
We are currently involved in various claims and legal proceedings. Loss contingency provisions are recorded if the potential loss from any claim, asserted or unasserted, or legal proceeding is considered probable and the amount can be reasonably estimated or a range of loss can be determined. These accruals represent management’s best estimate of probable loss. Disclosure also is provided when it is reasonably possible that a loss will be incurred or when it is reasonably possible that the amount of a loss will exceed the recorded provision. On a quarterly basis, we review the status of each significant matter and assess its potential financial exposure. Significant judgment is required in both the determination of probability and the determination as to whether an exposure is reasonably estimable. Because of uncertainties related to these matters, accruals are based only on the best information available at the time. As additional information becomes available, we reassess the potential liability related to pending claims and litigation and may change our estimates. These changes in the estimates of the potential liabilities could have a material impact on our consolidated results of operations and financial position.
BIOGEN INC. AND SUBSIDIARIESNOTES TO CONSOLIDATED FINANCIAL STATEMENTS — (Continued)
F- 22
Earnings per Share
Basic earnings per share is computed by dividing undistributed net income attributable to Biogen Inc. by the weighted-average number of common shares outstanding during the period.
New Accounting Pronouncements
From time to time, new accounting pronouncements are issued by the FASB or other standard setting bodies that we adopt as of the specified effective date. Unless otherwise discussed below, we do not believe that the adoption of recently issued standards have or may have a material impact on our consolidated financial statements or disclosures.
Revenue recognition
In May 2014 the FASB issued ASU 2014-09, which supersedes all existing revenue recognition requirements, including most industry specific guidance. This standard requires a company to recognize revenue when it transfers goods or services to customers in an amount that reflects the consideration that the company expects to receive for those goods or services. For additional information on the adoption of the new revenue standards, please read the section titled Revenue Recognition above, and Note 5, Revenues, to these consolidated financial statements.
Financial Instruments
In January 2016 the FASB issued ASU No. 2016-01, Financial Instruments - Overall (Subtopic 825-10): Recognition and Measurement of Financial Assets and Financial Liabilities. This standard amends certain aspects of accounting and disclosure requirements for financial instruments, including the requirement that equity investments with readily determinable fair values are to be measured at fair value with any changes in fair value recognized in a company's results of operations. This standard does not apply to investments accounted for under the equity method of accounting or those investments that result in consolidation of the investee. Equity investments that do not have readily determinable fair values may be measured at fair value or at cost minus impairment adjusted for changes in observable prices. A financial liability that is measured at fair value in accordance with the fair value option is required to be presented separately in other comprehensive income for the portion of the total change in the fair value resulting from change in the instrument-specific credit risk. In addition, a valuation allowance should be evaluated on deferred tax assets related to available-for-sale debt securities in combination with other deferred tax assets.
We adopted this standard on January 1, 2018, using the modified retrospective method, and recognized a $1.3 million net increase to retained earnings as well as a $1.5 million increase to accumulated other comprehensive income reflecting the cumulative impact for the accounting changes made upon adoption. The adoption of this standard resulted in a change in the income statement classification with respect to where we recognize changes in fair value related to certain equity security investments. Prior to the adoption of ASU 2016-01, we recognized changes in fair value in accumulated other comprehensive income (loss), net. Upon the adoption of ASU 2016-01, we recognize changes in fair value in other income (expense), net. During the year ended December 31, 2018, we recognized net gains resulting from changes in fair value related to our equity security investments in other income (expense), net totaling approximately $128.0 million under this standard that would not have been recognized in other income (expense), net under the previous standard.
Leasing
In February 2016 the FASB issued ASU No. 2016-02, Leases (Topic 842). This standard established a right-of-use model that requires all lessees to recognize right-of-use assets and liabilities on their balance sheet that arise from leases with terms longer than 12 months as well as provide disclosures with respect to certain qualitative and quantitative information related to their leasing arrangements. This standard became effective for us on January 1, 2019.
The FASB has subsequently issued the following amendments to ASU 2016-02, which have the same effective date and transition date of January 1, 2019, and which we collectively refer to as the new leasing standards:
• ASU No. 2018-01, Leases (Topic 842): Land Easement Practical Expedient for Transition to Topic 842, which permits an entity to elect an optional transition practical expedient to not evaluate under Topic 842 land easements that exist or expired prior to adoption of Topic 842 and that were not previously accounted for as leases under the prior standard, ASC 840, Leases.
BIOGEN INC. AND SUBSIDIARIESNOTES TO CONSOLIDATED FINANCIAL STATEMENTS — (Continued)
F- 23
• ASU No. 2018-10, Codification Improvements to Topic 842, Leases, which amends certain narrow aspects of the guidance issued in ASU 2016-02.
• ASU No. 2018-11, Leases (Topic 842): Targeted Improvements, which allows for a transition approach to initially apply ASU 2016-02 at the adoption date and recognize a cumulative-effect adjustment to the opening balance of retained earnings in the period of adoption as well as an additional practical expedient for lessors to not separate non-lease components from the associated lease component.
• ASU No. 2018-20, Narrow-Scope Improvements for Lessors, which contains certain narrow scope improvements to the guidance issued in ASU 2016-02.
We adopted the new leasing standards on January 1, 2019, using a modified retrospective transition approach to be applied to leases existing as of, or entered into after, January 1, 2019. We have reviewed our existing lease contracts and the impact of the new leasing standards on our consolidated results of operations, financial position and disclosures. Upon adoption of the new leasing standards, we expect to recognize a lease liability and related right-of-use asset on our consolidated balance sheet of approximately $0.5 billion. The impact of adoption of the new leasing standards will have an immaterial impact to our consolidated statements of income.
Credit Losses
In June 2016 the FASB issued ASU No. 2016-13, Financial Instruments - Credit Losses (Topic 326): Measurement of Credit Losses on Financial Instruments. This standard requires that credit losses be reported using an expected losses model rather than the incurred losses model that is currently used, and establishes additional disclosures related to credit risks. For available-for-sale debt securities with unrealized losses, this standard now requires allowances to be recorded instead of reducing the amortized cost of the investment. This standard will be effective for us on January 1, 2020. We are currently evaluating the potential impact that this standard may have on our consolidated financial position and results of operations.
Income Taxes
In October 2016 the FASB issued ASU No. 2016-16, Income Taxes (Topic 740): Intra-Entity Transfer of Assets Other Than Inventory. This standard eliminates the deferral of the tax effects of intra-entity asset transfers other than inventory. As a result, the income tax consequences from the intra-entity transfer of an asset other than inventory and associated changes to deferred taxes will be recognized when the transfer occurs.
We adopted this standard on January 1, 2018, using the modified retrospective method, through a cumulative-effect adjustment to retained earnings as of that date. Upon adoption, we recognized additional net deferred tax assets of approximately $0.5 billion, offset by a corresponding net increase to retained earnings of approximately $0.5 billion. In the fourth quarter of 2018, when we elected to begin recognizing deferred taxes on the GILTI tax calculation, we recorded an additional deferred tax liability of $0.4 billion with a corresponding reduction to our retained earnings as these differences are related to inter-entity transactions. We will recognize incremental deferred income tax expense thereafter as these deferred tax assets and liabilities are utilized.
For additional information on our income taxes, please read Note 17, Income Taxes, to these consolidated financial statements.
Net Periodic Pension Cost
In March 2017 the FASB issued ASU No. 2017-07, Compensation - Retirement Benefits (Topic 715): Improving the Presentation of Net Periodic Pension Costs and Net Periodic Postretirement Benefit Cost. This standard requires that an employer disaggregate the service cost component from the other components of net benefit cost. This standard also provides explicit guidance on how to present the service cost component and the other components of net benefit cost in the statements of income and allows only the service cost component of net benefit cost to be eligible for capitalization. The other components of the net periodic benefit cost must be presented separately from the line items that include service cost and outside of any subtotal of operating income on our consolidated statements of income. We adopted this standard on January 1, 2018, using the retrospective method.
As a result of the adoption of this standard, the other components of net periodic benefit cost, which we previously presented as a component of operating income, are now classified in other income (expense), net in our consolidated statements of income. For the years ended December 31, 2017 and 2016, $2.5 million and $3.3
BIOGEN INC. AND SUBSIDIARIESNOTES TO CONSOLIDATED FINANCIAL STATEMENTS — (Continued)
F- 24
million, respectively, were reclassified from operating income to other income (expense), net in our consolidated statements of income to conform to our current year presentation.
Debt Securities
In March 2017 the FASB issued ASU No. 2017-08, Receivables - Nonrefundable Fees and Other Costs (Subtopic 310-20): Premium Amortization on Purchased Callable Debt Securities. This standard amends the amortization period for certain purchased callable debt securities held at a premium by shortening the amortization period to the earliest call date. This standard became effective for us on January 1, 2019, and was adopted using a modified retrospective transition approach. Based upon our marketable debt securities as of December 31, 2018, the adoption of this standard did not result in a significant adjustment to our marketable debt securities.
Derivative Instruments and Hedging Activities
In August 2017 the FASB issued ASU No. 2017-12, Derivatives and Hedging (Topic 815): Targeted Improvements to Accounting for Hedging Activities. This standard provides guidance to better align an entity's risk management activities and financial reporting for hedging relationships through changes to both the designation and measurement guidance for qualifying hedging relationships and the presentation of hedge results. This standard expands and refines hedge accounting for both non-financial and financial risk components and aligns the recognition and presentation of the effects of the hedging instrument and the hedged item in the financial statements.
We adopted this standard on January 1, 2018, using the modified retrospective method, which did not have an impact on our financial position or results of operations; however, the adoption of this standard resulted in additional disclosures and a change in the income statement classification with respect to where we recognize cash flow hedge ineffective or excluded hedge transaction gains and losses. Prior to the adoption of ASU 2017-12 on January 1, 2018, to the extent ineffective or excluded, cash flow hedge transaction gains and losses were reported in other income (expense), net. Effective January 1, 2018, we recognize all cash flow hedge reclassifications from accumulated other comprehensive income and fair value changes of any cash flow hedge ineffectiveness or excluded portions in the same line item in our consolidated statements of income that has been impacted by the hedged item.
Additionally, in October 2018 the FASB issued ASU No. 2018-16, Derivatives and Hedging (Topic 815): Inclusion of the Secured Overnight Financing Rate (SOFR) Overnight Index Swap (OIS) Rate as a Benchmark Interest Rate for Hedge Accounting Purposes. This standard permits use of the OIS rate based on the SOFR as a U.S. benchmark interest rate for hedge accounting purposes under ASC 815, Derivatives and Hedging.
For additional information on our derivative instruments and hedging activities, please read Note 10, Derivative Instruments, to these consolidated financial statements.
Fair Value Measurements
In August 2018 the FASB issued ASU No. 2018-13, Fair Value Measurement (Topic 820): Disclosure Framework Changes to the Disclosure Requirements for Fair Value Measurement. This standard modifies certain disclosure requirements on fair value measurements. This standard will be effective for us on January 1, 2020. We do not expect that the adoption of this standard will have a material impact on our disclosures.
Collaborative Arrangements
In November 2018 the FASB issued ASU No. 2018-18, Collaborative Arrangements (Topic 808): Clarifying the Interaction between Topic 808 and Topic 606. This standard makes targeted improvements for collaborative arrangements as follows:
• Clarifies that certain transactions between collaborative arrangement participants should be accounted for as revenue under ASC 606, Revenue from Contracts with Customers, when the collaborative arrangement participant is a customer in the context of a unit of account. In those situations, all the guidance in ASC 606 should be applied, including recognition, measurement, presentation and disclosure requirements;
BIOGEN INC. AND SUBSIDIARIESNOTES TO CONSOLIDATED FINANCIAL STATEMENTS — (Continued)
F- 25
• Adds unit-of-account guidance to ASC 808, Collaborative Arrangements, to align with the guidance in ASC 606 (that is, a distinct good or service) when an entity is assessing whether the collaborative arrangement or a part of the arrangement is within the scope of ASC 606; and
• Requires that in a transaction with a collaborative arrangement participant that is not directly related to sales to third parties, presenting that transaction together with revenue recognized under ASC 606 is precluded if the collaborative arrangement participant is not a customer.
This standard will be effective for us on January 1, 2020; however, early adoption is permitted. A retrospective transition approach is required for either all contracts or only for contracts that are not completed at the date of initial application of ASC 606, with a cumulative adjustment to opening retained earnings. We are currently evaluating the potential impact that this standard may have on our consolidated financial position and results of operations.
2. Acquisitions
BIIB100 Acquisition
In January 2018 we acquired BIIB100 (formerly known as KPT-350) from Karyopharm Therapeutics Inc. (Karyopharm). BIIB100 is a Phase 1 ready investigational oral compound for the treatment of certain neurological and neurodegenerative diseases, primarily in ALS. BIIB100 is a novel therapeutic candidate that works by inhibiting a protein known as XPO1, with the goal of reducing inflammation and neurotoxicity, along with increasing neuroprotective responses.
We accounted for this transaction as an asset acquisition as the value being acquired primarily relates to a single asset. In connection with the closing of this transaction, we made an upfront payment of $10.0 million to Karyopharm, which was recorded as acquired IPR&D in our consolidated statements of income as BIIB100 has not yet reached technological feasibility. We may also pay Karyopharm up to $207.0 million in additional milestone payments as well as tiered royalties on potential net commercial sales in the mid-single digit to low-teen percentages.
BIIB104 Acquisition
In April 2018 we acquired BIIB104 (formerly known as PF-04958242) from Pfizer Inc. (Pfizer). BIIB104 is a first-in-class, Phase 2b ready AMPA receptor potentiator for CIAS, representing our first program in neurocognitive disorders. AMPA receptors mediate fast excitatory synaptic transmission in the central nervous system, a process which can be disrupted in a number of neurological and psychiatric diseases, including schizophrenia.
We accounted for this transaction as an asset acquisition as the value being acquired primarily relates to a single asset. In connection with the closing of this transaction, we made an upfront payment of $75.0 million to Pfizer, which was recorded as acquired IPR&D in our consolidated statements of income as BIIB104 has not yet reached technological feasibility. We may also pay Pfizer up to $515.0 million in additional development and commercialization milestone payments as well as tiered royalties on potential net commercial sales in the low to mid-teen percentages.
During the fourth quarter of 2018 we accrued a $10.0 million milestone payment related to the Phase 2b trial for BIIB104, which is included in research and development expense in our consolidated statements of income.
TMS Co., Ltd.
In June 2018 we entered into an exclusive option agreement with TMS Co., Ltd. (TMS) granting us the option to acquire TMS-007, a plasminogen activator with a novel mechanism of action associated with breaking down blood clots, which is in Phase 2 development in Japan, and backup compounds for the treatment of stroke. In exchange for the purchase option, we made a $4.0 million upfront payment to TMS, which was recorded as research and development expense in our consolidated statements of income as TMS-007 has not yet reached technological feasibility.
If we exercise the purchase option, we will make an additional payment of $18.0 million upon closing of the asset acquisition, which will be recorded as acquired IPR&D expense in our consolidated statements of income as TMS-007 will not have reached technological feasibility at that time. In addition, we may pay TMS up to $335.0 million in additional development and commercialization milestone payments as well as tiered royalties on potential
BIOGEN INC. AND SUBSIDIARIESNOTES TO CONSOLIDATED FINANCIAL STATEMENTS — (Continued)
F- 26
net commercial sales in the high-single digit to low-teen percentages. If we exercise the purchase option, consummation of the asset acquisition may be subject to the expiration of the applicable waiting period under the Hart-Scott-Rodino Antitrust Improvements Act of 1976 in the U.S.
BIIB110 Acquisition
In July 2018 we acquired BIIB110 (formerly known as ALG-801) (Phase 1a) and ALG-802 (preclinical) from AliveGen Inc. (AliveGen). BIIB110 and ALG-802 represent novel ways of targeting the myostatin pathway. We initially plan to study BIIB110 in multiple neuromuscular indications, including SMA and ALS.
We accounted for this transaction as an asset acquisition as the value being acquired primarily relates to a single asset. In connection with the closing of this transaction, we made an upfront payment of $27.5 million to AliveGen, which was recorded as acquired IPR&D in our consolidated statements of income as BIIB110 has not yet reached technological feasibility. We may also pay AliveGen up to $535.0 million in additional development and commercialization milestones.
BIIB093 Acquisition
In May 2017 we acquired BIIB093 (glibencamide IV) (formerly known as CIRARA) from Remedy Pharmaceuticals Inc. (Remedy). BIIB093 is a Phase 3 ready candidate for large hemispheric infarction (LHI), a severe form of ischemic stroke where brain swelling (cerebral edema) often leads to a disproportionately large share of stroke-related morbidity and mortality. The U.S. Food and Drug Administration (FDA) granted BIIB093 orphan drug designation for severe cerebral edema in patients with acute ischemic stroke. The FDA has also granted BIIB093 Fast Track designation.
We are responsible for the future development and commercialization of BIIB093 and Remedy will share in the cost of development for the target indication for BIIB093 in LHI stroke.
We accounted for this transaction as an asset acquisition as we did not acquire any employees from Remedy nor did we acquire any significant processes required in the development of BIIB093. In connection with the closing of this transaction, we made an upfront payment of $120.0 million to Remedy, which was recorded as acquired IPR&D in our consolidated statements of income as BIIB093 has not yet reached technological feasibility. We may also pay Remedy certain development and sales based milestone payments that are substantially payable upon or after regulatory approval, as well as royalties on potential net commercial sales.
3. Hemophilia Spin-OffOn February 1, 2017, we completed the spin-off of our hemophilia business, Bioverativ, as an independent,
publicly traded company, which was acquired by Sanofi in March 2018. In connection with the spin-off, each Biogen shareholder received one share of Bioverativ common stock for every two shares of Biogen common stock they owned. The separation and distribution was structured to be tax-free for shareholders for federal income tax purposes. Bioverativ assumed all of our rights and obligations under our collaboration agreement with Swedish Orphan Biovitrum AB (Sobi) and our collaboration and license agreement with Sangamo Biosciences Inc.
Biogen and Bioverativ entered into a separation agreement and various other agreements, including a manufacturing and supply agreement, which govern the separation and distribution and the relationship between the two companies going forward. Under the separation agreement, Bioverativ is obligated to indemnify us for liabilities that may exist relating to its business activities, whether incurred prior to or after the distribution, including any pending or future litigation.

BIOGEN INC. AND SUBSIDIARIESNOTES TO CONSOLIDATED FINANCIAL STATEMENTS — (Continued)
F- 27
In connection with the distribution we made a net cash contribution to Bioverativ, during the first quarter of 2017, totaling $302.7 million. The following table summarizes the assets and liabilities that were charged against equity as a result of the spin-off of our hemophilia business:
(In millions)
Assets
Cash............................................................................................................................... $ 302.7
Accounts receivable ......................................................................................................... 144.7
Inventory ......................................................................................................................... 116.1
Property, plant and equipment, net .................................................................................... 20.2
Intangible assets, net....................................................................................................... 56.8
Goodwill .......................................................................................................................... 314.1
Other, net ........................................................................................................................ 53.7
Assets transferred, net....................................................................................................... $ 1,008.3
Liabilities
Accrued expenses and other current liabilities ................................................................... $ 87.8
Other long-term liabilities.................................................................................................. 67.7
Liabilities transferred, net................................................................................................... $ 155.5
Pursuant to the terms of our agreements with Bioverativ, upon completion of the spin-off, we distributed ALPROLIX and ELOCTATE on behalf of Bioverativ until Bioverativ obtained appropriate regulatory authorizations in certain countries, including a Biologics License Application transfer in the U.S., which was received in September 2017. Accordingly, commencing October 2017, we ceased distribution of ALPROLIX and ELOCTATE on behalf of Bioverativ under this arrangement.
Under the manufacturing and supply agreement, we manufacture and supply certain products and materials to Bioverativ. The manufacturing and supply agreement has an initial term of five years, with a five-year extension at Bioverativ's sole discretion and a further five-year extension with Bioverativ's and our consent. For the years ended December 31, 2018 and 2017, we recognized $206.7 million and $64.8 million, respectively, in revenues in relation to contract manufacturing services provided to Bioverativ, which is reflected as a component of other royalty and corporate revenues in our consolidated statements of income. We also recorded $180.4 million and $15.1 million as cost of sales in relation to these services during the years ended December 31, 2018 and 2017, respectively. Additionally, pursuant to the terms of the manufacture and supply agreement, we expect to sell substantially all remaining hemophilia related inventory to Bioverativ during the first quarter of 2019, when Bioverativ will assume full control over its manufacturing processes. Hemophilia related inventory on hand as of December 31, 2018, totals approximately $180.0 million.
Amounts earned under the non-manufacturing and supply related transaction service agreements are recorded as a reduction of costs and expenses in their respective expense line items. These amounts, which were primarily reflected as a reduction to selling, general and administrative expenses in our consolidated statements of income, were not significant for the years ended December 31, 2018 and 2017.
Hemophilia related product revenues reflected in our consolidated statements of income for the years ended December 31, 2017 and 2016, totaled $74.4 million and $846.9 million, respectively. Results for the year ended December 31, 2017, only reflect hemophilia-related product revenues through January 31, 2017.
Patents
Prior to the spin-off of our hemophilia business, we were awarded various methods of treatment and composition of matter patents related to ELOCTATE and ALPROLIX. Upon completion of the spin-off, these patents were transferred to the patent portfolio of Bioverativ.
BIOGEN INC. AND SUBSIDIARIESNOTES TO CONSOLIDATED FINANCIAL STATEMENTS — (Continued)
F- 28
4. Restructuring, Business Transformation and Other Cost Saving Initiatives
2017 Corporate Strategy
In October 2017, in connection with creating a leaner and simpler operating model, we approved a corporate restructuring program intended to streamline our operations and reallocate resources. We expect to make total non-recurring operating and capital expenditures of approximately $135.0 million in connection with this program and our goal is to redirect resources of up to $400.0 million annually by 2020 to prioritized research and development and other value creation opportunities.
For the years ended December 31, 2018 and 2017, we recognized charges of $22.9 million and $19.4 million, respectively, related to this effort, of which $12.0 million and $0.9 million, respectively, are reflected as restructuring charges and $10.9 million and $18.5 million, respectively, are included in selling, general and administrative expenses in our consolidated statements of income. These restructuring charges were primarily related to severance.
Restructuring charges incurred to date under this program have been substantially paid in cash as of December 31, 2018.
2016 Organizational Changes and Cost Saving Initiatives
2016 Restructuring Charges
During the third quarter of 2016 we initiated cost saving measures primarily intended to realign our organizational structure due to the changes in roles and workforce resulting from our decision to spin-off our hemophilia business, and to achieve further targeted cost reductions. For the year ended December 31, 2016, we recognized charges totaling $17.7 million related to this effort. These amounts, which were substantially incurred and paid by the end of 2016, were primarily related to severance and are reflected in restructuring charges in our consolidated statements of income.
Cambridge, MA Manufacturing Facility
In June 2016 following an evaluation of our current and future manufacturing capabilities and capacity needs, we decided to cease manufacturing and vacate our 67,000 square foot small-scale biologics manufacturing facility in Cambridge, MA and close and vacate our 46,000 square foot warehouse space in Somerville, MA.
In December 2016 we subleased our rights to the Cambridge, MA manufacturing facility to Brammer Bio MA, LLC (Brammer). Brammer also purchased from us certain manufacturing equipment, leasehold improvements and other assets in exchange for shares of Brammer common LLC interests and assumed manufacturing operations effective January 1, 2017. In December 2016 we closed and vacated our warehouse space in Somerville, MA.
Our departure from these facilities shortened the expected useful lives of certain leasehold improvements and other assets at these facilities. As a result, we recorded additional depreciation expense to reflect the assets' new shorter useful lives. For the year ended December 31, 2016, we recognized approximately $45.5 million of this additional depreciation, which was recorded as cost of sales in our consolidated statements of income.
In the fourth quarter of 2016 we also recognized charges totaling $7.4 million for severance costs related to certain employees separated from Biogen in connection with our departure from these facilities. These amounts were substantially incurred and paid by the end of first quarter of 2017 and are reflected in restructuring charges in our consolidated statements of income for the year ended December 31, 2016.
2015 Restructuring Charges
Restructuring charges for the year ended December 31, 2016, include $8.0 million of expense related to our 2015 restructuring program.
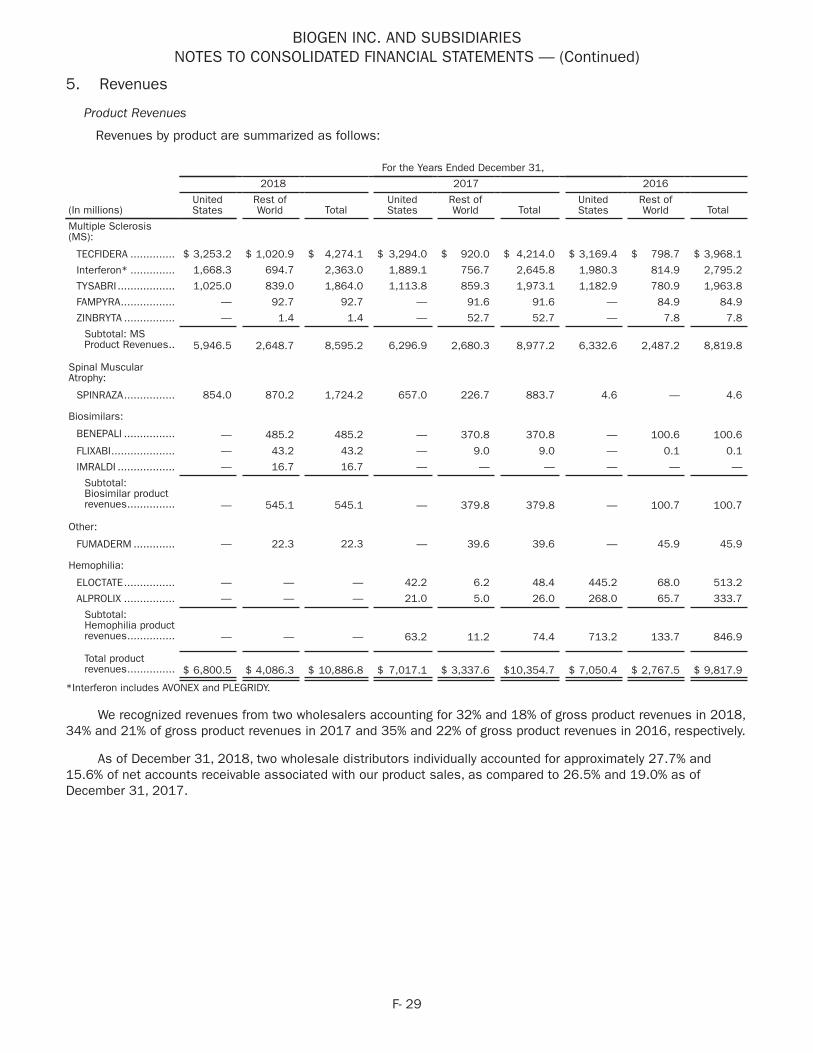
BIOGEN INC. AND SUBSIDIARIESNOTES TO CONSOLIDATED FINANCIAL STATEMENTS — (Continued)
F- 29
5. Revenues
Product Revenues
Revenues by product are summarized as follows:
For the Years Ended December 31,
2018 2017 2016
(In millions)UnitedStates
Rest ofWorld Total
UnitedStates
Rest ofWorld Total
UnitedStates
Rest ofWorld Total
Multiple Sclerosis(MS):
TECFIDERA .............. $ 3,253.2 $ 1,020.9 $ 4,274.1 $ 3,294.0 $ 920.0 $ 4,214.0 $ 3,169.4 $ 798.7 $ 3,968.1
Interferon* .............. 1,668.3 694.7 2,363.0 1,889.1 756.7 2,645.8 1,980.3 814.9 2,795.2
TYSABRI .................. 1,025.0 839.0 1,864.0 1,113.8 859.3 1,973.1 1,182.9 780.9 1,963.8
FAMPYRA................. — 92.7 92.7 — 91.6 91.6 — 84.9 84.9
ZINBRYTA ................ — 1.4 1.4 — 52.7 52.7 — 7.8 7.8
Subtotal: MSProduct Revenues.. 5,946.5 2,648.7 8,595.2 6,296.9 2,680.3 8,977.2 6,332.6 2,487.2 8,819.8
Spinal MuscularAtrophy:
SPINRAZA................ 854.0 870.2 1,724.2 657.0 226.7 883.7 4.6 — 4.6
Biosimilars:
BENEPALI ................ — 485.2 485.2 — 370.8 370.8 — 100.6 100.6
FLIXABI.................... — 43.2 43.2 — 9.0 9.0 — 0.1 0.1
IMRALDI .................. — 16.7 16.7 — — — — — —
Subtotal:Biosimilar productrevenues............... — 545.1 545.1 — 379.8 379.8 — 100.7 100.7
Other:
FUMADERM ............. — 22.3 22.3 — 39.6 39.6 — 45.9 45.9
Hemophilia:
ELOCTATE................ — — — 42.2 6.2 48.4 445.2 68.0 513.2
ALPROLIX ................ — — — 21.0 5.0 26.0 268.0 65.7 333.7
Subtotal:Hemophilia productrevenues............... — — — 63.2 11.2 74.4 713.2 133.7 846.9
Total productrevenues............... $ 6,800.5 $ 4,086.3 $ 10,886.8 $ 7,017.1 $ 3,337.6 $10,354.7 $ 7,050.4 $ 2,767.5 $ 9,817.9
*Interferon includes AVONEX and PLEGRIDY.
We recognized revenues from two wholesalers accounting for 32% and 18% of gross product revenues in 2018, 34% and 21% of gross product revenues in 2017 and 35% and 22% of gross product revenues in 2016, respectively.
As of December 31, 2018, two wholesale distributors individually accounted for approximately 27.7% and 15.6% of net accounts receivable associated with our product sales, as compared to 26.5% and 19.0% as of December 31, 2017.

BIOGEN INC. AND SUBSIDIARIESNOTES TO CONSOLIDATED FINANCIAL STATEMENTS — (Continued)
F- 30
An analysis of the change in reserves for discounts and allowances is summarized as follows:
(In millions) DiscountsContractualAdjustments Returns Total
2018Beginning balance ....................................................... $ 109.6 $ 606.0 $ 46.0 $ 761.6Current provisions relating to sales in current year....... 679.3 2,686.7 23.1 3,389.1Adjustments relating to prior years ............................. (0.3) (10.0) (1.8) (12.1)Payments/returns relating to sales in current year ....... (551.7) (1,887.6) (1.1) (2,440.4)Payments/returns relating to sales in prior years......... (109.1) (506.3) (31.5) (646.9)
Ending balance ........................................................... $ 127.8 $ 888.8 $ 34.7 $ 1,051.3
(In millions) DiscountsContractualAdjustments Returns Total
2017Beginning balance ....................................................... $ 71.6 $ 482.7 $ 51.2 $ 605.5Current provisions relating to sales in current year....... 583.0 2,307.4 26.9 2,917.3Adjustments relating to prior years ............................. (0.1) 15.0 (8.9) 6.0Payments/returns relating to sales in current year ....... (475.8) (1,756.9) (0.1) (2,232.8)Payments/returns relating to sales in prior years......... (69.1) (442.2) (23.1) (534.4)
Ending balance ........................................................... $ 109.6 $ 606.0 $ 46.0 $ 761.6
(In millions) DiscountsContractualAdjustments Returns Total
2016Beginning balance ....................................................... $ 56.1 $ 548.7 $ 57.9 $ 662.7Current provisions relating to sales in current year....... 592.6 2,044.5 30.9 2,668.0Adjustments relating to prior years ............................. (1.4) 1.5 (16.8) (16.7)Payments/returns relating to sales in current year ....... (522.5) (1,576.0) (1.0) (2,099.5)Payments/returns relating to sales in prior years......... (53.2) (536.0) (19.8) (609.0)
Ending balance ........................................................... $ 71.6 $ 482.7 $ 51.2 $ 605.5
The total reserves above, which are included in our consolidated balance sheets, are summarized as follows:
As of December 31,
(In millions) 2018 2017
Reduction of accounts receivable ................................................................. $ 176.6 $ 189.6Component of accrued expenses and other................................................... 874.7 572.0Total revenue-related reserves.................................................................... $ 1,051.3 $ 761.6
Revenues from Anti-CD20 Therapeutic Programs
Revenues from anti-CD20 therapeutic programs are summarized as follows:
For the Years Ended December 31,
(In millions) 2018 2017 2016
Biogen's share of pre-tax profits in the U.S. for RITUXANand GAZYVA, including the reimbursement of selling anddevelopment expenses .................................................... $ 1,431.9 $ 1,316.4 $ 1,249.5Other revenues from anti-CD20 therapeutic programs......... 548.3 242.8 65.0
Total revenues from anti-CD20 therapeutic programs.... $ 1,980.2 $ 1,559.2 $ 1,314.5
Approximately 15%, 13% and 11% of our total revenues in 2018, 2017 and 2016, respectively, are derived from our collaboration arrangements with Genentech. For additional information on our collaboration arrangements with Genentech, please read Note 19, Collaborative and Other Relationships, to these consolidated financial statements.
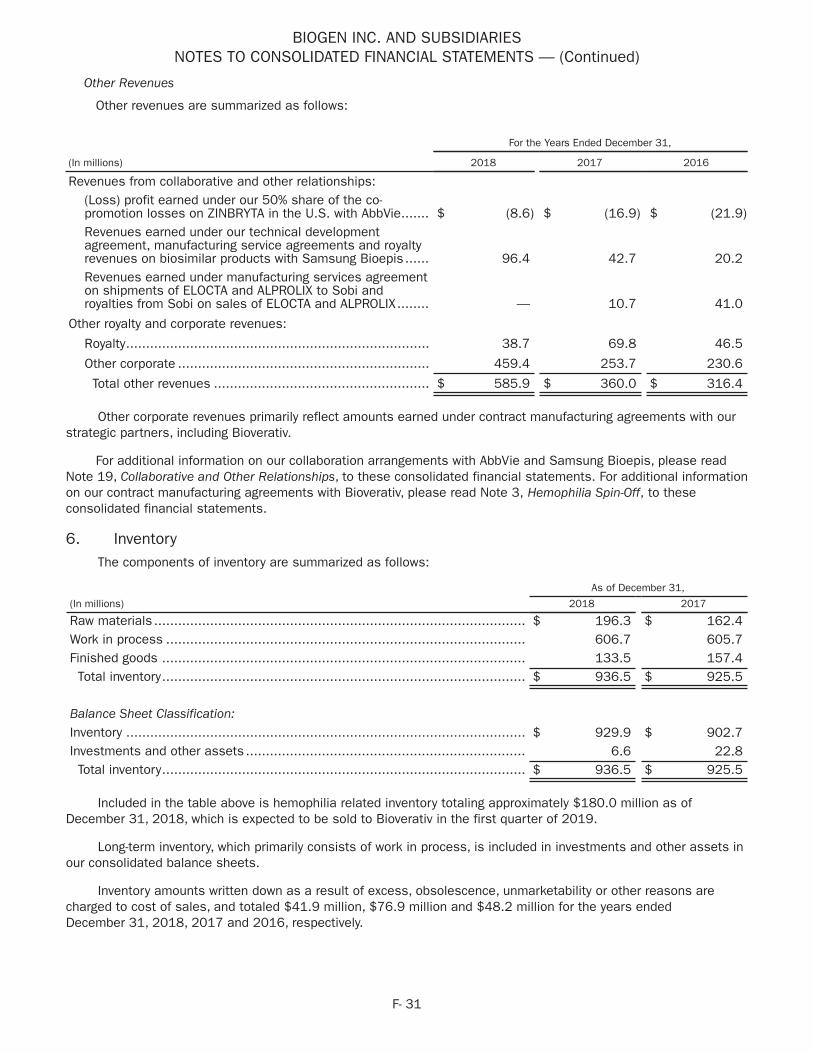
BIOGEN INC. AND SUBSIDIARIESNOTES TO CONSOLIDATED FINANCIAL STATEMENTS — (Continued)
F- 31
Other Revenues
Other revenues are summarized as follows:
For the Years Ended December 31,
(In millions) 2018 2017 2016
Revenues from collaborative and other relationships:(Loss) profit earned under our 50% share of the co-promotion losses on ZINBRYTA in the U.S. with AbbVie....... $ (8.6) $ (16.9) $ (21.9)Revenues earned under our technical developmentagreement, manufacturing service agreements and royaltyrevenues on biosimilar products with Samsung Bioepis ...... 96.4 42.7 20.2Revenues earned under manufacturing services agreementon shipments of ELOCTA and ALPROLIX to Sobi androyalties from Sobi on sales of ELOCTA and ALPROLIX........ — 10.7 41.0
Other royalty and corporate revenues:
Royalty............................................................................ 38.7 69.8 46.5
Other corporate ............................................................... 459.4 253.7 230.6
Total other revenues ...................................................... $ 585.9 $ 360.0 $ 316.4
Other corporate revenues primarily reflect amounts earned under contract manufacturing agreements with our strategic partners, including Bioverativ.
For additional information on our collaboration arrangements with AbbVie and Samsung Bioepis, please read Note 19, Collaborative and Other Relationships, to these consolidated financial statements. For additional information on our contract manufacturing agreements with Bioverativ, please read Note 3, Hemophilia Spin-Off, to these consolidated financial statements.
6. InventoryThe components of inventory are summarized as follows:
As of December 31,
(In millions) 2018 2017
Raw materials ............................................................................................. $ 196.3 $ 162.4Work in process .......................................................................................... 606.7 605.7Finished goods ........................................................................................... 133.5 157.4Total inventory........................................................................................... $ 936.5 $ 925.5
Balance Sheet Classification:Inventory .................................................................................................... $ 929.9 $ 902.7Investments and other assets ...................................................................... 6.6 22.8Total inventory........................................................................................... $ 936.5 $ 925.5
Included in the table above is hemophilia related inventory totaling approximately $180.0 million as of December 31, 2018, which is expected to be sold to Bioverativ in the first quarter of 2019.
Long-term inventory, which primarily consists of work in process, is included in investments and other assets in our consolidated balance sheets.
Inventory amounts written down as a result of excess, obsolescence, unmarketability or other reasons are charged to cost of sales, and totaled $41.9 million, $76.9 million and $48.2 million for the years ended December 31, 2018, 2017 and 2016, respectively.
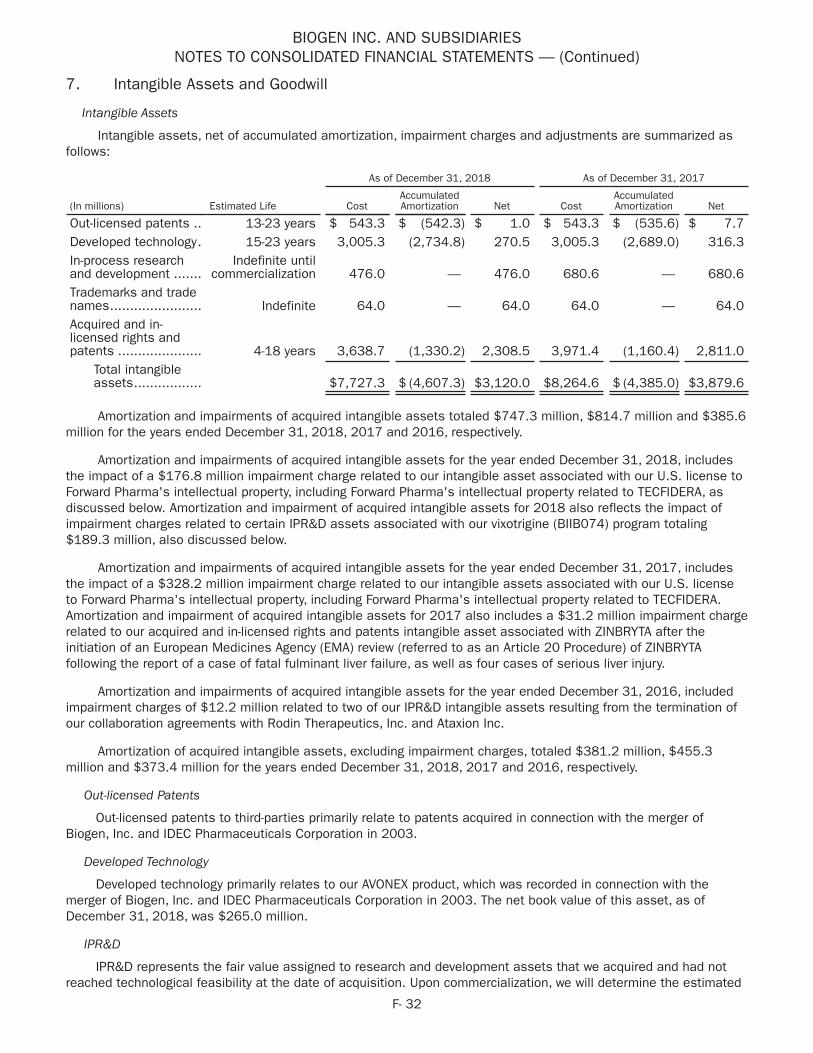
BIOGEN INC. AND SUBSIDIARIESNOTES TO CONSOLIDATED FINANCIAL STATEMENTS — (Continued)
F- 32
7. Intangible Assets and Goodwill
Intangible Assets
Intangible assets, net of accumulated amortization, impairment charges and adjustments are summarized as follows:
As of December 31, 2018 As of December 31, 2017
(In millions) Estimated Life CostAccumulatedAmortization Net Cost
AccumulatedAmortization Net
Out-licensed patents .. 13-23 years $ 543.3 $ (542.3) $ 1.0 $ 543.3 $ (535.6) $ 7.7Developed technology. 15-23 years 3,005.3 (2,734.8) 270.5 3,005.3 (2,689.0) 316.3In-process researchand development .......
Indefinite untilcommercialization 476.0 — 476.0 680.6 — 680.6
Trademarks and tradenames....................... Indefinite 64.0 — 64.0 64.0 — 64.0Acquired and in-licensed rights andpatents ..................... 4-18 years 3,638.7 (1,330.2) 2,308.5 3,971.4 (1,160.4) 2,811.0
Total intangibleassets................. $7,727.3 $ (4,607.3) $3,120.0 $8,264.6 $ (4,385.0) $3,879.6
Amortization and impairments of acquired intangible assets totaled $747.3 million, $814.7 million and $385.6 million for the years ended December 31, 2018, 2017 and 2016, respectively.
Amortization and impairments of acquired intangible assets for the year ended December 31, 2018, includes the impact of a $176.8 million impairment charge related to our intangible asset associated with our U.S. license to Forward Pharma's intellectual property, including Forward Pharma's intellectual property related to TECFIDERA, as discussed below. Amortization and impairment of acquired intangible assets for 2018 also reflects the impact of impairment charges related to certain IPR&D assets associated with our vixotrigine (BIIB074) program totaling $189.3 million, also discussed below.
Amortization and impairments of acquired intangible assets for the year ended December 31, 2017, includes the impact of a $328.2 million impairment charge related to our intangible assets associated with our U.S. license to Forward Pharma's intellectual property, including Forward Pharma's intellectual property related to TECFIDERA. Amortization and impairment of acquired intangible assets for 2017 also includes a $31.2 million impairment charge related to our acquired and in-licensed rights and patents intangible asset associated with ZINBRYTA after the initiation of an European Medicines Agency (EMA) review (referred to as an Article 20 Procedure) of ZINBRYTA following the report of a case of fatal fulminant liver failure, as well as four cases of serious liver injury.
Amortization and impairments of acquired intangible assets for the year ended December 31, 2016, included impairment charges of $12.2 million related to two of our IPR&D intangible assets resulting from the termination of our collaboration agreements with Rodin Therapeutics, Inc. and Ataxion Inc.
Amortization of acquired intangible assets, excluding impairment charges, totaled $381.2 million, $455.3 million and $373.4 million for the years ended December 31, 2018, 2017 and 2016, respectively.
Out-licensed Patents
Out-licensed patents to third-parties primarily relate to patents acquired in connection with the merger of Biogen, Inc. and IDEC Pharmaceuticals Corporation in 2003.
Developed Technology
Developed technology primarily relates to our AVONEX product, which was recorded in connection with the merger of Biogen, Inc. and IDEC Pharmaceuticals Corporation in 2003. The net book value of this asset, as of December 31, 2018, was $265.0 million.
IPR&D
IPR&D represents the fair value assigned to research and development assets that we acquired and had not reached technological feasibility at the date of acquisition. Upon commercialization, we will determine the estimated

BIOGEN INC. AND SUBSIDIARIESNOTES TO CONSOLIDATED FINANCIAL STATEMENTS — (Continued)
F- 33
useful life and amortize these amounts based upon an economic consumption method. The carrying value associated with our IPR&D assets as of December 31, 2018 and 2017, relates to the various IPR&D programs we acquired in connection with our acquisitions of Convergence Pharmaceuticals (Convergence), Stromedix Inc. (Stromedix) and Biogen International Neuroscience GmbH (BIN) in 2015, 2012 and 2010, respectively. IPR&D balances include adjustments related to foreign currency exchange rate fluctuations.
An analysis of anticipated lifetime revenues and anticipated development costs is performed annually during our long-range planning cycle, which was most recently updated in the third quarter of 2018. This analysis is based upon certain assumptions that we evaluate on a periodic basis, including anticipated future product sales, the expected impact of changes in the amount of development costs and the probabilities of our programs succeeding, the introduction of new products by our competitors and changes in our commercial and pipeline product candidates.
Vixotrigine
During the third quarter of 2018 we completed a Phase 2b study of vixotrigine for the treatment of painful lumbosacral radiculopathy (PLSR). The study did not meet its primary or secondary efficacy endpoints; therefore, we discontinued development of vixotrigine for the treatment of PLSR and we recognized an impairment charge of approximately $60.0 million during the third quarter of 2018 to reduce the fair value of the related IPR&D intangible asset to zero. In addition, we delayed the initiation of the Phase 3 studies of vixotrigine for the treatment of TGN as we awaited the outcome of ongoing interactions with the FDA regarding the design of the Phase 3 studies, a more detailed review of the data from the Phase 2b study of vixotrigine for the treatment of PLSR and insights from the Phase 2 study of vixotrigine for the treatment of small fiber neuropathy. We reassessed the fair value of our vixotrigine program for the treatment of TGN using reduced expected lifetime revenues, higher expected clinical development costs and lower cumulative probabilities of success, and, as a result of that assessment, we recognized an impairment charge of $129.3 million during the third quarter of 2018 to reduce the fair value of the IPR&D intangible asset associated with our vixotrigine program for the treatment of TGN to $41.8 million.
In late December 2018 we received feedback from the FDA regarding the design of the Phase 3 vixotrigine program for the treatment of TGN. Following this feedback, we are now planning to initiate the Phase 3 vixotrigine program for the treatment of TGN.
The IPR&D impairment charges that resulted from the developments in our vixotrigine program for the treatment of TGN, as discussed above, were included in amortization and impairment of acquired intangible assets. The fair value of the intangible assets were based on a probability-adjusted discounted cash flow calculation using Level 3 fair value measurements and inputs including estimated revenues, costs and probabilities of success.
We may recognize additional impairment charges in the future depending upon our ability to advance vixotrigine for the treatment of TGN or other indications.
Acquired and In-licensed Rights and Patents
Acquired and in-licensed rights and patents primarily relate to our acquisition of all remaining rights to TYSABRI from Elan. Acquired and in-licensed rights and patents also includes our U.S and rest of world licenses to Forward Pharma's intellectual property, including Forward Pharma's intellectual property related to TECFIDERA, as discussed below, and other amounts related to our other marketed products and other programs acquired through business combinations. The net book value of the TYSABRI asset as of December 31, 2018, was $2,027.1 million.
TECFIDERA License Rights
In January 2017 we entered into a settlement and license agreement among Biogen Swiss Manufacturing GmbH, Biogen International Holding Ltd., Forward Pharma and certain related parties, which was effective as of February 1, 2017. Pursuant to this agreement, we obtained U.S. and rest of world licenses to Forward Pharma's intellectual property, including Forward Pharma's intellectual property related to TECFIDERA. In exchange, we paid Forward Pharma $1.25 billion in cash, of which $795.2 million was recorded within intangible assets in the first quarter of 2017.
We have two intellectual property disputes with Forward Pharma, one in the U.S. and one in the E.U., concerning intellectual property related to TECFIDERA.
In March 2017 the U.S. intellectual property dispute was decided in our favor. Forward Pharma appealed to the U.S. Court of Appeals for the Federal Circuit. We evaluated the recoverability of the U.S. asset acquired from Forward Pharma and recorded a $328.2 million impairment charge in the first quarter of 2017 to adjust the carrying value of
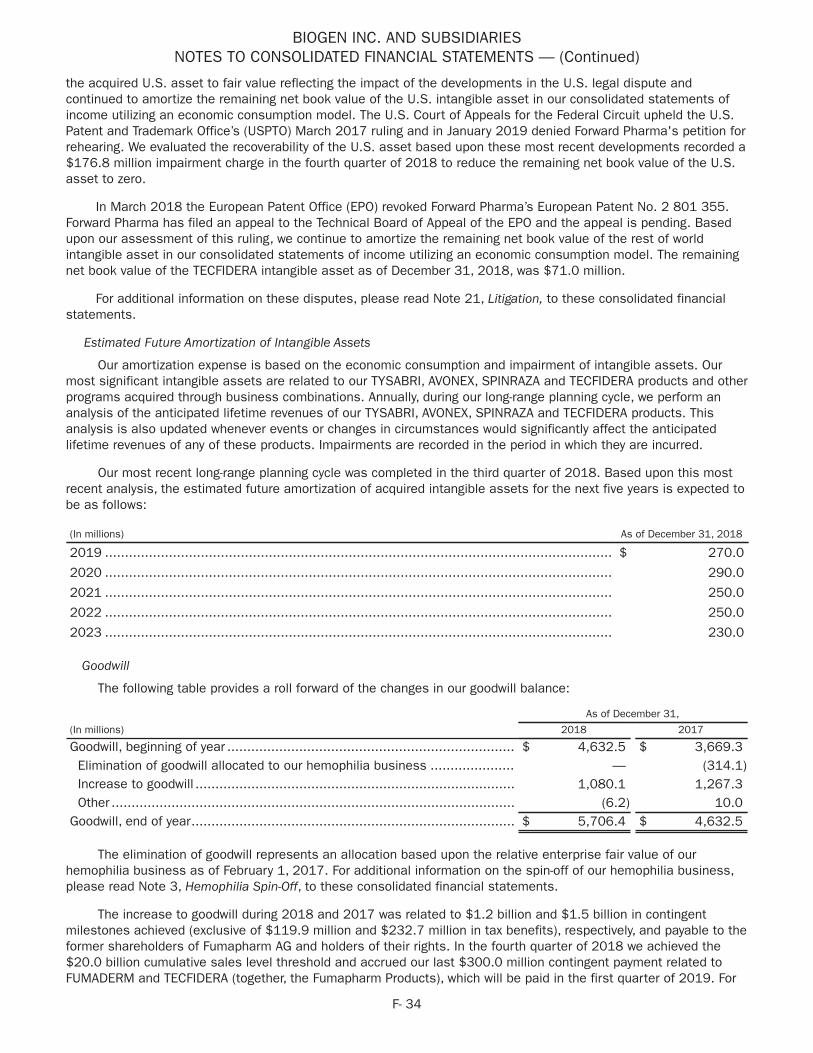
BIOGEN INC. AND SUBSIDIARIESNOTES TO CONSOLIDATED FINANCIAL STATEMENTS — (Continued)
F- 34
the acquired U.S. asset to fair value reflecting the impact of the developments in the U.S. legal dispute and continued to amortize the remaining net book value of the U.S. intangible asset in our consolidated statements of income utilizing an economic consumption model. The U.S. Court of Appeals for the Federal Circuit upheld the U.S. Patent and Trademark Office’s (USPTO) March 2017 ruling and in January 2019 denied Forward Pharma's petition for rehearing. We evaluated the recoverability of the U.S. asset based upon these most recent developments recorded a $176.8 million impairment charge in the fourth quarter of 2018 to reduce the remaining net book value of the U.S. asset to zero.
In March 2018 the European Patent Office (EPO) revoked Forward Pharma’s European Patent No. 2 801 355. Forward Pharma has filed an appeal to the Technical Board of Appeal of the EPO and the appeal is pending. Based upon our assessment of this ruling, we continue to amortize the remaining net book value of the rest of world intangible asset in our consolidated statements of income utilizing an economic consumption model. The remaining net book value of the TECFIDERA intangible asset as of December 31, 2018, was $71.0 million.
For additional information on these disputes, please read Note 21, Litigation, to these consolidated financial statements.
Estimated Future Amortization of Intangible Assets
Our amortization expense is based on the economic consumption and impairment of intangible assets. Our most significant intangible assets are related to our TYSABRI, AVONEX, SPINRAZA and TECFIDERA products and other programs acquired through business combinations. Annually, during our long-range planning cycle, we perform an analysis of the anticipated lifetime revenues of our TYSABRI, AVONEX, SPINRAZA and TECFIDERA products. This analysis is also updated whenever events or changes in circumstances would significantly affect the anticipated lifetime revenues of any of these products. Impairments are recorded in the period in which they are incurred.
Our most recent long-range planning cycle was completed in the third quarter of 2018. Based upon this most recent analysis, the estimated future amortization of acquired intangible assets for the next five years is expected to be as follows:
(In millions) As of December 31, 2018
2019 ............................................................................................................................... $ 270.0
2020 ............................................................................................................................... 290.0
2021 ............................................................................................................................... 250.0
2022 ............................................................................................................................... 250.0
2023 ............................................................................................................................... 230.0
Goodwill
The following table provides a roll forward of the changes in our goodwill balance:
As of December 31,
(In millions) 2018 2017
Goodwill, beginning of year ........................................................................ $ 4,632.5 $ 3,669.3Elimination of goodwill allocated to our hemophilia business ..................... — (314.1)Increase to goodwill ................................................................................ 1,080.1 1,267.3Other ..................................................................................................... (6.2) 10.0
Goodwill, end of year................................................................................. $ 5,706.4 $ 4,632.5
The elimination of goodwill represents an allocation based upon the relative enterprise fair value of our hemophilia business as of February 1, 2017. For additional information on the spin-off of our hemophilia business, please read Note 3, Hemophilia Spin-Off, to these consolidated financial statements.
The increase to goodwill during 2018 and 2017 was related to $1.2 billion and $1.5 billion in contingent milestones achieved (exclusive of $119.9 million and $232.7 million in tax benefits), respectively, and payable to the former shareholders of Fumapharm AG and holders of their rights. In the fourth quarter of 2018 we achieved the $20.0 billion cumulative sales level threshold and accrued our last $300.0 million contingent payment related to FUMADERM and TECFIDERA (together, the Fumapharm Products), which will be paid in the first quarter of 2019. For

BIOGEN INC. AND SUBSIDIARIESNOTES TO CONSOLIDATED FINANCIAL STATEMENTS — (Continued)
F- 35
additional information on contingent payments to the former shareholders of Fumapharm AG and holders of their rights, please read Note 22, Commitments and Contingencies, to these consolidated financial statements.
Other includes changes related to foreign currency exchange rate fluctuations. As of December 31, 2018, we had no accumulated impairment losses related to goodwill.
8. Fair Value Measurements
The tables below present information about our assets and liabilities that are regularly measured and carried at fair value and indicate the level within the fair value hierarchy of the valuation techniques we utilized to determine such fair value:
As of December 31, 2018 (In millions) Total
QuotedPrices inActive
Markets(Level 1)
SignificantOther
ObservableInputs
(Level 2)
SignificantUnobservable
Inputs(Level 3)
Assets:Cash equivalents ............................................. $ 705.5 $ — $ 705.5 $ —Marketable debt securities:
Corporate debt securities.............................. 2,459.2 — 2,459.2 —Government securities.................................. 969.6 — 969.6 —Mortgage and other asset backed securities .. 260.5 — 260.5 —
Marketable equity securities ............................. 615.4 51.7 563.7 —Derivative contracts.......................................... 66.9 — 66.9 —Plan assets for deferred compensation.............. 25.4 — 25.4 —
Total........................................................ $ 5,102.5 $ 51.7 $ 5,050.8 $ —Liabilities:Derivative contracts.......................................... $ 24.6 $ — $ 24.6 $ —Contingent consideration obligations ................. 409.8 — — 409.8
Total........................................................ $ 434.4 $ — $ 24.6 $ 409.8
As of December 31, 2017 (In millions) Total
QuotedPrices
in ActiveMarkets(Level 1)
SignificantOther
ObservableInputs
(Level 2)
SignificantUnobservable
Inputs(Level 3)
Assets:Cash equivalents ............................................. $ 1,229.4 $ — $ 1,229.4 $ —Marketable debt securities:
Corporate debt securities.............................. 2,609.8 — 2,609.8 —Government securities.................................. 1,919.3 — 1,919.3 —Mortgage and other asset backed securities .. 643.4 — 643.4 —
Marketable equity securities ............................. 11.8 11.8 — —Derivative contracts.......................................... 2.7 — 2.7 —Plan assets for deferred compensation.............. 28.5 — 28.5 —
Total........................................................ $ 6,444.9 $ 11.8 $ 6,433.1 $ —Liabilities:Derivative contracts.......................................... $ 111.3 $ — $ 111.3 $ —Contingent consideration obligations ................. 523.6 — — 523.6
Total........................................................ $ 634.9 $ — $ 111.3 $ 523.6
There have been no changes in valuation techniques or transfers between fair value measurement levels during the years ended December 31, 2018 and 2017. The fair value of Level 2 instruments classified as cash equivalents, marketable debt securities and our marketable equity security investment in Ionis Pharmaceuticals, Inc. (Ionis) were determined through third-party pricing services or an option pricing valuation model. For additional information on our

BIOGEN INC. AND SUBSIDIARIESNOTES TO CONSOLIDATED FINANCIAL STATEMENTS — (Continued)
F- 36
new agreement with Ionis, please read Note 19, Collaborative and Other Relationships, to these consolidated financial statements. For a description of our validation procedures related to prices provided by third-party pricing services and our option pricing valuation model, please read Note 1, Summary of Significant Accounting Policies - Fair Value Measurements, to these consolidated financial statements.
Debt Instruments
The fair values of our debt instruments, which are Level 2 liabilities, are summarized as follows:
As of December 31,
(In millions) 2018 2017
Notes payable to Fumedica AG................................................................... $ — $ 3.22.900% Senior Notes due September 15, 2020.......................................... 1,489.5 1,517.73.625% Senior Notes due September 15, 2022.......................................... 1,000.4 1,032.94.050% Senior Notes due September 15, 2025.......................................... 1,745.1 1,851.95.200% Senior Notes due September 15, 2045.......................................... 1,802.6 2,077.6Total ...................................................................................................... $ 6,037.6 $ 6,483.3
In connection with our 2006 distribution agreement with Fumedica AG, we issued notes totaling 61.4 million Swiss Francs that were payable to Fumedica AG in varying amounts from June 2008 through June 2018. In June 2018 we redeemed our remaining note payable to Fumedica AG.
The fair value of our notes payable to Fumedica AG, as of December 31, 2017, was estimated using market observable inputs, including current interest and foreign currency exchange rates. The fair value for each series of our Senior Notes was determined through market, observable and corroborated sources. For additional information on our debt instruments, please read Note 12, Indebtedness, to these consolidated financial statements.
Contingent Consideration Obligations
In connection with our acquisitions of Convergence, Stromedix and BIN in 2015, 2012 and 2010, respectively, we agreed to make additional payments based upon the achievement of certain milestone events. The following table provides a roll forward of the fair values of our contingent consideration obligations, which includes Level 3 measurements:
As of December 31,
(In millions) 2018 2017
Fair value, beginning of year....................................................................... $ 523.6 $ 467.6Changes in fair value............................................................................... (12.3) 62.7Payments and other ................................................................................ (101.5) (6.7)
Fair value, end of year ............................................................................... $ 409.8 $ 523.6
As of December 31, 2018 and 2017, approximately $265.0 million and $279.0 million, respectively, of the fair value of our total contingent consideration obligations was reflected as a component of other long-term liabilities in our consolidated balance sheets with the remaining balance reflected as a component of accrued expenses and other.
For the year ended December 31, 2018, changes in the fair value of our contingent consideration obligations were primarily due to delays in the expected timing of achievement of milestones related to our vixotrigine program for the treatment of TGN and an increase in discount rates used to revalue our contingent consideration liabilities, partially offset by the passage of time. For the year ended December 31, 2018, payments and other reflects a $81.5 million milestone payment made to the former shareholders of Stromedix, as discussed below. For additional information on our IPR&D intangible asset related to our vixotrigine program for the treatment of TGN, please read Note 7, Intangible Assets and Goodwill, to these consolidated financial statements.
For the year ended December 31, 2017, changes in the fair value of our contingent consideration obligations are primarily due to changes in the expected timing and probabilities of success related to the achievement of certain development milestones and changes in the discount rate.

BIOGEN INC. AND SUBSIDIARIESNOTES TO CONSOLIDATED FINANCIAL STATEMENTS — (Continued)
F- 37
The fair values of the intangible assets and contingent consideration liabilities were based on a probability-adjusted discounted cash flow calculation using Level 3 fair value measurements and inputs including estimated revenues and probabilities of success. For additional information on the valuation techniques and inputs utilized in the valuation of our financial assets and liabilities, please read Note 1, Summary of Significant Accounting Policies, to these consolidated financial statements.
Convergence Pharmaceuticals Ltd.
In connection with our acquisition of Convergence in February 2015 we recorded a contingent consideration obligation of $274.5 million. This valuation was based on probability weighted net cash outflow projections of $450.0 million, discounted using a rate of 2.0%, which was the estimated cost of debt financing for market participants. This liability reflected the revised estimate from the date of acquisition for our initial clinical development plans, resulting probabilities of success and the timing of certain milestone payments.
As of December 31, 2018 and 2017, the fair value of this contingent consideration obligation was $246.6 million and $259.0 million, respectively. Our most recent valuation was determined based upon net cash flow projections of $400.0 million, probability weighted and discounted using a rate of 3.6%, which is a measure of the credit risk associated with settling the liability.
For 2018 compared to 2017, the net decrease in our contingent consideration obligation was primarily due to delays in the expected timing of achievement of milestones related to our vixotrigine program for the treatment of TGN and an increase in discount rates used to revalue our contingent consideration liabilities, partially offset by the passage of time. Accrued expenses and other in our consolidated balance sheets include $144.8 million as we expect to make the payment within one year.
Stromedix Inc.
In connection with our acquisition of Stromedix in March 2012 we recorded a contingent consideration obligation of $122.2 million. As of December 31, 2018 and 2017, the fair value of this contingent consideration obligation was $83.0 million and $162.4 million, respectively. Our most recent valuation was determined based upon net cash outflow projections of $306.5 million, probability weighted and discounted using a rate of 3.6%, which is a measure of the credit risk associated with settling the liability.
For 2018 compared to 2017, the net decrease in our contingent consideration obligation was primarily due to a $81.5 million milestone paid to the former shareholders of Stromedix as we dosed our first patient in the Phase 2b study of BG00011 (STX-100) in idiopathic pulmonary fibrosis in September 2018, changes in the expected timing related to the achievement of certain remaining developmental milestones and an increase in discount rates, partially offset by the passage of time. No amounts are reflected as a current liability in our consolidated balance sheets as we do not expect to make a payment in the next year.
Biogen Idec International Neuroscience GmbH
In connection with our acquisition of BIN in December 2010 we recorded a contingent consideration obligation of $81.2 million. As of December 31, 2018 and 2017, the fair value of this contingent consideration obligation was $80.2 million and $102.2 million, respectively. Our most recent valuation was determined based upon net cash outflow projections of $335.0 million, probability weighted and discounted using a rate of 3.8%, which is a measure of the credit risk associated with settling the liability.
For 2018 compared to 2017, the net decrease in our contingent consideration obligation was primarily due to a $20.0 million development milestone paid in the first quarter of 2018 as we dosed our first patient in our Phase 2 SPARK study of BIIB054 ( -synuclein mAb) in Parkinson's disease in January 2018 and an increase in discount rates, partially offset by the passage of time. No amounts are reflected as a current liability in our consolidated balance sheets as we do not expect to make a payment in the next year.
Acquired IPR&D
In connection with our acquisition of Convergence, we also allocated $424.6 million of the total purchase price to acquired IPR&D, which was capitalized as an intangible asset. The amount allocated to acquired IPR&D was based on significant inputs not observable in the market and thus represented a Level 3 fair value measurement. These assets will be tested for impairment annually until commercialization, after which time the acquired IPR&D will be amortized over its estimated useful life using the economic consumption method. During the third quarter of 2018 we recognized impairment charges related to certain IPR&D assets associated with our vixotrigine program totaling
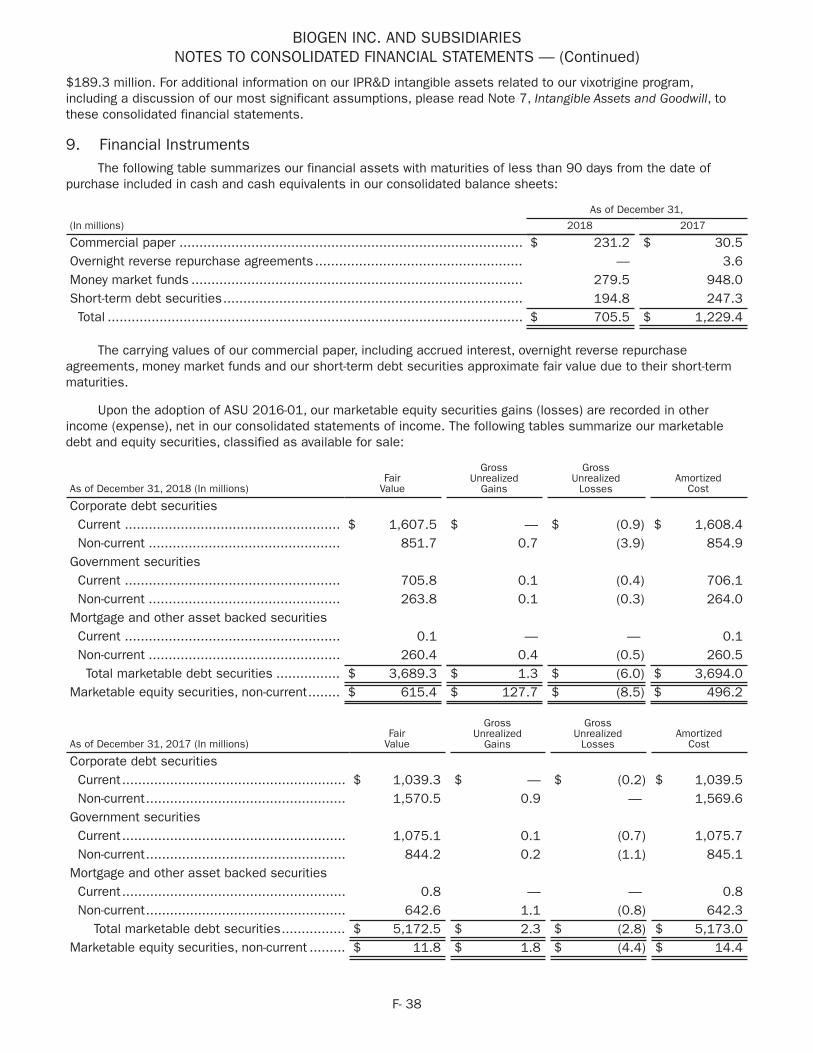
BIOGEN INC. AND SUBSIDIARIESNOTES TO CONSOLIDATED FINANCIAL STATEMENTS — (Continued)
F- 38
$189.3 million. For additional information on our IPR&D intangible assets related to our vixotrigine program, including a discussion of our most significant assumptions, please read Note 7, Intangible Assets and Goodwill, to these consolidated financial statements.
9. Financial InstrumentsThe following table summarizes our financial assets with maturities of less than 90 days from the date of
purchase included in cash and cash equivalents in our consolidated balance sheets:
As of December 31,
(In millions) 2018 2017
Commercial paper ...................................................................................... $ 231.2 $ 30.5Overnight reverse repurchase agreements.................................................... — 3.6Money market funds ................................................................................... 279.5 948.0Short-term debt securities........................................................................... 194.8 247.3
Total ........................................................................................................ $ 705.5 $ 1,229.4
The carrying values of our commercial paper, including accrued interest, overnight reverse repurchase agreements, money market funds and our short-term debt securities approximate fair value due to their short-term maturities.
Upon the adoption of ASU 2016-01, our marketable equity securities gains (losses) are recorded in other income (expense), net in our consolidated statements of income. The following tables summarize our marketable debt and equity securities, classified as available for sale:
As of December 31, 2018 (In millions)Fair
Value
GrossUnrealized
Gains
GrossUnrealized
LossesAmortized
Cost
Corporate debt securitiesCurrent ...................................................... $ 1,607.5 $ — $ (0.9) $ 1,608.4Non-current ................................................ 851.7 0.7 (3.9) 854.9
Government securitiesCurrent ...................................................... 705.8 0.1 (0.4) 706.1Non-current ................................................ 263.8 0.1 (0.3) 264.0
Mortgage and other asset backed securitiesCurrent ...................................................... 0.1 — — 0.1Non-current ................................................ 260.4 0.4 (0.5) 260.5
Total marketable debt securities ................ $ 3,689.3 $ 1.3 $ (6.0) $ 3,694.0Marketable equity securities, non-current........ $ 615.4 $ 127.7 $ (8.5) $ 496.2
As of December 31, 2017 (In millions)Fair
Value
GrossUnrealized
Gains
GrossUnrealized
LossesAmortized
Cost
Corporate debt securitiesCurrent........................................................ $ 1,039.3 $ — $ (0.2) $ 1,039.5Non-current.................................................. 1,570.5 0.9 — 1,569.6
Government securitiesCurrent........................................................ 1,075.1 0.1 (0.7) 1,075.7Non-current.................................................. 844.2 0.2 (1.1) 845.1
Mortgage and other asset backed securitiesCurrent........................................................ 0.8 — — 0.8Non-current.................................................. 642.6 1.1 (0.8) 642.3
Total marketable debt securities................ $ 5,172.5 $ 2.3 $ (2.8) $ 5,173.0Marketable equity securities, non-current ......... $ 11.8 $ 1.8 $ (4.4) $ 14.4
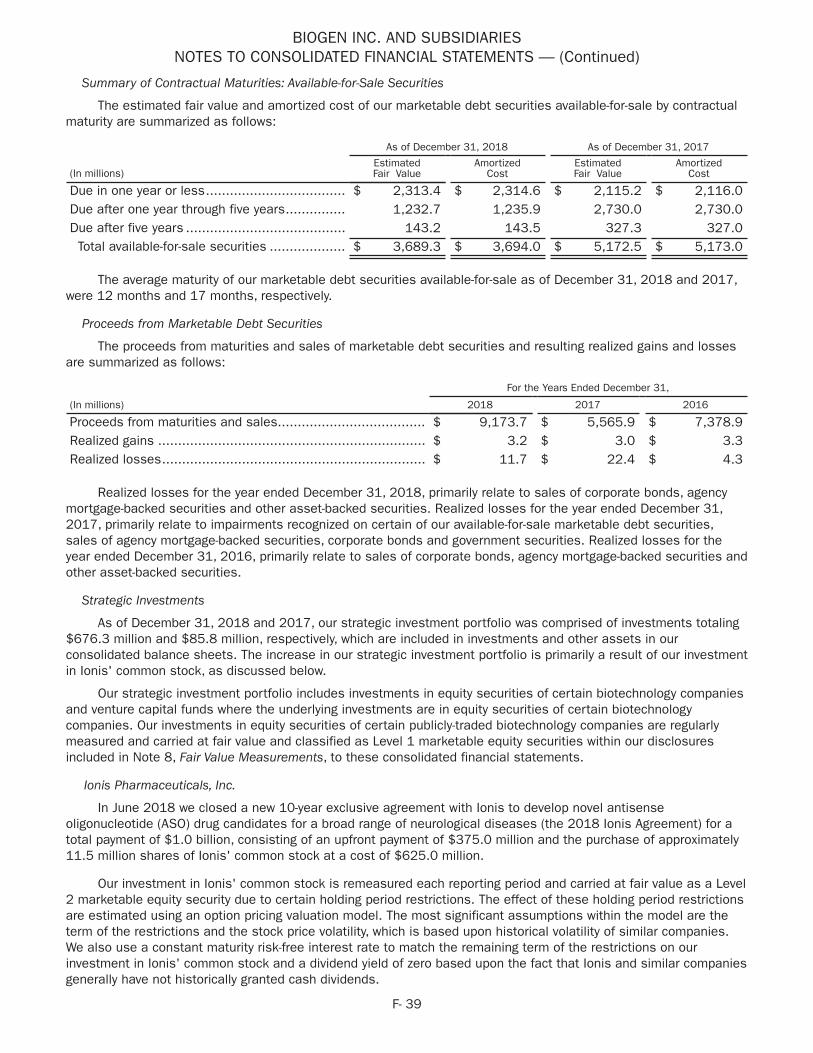
BIOGEN INC. AND SUBSIDIARIESNOTES TO CONSOLIDATED FINANCIAL STATEMENTS — (Continued)
F- 39
Summary of Contractual Maturities: Available-for-Sale Securities
The estimated fair value and amortized cost of our marketable debt securities available-for-sale by contractual maturity are summarized as follows:
As of December 31, 2018 As of December 31, 2017
(In millions)EstimatedFair Value
AmortizedCost
EstimatedFair Value
AmortizedCost
Due in one year or less................................... $ 2,313.4 $ 2,314.6 $ 2,115.2 $ 2,116.0Due after one year through five years............... 1,232.7 1,235.9 2,730.0 2,730.0Due after five years ........................................ 143.2 143.5 327.3 327.0Total available-for-sale securities ................... $ 3,689.3 $ 3,694.0 $ 5,172.5 $ 5,173.0
The average maturity of our marketable debt securities available-for-sale as of December 31, 2018 and 2017, were 12 months and 17 months, respectively.
Proceeds from Marketable Debt Securities
The proceeds from maturities and sales of marketable debt securities and resulting realized gains and losses are summarized as follows:
For the Years Ended December 31,
(In millions) 2018 2017 2016
Proceeds from maturities and sales..................................... $ 9,173.7 $ 5,565.9 $ 7,378.9Realized gains ................................................................... $ 3.2 $ 3.0 $ 3.3Realized losses.................................................................. $ 11.7 $ 22.4 $ 4.3
Realized losses for the year ended December 31, 2018, primarily relate to sales of corporate bonds, agency mortgage-backed securities and other asset-backed securities. Realized losses for the year ended December 31, 2017, primarily relate to impairments recognized on certain of our available-for-sale marketable debt securities, sales of agency mortgage-backed securities, corporate bonds and government securities. Realized losses for the year ended December 31, 2016, primarily relate to sales of corporate bonds, agency mortgage-backed securities and other asset-backed securities.
Strategic Investments
As of December 31, 2018 and 2017, our strategic investment portfolio was comprised of investments totaling $676.3 million and $85.8 million, respectively, which are included in investments and other assets in our consolidated balance sheets. The increase in our strategic investment portfolio is primarily a result of our investment in Ionis' common stock, as discussed below.
Our strategic investment portfolio includes investments in equity securities of certain biotechnology companies and venture capital funds where the underlying investments are in equity securities of certain biotechnology companies. Our investments in equity securities of certain publicly-traded biotechnology companies are regularly measured and carried at fair value and classified as Level 1 marketable equity securities within our disclosures included in Note 8, Fair Value Measurements, to these consolidated financial statements.
Ionis Pharmaceuticals, Inc.
In June 2018 we closed a new 10-year exclusive agreement with Ionis to develop novel antisense oligonucleotide (ASO) drug candidates for a broad range of neurological diseases (the 2018 Ionis Agreement) for a total payment of $1.0 billion, consisting of an upfront payment of $375.0 million and the purchase of approximately 11.5 million shares of Ionis' common stock at a cost of $625.0 million.
Our investment in Ionis' common stock is remeasured each reporting period and carried at fair value as a Level 2 marketable equity security due to certain holding period restrictions. The effect of these holding period restrictions are estimated using an option pricing valuation model. The most significant assumptions within the model are the term of the restrictions and the stock price volatility, which is based upon historical volatility of similar companies. We also use a constant maturity risk-free interest rate to match the remaining term of the restrictions on our investment in Ionis' common stock and a dividend yield of zero based upon the fact that Ionis and similar companies generally have not historically granted cash dividends.
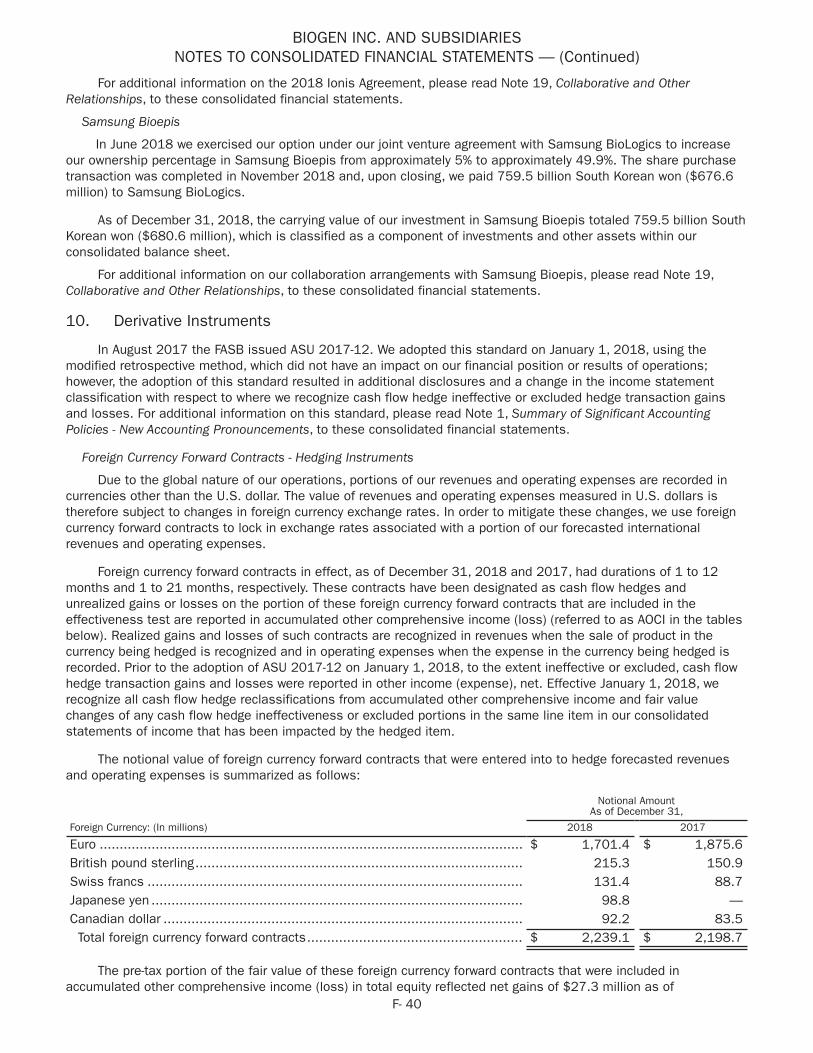
BIOGEN INC. AND SUBSIDIARIESNOTES TO CONSOLIDATED FINANCIAL STATEMENTS — (Continued)
F- 40
For additional information on the 2018 Ionis Agreement, please read Note 19, Collaborative and Other Relationships, to these consolidated financial statements.
Samsung Bioepis
In June 2018 we exercised our option under our joint venture agreement with Samsung BioLogics to increase our ownership percentage in Samsung Bioepis from approximately 5% to approximately 49.9%. The share purchase transaction was completed in November 2018 and, upon closing, we paid 759.5 billion South Korean won ($676.6 million) to Samsung BioLogics.
As of December 31, 2018, the carrying value of our investment in Samsung Bioepis totaled 759.5 billion South Korean won ($680.6 million), which is classified as a component of investments and other assets within our consolidated balance sheet.
For additional information on our collaboration arrangements with Samsung Bioepis, please read Note 19, Collaborative and Other Relationships, to these consolidated financial statements.
10. Derivative Instruments
In August 2017 the FASB issued ASU 2017-12. We adopted this standard on January 1, 2018, using the modified retrospective method, which did not have an impact on our financial position or results of operations; however, the adoption of this standard resulted in additional disclosures and a change in the income statement classification with respect to where we recognize cash flow hedge ineffective or excluded hedge transaction gains and losses. For additional information on this standard, please read Note 1, Summary of Significant Accounting Policies - New Accounting Pronouncements, to these consolidated financial statements.
Foreign Currency Forward Contracts - Hedging Instruments
Due to the global nature of our operations, portions of our revenues and operating expenses are recorded in currencies other than the U.S. dollar. The value of revenues and operating expenses measured in U.S. dollars is therefore subject to changes in foreign currency exchange rates. In order to mitigate these changes, we use foreign currency forward contracts to lock in exchange rates associated with a portion of our forecasted international revenues and operating expenses.
Foreign currency forward contracts in effect, as of December 31, 2018 and 2017, had durations of 1 to 12 months and 1 to 21 months, respectively. These contracts have been designated as cash flow hedges and unrealized gains or losses on the portion of these foreign currency forward contracts that are included in the effectiveness test are reported in accumulated other comprehensive income (loss) (referred to as AOCI in the tables below). Realized gains and losses of such contracts are recognized in revenues when the sale of product in the currency being hedged is recognized and in operating expenses when the expense in the currency being hedged is recorded. Prior to the adoption of ASU 2017-12 on January 1, 2018, to the extent ineffective or excluded, cash flow hedge transaction gains and losses were reported in other income (expense), net. Effective January 1, 2018, we recognize all cash flow hedge reclassifications from accumulated other comprehensive income and fair value changes of any cash flow hedge ineffectiveness or excluded portions in the same line item in our consolidated statements of income that has been impacted by the hedged item.
The notional value of foreign currency forward contracts that were entered into to hedge forecasted revenues and operating expenses is summarized as follows:
Notional Amount
As of December 31,
Foreign Currency: (In millions) 2018 2017
Euro .......................................................................................................... $ 1,701.4 $ 1,875.6British pound sterling.................................................................................. 215.3 150.9Swiss francs .............................................................................................. 131.4 88.7Japanese yen ............................................................................................. 98.8 —Canadian dollar .......................................................................................... 92.2 83.5Total foreign currency forward contracts...................................................... $ 2,239.1 $ 2,198.7
The pre-tax portion of the fair value of these foreign currency forward contracts that were included in accumulated other comprehensive income (loss) in total equity reflected net gains of $27.3 million as of

BIOGEN INC. AND SUBSIDIARIESNOTES TO CONSOLIDATED FINANCIAL STATEMENTS — (Continued)
F- 41
December 31, 2018, net losses of $113.0 million as of December 31, 2017, and net gains of $49.8 million as of December 31, 2016. We expect the net gains of $27.3 million to be settled over the next 12 months, with any amounts in accumulated other comprehensive income (loss) to be reported as an adjustment to revenues or operating expenses. We consider the impact of our and our counterparties’ credit risk on the fair value of the contracts as well as the ability of each party to execute its contractual obligations. As of December 31, 2018 and 2017, credit risk did not change the fair value of our foreign currency forward contracts.
The following tables summarize the effect of foreign currency forward contracts designated as hedging instruments in our consolidated statements of income:
For the Year Ended December 31,
Net Gains/(Losses)Reclassified from AOCI into Operating Income (in millions)
Net Gains/(Losses)Recognized in Operating Income (in millions)
Location 2018 Location 2018
Revenues........................................ $ (42.5) Revenues ........................................ $ 10.8Operating expenses......................... $ 0.2 Operating expenses ......................... $ (0.1)
For the Years Ended December 31,
Net Gains/(Losses)Reclassified from AOCI into Operating Income (in millions)
Net Gains/(Losses)Recognized Directly into Net Income (in millions)
Location 2017 2016 Location 2017 2016
Revenues......................... $ (32.5) $ 5.3 Other income (expense)..... $ 8.9 $ 2.9Operating expenses .......... $ 0.6 $ (1.5) Other income (expense)..... $ (0.2) $ 0.1
Interest Rate Contracts - Hedging Instruments
We have entered into interest rate lock contracts or interest rate swap contracts on certain borrowing transactions to manage our exposure to interest rate changes and to reduce our overall cost of borrowing.
Interest Rate Swap Contracts
In connection with the issuance of our 2.90% Senior Notes, as described in Note 12, Indebtedness, to these consolidated financial statements, we entered into interest rate swaps with an aggregate notional amount of $675.0 million, which expire on September 15, 2020. The interest rate swap contracts are designated as hedges of the fair value changes in our 2.90% Senior Notes attributable to changes in interest rates. Since the specific terms and notional amount of the swaps match the debt being hedged, it is assumed to be a highly effective hedge and all changes in the fair value of the swaps are recorded as a component of our 2.90% Senior Notes with no net impact recorded in income. Any net interest payments made or received on the interest rate swap contracts are recorded as a component of interest expense in our consolidated statements of income.
Net Investment Hedges - Hedging Instruments
In February 2012 we entered into a joint venture agreement with Samsung BioLogics, establishing an entity, Samsung Bioepis, to develop, manufacture and market biosimilar products. In June 2018 we exercised our option under our joint venture agreement to increase our ownership percentage in Samsung Bioepis from approximately 5% to approximately 49.9%. The share purchase transaction was completed in November 2018 and, upon closing, we paid 759.5 billion South Korean won ($676.6 million) to Samsung BioLogics. Our investment in the equity of Samsung Bioepis is exposed to the currency fluctuations in the South Korean won.
In order to mitigate these currency fluctuations between the U.S. dollar and South Korean won, we have entered into foreign currency forward contracts. Foreign currency forward contracts in effect as of December 31, 2018, had remaining durations of 10 months. These contracts have been designated as net investment hedges. Since the critical terms of the investment and the foreign currency forward contracts match, these contracts are assumed to be highly effective. We recognize changes in the spot exchange rate in accumulated other comprehensive income (loss) (referred to as AOCI in the table below). The pre-tax portion of the fair value of these foreign currency forward contracts that were included in accumulated other comprehensive income (loss) in total equity reflected net losses of $3.8 million as of December 31, 2018. We exclude fair value changes related to the forward rate from our hedging relationship and will amortize the forward points in other income (expense), net in our consolidated statements of income over the term of the contract. The pre-tax portion of the fair value of the forward
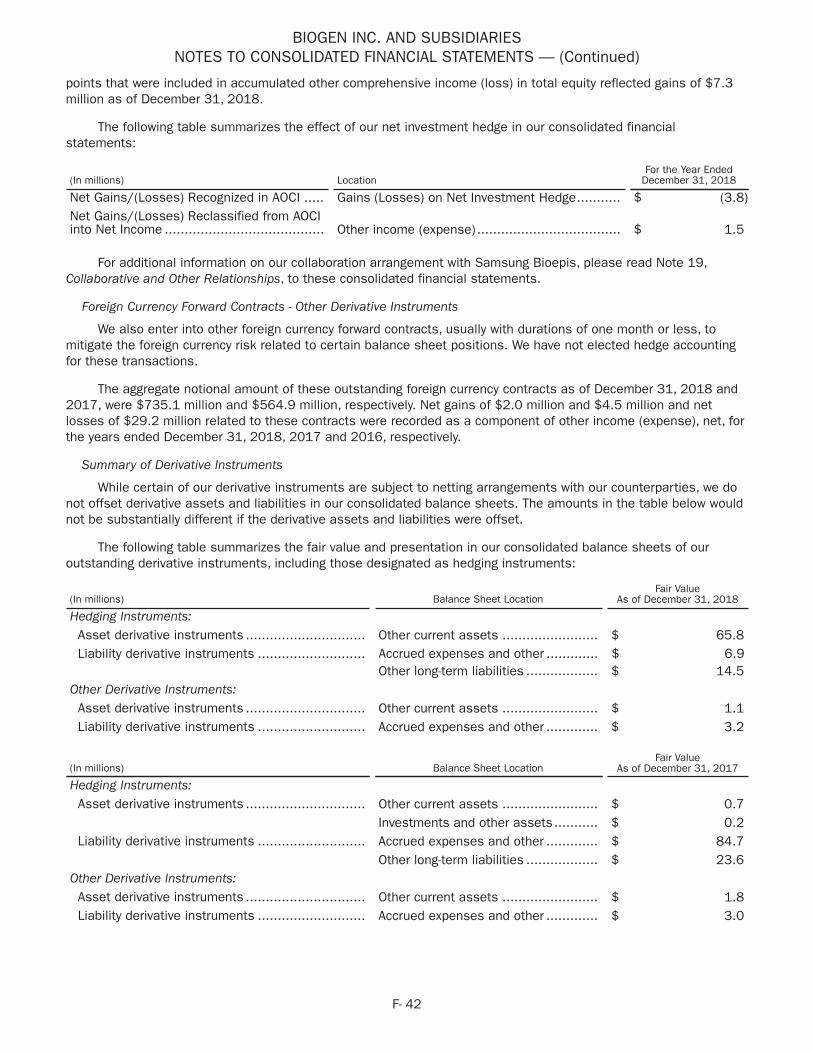
BIOGEN INC. AND SUBSIDIARIESNOTES TO CONSOLIDATED FINANCIAL STATEMENTS — (Continued)
F- 42
points that were included in accumulated other comprehensive income (loss) in total equity reflected gains of $7.3 million as of December 31, 2018.
The following table summarizes the effect of our net investment hedge in our consolidated financial statements:
(In millions) LocationFor the Year Ended
December 31, 2018
Net Gains/(Losses) Recognized in AOCI ..... Gains (Losses) on Net Investment Hedge........... $ (3.8)Net Gains/(Losses) Reclassified from AOCIinto Net Income ........................................ Other income (expense).................................... $ 1.5
For additional information on our collaboration arrangement with Samsung Bioepis, please read Note 19, Collaborative and Other Relationships, to these consolidated financial statements.
Foreign Currency Forward Contracts - Other Derivative Instruments
We also enter into other foreign currency forward contracts, usually with durations of one month or less, to mitigate the foreign currency risk related to certain balance sheet positions. We have not elected hedge accounting for these transactions.
The aggregate notional amount of these outstanding foreign currency contracts as of December 31, 2018 and 2017, were $735.1 million and $564.9 million, respectively. Net gains of $2.0 million and $4.5 million and net losses of $29.2 million related to these contracts were recorded as a component of other income (expense), net, for the years ended December 31, 2018, 2017 and 2016, respectively.
Summary of Derivative Instruments
While certain of our derivative instruments are subject to netting arrangements with our counterparties, we do not offset derivative assets and liabilities in our consolidated balance sheets. The amounts in the table below would not be substantially different if the derivative assets and liabilities were offset.
The following table summarizes the fair value and presentation in our consolidated balance sheets of our outstanding derivative instruments, including those designated as hedging instruments:
(In millions) Balance Sheet LocationFair Value
As of December 31, 2018
Hedging Instruments:Asset derivative instruments .............................. Other current assets ........................ $ 65.8Liability derivative instruments ........................... Accrued expenses and other ............. $ 6.9
Other long-term liabilities .................. $ 14.5Other Derivative Instruments:Asset derivative instruments .............................. Other current assets ........................ $ 1.1Liability derivative instruments ........................... Accrued expenses and other ............. $ 3.2
(In millions) Balance Sheet LocationFair Value
As of December 31, 2017
Hedging Instruments:Asset derivative instruments .............................. Other current assets ........................ $ 0.7
Investments and other assets........... $ 0.2Liability derivative instruments ........................... Accrued expenses and other ............. $ 84.7
Other long-term liabilities .................. $ 23.6Other Derivative Instruments:Asset derivative instruments .............................. Other current assets ........................ $ 1.8Liability derivative instruments ........................... Accrued expenses and other ............. $ 3.0
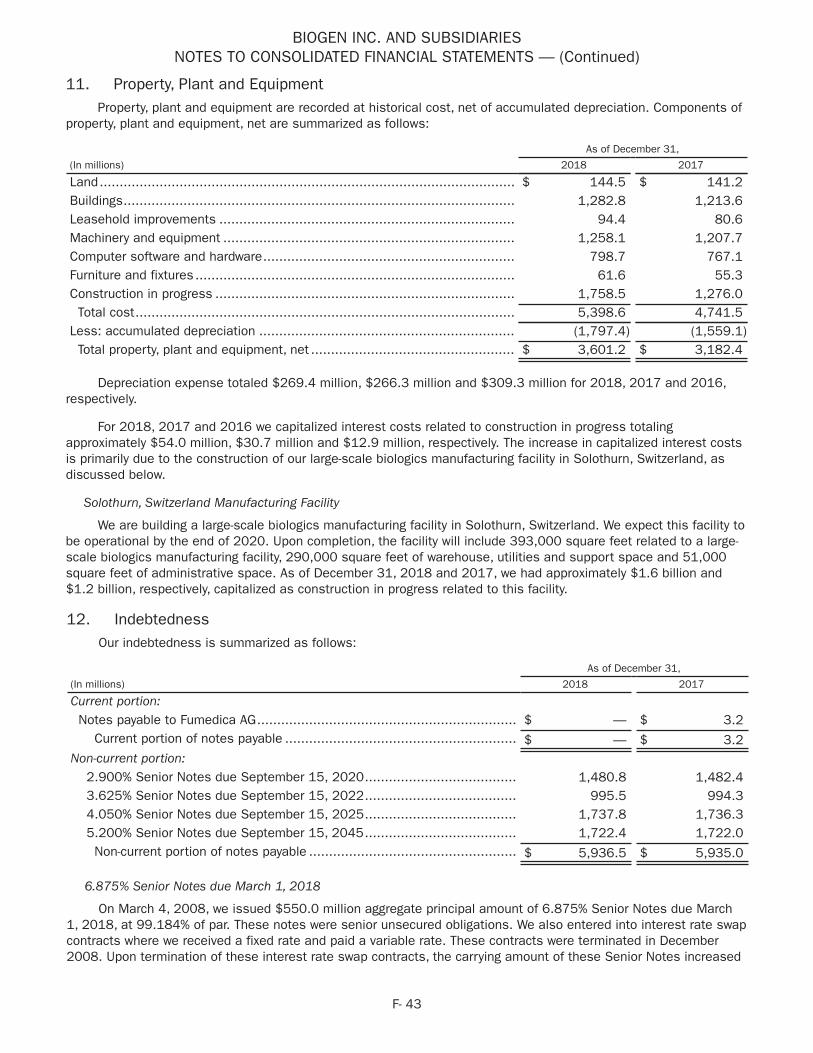
BIOGEN INC. AND SUBSIDIARIESNOTES TO CONSOLIDATED FINANCIAL STATEMENTS — (Continued)
F- 43
11. Property, Plant and EquipmentProperty, plant and equipment are recorded at historical cost, net of accumulated depreciation. Components of
property, plant and equipment, net are summarized as follows:
As of December 31,
(In millions) 2018 2017
Land........................................................................................................ $ 144.5 $ 141.2Buildings.................................................................................................. 1,282.8 1,213.6Leasehold improvements .......................................................................... 94.4 80.6Machinery and equipment ......................................................................... 1,258.1 1,207.7Computer software and hardware............................................................... 798.7 767.1Furniture and fixtures ................................................................................ 61.6 55.3Construction in progress ........................................................................... 1,758.5 1,276.0Total cost............................................................................................... 5,398.6 4,741.5
Less: accumulated depreciation ................................................................ (1,797.4) (1,559.1)Total property, plant and equipment, net ................................................... $ 3,601.2 $ 3,182.4
Depreciation expense totaled $269.4 million, $266.3 million and $309.3 million for 2018, 2017 and 2016, respectively.
For 2018, 2017 and 2016 we capitalized interest costs related to construction in progress totaling approximately $54.0 million, $30.7 million and $12.9 million, respectively. The increase in capitalized interest costs is primarily due to the construction of our large-scale biologics manufacturing facility in Solothurn, Switzerland, as discussed below.
Solothurn, Switzerland Manufacturing Facility
We are building a large-scale biologics manufacturing facility in Solothurn, Switzerland. We expect this facility to be operational by the end of 2020. Upon completion, the facility will include 393,000 square feet related to a large-scale biologics manufacturing facility, 290,000 square feet of warehouse, utilities and support space and 51,000 square feet of administrative space. As of December 31, 2018 and 2017, we had approximately $1.6 billion and $1.2 billion, respectively, capitalized as construction in progress related to this facility.
12. IndebtednessOur indebtedness is summarized as follows:
As of December 31,
(In millions) 2018 2017
Current portion:Notes payable to Fumedica AG................................................................. $ — $ 3.2
Current portion of notes payable .......................................................... $ — $ 3.2Non-current portion:
2.900% Senior Notes due September 15, 2020...................................... 1,480.8 1,482.43.625% Senior Notes due September 15, 2022...................................... 995.5 994.34.050% Senior Notes due September 15, 2025...................................... 1,737.8 1,736.35.200% Senior Notes due September 15, 2045...................................... 1,722.4 1,722.0Non-current portion of notes payable .................................................... $ 5,936.5 $ 5,935.0
6.875% Senior Notes due March 1, 2018
On March 4, 2008, we issued $550.0 million aggregate principal amount of 6.875% Senior Notes due March 1, 2018, at 99.184% of par. These notes were senior unsecured obligations. We also entered into interest rate swap contracts where we received a fixed rate and paid a variable rate. These contracts were terminated in December 2008. Upon termination of these interest rate swap contracts, the carrying amount of these Senior Notes increased
BIOGEN INC. AND SUBSIDIARIESNOTES TO CONSOLIDATED FINANCIAL STATEMENTS — (Continued)
F- 44
by $62.8 million, with this amount being amortized using the effective interest rate method over the remaining life of the Senior Notes and recognized as a reduction of interest expense.
In November 2017 we redeemed these Senior Notes prior to their maturity and recognized a net charge of $5.2 million upon the extinguishment of these Senior Notes. This charge, which was recognized in interest expense in other income (expense), net in our consolidated statements of income for the year ended December 31, 2017, reflects the payment of a $7.7 million early call premium and the write-off of remaining unamortized original debt issuance costs and discount balances, partially offset by a $2.9 million gain related to the remaining unamortized balance of the interest rate swap liability discussed above.
Notes payable to Fumedica AG
In connection with our 2006 distribution agreement with Fumedica AG, we issued notes totaling 61.4 million Swiss Francs that were payable to Fumedica AG in varying amounts from June 2008 through June 2018. In June 2018 we redeemed our remaining note payable to Fumedica AG.
2015 Senior Notes
The following is a summary of our principal indebtedness as of December 31, 2018:
• $1.5 billion aggregate principal amount of 2.90% Senior Notes due September 15, 2020, valued at 99.792% of par;
• $1.0 billion aggregate principal amount of 3.625% Senior Notes due September 15, 2022, valued at 99.920% of par;
• $1.75 billion aggregate principal amount of 4.05% Senior Notes due September 15, 2025, valued at 99.764% of par; and
• $1.75 billion aggregate principal amount of 5.20% Senior Notes due September 15, 2045, valued at 99.294% of par.
The costs associated with these offerings of approximately $47.5 million have been recorded as a reduction to the carrying amount of the debt in our consolidated balance sheet. These costs along with the discounts will be amortized as additional interest expense using the effective interest rate method over the period from issuance through maturity.
These notes are senior unsecured obligations. These Senior Notes may be redeemed at our option at any time at 100% of the principal amount plus accrued interest and a specified make-whole amount. These Senior Notes contain a change of control provision that may require us to purchase the notes at a price equal to 101% of the principal amount plus accrued and unpaid interest to the date of purchase under certain circumstances.
In connection with the 2.90% Senior Notes offering due in 2020, we entered into interest rate swap contracts. The carrying value of the 2.90% Senior Notes as of December 31, 2018 and 2017, includes approximately $14.5 million and $10.1 million, respectively, related to changes in the fair value of these contracts. For additional information on our interest rate contracts, please read Note 10, Derivative Instruments, to these consolidated financial statements.
Credit Facility
In August 2015 we entered into a $1.0 billion, five-year senior unsecured revolving credit facility under which we are permitted to draw funds for working capital and general corporate purposes. The terms of the revolving credit facility include a financial covenant that requires us not to exceed a maximum consolidated leverage ratio. As of December 31, 2018, we had no outstanding borrowings and were in compliance with all covenants under this facility.
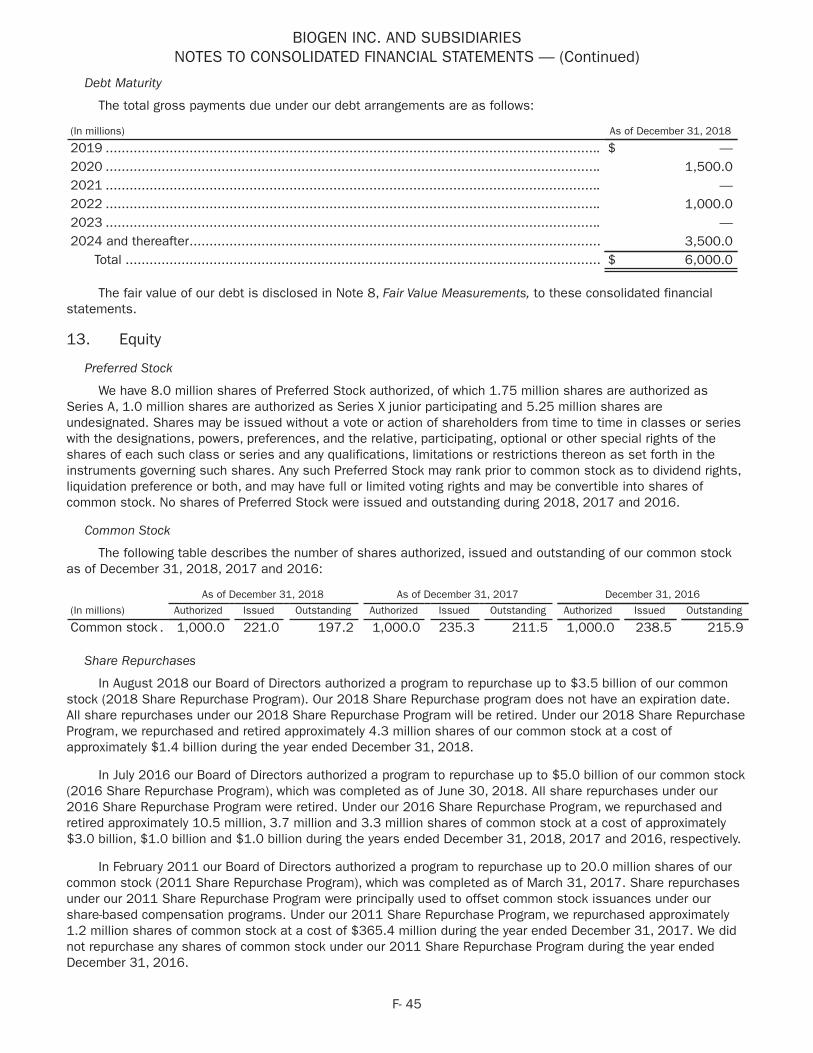
BIOGEN INC. AND SUBSIDIARIESNOTES TO CONSOLIDATED FINANCIAL STATEMENTS — (Continued)
F- 45
Debt Maturity
The total gross payments due under our debt arrangements are as follows:
(In millions) As of December 31, 2018
2019 ............................................................................................................................ $ —2020 ............................................................................................................................ 1,500.02021 ............................................................................................................................ —2022 ............................................................................................................................ 1,000.02023 ............................................................................................................................ —2024 and thereafter....................................................................................................... 3,500.0
Total ....................................................................................................................... $ 6,000.0
The fair value of our debt is disclosed in Note 8, Fair Value Measurements, to these consolidated financial statements.
13. Equity
Preferred Stock
We have 8.0 million shares of Preferred Stock authorized, of which 1.75 million shares are authorized as Series A, 1.0 million shares are authorized as Series X junior participating and 5.25 million shares are undesignated. Shares may be issued without a vote or action of shareholders from time to time in classes or series with the designations, powers, preferences, and the relative, participating, optional or other special rights of the shares of each such class or series and any qualifications, limitations or restrictions thereon as set forth in the instruments governing such shares. Any such Preferred Stock may rank prior to common stock as to dividend rights, liquidation preference or both, and may have full or limited voting rights and may be convertible into shares of common stock. No shares of Preferred Stock were issued and outstanding during 2018, 2017 and 2016.
Common Stock
The following table describes the number of shares authorized, issued and outstanding of our common stock as of December 31, 2018, 2017 and 2016:
As of December 31, 2018 As of December 31, 2017 December 31, 2016
(In millions) Authorized Issued Outstanding Authorized Issued Outstanding Authorized Issued Outstanding
Common stock . 1,000.0 221.0 197.2 1,000.0 235.3 211.5 1,000.0 238.5 215.9
Share Repurchases
In August 2018 our Board of Directors authorized a program to repurchase up to $3.5 billion of our common stock (2018 Share Repurchase Program). Our 2018 Share Repurchase program does not have an expiration date. All share repurchases under our 2018 Share Repurchase Program will be retired. Under our 2018 Share Repurchase Program, we repurchased and retired approximately 4.3 million shares of our common stock at a cost of approximately $1.4 billion during the year ended December 31, 2018.
In July 2016 our Board of Directors authorized a program to repurchase up to $5.0 billion of our common stock (2016 Share Repurchase Program), which was completed as of June 30, 2018. All share repurchases under our 2016 Share Repurchase Program were retired. Under our 2016 Share Repurchase Program, we repurchased and retired approximately 10.5 million, 3.7 million and 3.3 million shares of common stock at a cost of approximately $3.0 billion, $1.0 billion and $1.0 billion during the years ended December 31, 2018, 2017 and 2016, respectively.
In February 2011 our Board of Directors authorized a program to repurchase up to 20.0 million shares of our common stock (2011 Share Repurchase Program), which was completed as of March 31, 2017. Share repurchases under our 2011 Share Repurchase Program were principally used to offset common stock issuances under our share-based compensation programs. Under our 2011 Share Repurchase Program, we repurchased approximately 1.2 million shares of common stock at a cost of $365.4 million during the year ended December 31, 2017. We did not repurchase any shares of common stock under our 2011 Share Repurchase Program during the year ended December 31, 2016.

BIOGEN INC. AND SUBSIDIARIESNOTES TO CONSOLIDATED FINANCIAL STATEMENTS — (Continued)
F- 46
Amounts paid to repurchase shares in excess of their par value are allocated between additional paid-in capital and retained earnings, with payments in excess of our additional paid-in-capital balance recorded as a reduction to retained earnings.
14. Accumulated Other Comprehensive Income (Loss)The following table summarizes the changes in accumulated other comprehensive income (loss), net of tax by
component:
(In millions)
UnrealizedGains (Losses)on SecuritiesAvailable for
Sale, net of tax
UnrealizedGains (Losses)on Cash FlowHedges, net of
tax
Gains (Losses)on Net
InvestmentHedge, Net of
Tax
UnfundedStatus of
PostretirementBenefit Plans,
net of tax
CurrencyTranslation
Adjustments Total
Balance, December 31, 2017. $ (1.6) $ (104.5) $ — $ (36.8) $ (175.5) $ (318.4)Amounts reclassified, netof tax, upon adoption ofASU 2016-01 .................... 1.5 — — — — 1.5
Balance, January 1, 2018 ...... (0.1) (104.5) — (36.8) (175.5) (316.9)Other comprehensiveincome (loss) beforereclassifications ................ (10.6) 97.4 5.0 5.5 (67.8) 29.5Amounts reclassified fromaccumulated othercomprehensive income(loss)................................ 6.7 41.8 (1.5) — — 47.0
Net current period othercomprehensive income(loss).................................. (3.9) 139.2 3.5 5.5 (67.8) 76.5
Balance, December 31, 2018. $ (4.0) $ 34.7 $ 3.5 $ (31.3) $ (243.3) $ (240.4)
(In millions)
UnrealizedGains (Losses)on SecuritiesAvailable for
Sale, net of tax
UnrealizedGains (Losses)on Cash FlowHedges, net of
tax
Gains (Losses)on Net
InvestmentHedge, Net of
Tax
UnfundedStatus of
PostretirementBenefit Plans,
net of tax
CurrencyTranslation
Adjustments Total
Balance, December 31, 2016. $ (10.8) $ 57.8 $ — $ (32.7) $ (334.2) $ (319.9)Other comprehensiveincome (loss) beforereclassifications ................ (3.5) (193.8) — (4.1) 158.7 (42.7)Amounts reclassified fromaccumulated othercomprehensive income(loss)................................ 12.7 31.5 — — — 44.2
Net current period othercomprehensive income(loss).................................. 9.2 (162.3) — (4.1) 158.7 1.5
Balance, December 31, 2017. $ (1.6) $ (104.5) $ — $ (36.8) $ (175.5) $ (318.4)
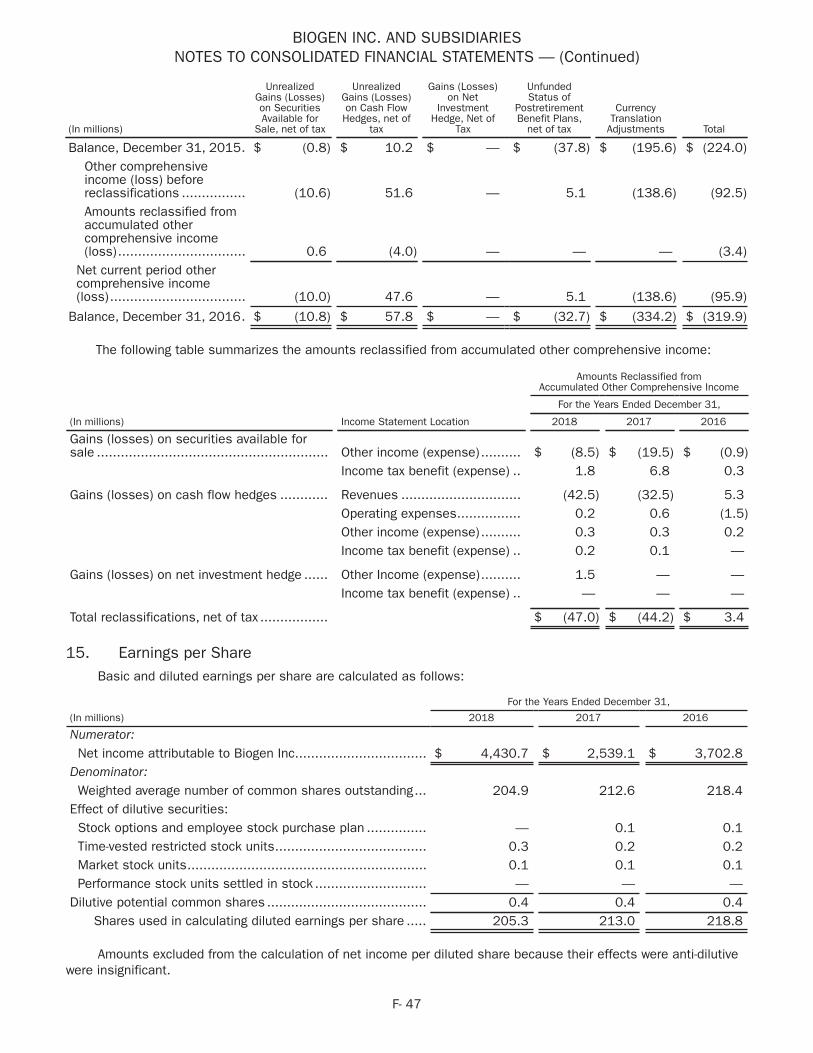
BIOGEN INC. AND SUBSIDIARIESNOTES TO CONSOLIDATED FINANCIAL STATEMENTS — (Continued)
F- 47
(In millions)
UnrealizedGains (Losses)on SecuritiesAvailable for
Sale, net of tax
UnrealizedGains (Losses)on Cash FlowHedges, net of
tax
Gains (Losses)on Net
InvestmentHedge, Net of
Tax
UnfundedStatus of
PostretirementBenefit Plans,
net of tax
CurrencyTranslation
Adjustments Total
Balance, December 31, 2015. $ (0.8) $ 10.2 $ — $ (37.8) $ (195.6) $ (224.0)Other comprehensiveincome (loss) beforereclassifications ................ (10.6) 51.6 — 5.1 (138.6) (92.5)Amounts reclassified fromaccumulated othercomprehensive income(loss)................................ 0.6 (4.0) — — — (3.4)
Net current period othercomprehensive income(loss).................................. (10.0) 47.6 — 5.1 (138.6) (95.9)
Balance, December 31, 2016. $ (10.8) $ 57.8 $ — $ (32.7) $ (334.2) $ (319.9)
The following table summarizes the amounts reclassified from accumulated other comprehensive income:
(In millions) Income Statement Location
Amounts Reclassified fromAccumulated Other Comprehensive Income
For the Years Ended December 31,
2018 2017 2016
Gains (losses) on securities available forsale .......................................................... Other income (expense).......... $ (8.5) $ (19.5) $ (0.9)
Income tax benefit (expense) .. 1.8 6.8 0.3
Gains (losses) on cash flow hedges ............ Revenues .............................. (42.5) (32.5) 5.3Operating expenses................ 0.2 0.6 (1.5)Other income (expense).......... 0.3 0.3 0.2Income tax benefit (expense) .. 0.2 0.1 —
Gains (losses) on net investment hedge ...... Other Income (expense).......... 1.5 — —Income tax benefit (expense) .. — — —
Total reclassifications, net of tax ................. $ (47.0) $ (44.2) $ 3.4
15. Earnings per ShareBasic and diluted earnings per share are calculated as follows:
For the Years Ended December 31,
(In millions) 2018 2017 2016
Numerator:Net income attributable to Biogen Inc................................. $ 4,430.7 $ 2,539.1 $ 3,702.8
Denominator:Weighted average number of common shares outstanding... 204.9 212.6 218.4
Effect of dilutive securities:Stock options and employee stock purchase plan ............... — 0.1 0.1Time-vested restricted stock units...................................... 0.3 0.2 0.2Market stock units............................................................ 0.1 0.1 0.1Performance stock units settled in stock ............................ — — —
Dilutive potential common shares ........................................ 0.4 0.4 0.4Shares used in calculating diluted earnings per share ..... 205.3 213.0 218.8
Amounts excluded from the calculation of net income per diluted share because their effects were anti-dilutive were insignificant.
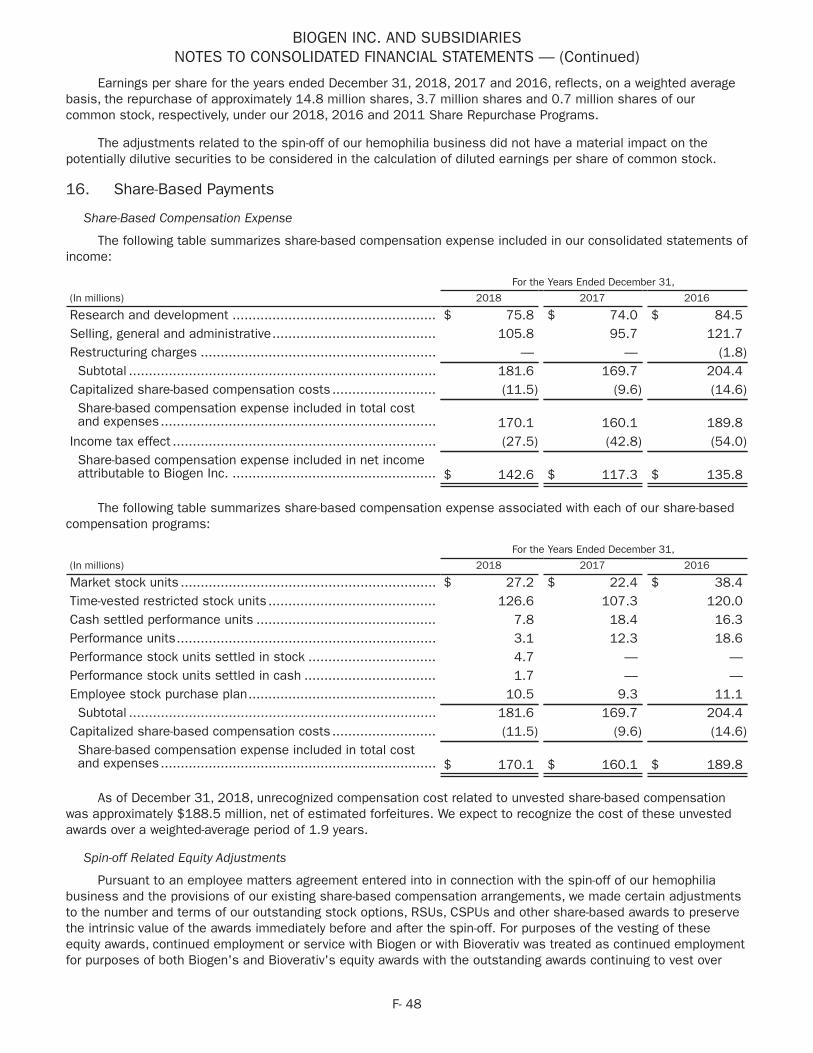
BIOGEN INC. AND SUBSIDIARIESNOTES TO CONSOLIDATED FINANCIAL STATEMENTS — (Continued)
F- 48
Earnings per share for the years ended December 31, 2018, 2017 and 2016, reflects, on a weighted average basis, the repurchase of approximately 14.8 million shares, 3.7 million shares and 0.7 million shares of our common stock, respectively, under our 2018, 2016 and 2011 Share Repurchase Programs.
The adjustments related to the spin-off of our hemophilia business did not have a material impact on the potentially dilutive securities to be considered in the calculation of diluted earnings per share of common stock.
16. Share-Based Payments
Share-Based Compensation Expense
The following table summarizes share-based compensation expense included in our consolidated statements of income:
For the Years Ended December 31,
(In millions) 2018 2017 2016
Research and development ................................................... $ 75.8 $ 74.0 $ 84.5Selling, general and administrative......................................... 105.8 95.7 121.7Restructuring charges ........................................................... — — (1.8)Subtotal ............................................................................. 181.6 169.7 204.4
Capitalized share-based compensation costs .......................... (11.5) (9.6) (14.6)Share-based compensation expense included in total costand expenses..................................................................... 170.1 160.1 189.8
Income tax effect .................................................................. (27.5) (42.8) (54.0)Share-based compensation expense included in net incomeattributable to Biogen Inc. ................................................... $ 142.6 $ 117.3 $ 135.8
The following table summarizes share-based compensation expense associated with each of our share-based compensation programs:
For the Years Ended December 31,
(In millions) 2018 2017 2016
Market stock units ................................................................ $ 27.2 $ 22.4 $ 38.4Time-vested restricted stock units .......................................... 126.6 107.3 120.0Cash settled performance units ............................................. 7.8 18.4 16.3Performance units................................................................. 3.1 12.3 18.6Performance stock units settled in stock ................................ 4.7 — —Performance stock units settled in cash ................................. 1.7 — —Employee stock purchase plan............................................... 10.5 9.3 11.1Subtotal ............................................................................. 181.6 169.7 204.4
Capitalized share-based compensation costs .......................... (11.5) (9.6) (14.6)Share-based compensation expense included in total costand expenses..................................................................... $ 170.1 $ 160.1 $ 189.8
As of December 31, 2018, unrecognized compensation cost related to unvested share-based compensation was approximately $188.5 million, net of estimated forfeitures. We expect to recognize the cost of these unvested awards over a weighted-average period of 1.9 years.
Spin-off Related Equity Adjustments
Pursuant to an employee matters agreement entered into in connection with the spin-off of our hemophilia business and the provisions of our existing share-based compensation arrangements, we made certain adjustments to the number and terms of our outstanding stock options, RSUs, CSPUs and other share-based awards to preserve the intrinsic value of the awards immediately before and after the spin-off. For purposes of the vesting of these equity awards, continued employment or service with Biogen or with Bioverativ was treated as continued employment for purposes of both Biogen's and Bioverativ's equity awards with the outstanding awards continuing to vest over
BIOGEN INC. AND SUBSIDIARIESNOTES TO CONSOLIDATED FINANCIAL STATEMENTS — (Continued)
F- 49
their respective original vesting periods. Outstanding equity awards for employees transferring to Bioverativ were converted to unvested Bioverativ equity awards.
Adjustments to the number of our share-based compensation awards were made using an adjustment ratio based upon the weighted-average closing price of our common stock for the 10 calendar days prior to the effective date of the spin-off and the volume-weighted average prices for the 10 calendar days of our common stock following the effective date of the spin-off. For stock options, the exercise prices of the awards were modified to maintain the pre-spin intrinsic value of the awards in relation to the post-spin stock price of Biogen. The difference between the fair value of the awards based upon the adjustment ratio and the opening price on the distribution date was not material.
Share-Based Compensation Plans
We have three share-based compensation plans pursuant to which awards are currently being made: (i) the Biogen Inc. 2006 Non-Employee Directors Equity Plan (2006 Directors Plan); (ii) the Biogen Inc. 2017 Omnibus Equity Plan (2017 Omnibus Equity Plan); and (iii) the Biogen Inc. 2015 Employee Stock Purchase Plan (2015 ESPP).
Directors Plan
In May 2006 our shareholders approved the 2006 Directors Plan for share-based awards to our directors. Awards granted from the 2006 Directors Plan may include stock options, shares of restricted stock, RSUs, stock appreciation rights and other awards in such amounts and with such terms and conditions as may be determined by a committee of our Board of Directors, subject to the provisions of the plan. We have reserved a total of 1.6 million shares of common stock for issuance under the 2006 Directors Plan. The 2006 Directors Plan provides that awards other than stock options and stock appreciation rights will be counted against the total number of shares reserved under the plan in a 1.5-to-1 ratio. In June 2015 our shareholders approved an amendment to extend the term of the 2006 Directors Plan until June 2025.
Omnibus Plan
In June 2017 our shareholders approved the 2017 Omnibus Equity Plan for share-based awards to our employees. Awards granted from the 2017 Omnibus Equity Plan may include stock options, shares of restricted stock, RSUs, performance shares, stock appreciation rights and other awards in such amounts and with such terms and conditions as may be determined by a committee of our Board of Directors, subject to the provisions of the plan. Shares of common stock available for grant under the 2017 Omnibus Equity Plan consist of 8.0 million shares reserved for this purpose, plus shares of common stock that remained available for grant under our 2008 Omnibus Equity Plan as of June 7, 2017, or that could again become available for grant if outstanding awards under the 2008 Omnibus Equity Plan as of June 7, 2017, are cancelled, surrendered or terminated in whole or in part. The 2017 Omnibus Equity Plan provides that awards other than stock options and stock appreciation rights will be counted against the total number of shares available under the plan in a 1.5-to-1 ratio.
We have not made any awards pursuant to the 2008 Omnibus Equity Plan since our shareholders approved the 2017 Omnibus Equity Plan, and do not intend to make any awards pursuant to the 2008 Omnibus Equity Plan in the future, except that unused shares under the 2008 Omnibus Equity Plan have been carried over for use under the 2017 Omnibus Equity Plan.
Stock Options
We currently do not grant stock options to our employees or directors. Outstanding stock options previously granted to our employees and directors generally have a 10-year term and vest over a period of between one and four years, provided the individual continues to serve at Biogen through the vesting dates. Options granted under all plans are exercisable at a price per share not less than the fair market value of the underlying common stock on the date of grant. The estimated fair value of options, including the effect of estimated forfeitures, is recognized over the options’ vesting periods. The fair value of the stock options granted in 2010 was estimated as of the date of grant using a Black-Scholes option valuation model. There were no grants of stock options made in 2018, 2017 and 2016. As of December 31, 2018, all outstanding options were exercisable.
The expected life of options granted is derived using assumed exercise rates based on historical exercise patterns and represents the period of time that options granted are expected to be outstanding. Expected stock price volatility is based upon implied volatility for our exchange-traded options and other factors, including historical volatility. After assessing all available information on either historical volatility, implied volatility or both, we have
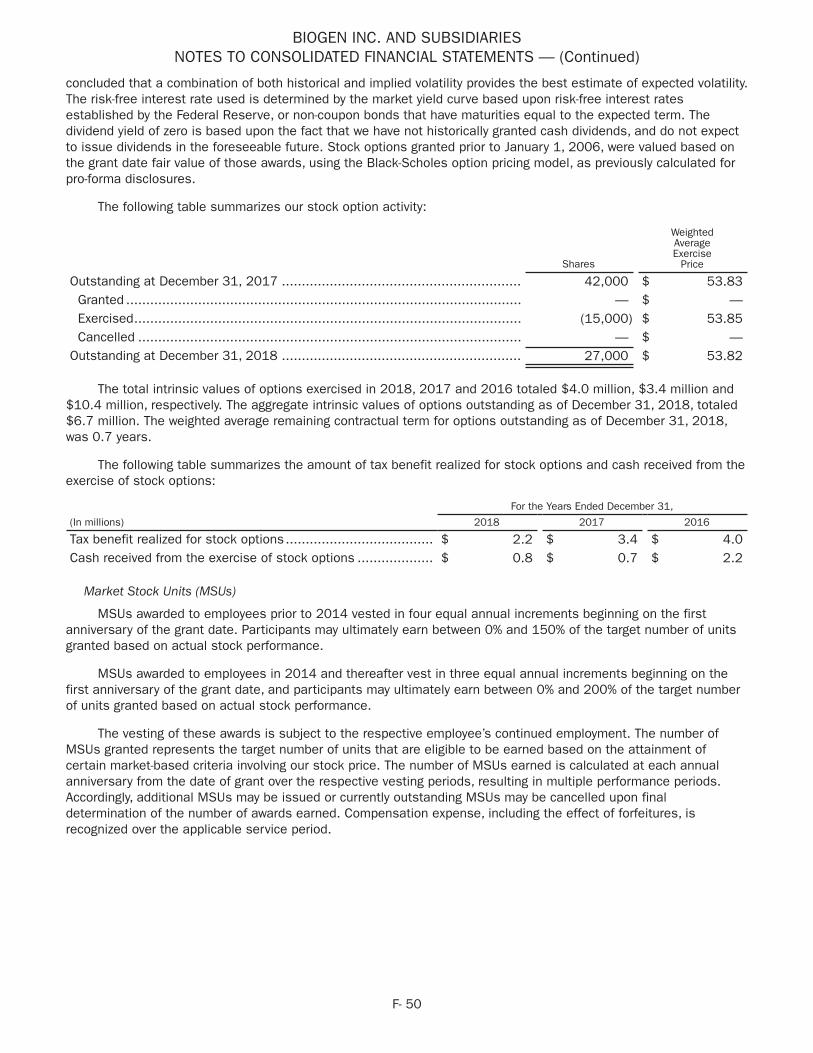
BIOGEN INC. AND SUBSIDIARIESNOTES TO CONSOLIDATED FINANCIAL STATEMENTS — (Continued)
F- 50
concluded that a combination of both historical and implied volatility provides the best estimate of expected volatility. The risk-free interest rate used is determined by the market yield curve based upon risk-free interest rates established by the Federal Reserve, or non-coupon bonds that have maturities equal to the expected term. The dividend yield of zero is based upon the fact that we have not historically granted cash dividends, and do not expect to issue dividends in the foreseeable future. Stock options granted prior to January 1, 2006, were valued based on the grant date fair value of those awards, using the Black-Scholes option pricing model, as previously calculated for pro-forma disclosures.
The following table summarizes our stock option activity:
Shares
WeightedAverageExercise
Price
Outstanding at December 31, 2017 ............................................................ 42,000 $ 53.83Granted ................................................................................................... — $ —Exercised................................................................................................. (15,000) $ 53.85Cancelled ................................................................................................ — $ —
Outstanding at December 31, 2018 ............................................................ 27,000 $ 53.82
The total intrinsic values of options exercised in 2018, 2017 and 2016 totaled $4.0 million, $3.4 million and $10.4 million, respectively. The aggregate intrinsic values of options outstanding as of December 31, 2018, totaled $6.7 million. The weighted average remaining contractual term for options outstanding as of December 31, 2018, was 0.7 years.
The following table summarizes the amount of tax benefit realized for stock options and cash received from the exercise of stock options:
For the Years Ended December 31,
(In millions) 2018 2017 2016
Tax benefit realized for stock options..................................... $ 2.2 $ 3.4 $ 4.0Cash received from the exercise of stock options ................... $ 0.8 $ 0.7 $ 2.2
Market Stock Units (MSUs)
MSUs awarded to employees prior to 2014 vested in four equal annual increments beginning on the first anniversary of the grant date. Participants may ultimately earn between 0% and 150% of the target number of units granted based on actual stock performance.
MSUs awarded to employees in 2014 and thereafter vest in three equal annual increments beginning on the first anniversary of the grant date, and participants may ultimately earn between 0% and 200% of the target number of units granted based on actual stock performance.
The vesting of these awards is subject to the respective employee’s continued employment. The number of MSUs granted represents the target number of units that are eligible to be earned based on the attainment of certain market-based criteria involving our stock price. The number of MSUs earned is calculated at each annual anniversary from the date of grant over the respective vesting periods, resulting in multiple performance periods. Accordingly, additional MSUs may be issued or currently outstanding MSUs may be cancelled upon final determination of the number of awards earned. Compensation expense, including the effect of forfeitures, is recognized over the applicable service period.
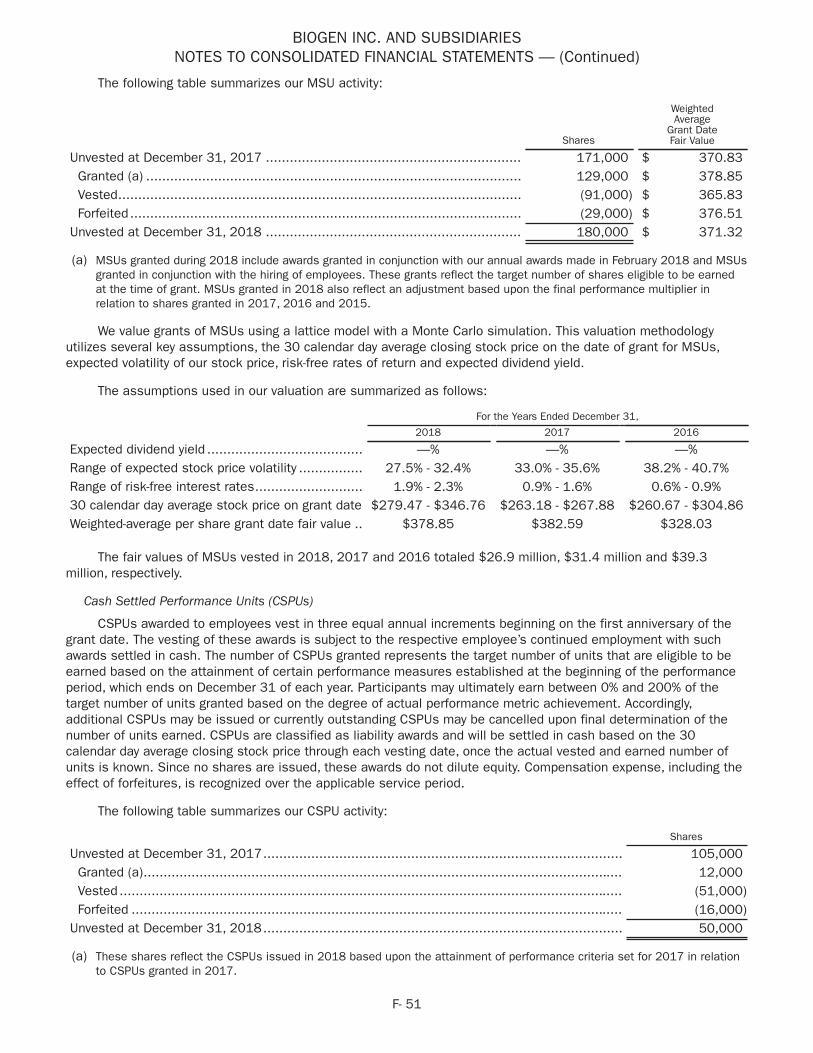
BIOGEN INC. AND SUBSIDIARIESNOTES TO CONSOLIDATED FINANCIAL STATEMENTS — (Continued)
F- 51
The following table summarizes our MSU activity:
Shares
WeightedAverage
Grant DateFair Value
Unvested at December 31, 2017 ................................................................ 171,000 $ 370.83Granted (a) .............................................................................................. 129,000 $ 378.85Vested..................................................................................................... (91,000) $ 365.83Forfeited.................................................................................................. (29,000) $ 376.51
Unvested at December 31, 2018 ................................................................ 180,000 $ 371.32
(a) MSUs granted during 2018 include awards granted in conjunction with our annual awards made in February 2018 and MSUs granted in conjunction with the hiring of employees. These grants reflect the target number of shares eligible to be earned at the time of grant. MSUs granted in 2018 also reflect an adjustment based upon the final performance multiplier in relation to shares granted in 2017, 2016 and 2015.
We value grants of MSUs using a lattice model with a Monte Carlo simulation. This valuation methodology utilizes several key assumptions, the 30 calendar day average closing stock price on the date of grant for MSUs, expected volatility of our stock price, risk-free rates of return and expected dividend yield.
The assumptions used in our valuation are summarized as follows:
For the Years Ended December 31,
2018 2017 2016
Expected dividend yield ....................................... —% —% —%Range of expected stock price volatility ................ 27.5% - 32.4% 33.0% - 35.6% 38.2% - 40.7%Range of risk-free interest rates........................... 1.9% - 2.3% 0.9% - 1.6% 0.6% - 0.9%30 calendar day average stock price on grant date $279.47 - $346.76 $263.18 - $267.88 $260.67 - $304.86Weighted-average per share grant date fair value .. $378.85 $382.59 $328.03
The fair values of MSUs vested in 2018, 2017 and 2016 totaled $26.9 million, $31.4 million and $39.3 million, respectively.
Cash Settled Performance Units (CSPUs)
CSPUs awarded to employees vest in three equal annual increments beginning on the first anniversary of the grant date. The vesting of these awards is subject to the respective employee’s continued employment with such awards settled in cash. The number of CSPUs granted represents the target number of units that are eligible to be earned based on the attainment of certain performance measures established at the beginning of the performance period, which ends on December 31 of each year. Participants may ultimately earn between 0% and 200% of the target number of units granted based on the degree of actual performance metric achievement. Accordingly, additional CSPUs may be issued or currently outstanding CSPUs may be cancelled upon final determination of the number of units earned. CSPUs are classified as liability awards and will be settled in cash based on the 30 calendar day average closing stock price through each vesting date, once the actual vested and earned number of units is known. Since no shares are issued, these awards do not dilute equity. Compensation expense, including the effect of forfeitures, is recognized over the applicable service period.
The following table summarizes our CSPU activity:
Shares
Unvested at December 31, 2017.......................................................................................... 105,000Granted (a)........................................................................................................................ 12,000Vested .............................................................................................................................. (51,000)Forfeited ........................................................................................................................... (16,000)
Unvested at December 31, 2018.......................................................................................... 50,000
(a) These shares reflect the CSPUs issued in 2018 based upon the attainment of performance criteria set for 2017 in relation to CSPUs granted in 2017.
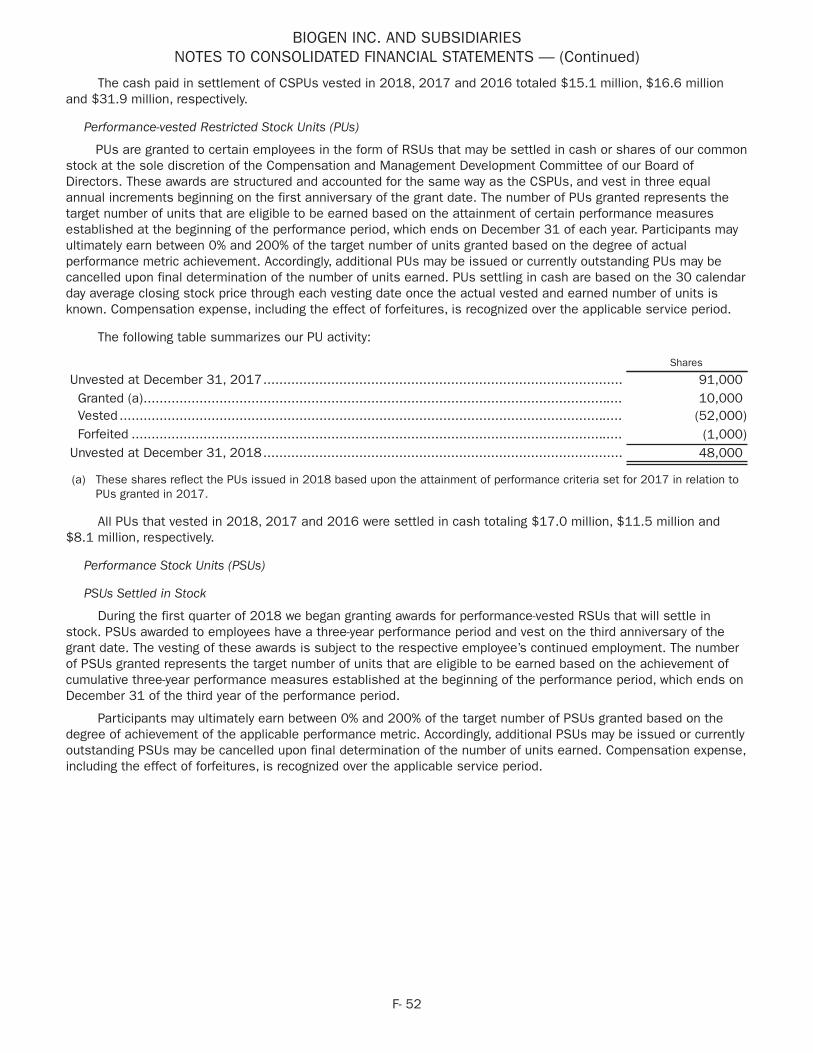
BIOGEN INC. AND SUBSIDIARIESNOTES TO CONSOLIDATED FINANCIAL STATEMENTS — (Continued)
F- 52
The cash paid in settlement of CSPUs vested in 2018, 2017 and 2016 totaled $15.1 million, $16.6 million and $31.9 million, respectively.
Performance-vested Restricted Stock Units (PUs)
PUs are granted to certain employees in the form of RSUs that may be settled in cash or shares of our common stock at the sole discretion of the Compensation and Management Development Committee of our Board of Directors. These awards are structured and accounted for the same way as the CSPUs, and vest in three equal annual increments beginning on the first anniversary of the grant date. The number of PUs granted represents the target number of units that are eligible to be earned based on the attainment of certain performance measures established at the beginning of the performance period, which ends on December 31 of each year. Participants may ultimately earn between 0% and 200% of the target number of units granted based on the degree of actual performance metric achievement. Accordingly, additional PUs may be issued or currently outstanding PUs may be cancelled upon final determination of the number of units earned. PUs settling in cash are based on the 30 calendar day average closing stock price through each vesting date once the actual vested and earned number of units is known. Compensation expense, including the effect of forfeitures, is recognized over the applicable service period.
The following table summarizes our PU activity:
Shares
Unvested at December 31, 2017.......................................................................................... 91,000Granted (a)........................................................................................................................ 10,000Vested .............................................................................................................................. (52,000)Forfeited ........................................................................................................................... (1,000)
Unvested at December 31, 2018.......................................................................................... 48,000
(a) These shares reflect the PUs issued in 2018 based upon the attainment of performance criteria set for 2017 in relation to PUs granted in 2017.
All PUs that vested in 2018, 2017 and 2016 were settled in cash totaling $17.0 million, $11.5 million and $8.1 million, respectively.
Performance Stock Units (PSUs)
PSUs Settled in Stock
During the first quarter of 2018 we began granting awards for performance-vested RSUs that will settle in stock. PSUs awarded to employees have a three-year performance period and vest on the third anniversary of the grant date. The vesting of these awards is subject to the respective employee’s continued employment. The number of PSUs granted represents the target number of units that are eligible to be earned based on the achievement of cumulative three-year performance measures established at the beginning of the performance period, which ends on December 31 of the third year of the performance period.
Participants may ultimately earn between 0% and 200% of the target number of PSUs granted based on the degree of achievement of the applicable performance metric. Accordingly, additional PSUs may be issued or currently outstanding PSUs may be cancelled upon final determination of the number of units earned. Compensation expense, including the effect of forfeitures, is recognized over the applicable service period.
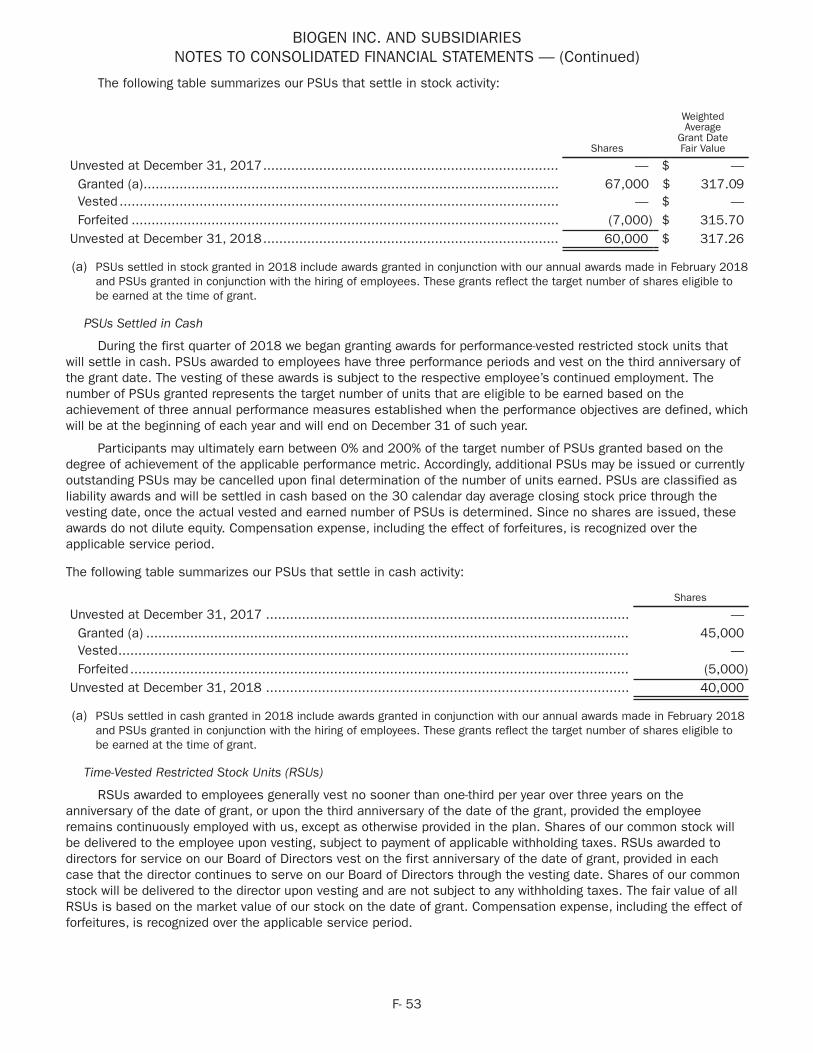
BIOGEN INC. AND SUBSIDIARIESNOTES TO CONSOLIDATED FINANCIAL STATEMENTS — (Continued)
F- 53
The following table summarizes our PSUs that settle in stock activity:
Shares
WeightedAverage
Grant DateFair Value
Unvested at December 31, 2017.......................................................................... — $ —Granted (a)........................................................................................................ 67,000 $ 317.09Vested .............................................................................................................. — $ —Forfeited ........................................................................................................... (7,000) $ 315.70
Unvested at December 31, 2018.......................................................................... 60,000 $ 317.26
(a) PSUs settled in stock granted in 2018 include awards granted in conjunction with our annual awards made in February 2018 and PSUs granted in conjunction with the hiring of employees. These grants reflect the target number of shares eligible to be earned at the time of grant.
PSUs Settled in Cash
During the first quarter of 2018 we began granting awards for performance-vested restricted stock units that will settle in cash. PSUs awarded to employees have three performance periods and vest on the third anniversary of the grant date. The vesting of these awards is subject to the respective employee’s continued employment. The number of PSUs granted represents the target number of units that are eligible to be earned based on the achievement of three annual performance measures established when the performance objectives are defined, which will be at the beginning of each year and will end on December 31 of such year.
Participants may ultimately earn between 0% and 200% of the target number of PSUs granted based on the degree of achievement of the applicable performance metric. Accordingly, additional PSUs may be issued or currently outstanding PSUs may be cancelled upon final determination of the number of units earned. PSUs are classified as liability awards and will be settled in cash based on the 30 calendar day average closing stock price through the vesting date, once the actual vested and earned number of PSUs is determined. Since no shares are issued, these awards do not dilute equity. Compensation expense, including the effect of forfeitures, is recognized over the applicable service period.
The following table summarizes our PSUs that settle in cash activity:
Shares
Unvested at December 31, 2017 ........................................................................................... —Granted (a) ......................................................................................................................... 45,000Vested................................................................................................................................ —Forfeited ............................................................................................................................. (5,000)
Unvested at December 31, 2018 ........................................................................................... 40,000
(a) PSUs settled in cash granted in 2018 include awards granted in conjunction with our annual awards made in February 2018 and PSUs granted in conjunction with the hiring of employees. These grants reflect the target number of shares eligible to be earned at the time of grant.
Time-Vested Restricted Stock Units (RSUs)
RSUs awarded to employees generally vest no sooner than one-third per year over three years on the anniversary of the date of grant, or upon the third anniversary of the date of the grant, provided the employee remains continuously employed with us, except as otherwise provided in the plan. Shares of our common stock will be delivered to the employee upon vesting, subject to payment of applicable withholding taxes. RSUs awarded to directors for service on our Board of Directors vest on the first anniversary of the date of grant, provided in each case that the director continues to serve on our Board of Directors through the vesting date. Shares of our common stock will be delivered to the director upon vesting and are not subject to any withholding taxes. The fair value of all RSUs is based on the market value of our stock on the date of grant. Compensation expense, including the effect of forfeitures, is recognized over the applicable service period.
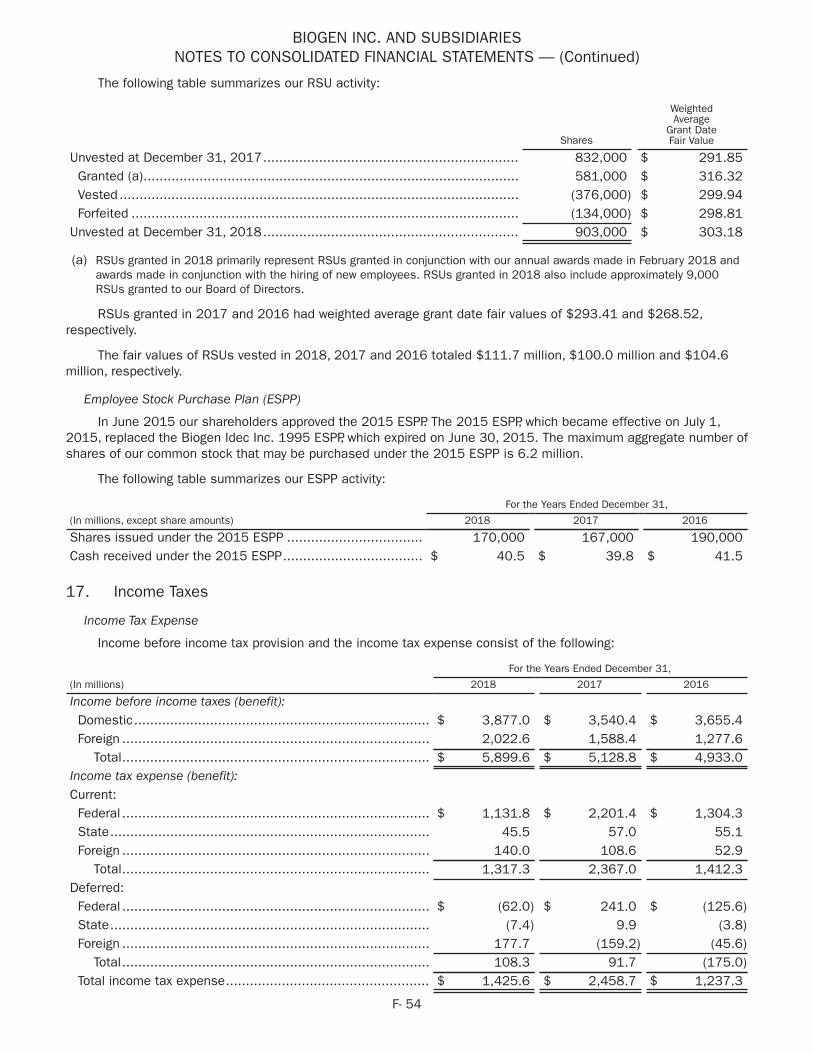
BIOGEN INC. AND SUBSIDIARIESNOTES TO CONSOLIDATED FINANCIAL STATEMENTS — (Continued)
F- 54
The following table summarizes our RSU activity:
Shares
WeightedAverage
Grant DateFair Value
Unvested at December 31, 2017................................................................ 832,000 $ 291.85Granted (a).............................................................................................. 581,000 $ 316.32Vested .................................................................................................... (376,000) $ 299.94Forfeited ................................................................................................. (134,000) $ 298.81
Unvested at December 31, 2018................................................................ 903,000 $ 303.18
(a) RSUs granted in 2018 primarily represent RSUs granted in conjunction with our annual awards made in February 2018 and awards made in conjunction with the hiring of new employees. RSUs granted in 2018 also include approximately 9,000 RSUs granted to our Board of Directors.
RSUs granted in 2017 and 2016 had weighted average grant date fair values of $293.41 and $268.52, respectively.
The fair values of RSUs vested in 2018, 2017 and 2016 totaled $111.7 million, $100.0 million and $104.6 million, respectively.
Employee Stock Purchase Plan (ESPP)
In June 2015 our shareholders approved the 2015 ESPP. The 2015 ESPP, which became effective on July 1, 2015, replaced the Biogen Idec Inc. 1995 ESPP, which expired on June 30, 2015. The maximum aggregate number of shares of our common stock that may be purchased under the 2015 ESPP is 6.2 million.
The following table summarizes our ESPP activity:
For the Years Ended December 31,
(In millions, except share amounts) 2018 2017 2016
Shares issued under the 2015 ESPP .................................. 170,000 167,000 190,000Cash received under the 2015 ESPP................................... $ 40.5 $ 39.8 $ 41.5
17. Income Taxes
Income Tax Expense
Income before income tax provision and the income tax expense consist of the following:
For the Years Ended December 31,
(In millions) 2018 2017 2016
Income before income taxes (benefit):Domestic.......................................................................... $ 3,877.0 $ 3,540.4 $ 3,655.4Foreign ............................................................................. 2,022.6 1,588.4 1,277.6
Total............................................................................. $ 5,899.6 $ 5,128.8 $ 4,933.0Income tax expense (benefit):Current:Federal ............................................................................. $ 1,131.8 $ 2,201.4 $ 1,304.3State................................................................................ 45.5 57.0 55.1Foreign ............................................................................. 140.0 108.6 52.9
Total............................................................................. 1,317.3 2,367.0 1,412.3Deferred:Federal ............................................................................. $ (62.0) $ 241.0 $ (125.6)State................................................................................ (7.4) 9.9 (3.8)Foreign ............................................................................. 177.7 (159.2) (45.6)
Total............................................................................. 108.3 91.7 (175.0)Total income tax expense................................................... $ 1,425.6 $ 2,458.7 $ 1,237.3
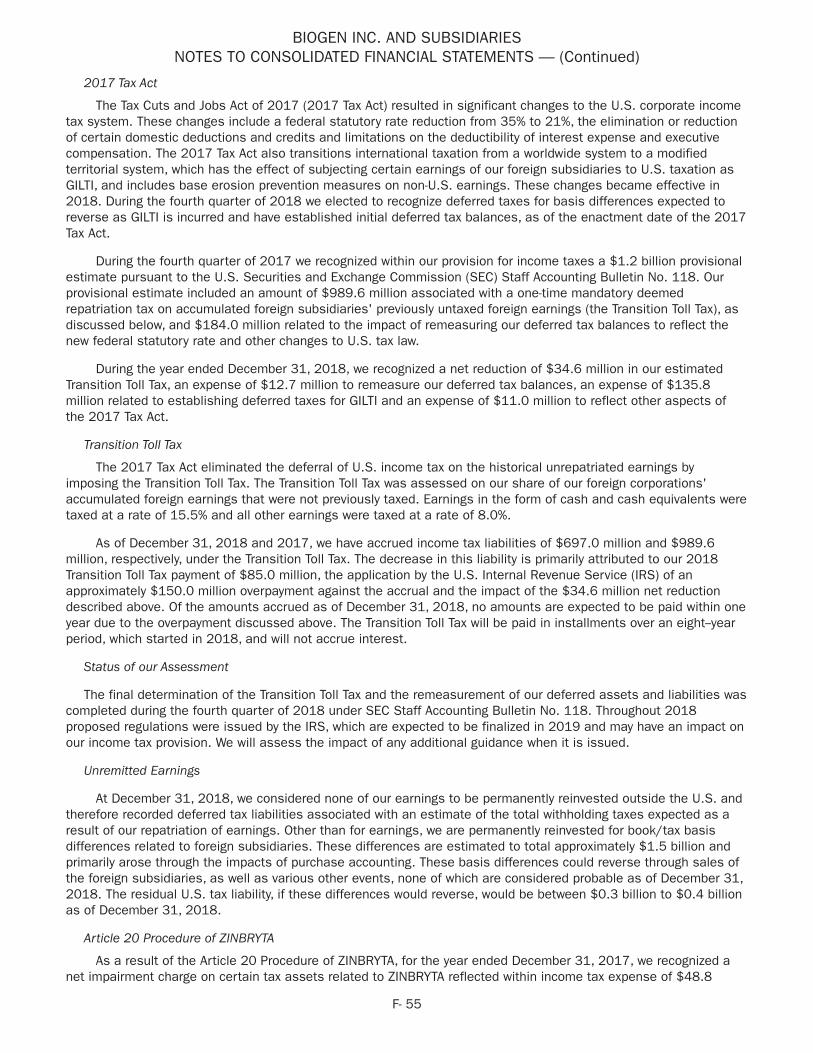
BIOGEN INC. AND SUBSIDIARIESNOTES TO CONSOLIDATED FINANCIAL STATEMENTS — (Continued)
F- 55
2017 Tax Act
The Tax Cuts and Jobs Act of 2017 (2017 Tax Act) resulted in significant changes to the U.S. corporate income tax system. These changes include a federal statutory rate reduction from 35% to 21%, the elimination or reduction of certain domestic deductions and credits and limitations on the deductibility of interest expense and executive compensation. The 2017 Tax Act also transitions international taxation from a worldwide system to a modified territorial system, which has the effect of subjecting certain earnings of our foreign subsidiaries to U.S. taxation as GILTI, and includes base erosion prevention measures on non-U.S. earnings. These changes became effective in 2018. During the fourth quarter of 2018 we elected to recognize deferred taxes for basis differences expected to reverse as GILTI is incurred and have established initial deferred tax balances, as of the enactment date of the 2017 Tax Act.
During the fourth quarter of 2017 we recognized within our provision for income taxes a $1.2 billion provisional estimate pursuant to the U.S. Securities and Exchange Commission (SEC) Staff Accounting Bulletin No. 118. Our provisional estimate included an amount of $989.6 million associated with a one-time mandatory deemed repatriation tax on accumulated foreign subsidiaries' previously untaxed foreign earnings (the Transition Toll Tax), as discussed below, and $184.0 million related to the impact of remeasuring our deferred tax balances to reflect the new federal statutory rate and other changes to U.S. tax law.
During the year ended December 31, 2018, we recognized a net reduction of $34.6 million in our estimated Transition Toll Tax, an expense of $12.7 million to remeasure our deferred tax balances, an expense of $135.8 million related to establishing deferred taxes for GILTI and an expense of $11.0 million to reflect other aspects of the 2017 Tax Act.
Transition Toll Tax
The 2017 Tax Act eliminated the deferral of U.S. income tax on the historical unrepatriated earnings by imposing the Transition Toll Tax. The Transition Toll Tax was assessed on our share of our foreign corporations' accumulated foreign earnings that were not previously taxed. Earnings in the form of cash and cash equivalents were taxed at a rate of 15.5% and all other earnings were taxed at a rate of 8.0%.
As of December 31, 2018 and 2017, we have accrued income tax liabilities of $697.0 million and $989.6 million, respectively, under the Transition Toll Tax. The decrease in this liability is primarily attributed to our 2018 Transition Toll Tax payment of $85.0 million, the application by the U.S. Internal Revenue Service (IRS) of an approximately $150.0 million overpayment against the accrual and the impact of the $34.6 million net reduction described above. Of the amounts accrued as of December 31, 2018, no amounts are expected to be paid within one year due to the overpayment discussed above. The Transition Toll Tax will be paid in installments over an eight--year period, which started in 2018, and will not accrue interest.
Status of our Assessment
The final determination of the Transition Toll Tax and the remeasurement of our deferred assets and liabilities was completed during the fourth quarter of 2018 under SEC Staff Accounting Bulletin No. 118. Throughout 2018 proposed regulations were issued by the IRS, which are expected to be finalized in 2019 and may have an impact on our income tax provision. We will assess the impact of any additional guidance when it is issued.
Unremitted Earnings
At December 31, 2018, we considered none of our earnings to be permanently reinvested outside the U.S. and therefore recorded deferred tax liabilities associated with an estimate of the total withholding taxes expected as a result of our repatriation of earnings. Other than for earnings, we are permanently reinvested for book/tax basis differences related to foreign subsidiaries. These differences are estimated to total approximately $1.5 billion and primarily arose through the impacts of purchase accounting. These basis differences could reverse through sales of the foreign subsidiaries, as well as various other events, none of which are considered probable as of December 31, 2018. The residual U.S. tax liability, if these differences would reverse, would be between $0.3 billion to $0.4 billion as of December 31, 2018.
Article 20 Procedure of ZINBRYTA
As a result of the Article 20 Procedure of ZINBRYTA, for the year ended December 31, 2017, we recognized a net impairment charge on certain tax assets related to ZINBRYTA reflected within income tax expense of $48.8
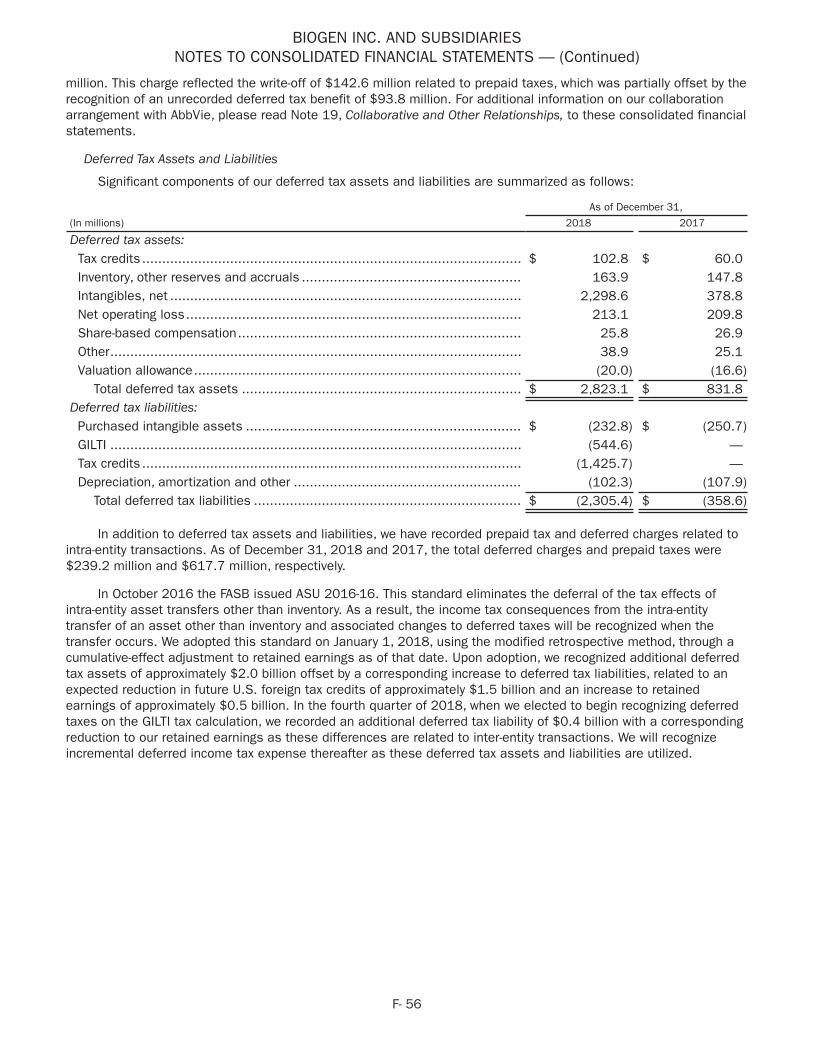
BIOGEN INC. AND SUBSIDIARIESNOTES TO CONSOLIDATED FINANCIAL STATEMENTS — (Continued)
F- 56
million. This charge reflected the write-off of $142.6 million related to prepaid taxes, which was partially offset by the recognition of an unrecorded deferred tax benefit of $93.8 million. For additional information on our collaboration arrangement with AbbVie, please read Note 19, Collaborative and Other Relationships, to these consolidated financial statements.
Deferred Tax Assets and Liabilities
Significant components of our deferred tax assets and liabilities are summarized as follows:
As of December 31,
(In millions) 2018 2017
Deferred tax assets:Tax credits ............................................................................................... $ 102.8 $ 60.0Inventory, other reserves and accruals ....................................................... 163.9 147.8Intangibles, net ........................................................................................ 2,298.6 378.8Net operating loss.................................................................................... 213.1 209.8Share-based compensation....................................................................... 25.8 26.9Other....................................................................................................... 38.9 25.1Valuation allowance.................................................................................. (20.0) (16.6)
Total deferred tax assets ...................................................................... $ 2,823.1 $ 831.8Deferred tax liabilities:Purchased intangible assets ..................................................................... $ (232.8) $ (250.7)GILTI ....................................................................................................... (544.6) —Tax credits ............................................................................................... (1,425.7) —Depreciation, amortization and other ......................................................... (102.3) (107.9)
Total deferred tax liabilities ................................................................... $ (2,305.4) $ (358.6)
In addition to deferred tax assets and liabilities, we have recorded prepaid tax and deferred charges related to intra-entity transactions. As of December 31, 2018 and 2017, the total deferred charges and prepaid taxes were $239.2 million and $617.7 million, respectively.
In October 2016 the FASB issued ASU 2016-16. This standard eliminates the deferral of the tax effects of intra-entity asset transfers other than inventory. As a result, the income tax consequences from the intra-entity transfer of an asset other than inventory and associated changes to deferred taxes will be recognized when the transfer occurs. We adopted this standard on January 1, 2018, using the modified retrospective method, through a cumulative-effect adjustment to retained earnings as of that date. Upon adoption, we recognized additional deferred tax assets of approximately $2.0 billion offset by a corresponding increase to deferred tax liabilities, related to an expected reduction in future U.S. foreign tax credits of approximately $1.5 billion and an increase to retained earnings of approximately $0.5 billion. In the fourth quarter of 2018, when we elected to begin recognizing deferred taxes on the GILTI tax calculation, we recorded an additional deferred tax liability of $0.4 billion with a corresponding reduction to our retained earnings as these differences are related to inter-entity transactions. We will recognize incremental deferred income tax expense thereafter as these deferred tax assets and liabilities are utilized.
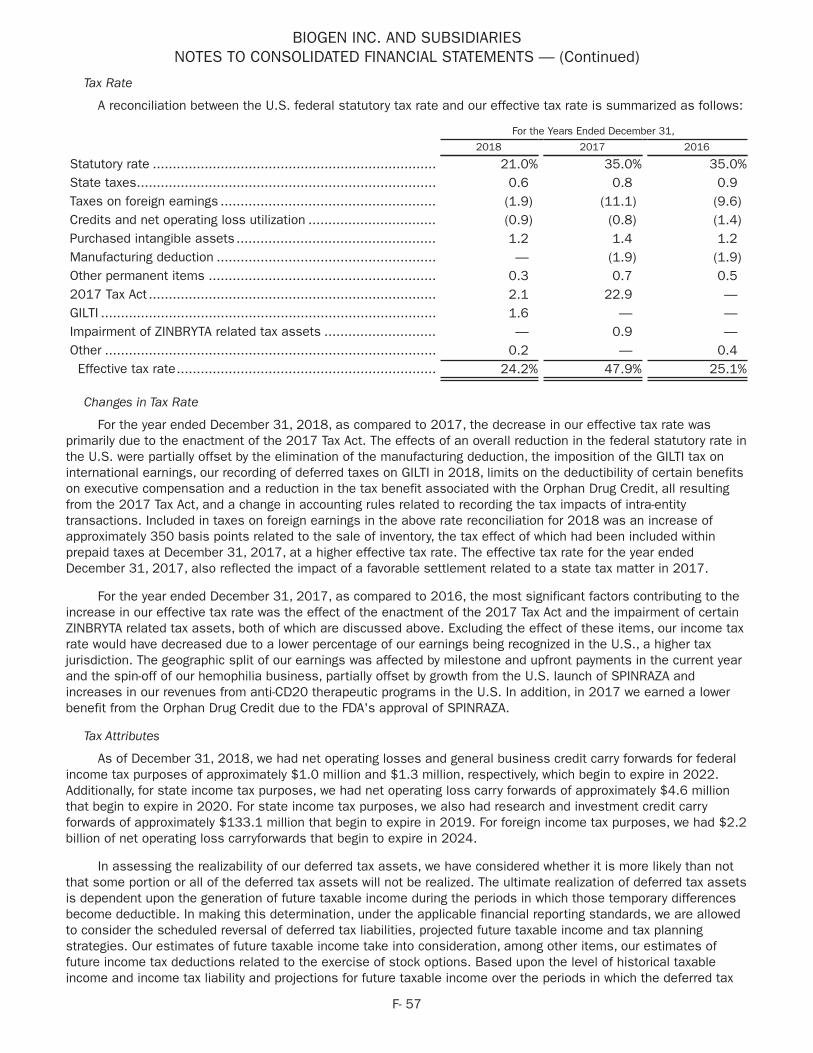
BIOGEN INC. AND SUBSIDIARIESNOTES TO CONSOLIDATED FINANCIAL STATEMENTS — (Continued)
F- 57
Tax Rate
A reconciliation between the U.S. federal statutory tax rate and our effective tax rate is summarized as follows:
For the Years Ended December 31,
2018 2017 2016
Statutory rate ....................................................................... 21.0% 35.0% 35.0%State taxes........................................................................... 0.6 0.8 0.9Taxes on foreign earnings ...................................................... (1.9) (11.1) (9.6)Credits and net operating loss utilization ................................ (0.9) (0.8) (1.4)Purchased intangible assets .................................................. 1.2 1.4 1.2Manufacturing deduction ....................................................... — (1.9) (1.9)Other permanent items ......................................................... 0.3 0.7 0.52017 Tax Act ........................................................................ 2.1 22.9 —GILTI .................................................................................... 1.6 — —Impairment of ZINBRYTA related tax assets ............................ — 0.9 —Other ................................................................................... 0.2 — 0.4Effective tax rate................................................................. 24.2% 47.9% 25.1%
Changes in Tax Rate
For the year ended December 31, 2018, as compared to 2017, the decrease in our effective tax rate was primarily due to the enactment of the 2017 Tax Act. The effects of an overall reduction in the federal statutory rate in the U.S. were partially offset by the elimination of the manufacturing deduction, the imposition of the GILTI tax on international earnings, our recording of deferred taxes on GILTI in 2018, limits on the deductibility of certain benefits on executive compensation and a reduction in the tax benefit associated with the Orphan Drug Credit, all resulting from the 2017 Tax Act, and a change in accounting rules related to recording the tax impacts of intra-entity transactions. Included in taxes on foreign earnings in the above rate reconciliation for 2018 was an increase of approximately 350 basis points related to the sale of inventory, the tax effect of which had been included within prepaid taxes at December 31, 2017, at a higher effective tax rate. The effective tax rate for the year ended December 31, 2017, also reflected the impact of a favorable settlement related to a state tax matter in 2017.
For the year ended December 31, 2017, as compared to 2016, the most significant factors contributing to the increase in our effective tax rate was the effect of the enactment of the 2017 Tax Act and the impairment of certain ZINBRYTA related tax assets, both of which are discussed above. Excluding the effect of these items, our income tax rate would have decreased due to a lower percentage of our earnings being recognized in the U.S., a higher tax jurisdiction. The geographic split of our earnings was affected by milestone and upfront payments in the current year and the spin-off of our hemophilia business, partially offset by growth from the U.S. launch of SPINRAZA and increases in our revenues from anti-CD20 therapeutic programs in the U.S. In addition, in 2017 we earned a lower benefit from the Orphan Drug Credit due to the FDA's approval of SPINRAZA.
Tax Attributes
As of December 31, 2018, we had net operating losses and general business credit carry forwards for federal income tax purposes of approximately $1.0 million and $1.3 million, respectively, which begin to expire in 2022. Additionally, for state income tax purposes, we had net operating loss carry forwards of approximately $4.6 million that begin to expire in 2020. For state income tax purposes, we also had research and investment credit carry forwards of approximately $133.1 million that begin to expire in 2019. For foreign income tax purposes, we had $2.2 billion of net operating loss carryforwards that begin to expire in 2024.
In assessing the realizability of our deferred tax assets, we have considered whether it is more likely than not that some portion or all of the deferred tax assets will not be realized. The ultimate realization of deferred tax assets is dependent upon the generation of future taxable income during the periods in which those temporary differences become deductible. In making this determination, under the applicable financial reporting standards, we are allowed to consider the scheduled reversal of deferred tax liabilities, projected future taxable income and tax planning strategies. Our estimates of future taxable income take into consideration, among other items, our estimates of future income tax deductions related to the exercise of stock options. Based upon the level of historical taxable income and income tax liability and projections for future taxable income over the periods in which the deferred tax
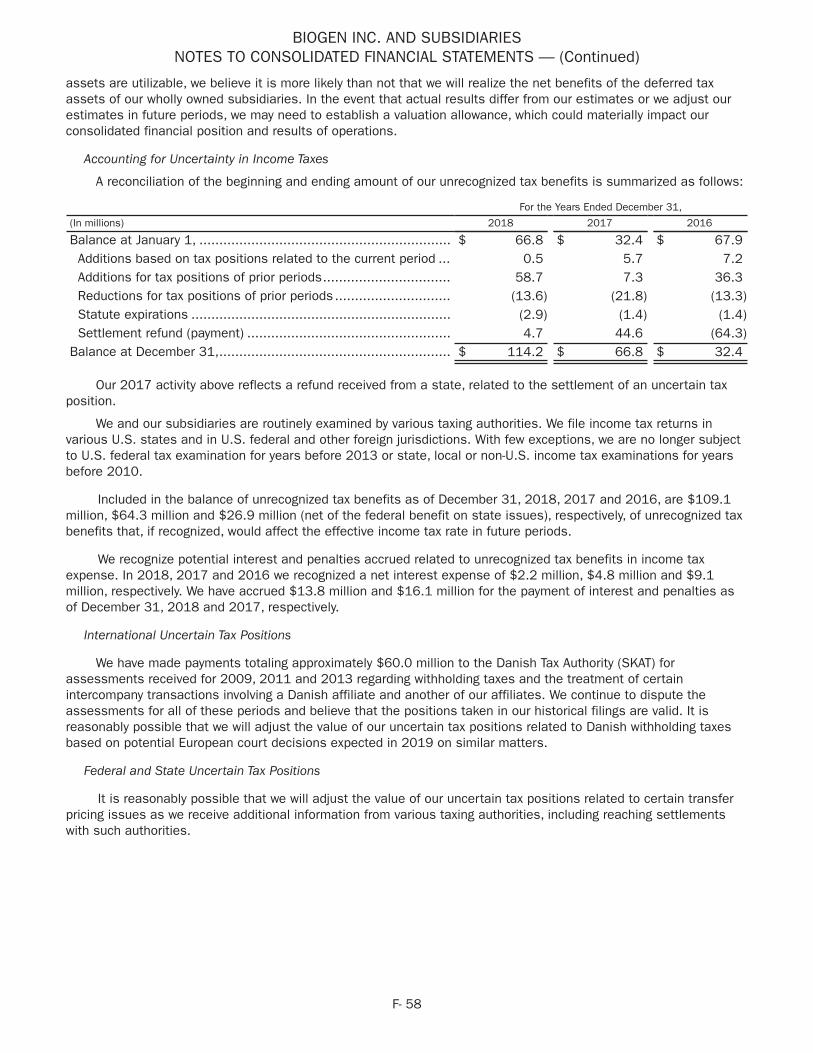
BIOGEN INC. AND SUBSIDIARIESNOTES TO CONSOLIDATED FINANCIAL STATEMENTS — (Continued)
F- 58
assets are utilizable, we believe it is more likely than not that we will realize the net benefits of the deferred tax assets of our wholly owned subsidiaries. In the event that actual results differ from our estimates or we adjust our estimates in future periods, we may need to establish a valuation allowance, which could materially impact our consolidated financial position and results of operations.
Accounting for Uncertainty in Income Taxes
A reconciliation of the beginning and ending amount of our unrecognized tax benefits is summarized as follows:
For the Years Ended December 31,
(In millions) 2018 2017 2016
Balance at January 1, ............................................................... $ 66.8 $ 32.4 $ 67.9Additions based on tax positions related to the current period ... 0.5 5.7 7.2Additions for tax positions of prior periods................................ 58.7 7.3 36.3Reductions for tax positions of prior periods ............................. (13.6) (21.8) (13.3)Statute expirations ................................................................. (2.9) (1.4) (1.4)Settlement refund (payment) ................................................... 4.7 44.6 (64.3)
Balance at December 31,.......................................................... $ 114.2 $ 66.8 $ 32.4
Our 2017 activity above reflects a refund received from a state, related to the settlement of an uncertain tax position.
We and our subsidiaries are routinely examined by various taxing authorities. We file income tax returns in various U.S. states and in U.S. federal and other foreign jurisdictions. With few exceptions, we are no longer subject to U.S. federal tax examination for years before 2013 or state, local or non-U.S. income tax examinations for years before 2010.
Included in the balance of unrecognized tax benefits as of December 31, 2018, 2017 and 2016, are $109.1 million, $64.3 million and $26.9 million (net of the federal benefit on state issues), respectively, of unrecognized tax benefits that, if recognized, would affect the effective income tax rate in future periods.
We recognize potential interest and penalties accrued related to unrecognized tax benefits in income tax expense. In 2018, 2017 and 2016 we recognized a net interest expense of $2.2 million, $4.8 million and $9.1 million, respectively. We have accrued $13.8 million and $16.1 million for the payment of interest and penalties as of December 31, 2018 and 2017, respectively.
International Uncertain Tax Positions
We have made payments totaling approximately $60.0 million to the Danish Tax Authority (SKAT) for assessments received for 2009, 2011 and 2013 regarding withholding taxes and the treatment of certain intercompany transactions involving a Danish affiliate and another of our affiliates. We continue to dispute the assessments for all of these periods and believe that the positions taken in our historical filings are valid. It is reasonably possible that we will adjust the value of our uncertain tax positions related to Danish withholding taxes based on potential European court decisions expected in 2019 on similar matters.
Federal and State Uncertain Tax Positions
It is reasonably possible that we will adjust the value of our uncertain tax positions related to certain transfer pricing issues as we receive additional information from various taxing authorities, including reaching settlements with such authorities.
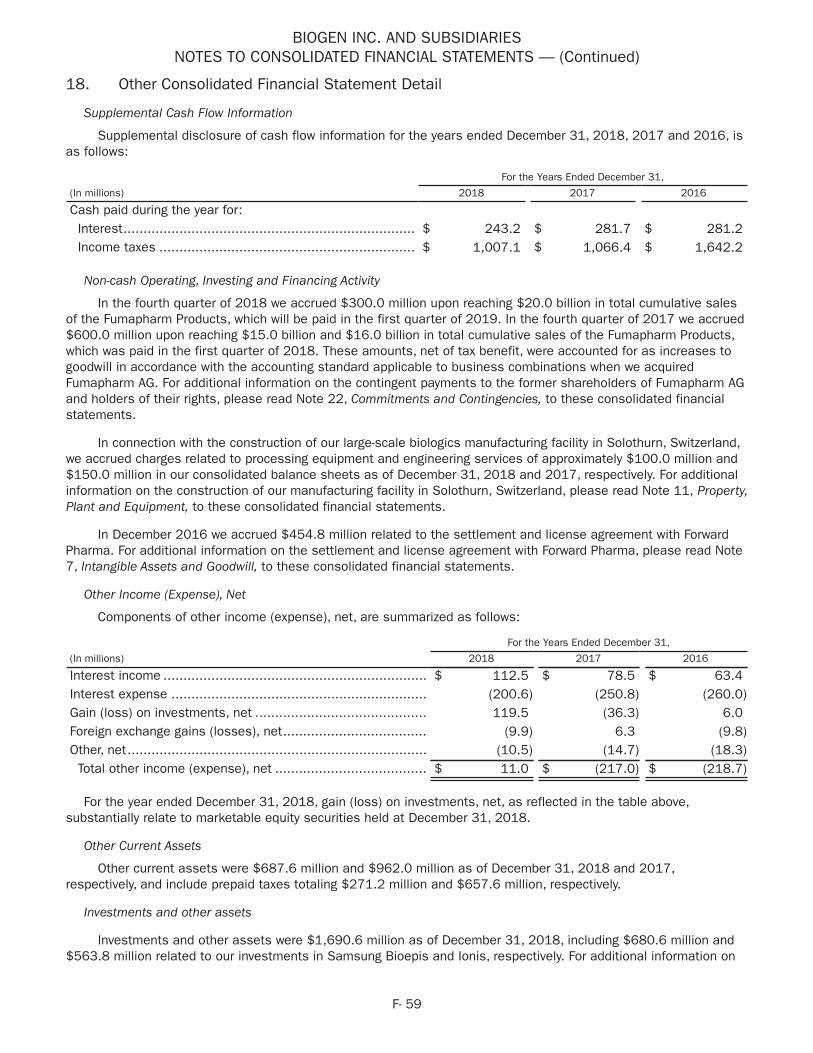
BIOGEN INC. AND SUBSIDIARIESNOTES TO CONSOLIDATED FINANCIAL STATEMENTS — (Continued)
F- 59
18. Other Consolidated Financial Statement Detail
Supplemental Cash Flow Information
Supplemental disclosure of cash flow information for the years ended December 31, 2018, 2017 and 2016, is as follows:
For the Years Ended December 31,
(In millions) 2018 2017 2016
Cash paid during the year for:Interest......................................................................... $ 243.2 $ 281.7 $ 281.2Income taxes ................................................................ $ 1,007.1 $ 1,066.4 $ 1,642.2
Non-cash Operating, Investing and Financing Activity
In the fourth quarter of 2018 we accrued $300.0 million upon reaching $20.0 billion in total cumulative sales of the Fumapharm Products, which will be paid in the first quarter of 2019. In the fourth quarter of 2017 we accrued $600.0 million upon reaching $15.0 billion and $16.0 billion in total cumulative sales of the Fumapharm Products, which was paid in the first quarter of 2018. These amounts, net of tax benefit, were accounted for as increases to goodwill in accordance with the accounting standard applicable to business combinations when we acquired Fumapharm AG. For additional information on the contingent payments to the former shareholders of Fumapharm AG and holders of their rights, please read Note 22, Commitments and Contingencies, to these consolidated financial statements.
In connection with the construction of our large-scale biologics manufacturing facility in Solothurn, Switzerland, we accrued charges related to processing equipment and engineering services of approximately $100.0 million and $150.0 million in our consolidated balance sheets as of December 31, 2018 and 2017, respectively. For additional information on the construction of our manufacturing facility in Solothurn, Switzerland, please read Note 11, Property, Plant and Equipment, to these consolidated financial statements.
In December 2016 we accrued $454.8 million related to the settlement and license agreement with Forward Pharma. For additional information on the settlement and license agreement with Forward Pharma, please read Note 7, Intangible Assets and Goodwill, to these consolidated financial statements.
Other Income (Expense), Net
Components of other income (expense), net, are summarized as follows:
For the Years Ended December 31,
(In millions) 2018 2017 2016
Interest income .................................................................. $ 112.5 $ 78.5 $ 63.4Interest expense ................................................................ (200.6) (250.8) (260.0)Gain (loss) on investments, net ........................................... 119.5 (36.3) 6.0Foreign exchange gains (losses), net.................................... (9.9) 6.3 (9.8)Other, net........................................................................... (10.5) (14.7) (18.3)Total other income (expense), net ...................................... $ 11.0 $ (217.0) $ (218.7)
For the year ended December 31, 2018, gain (loss) on investments, net, as reflected in the table above, substantially relate to marketable equity securities held at December 31, 2018.
Other Current Assets
Other current assets were $687.6 million and $962.0 million as of December 31, 2018 and 2017, respectively, and include prepaid taxes totaling $271.2 million and $657.6 million, respectively.
Investments and other assets
Investments and other assets were $1,690.6 million as of December 31, 2018, including $680.6 million and $563.8 million related to our investments in Samsung Bioepis and Ionis, respectively. For additional information on

BIOGEN INC. AND SUBSIDIARIESNOTES TO CONSOLIDATED FINANCIAL STATEMENTS — (Continued)
F- 60
our collaboration arrangements with Samsung Bioepis and Ionis, please read Note 19, Collaborative and Other Relationships, to these consolidated financial statements.
Accrued Expenses and Other
Accrued expenses and other consists of the following:
As of December 31,
(In millions) 2018 2017
Revenue-related reserves for discounts and allowances ................................ $ 874.7 $ 572.0Current portion of contingent consideration obligations ................................. 444.8 844.6Employee compensation and benefits .......................................................... 320.9 297.7Royalties and licensing fees ........................................................................ 224.7 206.7Construction in progress ............................................................................. 125.2 159.7Collaboration expenses............................................................................... 261.6 183.7Other ......................................................................................................... 609.3 636.9
Total accrued expenses and other.............................................................. $ 2,861.2 $ 2,901.3
Other Long-term Liabilities
Other long-term liabilities were $1,389.4 million and $1,628.7 million as of December 31, 2018 and 2017, respectively, and include accrued income taxes totaling $791.4 million and $979.8 million, respectively.
19. Collaborative and Other RelationshipsIn connection with our business strategy, we have entered into various collaboration agreements that provide
us with rights to develop, produce and market products using certain know-how, technology and patent rights maintained by our collaborative partners. Terms of the various collaboration agreements may require us to make milestone payments upon the achievement of certain product research and development objectives and pay royalties on future sales, if any, of commercial products resulting from the collaboration.
Depending on the collaborative arrangement, we may record funding receivable or payable balances with our partners, based on the nature of the cost-sharing mechanism and activity within the collaboration. Our significant collaboration arrangements are discussed below.
Genentech, Inc. (Roche Group)
We have certain business and financial rights with respect to RITUXAN for the treatment of non-Hodgkin's lymphoma, CLL and other conditions, RITUXAN HYCELA for the treatment of non-Hodgkin's lymphoma and CLL, GAZYVA for the treatment of CLL and follicular lymphoma, OCREVUS for the treatment of PPMS and RMS and other potential anti-CD20 therapies pursuant to our collaboration arrangements with Genentech, a wholly-owned member of the Roche Group. For purposes of this footnote we refer to RITUXAN and RITUXAN HYCELA collectively as RITUXAN.
Our collaboration arrangements will continue in effect until we mutually agree to terminate the collaboration, except that if we undergo a change in control, as defined in our collaboration agreement, Genentech has the right to present an offer to buy the rights to RITUXAN and we must either accept Genentech’s offer or purchase Genentech’s rights on the same terms as its offer. Genentech will also be deemed concurrently to have purchased our rights to any other anti-CD20 products in development in exchange for a royalty and our rights to GAZYVA in exchange for the compensation described in the table below. Our collaboration with Genentech was created through a contractual arrangement and not through a joint venture or other legal entity.
RITUXAN
Genentech and its affiliates are responsible for the worldwide manufacture of RITUXAN, as well as all development and commercialization activities as follows:
U.S.
We have co-exclusively licensed our rights to develop, commercialize and market RITUXAN in the U.S.
BIOGEN INC. AND SUBSIDIARIESNOTES TO CONSOLIDATED FINANCIAL STATEMENTS — (Continued)
F- 61
Canada
We have co-exclusively licensed our rights to develop, commercialize and market RITUXAN in Canada.
GAZYVA
The Roche Group and its sub-licensees maintain sole responsibility for the development, manufacture and commercialization of GAZYVA in the U.S. We recognize our share of the development and commercialization expenses of GAZYVA as a reduction of our share of pre-tax profits in revenues from anti-CD20 therapeutic programs.
Commercialization of GAZYVA impacts our percentage of the co-promotion profits for RITUXAN, as summarized in the table below.
OCREVUS
In March 2017 the FDA approved OCREVUS for the treatment of RMS and PPMS. Pursuant to the terms of our collaboration arrangements with Genentech, we receive a tiered royalty on U.S. net sales from 13.5% and increasing up to 24% if annual net sales exceed $900.0 million. There will be a 50% reduction to these royalties if a biosimilar to OCREVUS is approved in the U.S.
In addition, we receive a gross 3% royalty on net sales of OCREVUS outside the U.S., with the royalty period lasting 11 years from the first commercial sale of OCREVUS on a country-by-country basis. OCREVUS has been approved for the treatment of RMS and PPMS in the E.U. and certain other countries.
The commercialization of OCREVUS does not impact the percentage of the co-promotion profits we receive for RITUXAN or GAZYVA. Genentech is solely responsible for development and commercialization of OCREVUS and funding future costs. Genentech cannot develop OCREVUS in CLL, non-Hodgkin's lymphoma or rheumatoid arthritis. OCREVUS royalty revenues were based on our estimates from third party and market research data of OCREVUS sales occurring during the corresponding period. Differences between actual and estimated royalty revenues will be adjusted for in the period in which they become known, which is expected to be the following quarter.
Profit-sharing Formulas
RITUXAN Profit Share
Our current pretax co-promotion profit-sharing formula for RITUXAN provides for a 30% share on the first $50.0 million of co-promotion operating profits earned each calendar year. Our share of annual co-promotion profits in excess of $50.0 million varies, as summarized in the table below, upon the following events:
Until GAZYVA First Non-CLL FDA Approval .............................................................................. 40.0%
After GAZYVA First Non-CLL FDA Approval until First GAZYVA Threshold Date ............................ 39.0%
After First GAZYVA Threshold Date until Second GAZYVA Threshold Date ................................. 37.5%
After Second GAZYVA Threshold Date ................................................................................... 35.0%
First Non-CLL GAZYVA FDA Approval means the FDA’s first approval of GAZYVA in an indication other than CLL.
First GAZYVA Threshold Date means the earlier of (i) the date of the First Non-CLL GAZYVA FDA approval if U.S. gross sales of GAZYVA for the preceding consecutive 12-month period were at least $150.0 million or (ii) the first day of the calendar quarter after the date of the First Non-CLL GAZYVA FDA Approval that U.S. gross sales of GAZYVA within any consecutive 12-month period have reached $150.0 million.
Second GAZYVA Threshold Date means the first day of the calendar quarter after U.S. gross sales of GAZYVA within any consecutive 12-month period have reached $500.0 million. The Second GAZYVA Threshold Date can be achieved regardless of whether GAZYVA has been approved in a non-CLL indication.
Our share of RITUXAN pre-tax profits in the U.S. decreased to 39% from 40% in February 2016 when GAZYVA was approved by the FDA as a new treatment for follicular lymphoma and further decreased to 37.5% in the third quarter of 2017 as gross sales of GAZYVA in the U.S. for the preceding 12-month period exceeded $150.0 million.
In addition, should the FDA approve an anti-CD20 product other than OCREVUS or GAZYVA that is acquired or developed by Genentech and subject to the collaboration agreement, our share of the co-promotion operating profits would be between 30% and 37.5% based on certain events.

BIOGEN INC. AND SUBSIDIARIESNOTES TO CONSOLIDATED FINANCIAL STATEMENTS — (Continued)
F- 62
GAZYVA Profit Share
Our current pretax profit-sharing formula for GAZYVA provides for a 35% share on the first $50.0 million of operating profits earned each calendar year. Our share of annual profits in excess of $50.0 million varies, as summarized in the table below, upon the following events:
Until First GAZYVA Threshold Date ........................................................................................ 39.0%
After First GAZYVA Threshold Date until Second GAZYVA Threshold Date ................................. 37.5%
After Second GAZYVA Threshold Date ................................................................................... 35.0%
In 2018 the 37.5% GAZYVA profit-sharing threshold was met during the third quarter. In 2017 and 2016 our share of operating profits on GAZYVA was 35%.
In November 2017 the FDA approved GAZYVA in combination with chemotherapy, followed by GAZYVA alone, for people with previously untreated advanced follicular lymphoma.
Revenues from Anti-CD20 Therapeutic Programs
Revenues from anti-CD20 therapeutic programs are summarized as follows:
For the Years Ended December 31,
(In millions) 2018 2017 2016
Biogen's share of pre-tax profits in the U.S. for RITUXAN andGAZYVA, including the reimbursement of selling anddevelopment expenses ........................................................ $ 1,431.9 $ 1,316.4 $ 1,249.5Other revenues from anti-CD20 therapeutic programs ............ 548.3 242.8 65.0
Total revenues from anti-CD20 therapeutic programs ....... $ 1,980.2 $ 1,559.2 $ 1,314.5
In 2018 the 37.5% RITUXAN profit-sharing threshold was met during the first quarter. In 2017 the 39% profit-sharing threshold was met during the first quarter and further decreased to 37.5% in the third quarter of 2017 as gross sales of GAZYVA in the U.S. for the preceding 12-month period exceeded $150.0 million. In 2016, the 39% profit-sharing threshold was met during the first quarter.
Prior to regulatory approval, we record our share of the expenses incurred by the collaboration for the development of anti-CD20 products in research and development expense in our consolidated statements of income. After an anti-CD20 product is approved, we record our share of the development expenses related to that product as a reduction of our share of pre-tax profits in revenues from anti-CD20 therapeutic programs.
Ionis Pharmaceuticals, Inc.
Product Collaborations
SPINRAZA
In January 2012 we entered into an exclusive worldwide option and collaboration agreement with Ionis to develop and commercialize SPINRAZA for the treatment of SMA. SPINRAZA was approved for the treatment of SMA in the U.S., E.U. and Japan in December 2016, June 2017 and July 2017, respectively.
For the years ended December 31, 2018, 2017 and 2016, we recognized product revenues of $1,724.2 million, $883.7 million and $4.6 million, respectively, on our sales of SPINRAZA. Under our agreement with Ionis, we make royalty payments to Ionis on annual worldwide net sales of SPINRAZA using a tiered royalty rate between 11% and 15%, which are recognized in cost of sales within our consolidated statements of income. Royalty cost of sales related to sales of SPINRAZA for the years ended December 31, 2018, 2017 and 2016, totaled $238.0 million, $112.4 million and $0.5 million, respectively.
During the third quarter of 2016, upon the exercise of our option to develop and commercialize SPINRAZA, we paid a $75.0 million license fee to Ionis, which was recorded as research and development expense in our consolidated statements of income. In addition, during 2017 we made milestone payments to Ionis totaling $150.0 million related to the marketing approvals discussed above, which were capitalized in intangible assets, net in our consolidated balance sheets.

BIOGEN INC. AND SUBSIDIARIESNOTES TO CONSOLIDATED FINANCIAL STATEMENTS — (Continued)
F- 63
During 2018 and 2017 no clinical trial payments were made to Ionis due to the completion of study activities. During 2016 we made clinical trial payments of $35.3 million related to the advancement of the program, which were recorded in investments and other assets in our consolidated balance sheets as they represented prepaid research and development expenditures. As of December 31, 2017, these prepaid research and development amounts were fully expensed as the services were provided.
For the years ending December 31, 2018, 2017 and 2016, $285.0 million, $234.5 million and $257.8 million, respectively, were reflected in total costs and expenses in our consolidated statements of income related to the advancement and commercialization of the program.
Antisense Therapeutics
In December 2012 we entered into an agreement with Ionis for the development and commercialization of up to three therapeutic targets.
Under this agreement, Ionis is responsible for global development of any product candidate through the completion of a Phase 2 trial and we will provide advice on the clinical trial design and regulatory strategy. We have an option to license the product candidate until completion of the Phase 2 trial. If we exercise our option, we will pay a license fee of up to $70.0 million to Ionis and assume global development, regulatory and commercialization responsibilities. Ionis is eligible to receive up to another $130.0 million in milestone payments upon the achievement of certain regulatory milestones as well as royalties on future sales if we successfully develop the product candidate after option exercise.
Upon entering into this agreement, we made an upfront payment of $30.0 million to Ionis and agreed to make potential additional payments, prior to licensing, of up to $10.0 million based on the development of the selected product candidate as well as a mark-up of the cost estimate of the Phase 1 and Phase 2 trials. During 2015 we recognized this $10.0 million developmental milestone upon the selection of BIIB080 (also known as IONIS-MAPTRx), which is currently in Phase 1 development for the treatment of AD.
Research Collaborations
2018 Ionis Agreement
In June 2018 we closed the 2018 Ionis Agreement, which is a 10-year exclusive agreement with Ionis to develop novel ASO drug candidates for a broad range of neurological diseases for a total payment of $1.0 billion, consisting of an upfront payment of $375.0 million and the purchase of approximately 11.5 million shares of Ionis' common stock at a cost of $625.0 million.
Upon closing, we recorded $50.9 million of the $375.0 million upfront payment as prepaid services in our consolidated balance sheets and recognized the remaining $324.1 million as research and development expense in our consolidated statements of income. The amount recorded as prepaid services represented the value of the employee resources committed to the arrangement to provide research and discovery services over the term of the agreement.
The 11.5 million shares of Ionis' common stock were purchased at a premium to their fair value at the transaction closing date. The premium consisted of acquiring the shares at a price above the fair value based on the trailing 10-day weighted-average close price prior to entering into the 2018 Ionis Agreement in April 2018 and the effect of certain holding period restrictions. We recorded an asset of $462.9 million in investments and other assets in our consolidated balance sheets reflecting the fair value of the common stock as of the purchase date and a charge of $162.1 million to research and development expense in our consolidated statements of income in the second quarter of 2018 reflecting the premium paid for the common stock.
Our investment in Ionis' common stock is remeasured each reporting period. Changes in the fair value of our investment in Ionis' common stock, including the effect of the holding period restrictions, are reflected in other income (expense), net in our consolidated statements of income. For additional information on the fair value of our investment in Ionis' common stock, please read Note 9, Financial Instruments, to these consolidated financial statements.
We have the option to license therapies arising out of this agreement and will be responsible for the development and commercialization of such therapies. We may pay development milestones to Ionis of up to $125.0
BIOGEN INC. AND SUBSIDIARIESNOTES TO CONSOLIDATED FINANCIAL STATEMENTS — (Continued)
F- 64
million or $270.0 million for each program, depending on the indication plus an annual license fee, as well as royalties on potential net commercial sales.
2017 SMA Collaboration Agreement
In December 2017 we entered into a new collaboration agreement with Ionis to identify new ASO drug candidates for the treatment of SMA. Under this agreement, we have the option to license therapies arising out of this collaboration and will be responsible for their development and commercialization of these therapies.
Upon entering into this agreement, we made a $25.0 million upfront payment to Ionis and we may pay Ionis up to $260.0 million in additional development and regulatory milestone payments if new drug candidates advance to marketing approval. Upon commercialization, we may also pay Ionis up to $800.0 million in additional performance-based milestone payments and tiered royalties on potential net sales of such therapies.
2013 Long-term Strategic Research Agreement
In September 2013 we entered into a six-year research collaboration agreement with Ionis under which both companies collaborate to perform discovery level research and subsequent development and commercialization activities of antisense or other therapeutics for the treatment of neurological diseases. Under this agreement, Ionis performs research on a set of neurological targets identified within the agreement.
Ionis is eligible to receive milestone payments, license fees and royalty payments for all product candidates developed through this collaboration, with the specific amount dependent upon the modality of the product candidate advanced by us under the terms of the 2013 agreement.
For non-ALS antisense product candidates, Ionis will be responsible for global development through the completion of a Phase 2 trial and we will provide advice on the clinical trial design and regulatory strategy. For ALS antisense product candidates, we are responsible for global development, clinical trial design and regulatory strategy. We have an option to license a product candidate until completion of the Phase 2 trial. If we exercise our option, we will pay Ionis up to a $70.0 million license fee and assume global development, regulatory and commercialization responsibilities. Ionis could receive additional milestone payments upon the achievement of certain regulatory milestones of up to $130.0 million, plus additional amounts related to the cost of clinical trials conducted by Ionis under the collaboration, and royalties on future sales if we successfully develop the product candidate after option exercise.
In December 2018 we exercised our option with Ionis and obtained a worldwide, exclusive, royalty-bearing license to develop and commercialize BIIB067 (IONIS-SOD1Rx), an investigational treatment for ALS with superoxide dismutase 1 (SOD1) mutations. In connection with the option exercise, we made an upfront payment of $35.0 million to Ionis. Future payments may include potential post-licensing milestone payments of up to $55.0 million and royalties in the low to mid-teen percentages on potential annual worldwide net sales. We are solely responsible for the costs and expenses related to the development, manufacturing and commercialization of BIIB067 following the option exercise. During the years ending December 31, 2018, 2017 and 2016, we incurred milestones of $53.0 million, $12.0 million and $5.5 million, respectively, related to the advancement of BIIB067 and other neurological targets identified.
Eisai Co., Ltd.
BAN2401 and Elenbecestat Collaboration
We have a collaboration agreement with Eisai Co., Ltd. (Eisai) to jointly develop and commercialize BAN2401, a monoclonal antibody that targets amyloid beta aggregates, and elenbecestat, the oral BACE (base amyloid cleaving enzyme) inhibitor, two Eisai product candidates for the treatment of AD (the BAN2401 and Elenbecestat Collaboration). Eisai serves as the global operational and regulatory lead for BAN2401 and elenbecestat and all costs, including research, development, sales and marketing expenses, are shared equally between us and Eisai; and, if applicable, upon marketing approval in major markets, such as the U.S., the E.U. and Japan, we and Eisai will co-promote BAN2401 and elenbecestat and share profits equally. In smaller markets, Eisai will distribute these products and pay us a royalty. In addition, the BAN2401 and Elenbecestat Collaboration provides both parties with certain rights and obligations in the event of a change in control of either party.
The BAN2401 and Elenbecestat Collaboration also provided Eisai with an option to jointly develop and commercialize aducanumab, our anti-amyloid beta antibody candidate for the treatment of AD (Aducanumab Option),
BIOGEN INC. AND SUBSIDIARIESNOTES TO CONSOLIDATED FINANCIAL STATEMENTS — (Continued)
F- 65
and an option to jointly develop and commercialize one of our anti-tau monoclonal antibodies (Anti-Tau Option). Upon exercise of each of the Aducanumab Option and the Anti-Tau Option, a separate collaboration agreement would be entered into with Eisai on terms and conditions that mirror the BAN2401 and Elenbecestat Collaboration agreement. Eisai has not yet exercised its Anti-Tau Option.
In October 2017 Eisai exercised its Aducanumab Option and we entered into a new collaboration agreement for the joint development and commercialization of aducanumab (Aducanumab Collaboration Agreement).
Under the Aducanumab Collaboration Agreement, the two companies will continue to jointly develop BAN2401 and elenbecestat in accordance with the BAN2401 and Elenbecestat Collaboration; however, we are no longer required to pay Eisai any milestone payments for products containing BAN2401 and we are no longer entitled to any potential development and commercial milestone payments from Eisai in relation to aducanumab. The two companies will co-promote aducanumab with a region-based profit split and we will continue to lead the ongoing Phase 3 development of aducanumab.
For the years ended December 31, 2018, 2017 and 2016, sales and marketing expenses related to the BAN2401 and Elenbecestat Collaboration were immaterial.
A summary of development expenses related to the BAN2401 and Elenbecestat Collaboration is as follows:
For the Years Ended December 31,
(In millions) 2018 2017 2016
Total development expense incurred by the collaboration relatedto the advancement of BAN2401 and Elenbecestat .................... $ 232.0 $ 146.2 $ 95.1Biogen's share of BAN2401 and Elenbecestat developmentexpense reflected in research and development expense in ourconsolidated statements of income ........................................... $ 116.0 $ 74.3 $ 50.5
In addition, during the fourth quarter of 2016 we recognized a $50.0 million milestone payment related to the initiation of a Phase 3 trial for elenbecestat, which is included in research and development expense in our consolidated statements of income. We could pay Eisai up to an additional $625.0 million under the BAN2401 and Elenbecestat Collaboration based on the future achievement of certain development, regulatory and commercial milestones.
Aducanumab Collaboration Agreement
For the period through March 31, 2018, we were responsible for 100% of development costs incurred by the collaboration for the advancement of aducanumab (aducanumab development expense). For the period April 1, 2018 through December 31, 2018, Eisai reimbursed us for 15% of aducanumab development expense incurred and beginning January 1, 2019, is reimbursing us for 45% of aducanumab development expense incurred.
Upon commercialization, both companies will co-promote aducanumab with a region-based profit split. We will receive a 55% share of the potential profits (losses) in the U.S., a 68.5% share of the potential profits (losses) in the E.U. and a 20% share of the potential profits (losses) in Japan and Asia, excluding China and South Korea. The two companies will continue to share equally in the potential profits (losses) in rest of world markets. Sales and marketing expense incurred before commercialization are shared in proportion to the same region-based profit split that will be utilized to co-promote aducanumab.
BIOGEN INC. AND SUBSIDIARIESNOTES TO CONSOLIDATED FINANCIAL STATEMENTS — (Continued)
F- 66
A summary of development and sales and marketing expenses related to the Aducanumab Collaboration Agreement is as follows:
For the Years Ended December 31,
(In millions) 2018 2017 2016
Total aducanumab development expense ...................................... $ 264.8 $ 268.7 $ 209.5Biogen's share of aducanumab development expense reflected inresearch and development expense in our consolidatedstatements of income.................................................................. $ 234.6 $ 268.7 $ 209.5
Total aducanumab sales and marketing expense incurred by thecollaboration ............................................................................... $ 50.6 $ 23.6 $ 18.3Biogen's share of aducanumab sales and marketing expensereflected in selling, general and administrative expense in ourconsolidated statements of income .............................................. $ 27.3 $ 23.6 $ 18.3
We and Eisai co-promote AVONEX, TYSABRI and TECFIDERA in Japan in certain settings and Eisai distributes AVONEX, TYSABRI, TECFIDERA and PLEGRIDY in India and other Asia-Pacific markets, excluding China.
Anti-Tau Option
Eisai may exercise the Anti-Tau Option after completion of the Phase 1 clinical trial of such anti-tau monoclonal antibody. If Eisai exercises its Anti-Tau Option, we will receive an upfront payment from Eisai and will be entitled to additional development and commercial milestone payments.
Alkermes
In November 2017 we entered into an exclusive license and collaboration agreement with Alkermes Pharma Ireland Limited, a subsidiary of Alkermes plc (Alkermes), for diroximel fumarate (BIIB098), a novel fumarate in Phase 3 development for the treatment of RMS. In December 2018 Alkermes submitted a New Drug Application (NDA) to the FDA for diroximel fumarate. Alkermes is seeking approval of diroximel fumarate under the 505(b)(2) regulatory pathway. If approved, we intend to market diroximel fumarate under the brand name VUMERITY. This name has been conditionally accepted by the FDA and will be confirmed upon approval.
Under this agreement, we received an exclusive, worldwide license to develop and commercialize diroximel fumarate and will pay Alkermes a mid-teens percentage royalty on potential worldwide net commercial sales of diroximel fumarate. Royalties payable on net commercial sales of diroximel fumarate are subject, under certain circumstances, to tiered minimum payment requirements for a period of five years following FDA approval. Alkermes is eligible to receive royalties in the high-single digits to sub-teen double digits of annual net commercial sales upon successful development and commercialization of new product candidates other than diroximel fumarate, developed under the exclusive license from Alkermes. Alkermes will maintain responsibility for regulatory interactions with the FDA through the potential approval of the NDA for diroximel fumarate.
Upon entering into this agreement, we made a $28.0 million upfront payment to Alkermes representing our share of diroximel fumarate development costs already incurred in 2017. Beginning in 2018 we became responsible for all development expenses related to diroximel fumarate. In December 2017 we also recognized a $50.0 million expense, which was paid to Alkermes in 2018, enabling the continuation of the agreement to develop diroximel fumarate. Both the $28.0 million upfront payment and $50.0 million continuation payment were recorded as research and development expense in our consolidated financial statements.
We may also pay Alkermes an additional $150.0 million milestone payment upon a regulatory achievement related to diroximel fumarate under this agreement. For the years ended December 31, 2018 and 2017, we recorded $68.7 million and $80.3 million, respectively, in research and development expense in our consolidated statements of income related to this collaboration.
In connection with the license and collaboration agreement, we may also enter into a supply agreement with Alkermes for the commercial supply of diroximel fumarate and other products developed under the license and collaboration agreement.
BIOGEN INC. AND SUBSIDIARIESNOTES TO CONSOLIDATED FINANCIAL STATEMENTS — (Continued)
F- 67
Bristol-Myers Squibb Company
In June 2017 we completed an exclusive license agreement with Bristol-Myers Squibb Company (BMS) for the development and potential commercialization of BIIB092, a Phase 2 investigational therapy with potential in AD and PSP. BIIB092 is an antibody targeting tau, the protein that forms the deposits, or tangles, in the brain associated with AD and other neurodegenerative tauopathies such as PSP.
Under this agreement, we received worldwide rights to BIIB092 and are responsible for the full development and potential commercialization of BIIB092 in AD and PSP.
Upon entering into this agreement, we made an upfront payment of $300.0 million to BMS and we may pay BMS up to $410.0 million in additional milestone payments, and potential royalties. We also assumed all remaining obligations to the former shareholders of iPierian, Inc. (iPierian) related to BMS’s acquisition of iPierian in 2014. In June 2017 we recognized a $60.0 million developmental milestone payable to the former shareholders of iPierian upon dosing of the first patient in the Phase 2 study of BIIB092 for PSP and we may pay the former shareholders of iPierian up to $490.0 million in remaining milestone payments as well as potential royalties on net commercial sales. Both the $300.0 million upfront payment and the $60.0 million developmental milestone payment were recorded as research and development expense in our consolidated statements of income.
For the year ended December 31, 2018, we recorded $97.0 million in research and development expense in our consolidated statements of income related to this collaboration.
Acorda Therapeutics, Inc.
In June 2009 we entered into a collaboration and license agreement with Acorda Therapeutics, Inc. (Acorda) to develop and commercialize products containing fampridine, such as FAMPYRA, in markets outside the U.S. We are responsible for all regulatory activities and the future clinical development of related products in those markets.
Under this agreement, we pay tiered royalties based on the level of ex-U.S. net sales and we may pay potential milestone payments based on the successful achievement of certain regulatory and commercial milestones, which would be capitalized as intangible assets upon achievement of the milestones and amortized utilizing an economic consumption model. The next expected milestone would be $15.0 million, due if ex-U.S. net sales reach $100.0 million over a period of four consecutive quarters. Royalty payments are recognized in cost of sales within our consolidated statements of income.
In connection with the collaboration and license agreement, we also entered into a supply agreement with Acorda for the commercial supply of FAMPYRA. This agreement is a sublicense arrangement of an existing agreement between Acorda and Alkermes, who acquired Elan Drug Technologies, the original party to the license with Acorda.
For the years ending December 31, 2018, 2017 and 2016, total cost of sales related to royalties and commercial supply of FAMPYRA reflected in our consolidated statements of income were $36.5 million, $34.0 million and $31.5 million, respectively.
AbbVie Inc.
We have a collaboration agreement with AbbVie for the development and commercialization of ZINBRYTA, which was approved for the treatment of RMS in the U.S. in May 2016 and in the E.U. in July 2016. In March 2018 we and AbbVie announced the voluntary worldwide withdrawal of ZINBRYTA for RMS.
Under this agreement, we and AbbVie conducted ZINBRYTA co-promotion activities in the U.S., E.U. and Canadian territories (Collaboration Territory), where development and commercialization costs and profits were shared equally. Outside of the Collaboration Territory, we were solely responsible for development and commercialization of ZINBRYTA and paid a tiered royalty to AbbVie as a percentage of net sales in the low to high teens.
We were responsible for manufacturing and research and development activities in both the Collaboration Territory and outside the Collaboration Territory and recorded these activities within their respective lines in our consolidated statements of income, net of any reimbursement of research and development expenditures received from AbbVie. For the years ended December 31, 2018, 2017 and 2016, the collaboration incurred $32.4 million,

BIOGEN INC. AND SUBSIDIARIESNOTES TO CONSOLIDATED FINANCIAL STATEMENTS — (Continued)
F- 68
$39.9 million and $48.6 million for research and development activities, respectively, for which we recognized $16.2 million, $19.9 million and $24.3 million, respectively, in our consolidated statements of income.
Research and development expense recognized in our consolidated statements of income for the year ended December 31, 2018, includes a $12.8 million charge recognized in the first quarter of 2018 related to the termination of research and development contracts and clinical trials as a result of the voluntary worldwide withdrawal of ZINBRYTA.
Prior to regulatory approval, we also recognized $22.0 million of pre-commercialization expenses within our selling, general and administrative expense, which represented 50% of the collaboration's pre-commercialization costs for 2016. After ZINBRYTA was approved by the FDA and the EMA in 2016, we began to recognize our share of the collaboration activities within the Collaboration Territories as described below under Co-promotion Profits and Losses.
Co-promotion Profits and Losses
In the U.S., AbbVie recognized revenues on sales to third parties and we recognized our 50% share of the co-promotion profits or losses as a component of total revenues in our consolidated statements of income.
The collaboration began selling ZINBRYTA in the U.S. in the third quarter of 2016 and ceased selling ZINBRYTA in the U.S. in March 2018 in connection with the voluntary worldwide withdrawal of ZINBRYTA for RMS. For the years ended December 31, 2018, 2017 and 2016, we recognized a net reduction in revenues from collaborative and other relationships, a component of other revenues, of $8.6 million, $16.9 million and $21.9 million, respectively, to reflect our share of the overall net losses within the collaboration for each of those years.
The following table provides a summary of the U.S. collaboration and our share of the co-promotion losses on ZINBRYTA in the U.S.:
For the Year Ended December 31,
(In millions) 2018 2017 2016
Product revenues, net...................................................................... $ 7.5 $ 53.1 $ 6.1Costs and expenses........................................................................ 25.3 92.6 50.0
Co-promotion losses in the U.S. ....................................................... $ 17.8 $ 39.5 $ 43.9Biogen's share of co-promotion losses in the U.S. ............................. $ 8.6 $ 16.9 $ 21.9
In the E.U. and Canada, we recognized revenues on sales to third parties in product revenues, net in our consolidated statements of income. We began to recognize net product revenues on sales of ZINBRYTA in the E.U. and Canada in the third quarter of 2016 and first quarter of 2017, respectively, and ceased selling ZINBRYTA in the E.U. and Canada in March 2018 in connection with the voluntary worldwide withdrawal of ZINBRYTA for RMS. For the years ended December 31, 2018, 2017 and 2016, we recognized net product revenues on the sales of ZINBRYTA in the E.U. and Canada of $1.4 million, $52.7 million and $7.8 million, respectively. We also recorded the related cost of revenues and sales and marketing expenses to their respective line items in our consolidated statements of income as these costs were incurred.
We reimbursed AbbVie for their 50% share of the co-promotion profits or losses in the E.U. and Canada. This reimbursement was recognized in collaboration profit (loss) sharing in our consolidated statements of income. For the year ended December 31, 2018, we recognized net profit-sharing income of $2.4 million to reflect AbbVie's 50% sharing of the net collaboration losses in the E.U. and Canada, as compared to net profit-sharing expense of $1.3 million for the year ended December 31, 2017, and net profit-sharing income of $4.9 million for the year ended December 31, 2016.
Other Research and Discovery Arrangements
These arrangements may include the potential for future milestone payments based on the achievement of certain clinical and commercial development payable over a period of several years.

BIOGEN INC. AND SUBSIDIARIESNOTES TO CONSOLIDATED FINANCIAL STATEMENTS — (Continued)
F- 69
C4 Therapeutics
In December 2018 we entered into a collaborative research and license agreement with C4 Therapeutics (C4T) to investigate the use of C4T’s novel protein degradation platform to discover and develop potential new treatments for neurological diseases, such as AD and Parkinson’s disease.
Under the agreement, C4T will provide expertise and research services in targeted protein degradation and we will provide neuroscience expertise and drug development capabilities. We will be responsible for the development and potential commercialization of any therapies resulting from this collaboration.
In connection with this agreement we made an upfront payment of $45.0 million to C4T, of which $17.0 million was recorded as research and development expense in our consolidated statements of income and $28.0 million was recorded as prepaid research and development expenditures within investments and other assets in our consolidated balance sheets. We may also pay C4T up to a total of $370.0 million in additional milestone payments as well as potential royalties on net commercial sales.
University of Pennsylvania
We have a collaboration and alliance with the University of Pennsylvania (UPenn) to advance gene therapy and gene editing technologies. In December 2018 we notified UPenn that we will be terminating certain programs under our collaboration and alliance with UPenn, including the development of therapeutic approaches that target the eye, skeletal muscle and central nervous system and research and validation of next generation gene transfer technology using adeno-associated virus (AAV) gene delivery vectors and exploring the expanded use of genome editing technology as a potential therapeutic platform. The termination of these programs will be effective in May 2019. This termination did not impact our collaboration with UPenn for the development of BIIB089 for the treatment of SMA.
Upon entering into this agreement we made an upfront payment of $20.0 million to UPenn, which was recorded as research and development expense in our consolidated statements of income, and made prepaid research and development expenditures of $15.0 million, which was recorded in investments and other assets in our consolidated balance sheets. During 2017 we made additional prepaid research and development expenditures to UPenn of $29.1 million related to the advancement of the programs under this agreement. These prepaid research and development amounts were expensed as the services were provided, of which no amounts remain as a prepaid asset as of December 31, 2018.
We may be required to make future payments of over $137.0 million in research funding, options and milestone payments in relation to the BIIB089 program if we are successful and exercise our related options under this agreement. UPenn is also eligible to receive royalties in the mid-single digit percentages of annual net commercial sales upon successful development and commercialization of BIIB089. UPenn is no longer entitled to any potential future research funding, options and milestone payments from us in relation to the development of programs other than BIIB089.
For the years ended December 31, 2018, 2017 and 2016, we recorded $64.0 million, $33.0 million and $27.8 million, respectively, in research and development expense in our consolidated statements of income related to this collaboration.
Applied Genetic Technologies Corporation
We have a collaboration and license agreement to develop gene-based therapies for multiple ophthalmic diseases with Applied Genetic Technologies Corporation (AGTC). This collaboration focused on the development of BIIB087, an investigational AAV-based gene therapy for the treatment of X-linked Retinoschisis (XLRS), and BIIB088, an investigational AAV-based gene therapy for the treatment of X-Linked Retinitis Pigmentosa (XLRP). This collaboration also provided us with options to early stage discovery programs in two ophthalmic diseases and one non-ophthalmic condition.
In December 2018 we notified AGTC of the termination of our collaboration agreement with AGTC. The termination of this collaboration agreement will be effective in March 2019 and we will have no further involvement in the development of any of the programs under this collaboration. Accordingly, AGTC is no longer entitled to any potential development, regulatory and commercial milestone payments from us in relation to the development of these programs.
BIOGEN INC. AND SUBSIDIARIESNOTES TO CONSOLIDATED FINANCIAL STATEMENTS — (Continued)
F- 70
In connection with the collaboration and license agreement, we also received a manufacturing license under which we received an exclusive license to use AGTC’s proprietary technology platform to make AAV vectors for up to six genes, three of which are in AGTC’s discretion, in exchange for payment of milestones and royalties. Our termination of the collaboration agreement does not impact our rights under the manufacturing license.
Upon entering into the collaboration agreement we made an upfront payment of $124.0 million to AGTC. The $124.0 million upfront payment reflected a $30.0 million equity investment in AGTC, including a $7.5 million premium on our equity investment, prepaid research and development expenditures of $58.4 million and total licensing and other fees of $35.6 million. The $35.6 million in total licensing and other fees and the $7.5 million premium on our equity investment were recorded as a charge to research and development expense in our consolidated statements of income. The remaining $22.5 million equity investment and the $58.4 million of prepaid research and development expenditures were recorded in investments and other assets in our consolidated balance sheets. These prepaid research and development amounts were expensed as the services were provided. No amounts remain as a prepaid asset as of December 31, 2018.
For the years ended December 31, 2018, 2017 and 2016, we recorded $39.5 million, $27.5 million and $26.5 million, respectively, which were reflected in research and development expense in our consolidated statements of income related to this collaboration.
Other
For the years ended December 31, 2018, 2017 and 2016, we entered into several research, discovery and other related arrangements that resulted in $5.0 million, $10.0 million and $10.3 million, respectively, recorded as research and development expense in our consolidated statements of income.
Samsung Bioepis Co., Ltd.
Joint Venture Agreement
In February 2012 we entered into a joint venture agreement with Samsung BioLogics, establishing an entity, Samsung Bioepis, to develop, manufacture and market biosimilar products. Samsung BioLogics contributed 280.5 billion South Korean won (approximately $250.0 million) for an 85% stake in Samsung Bioepis and we contributed 49.5 billion South Korean won (approximately $45.0 million) for the remaining 15% ownership interest. In June 2018 we exercised our option under our joint venture agreement to increase our ownership percentage in Samsung Bioepis from approximately 5%, which reflected the effect of previous equity financings in which we did not participate, to approximately 49.9%. The share purchase transaction was completed in November 2018 and, upon closing, we paid 759.5 billion South Korean won ($676.6 million) to Samsung BioLogics. As of December 31, 2018, our ownership percentage remains approximately 49.9%.
We recognize our share of the results of operations related to our investment in Samsung Bioepis under the equity method of accounting one quarter in arrears when the results of the entity become available, which is reflected as equity in income (loss) of investee, net of tax in our consolidated statements of income. During 2015, as our share of losses exceeded the carrying value of our initial investment, we suspended recognizing additional losses. In the first quarter of 2019, depending on the results of Samsung Bioepis, we expect to restart recognizing our share of Samsung Bioepis' income (losses) and we will begin recognizing the amortization of certain basis differences resulting from our November 2018 investment.
As of December 31, 2018, the carrying value of our investment in Samsung Bioepis totaled 759.5 billion South Korean won ($680.6 million), which is classified as a component of investments and other assets within our consolidated balance sheet.
Commercial Agreement
In December 2013 pursuant to our rights under the joint venture agreement with Samsung BioLogics, we entered into an agreement with Samsung Bioepis to commercialize, over a 10-year term, 3 anti-tumor necrosis factor (TNF) biosimilar product candidates in Europe and in the case of BENEPALI, Japan. Under this agreement, we have made upfront and clinical development milestone payments totaling $46.0 million, which were recorded as research and development expense in our consolidated statements of income as the programs they relate to had not achieved regulatory approval. We also agreed to make additional milestone payments of $25.0 million upon regulatory approval in the E.U. for each of the three anti-TNF biosimilar product candidates. IMRALDI, an adalimumab biosimilar referencing HUMIRA, FLIXABI, an infliximab biosimilar referencing REMICADE, and BENEPALI, an etanercept
BIOGEN INC. AND SUBSIDIARIESNOTES TO CONSOLIDATED FINANCIAL STATEMENTS — (Continued)
F- 71
biosimilar referencing ENBREL, received regulatory approval in the E.U. in August 2017, May 2016 and January 2016, respectively, and we capitalized the related milestone payments totaling $75.0 million as intangible assets, net in our consolidated balance sheets.
In April 2018 we and Samsung Bioepis announced an agreement with AbbVie related to the commercialization of IMRALDI. Under the terms of the agreement, AbbVie granted us and Samsung Bioepis patent licenses for the use and sale of IMRALDI in Europe, on a country-by-country basis, and we make royalty payments to AbbVie on behalf of Samsung Bioepis. We began to recognize revenues on sales of IMRALDI to third parties in the E.U. in the fourth quarter of 2018.
We reflect revenues on sales of IMRALDI, FLIXABI and BENEPALI to third parties in product revenues, net in our consolidated statements of income and record the related cost of revenues and sales and marketing expenses in our consolidated statements of income to their respective line items when these costs are incurred. Royalty payments to AbbVie on sales of IMRALDI are recognized in cost of sales within our consolidated statements of income.
We share 50% of the profit or loss related to our commercial agreement with Samsung Bioepis, which is recognized in collaboration profit (loss) sharing in our consolidated statements of income. For the years ended December 31, 2018, 2017 and 2016, we recognized a net profit-sharing expense of $187.4 million, $111.0 million and $15.1 million, respectively, to reflect Samsung Bioepis' 50% sharing of the net collaboration profits.
Other Services
Simultaneous with the formation of Samsung Bioepis, we also entered into a license agreement, a technical development services agreement and a manufacturing agreement with Samsung Bioepis.
Under the license agreement, we granted Samsung Bioepis an exclusive license to use, develop, manufacture and commercialize biosimilar products created by Samsung Bioepis using Biogen product-specific technology. In exchange, we will receive single digit royalties on all biosimilar products developed and commercialized by Samsung Bioepis.
Under the technical development services agreement, we provide Samsung Bioepis technical development and technology transfer services, which include, but are not limited to, cell culture development, purification process development, formulation development and analytical development.
Under our manufacturing agreement, we manufacture clinical and commercial quantities of bulk drug substance of biosimilar products for Samsung Bioepis pursuant to contractual terms. Under limited circumstances, we may also supply Samsung Bioepis with quantities of drug product of biosimilar products for use in clinical trials through arrangements with third-party contract manufacturers.
For the years ended December 31, 2018, 2017 and 2016, we recognized $96.4 million, $42.7 million and $20.2 million, respectively, in revenues under our license, technical development services and manufacturing agreements, which is reflected in revenues from collaborative and other relationships, as a component of other revenues in our consolidated statements of income.
20. Investments in Variable Interest Entities
Consolidated Variable Interest Entities
Our consolidated financial statements include the financial results of variable interest entities in which we are the primary beneficiary. The following are our significant variable interest entities.
Neurimmune SubOne AG
In November 2007 we entered into a collaboration and license agreement with Neurimmune SubOne AG (Neurimmune) for the development and commercialization of antibodies for the treatment of AD, including aducanumab, our anti-amyloid beta antibody candidate for the treatment of AD. We are responsible for the development, manufacturing and commercialization of all collaboration products. This agreement is effective for the longer of the duration of certain patents relating to a licensed product or 12 years from the first commercial sale of any product using such a licensed compound.
BIOGEN INC. AND SUBSIDIARIESNOTES TO CONSOLIDATED FINANCIAL STATEMENTS — (Continued)
F- 72
We consolidate the results of Neurimmune as we determined that we are the primary beneficiary of Neurimmune because we have the power through the collaboration to direct the activities that most significantly impact the entity’s economic performance and we are required to fund 100% of the research and development costs incurred in support of the collaboration. Under this agreement, we are also required to pay royalties on net sales of any resulting commercial products and make payments upon the achievement of certain milestone events.
In October 2017 we amended the terms of our collaboration and license agreement with Neurimmune (as amended, the Neurimmune Agreement). Under the Neurimmune Agreement, we made a $150.0 million payment to Neurimmune in exchange for a 15% reduction in the previously negotiated royalty rates payable on products developed under the Neurimmune Agreement, including royalties payable on potential commercial sales of aducanumab. In May 2018 we made an additional $50.0 million payment to Neurimmune to further reduce the previously negotiated royalty rates payable on products developed under the Neurimmune Agreement, including royalties payable on potential commercial sales of aducanumab, by an additional 5%. Our royalty rates payable on products developed under the Neurimmune Agreement, including royalty rates payable on potential commercial sales of aducanumab, will now range from the high single digits to sub-teens. As we consolidate the results of Neurimmune, we treated these payments as distributions and recognized them as charges to noncontrolling interest in the fourth quarter of 2017 and the second quarter of 2018, as applicable.
Research and development costs for which we reimburse Neurimmune are reflected in research and development expense in our consolidated statements of income. During the years ending December 31, 2018, 2017 and 2016, amounts reimbursed were immaterial.
The assets and liabilities of Neurimmune are not significant to our consolidated financial position or results of operations as it is a research and development organization. We have provided no financing to Neurimmune other than previously contractually required amounts.
Under the terms of our Aducanumab Collaboration Agreement, Eisai had an option to share in the benefit and cost associated with the royalty reductions discussed above; however, Eisai did not elect to share in the benefit and cost with respect to either the October 2017 or May 2018 royalty reductions, which will impact the amount of profits (losses) on potential commercial sales of aducanumab to be shared with Eisai. For additional information on our collaboration arrangements with Eisai, please read Note 19, Collaborative and Other Relationships, to these consolidated financial statements.
Unconsolidated Variable Interest Entities
We have relationships with variable interest entities that we do not consolidate as we lack the power to direct the activities that significantly impact the economic success of these entities. These relationships include investments in certain biotechnology companies and research collaboration agreements.
As of December 31, 2018 and 2017, the carrying value of our investments in certain biotechnology companies representing potential unconsolidated variable interest entities totaled $28.7 million and $48.3 million, respectively. Our maximum exposure to loss related to these variable interest entities is limited to the carrying value of our investments.
We have also entered into research collaboration agreements with certain variable interest entities where we are required to fund certain development activities. These development activities are included in research and development expense in our consolidated statements of income as they are incurred. We have provided no financing to these variable interest entities other than previously contractually required amounts.
21. LitigationWe are currently involved in various claims and legal proceedings, including the matters described below. For
information as to our accounting policies relating to claims and legal proceedings, including use of estimates and contingencies, please read Note 1, Summary of Significant Accounting Policies, to these consolidated financial statements.
With respect to some loss contingencies, an estimate of the possible loss or range of loss cannot be made until management has further information, including, for example, (i) which claims, if any, will survive dispositive motion practice; (ii) information to be obtained through discovery; (iii) information as to the parties' damages claims and supporting evidence; (iv) the parties’ legal theories; and (v) the parties' settlement positions.

BIOGEN INC. AND SUBSIDIARIESNOTES TO CONSOLIDATED FINANCIAL STATEMENTS — (Continued)
F- 73
The claims and legal proceedings in which we are involved also include challenges to the scope, validity or enforceability of the patents relating to our products, pipeline or processes, and challenges to the scope, validity or enforceability of the patents held by others. These include claims by third parties that we infringe their patents. An adverse outcome in any of these proceedings could result in one or more of the following and have a material impact on our business or consolidated results of operations and financial position: (i) loss of patent protection; (ii) inability to continue to engage in certain activities; and (iii) payment of significant damages, royalties, penalties and/or license fees to third parties.
Loss Contingencies
IMRALDI Patent Matters
In September 2018 Fresenius Kabi Deutschland GmbH (Fresenius Kabi) commenced proceedings for damages and injunctive relief against Biogen France SAS in the Tribunal de Grande Instance de Paris, alleging that IMRALDI, the adalimumab biosimilar product of Samsung Bioepis UK Limited that Biogen has commercialized in Europe, infringes the French counterpart of European Patent No. 3 148 510 (the '510 Patent), which was issued in June 2018 and expires in March 2035. In October 2018 Fresenius Kabi commenced preliminary injunction proceedings against Biogen (Denmark) Manufacturing ApS and Biogen Denmark A/S in Denmark's Maritime and Commercial High Court alleging infringement of Danish Utility Models. In November 2018 Fresenius Kabi commenced infringement proceedings for damages and injunctive relief against Biogen Italia S.R.L. in the District Court of Milan relating to the Italian counterpart of the ‘510 Patent, and against Biogen GmbH in the Dusseldorf Regional Court relating to the German counterpart of the ‘510 Patent. No hearing has yet been set in these proceedings.
In August 2018 Biogen Idec Ltd. (Biogen UK) and Samsung Bioepis UK Limited filed an action in the United Kingdom Patents Court to revoke the United Kingdom counterpart of the '510 Patent. Fresenius Kabi has filed a counterclaim asserting infringement of the '510 Patent and seeking damages and an injunction to restrain infringement if the patent is found valid and infringed. A trial has been set for July 2019. In December 2018 Biogen B.V. and Samsung Bioepis UK Limited filed an action in the District Court of the Hague, Netherlands to revoke the Dutch counterpart of the ‘510 Patent. A trial has been set for October 2019. An estimate of the possible loss or range of loss in the above matters cannot be made at this time.
In October 2018 Gedeon Richter PLC asserted to Biogen and Samsung Bioepis UK Limited that IMRALDI infringes European Patent No. 3 212 667, which was issued in September 2018 and expires in October 2035. We dispute the assertion. An estimate of the possible loss or range of loss cannot be made at this time.
Qui Tam Litigation
In July 2015 a qui tam action filed by Michael Bawduniak on behalf of the U.S. and certain states was unsealed by the U.S. District Court for the District of Massachusetts. The action alleges sales and promotional activities in violation of the federal False Claims Act and state law counterparts and seeks single and treble damages, civil penalties, interest, attorneys’ fees and costs. Our motion to dismiss was denied in part. No trial date has been set. The U.S. has not made an intervention decision. An estimate of the possible loss or range of loss cannot be made at this time.
In May 2018 we were served with a qui tam action filed by SMSF, LLC on behalf of the U.S. and certain states in the U.S. District Court for the District of Massachusetts alleging activities by nurse-educators in violation of the federal False Claims Act and state law counterparts. The government declined to intervene, and we, other defendants and the U.S. moved to dismiss. In December 2018 the court dismissed the case with prejudice against the relator and without prejudice as to the U.S. and states. The period for an appeal has lapsed and we consider the matter closed.
In July 2018 we and certain other drug manufacturers and pharmacy benefit managers were served with a qui tam action filed by John Borzilleri on behalf of the U.S. and certain states in the U.S. District Court for the District of Rhode Island. The case alleges agreements with pharmacy benefit managers in violation of the Federal False Claims Act and state law counterparts and seeks single and treble damages, civil penalties, interest, attorneys' fees and costs. We, the other defendants and the U.S. have moved to dismiss the case and the motions are pending. No trial date has been set. An estimate of the possible loss or range of loss cannot be made at this time.
BIOGEN INC. AND SUBSIDIARIESNOTES TO CONSOLIDATED FINANCIAL STATEMENTS — (Continued)
F- 74
Securities Litigation
We and certain current and former officers are defendants in an action filed by a shareholder in October 2016 in the U.S. District Court for the District of Massachusetts alleging violations of federal securities laws under 15 U.S.C §78j(b) and §78t(a) and 17 C.F.R. §240.10b-5 and seeking a declaration of the action as a class action and an award of damages, interest and attorneys' fees. In March 2018 the court dismissed the complaint with prejudice. The plaintiff's appeal is pending. An estimate of the possible loss or range of loss cannot be made at this time.
Other Matters
Hatch-Waxman Act Litigation relating to TECFIDERA Orange-Book Listed Patents
In June and July 2017, January, March, April, August and December 2018 and January 2019 we initiated patent infringement proceedings against multiple parties pursuant to the Drug Price Competition and Patent Term Restoration Act of 1984, commonly known as the Hatch-Waxman Act, in the U.S. District Courts.
Patent infringement proceedings pursuant to the Hatch-Waxman Act are pending against Accord Healthcare Inc., Alkem Laboratories Ltd., Amneal Pharmaceuticals LLC, Aurobindo Pharma U.S.A., Inc., Banner Life Sciences LLC, Caribe Holdings (Cayman) Co. Ltd. DBA Puracap Caribe, Cipla Limited, Glenmark Pharmaceuticals Ltd., Graviti Pharmaceuticals Pvt. Ltd., Hetero USA, Inc., Lupin Atlantis Holdings SA, Macleods Pharmaceuticals, Ltd., MSN Laboratories Pvt. Ltd., Pharmathen S.A., Prinston Pharmaceutical Inc., Sandoz Inc., Sawai USA, Inc., Shipla Medicare Limited, Slayback Pharma LLC, Sun Pharma Global FZE, Torrent Pharmaceuticals Ltd., TWi Pharmaceuticals, Inc., Windlas Healthcare Pvt. Ltd. and Zydus Pharmaceuticals (USA) Inc. in the U.S. District Court for the District of Delaware and against Mylan Pharmaceuticals Inc. in the U.S. District Court for the Northern District of West Virginia.
A trial has been set for December 2019 in the Delaware actions, and a trial date has been set for February 2020 in the West Virginia action. A trial date has not been set in the case against Banner Life Sciences LLC or the case against Hetero USA Inc. that was filed in January 2019.
Petition for Inter Partes Review filed by Mylan Pharmaceuticals, Inc.
In July 2018 Mylan Pharmaceuticals, Inc. filed a petition with the U.S. Patent Trial and Appeal Board seeking inter partes review of our U.S. Patent No. 8,399,514 (the '514 Patent). The '514 Patent includes claims covering the treatment of MS with 480 mg of dimethyl fumarate per day as provided for in our TECFIDERA label. On February 6, 2019, the U.S. Patent Trial and Appeal Board instituted inter partes review of the '514 Patent.
Interference Proceeding with Forward Pharma
In April 2015 the USPTO declared an interference between Forward Pharma’s U.S. Patent Application No. 11,576,871 and the '514 Patent. The U.S. Court of Appeals for the Federal Circuit affirmed the March 2017 ruling of the USPTO in favor of Biogen and in January 2019 denied Forward Pharma's petition for rehearing. For additional information regarding this matter, please read Note 7, Intangible Assets and Goodwill, to these consolidated financial statements.
European Patent Office Oppositions
In 2016 the EPO revoked our European patent number 2 137 537 (the '537 Patent). We have appealed to the Technical Boards of Appeal of the EPO and the appeal is pending. The '537 Patent includes claims covering the treatment of MS with 480 mg of dimethyl fumarate as provided for in our TECFIDERA label.
In March 2018 the EPO revoked Forward Pharma’s European Patent No. 2 801 355, which was issued in May 2015 and expires in October 2025. Forward Pharma has filed an appeal to the Technical Boards of Appeal of the EPO and the appeal is pending. The settlement and license agreement that we entered into with Forward Pharma in January 2017 did not resolve the issues pending in this proceeding and we and Forward Pharma intend to permit the Technical Boards of Appeal and the Enlarged Board of Appeal, if applicable, to make a final determination. For additional information regarding this matter, please read Note 7, Intangible Assets and Goodwill, to these consolidated financial statements.
TYSABRI Patent Revocation Matters
In November 2017 Bioeq GMBH, affiliated with the Polpharma Group, brought an action to the Polish Patent Office seeking to revoke Polish Patent Number 215263 (the Polish '263 Patent), the Polish patent corresponding to our European Patent Number 1 485 127 (the EU '127 Patent) ("Administration of agents to treat inflammation"). The
BIOGEN INC. AND SUBSIDIARIESNOTES TO CONSOLIDATED FINANCIAL STATEMENTS — (Continued)
F- 75
Polish '263 Patent concerns administration of natalizumab (TYSABRI) to treat MS. The Polish '263 Patent was issued in 2013 and expires in February 2023. Swiss Pharma International AG, also affiliated with the Polpharma Group, filed actions in the District Court of The Hague (January 2016), the German Patents Court (March 2016) and the Commercial Court of Rome (November 2017) seeking to invalidate the Dutch, German and Italian counterparts of the EU '127 Patent, which was issued in 2011 and also concerns administration of natalizumab (TYSABRI) to treat MS. The EU '127 Patent expires in February 2023. The Dutch and German counterparts were ruled invalid and we have appealed. No date for a hearing on the merits has been set in the Polish and Italian actions.
'755 Patent Litigation
In May 2010 Biogen MA Inc. (formerly Biogen Idec MA Inc.) filed a complaint in the U.S. District Court for the District of New Jersey alleging infringement by Bayer Healthcare Pharmaceuticals Inc. (Bayer) (manufacturer, marketer and seller of BETASERON and manufacturer of EXTAVIA), EMD Serono, Inc. (EMD Serono) (manufacturer, marketer and seller of REBIF), Pfizer (co-marketer of REBIF) and Novartis Pharmaceuticals Corp. (Novartis) (marketer and seller of EXTAVIA) of our U.S. Patent No. 7,588,755 ('755 Patent), which claims the use of interferon beta for immunomodulation or treating a viral condition, viral disease, cancers or tumors. The complaint seeks monetary damages, including lost profits and royalties. Bayer had previously filed a complaint against us in the same court, on May 27, 2010, seeking a declaratory judgment that it does not infringe the '755 Patent and that the '755 Patent is invalid, and seeking monetary relief in the form of attorneys' fees, costs and expenses.
Bayer, Pfizer, Novartis and EMD Serono all filed counterclaims seeking declaratory judgments of patent invalidity and non-infringement, and seeking monetary relief in the form of costs and attorneys' fees.
In September 2018, following a trial against EMD Serono and Pfizer, the court granted Biogen's motion for judgment as a matter of law that the '755 Patent is infringed and valid and ordered a new trial on all damages issues. The court has not yet scheduled the trial on damages or a trial against Bayer and Novartis. In October 2018 EMD Serono and Pfizer filed an appeal from the judgment in the U.S. Court of Appeals for the Federal Circuit, which is pending.
Government Matters
We have learned that state and federal governmental authorities are investigating our sales and promotional practices and have received related subpoenas. We are cooperating with the government.
We have received subpoenas and other requests from the federal government for documents and information relating to our relationship with non-profit organizations that assist patients taking drugs sold by Biogen and Biogen's co-pay assistance programs. We are cooperating with the government.
In July 2016 we received civil investigative demands from the federal government for documents and information relating to our treatment of certain service agreements with wholesalers when calculating and reporting Average Manufacturer Prices in connection with the Medicaid Drug Rebate Program. We are cooperating with the government.
In July 2017 we learned that the Prosecution Office of Milan is investigating our interactions with certain healthcare providers in Italy. We are cooperating with the government.
Tax Matter
In the second quarter of 2018 the State Treasury of Goias, Brazil issued tax assessments for the period 2013 through February 2018 relating to tax on the circulation of goods and totaling approximately $70.0 million including interest and penalties. We dispute the assessments and have filed defenses with the Administrative Court of Appeals for the State of Goias, which are pending. We have not formed an opinion that an unfavorable outcome of the dispute is either probable or remote.
Product Liability and Other Legal Proceedings
We are also involved in product liability claims and other legal proceedings generally incidental to our normal business activities. While the outcome of any of these proceedings cannot be accurately predicted, we do not believe the ultimate resolution of any of these existing matters would have a material adverse effect on our business or financial condition.

BIOGEN INC. AND SUBSIDIARIESNOTES TO CONSOLIDATED FINANCIAL STATEMENTS — (Continued)
F- 76
22. Commitments and Contingencies
Contingent Payments
TYSABRI
In 2013 we acquired from Elan full ownership of all remaining rights to TYSABRI that we did not already own or control. Under the acquisition agreement, we are obligated to make contingent payments to Elan of 18% on annual worldwide net sales up to $2.0 billion and 25% on annual worldwide net sales that exceed $2.0 billion. Royalty payments to Elan and other third parties are recorded as cost of sales in our consolidated statements of income. Elan was acquired by Perrigo Company plc (Perrigo) in December 2013, and Perrigo subsequently sold its rights to these payments to a third-party effective January 2017.
SPINRAZA
In the third quarter of 2016 we exercised our option to develop and commercialize SPINRAZA from Ionis. Under our agreement with Ionis, we make royalty payment to Ionis on annual worldwide net sales of SPINRAZA using a tiered royalty rate between 11% and 15%, which are recorded as cost of sales in our consolidated statements of income. For additional information on our collaboration arrangements with Ionis, please read Note 19, Collaborative and Other Relationships, to these consolidated financial statements.
Contingent Consideration related to Business Combinations
In connection with our acquisitions of Convergence, Stromedix and BIN, we agreed to make additional payments based upon the achievement of certain milestone events.
As the acquisitions of Convergence, Stromedix and BIN occurred after January 1, 2009, we recognized the contingent consideration liabilities associated with these transactions at their fair value on the acquisition date and revalue these obligations each reporting period. We may pay up to approximately $1.0 billion in remaining milestones related to these acquisitions.
Fumapharm AG
In 2006 we acquired Fumapharm AG. As part of this acquisition we acquired the Fumapharm Products. We paid $220.0 million upon closing of the transaction and agreed to pay an additional $15.0 million if a Fumapharm Product was approved for MS in the U.S. or E.U. In the second quarter of 2013 TECFIDERA was approved in the U.S. for MS by the FDA and we made the $15.0 million contingent payment. We are also required to make additional contingent payments to former shareholders of Fumapharm AG and holders of their rights based on the attainment of certain cumulative sales levels of Fumapharm Products and the level of total net sales of Fumapharm Products in the prior 12-month period, as defined in the acquisition agreement, until such time as the cumulative sales level reached $20.0 billion, at which time no further contingent payments are due. These payments are accounted for as an increase to goodwill as incurred, in accordance with the accounting standard applicable to business combinations when we acquired Fumapharm AG. Any portion of the payment that is tax deductible was recorded as a reduction to goodwill. Payments are due within 60 days following the end of the quarter in which the applicable cumulative sales level was reached.
During 2018 we paid $1.5 billion in contingent payments as we reached the $15.0 billion and $16.0 billion cumulative sales levels related to the Fumapharm Products in the fourth quarter of 2017 and the $17.0 billion, $18.0 billion and $19.0 billion cumulative sales levels related to the Fumapharm Products in the first, second and third quarters of 2018, respectively. In the fourth quarter of 2018 we achieved the $20.0 billion cumulative sales level threshold and accrued our last $300.0 million contingent payment related to the Fumapharm Products, which will be paid in the first quarter of 2019.
Contingent Development, Regulatory and Commercial Milestone Payments
Based on our development plans as of December 31, 2018, we could make potential future milestone payments to third parties of up to approximately $5.0 billion, including approximately $0.7 billion in development milestones, approximately $1.8 billion in regulatory milestones and approximately $2.5 billion in commercial milestones, as part of our various collaborations, including licensing and development programs. Payments under these agreements generally become due and payable upon achievement of certain development, regulatory or commercial milestones. Because the achievement of these milestones was not considered probable as of December 31, 2018, such contingencies have not been recorded in our financial statements. Amounts related to
BIOGEN INC. AND SUBSIDIARIESNOTES TO CONSOLIDATED FINANCIAL STATEMENTS — (Continued)
F- 77
contingent milestone payments are not considered contractual obligations as they are contingent on the successful achievement of certain development, regulatory approval or commercial milestones.
Other Funding Commitments
As of December 31, 2018, we have several ongoing clinical studies in various clinical trial stages. Our most significant clinical trial expenditures are to CROs. The contracts with CROs are generally cancellable, with notice, at our option. We recorded accrued expenses of approximately $27.0 million in our consolidated balance sheet for expenditures incurred by CROs as of December 31, 2018. We have approximately $655.0 million in cancellable future commitments based on existing CRO contracts as of December 31, 2018.
Tax Related Obligations
We exclude liabilities pertaining to uncertain tax positions from our summary of contractual obligations as we cannot make a reliable estimate of the period of cash settlement with the respective taxing authorities. As of December 31, 2018, we have $117.7 million of liabilities associated with uncertain tax positions.
As of December 31, 2018 and 2017, we have accrued income tax liabilities of $697.0 million and $989.6 million, respectively, under the Transition Toll Tax. Of the amounts accrued as of December 31, 2018, no amounts are expected to be paid within one year due to a $150.0 million overpayment of taxes in the current year. The Transition Toll Tax will be paid over an eight-year period, which started in 2018, and will not accrue interest. For additional information on the Transition Toll Tax, please read Note 17, Income Taxes, to these consolidated financial statements.
Solothurn, Switzerland Manufacturing Facility
We are building a large-scale biologics manufacturing facility in Solothurn, Switzerland. We expect this facility to be operational by the end of 2020. As of December 31, 2018, we had contractual commitments of $111.0 million related to the construction of this facility.
Leases
We rent laboratory and office space and certain equipment under non-cancelable operating leases. These lease agreements contain various clauses for renewal at our option and, in certain cases, escalation clauses typically linked to rates of inflation. Rental expense, net of sublease income under these leases, which terminate at various dates through 2028, amounted to $64.5 million, $65.3 million and $68.7 million in 2018, 2017 and 2016, respectively. In addition to rent, the leases may require us to pay additional amounts for taxes, insurance, maintenance and other operating expenses.
As of December 31, 2018, minimum rental commitments under non-cancelable leases, net of income from subleases, for each of the next five years and total thereafter were as follows:
(In millions) 2019 2020 2021 2022 2023 Thereafter Total
Minimum lease payments........... $ 87.0 $ 80.7 $ 75.9 $ 71.7 $ 71.0 $ 215.3 $ 601.6Less: income from subleases (1) (26.8) (25.6) (23.7) (24.0) (24.3) (58.4) (182.8)
Net minimum leasepayments ............................ $ 60.2 $ 55.1 $ 52.2 $ 47.7 $ 46.7 $ 156.9 $ 418.8
(1) Represents sublease income expected to be received for the vacated manufacturing facility in Cambridge, MA, the vacated portion of our Weston, MA facility and other facilities throughout the world.
Under certain of our lease agreements, we are contractually obligated to return leased space to its original condition upon termination of the lease agreement. At the inception of a lease with such conditions, we record an asset retirement obligation liability and a corresponding capital asset in an amount equal to the estimated fair value of the obligation. In subsequent periods, for each such lease, we record interest expense to accrete the asset retirement obligation liability to full value and depreciate each capitalized asset retirement obligation asset, both over the term of the associated lease agreement. Our asset retirement obligations were not significant as of December 31, 2018 or 2017.
F- 78
23. GuaranteesAs of December 31, 2018 and 2017, we did not have significant liabilities recorded for guarantees.
We enter into indemnification provisions under our agreements with other companies in the ordinary course of business, typically with business partners, contractors, clinical sites and customers. Under these provisions, we generally indemnify and hold harmless the indemnified party for losses suffered or incurred by the indemnified party as a result of our activities. These indemnification provisions generally survive termination of the underlying agreement. The maximum potential amount of future payments we could be required to make under these indemnification provisions is unlimited. However, to date we have not incurred material costs to defend lawsuits or settle claims related to these indemnification provisions. As a result, the estimated fair value of these agreements is minimal. Accordingly, we have no liabilities recorded for these agreements as of December 31, 2018 and 2017.
24. Employee Benefit PlansWe sponsor various retirement and pension plans. Our estimates of liabilities and expenses for these plans
incorporate a number of assumptions, including expected rates of return on plan assets and interest rates used to discount future benefits.
401(k) Savings Plan
We maintain a 401(k) Savings Plan, which is available to substantially all regular employees in the U.S. over the age of 21. Participants may make voluntary contributions. We make matching contributions according to the 401(k) Savings Plan’s matching formula. All matching contributions and participant contributions vest immediately. The 401(k) Savings Plan also holds certain transition contributions on behalf of participants who previously participated in the Biogen, Inc. Retirement Plan. The expense related to our 401(k) Savings Plan primarily consists of our matching contributions.
Expense related to our 401(k) Savings Plan totaled $42.2 million, $42.6 million and $45.2 million for the years ended December 31, 2018, 2017 and 2016, respectively.
Deferred Compensation Plan
We maintain a non-qualified deferred compensation plan, known as the Supplemental Savings Plan (SSP), which allows a select group of management employees in the U.S. to defer a portion of their compensation. The SSP also provides certain credits to highly compensated U.S. employees that are paid by the company. These credits are known as the Restoration Match. The deferred compensation amounts are accrued when earned. Such deferred compensation is distributable in cash in accordance with the rules of the SSP. Deferred compensation amounts under such plan as of December 31, 2018 and 2017, totaled approximately $109.3 million and $109.8 million, respectively, and are included in other long-term liabilities in our consolidated balance sheets. The SSP also holds certain transition contributions on behalf of participants who previously participated in the Biogen, Inc. Retirement Plan. The Restoration Match and participant contributions vest immediately. Distributions to participants can be either in one lump sum payment or annual installments as elected by the participants.
Pension Plans
Our retiree benefit plans include defined benefit plans for employees in our affiliates in Switzerland and Germany as well as other insignificant defined benefit plans in certain other countries where we maintain an operating presence.
Our Swiss plan is a government-mandated retirement fund that provides employees with a minimum investment return. The minimum investment return is determined annually by the Swiss government and was 1.00% in 2018 and 2017 and 1.25% in 2016. Under the Swiss plan, both we and certain of our employees with annual earnings in excess of government determined amounts are required to make contributions into a fund managed by an independent investment fiduciary. Employer contributions must be in an amount at least equal to the employee’s contribution. Minimum employee contributions are based on the respective employee’s age, salary and gender. As of December 31, 2018 and 2017, the Swiss plan had an unfunded net pension obligation of $48.6 million and $48.3 million, respectively, and plan assets that totaled $93.1 million and $83.7 million, respectively. In 2018, 2017 and 2016, we recognized expense totaling $14.8 million, $12.3 million and $15.3 million, respectively, related to our Swiss plan, of which $1.3 million, $1.1 million and $2.2 million, respectively, was included in other income (expense), net.
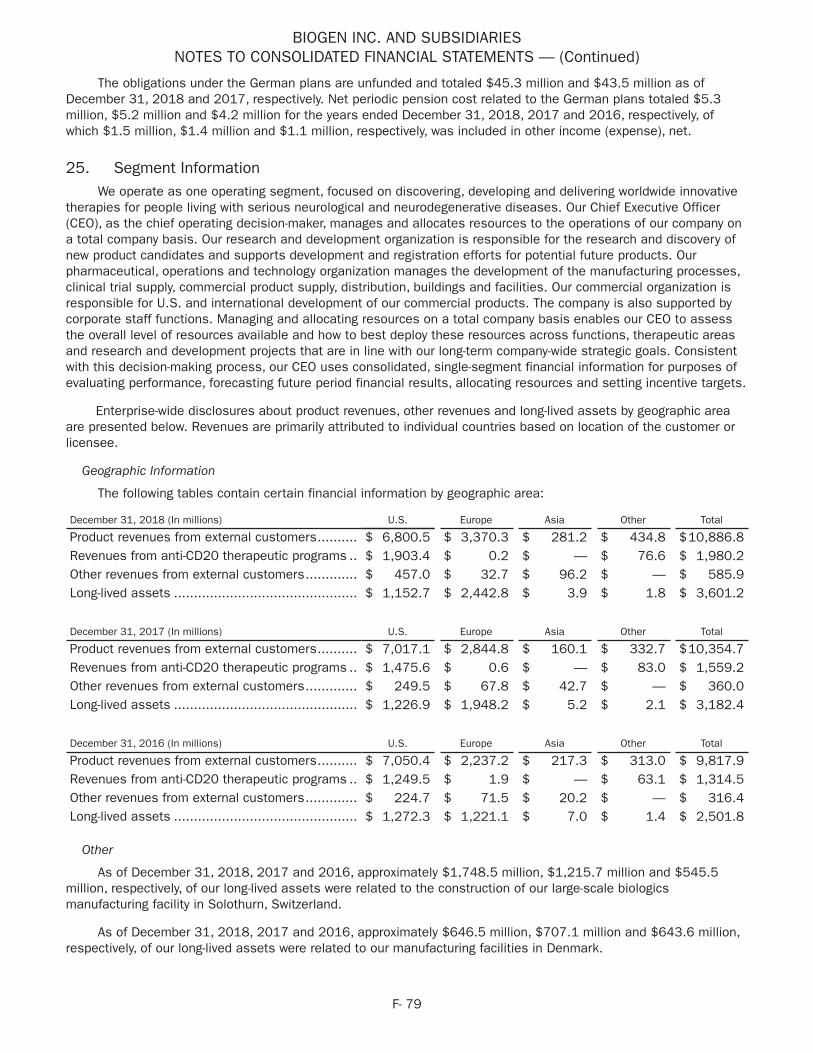
BIOGEN INC. AND SUBSIDIARIESNOTES TO CONSOLIDATED FINANCIAL STATEMENTS — (Continued)
F- 79
The obligations under the German plans are unfunded and totaled $45.3 million and $43.5 million as of December 31, 2018 and 2017, respectively. Net periodic pension cost related to the German plans totaled $5.3 million, $5.2 million and $4.2 million for the years ended December 31, 2018, 2017 and 2016, respectively, of which $1.5 million, $1.4 million and $1.1 million, respectively, was included in other income (expense), net.
25. Segment InformationWe operate as one operating segment, focused on discovering, developing and delivering worldwide innovative
therapies for people living with serious neurological and neurodegenerative diseases. Our Chief Executive Officer (CEO), as the chief operating decision-maker, manages and allocates resources to the operations of our company on a total company basis. Our research and development organization is responsible for the research and discovery of new product candidates and supports development and registration efforts for potential future products. Our pharmaceutical, operations and technology organization manages the development of the manufacturing processes, clinical trial supply, commercial product supply, distribution, buildings and facilities. Our commercial organization is responsible for U.S. and international development of our commercial products. The company is also supported by corporate staff functions. Managing and allocating resources on a total company basis enables our CEO to assess the overall level of resources available and how to best deploy these resources across functions, therapeutic areas and research and development projects that are in line with our long-term company-wide strategic goals. Consistent with this decision-making process, our CEO uses consolidated, single-segment financial information for purposes of evaluating performance, forecasting future period financial results, allocating resources and setting incentive targets.
Enterprise-wide disclosures about product revenues, other revenues and long-lived assets by geographic area are presented below. Revenues are primarily attributed to individual countries based on location of the customer or licensee.
Geographic Information
The following tables contain certain financial information by geographic area:
December 31, 2018 (In millions) U.S. Europe Asia Other Total
Product revenues from external customers.......... $ 6,800.5 $ 3,370.3 $ 281.2 $ 434.8 $10,886.8Revenues from anti-CD20 therapeutic programs .. $ 1,903.4 $ 0.2 $ — $ 76.6 $ 1,980.2Other revenues from external customers............. $ 457.0 $ 32.7 $ 96.2 $ — $ 585.9Long-lived assets .............................................. $ 1,152.7 $ 2,442.8 $ 3.9 $ 1.8 $ 3,601.2
December 31, 2017 (In millions) U.S. Europe Asia Other Total
Product revenues from external customers.......... $ 7,017.1 $ 2,844.8 $ 160.1 $ 332.7 $10,354.7Revenues from anti-CD20 therapeutic programs .. $ 1,475.6 $ 0.6 $ — $ 83.0 $ 1,559.2Other revenues from external customers............. $ 249.5 $ 67.8 $ 42.7 $ — $ 360.0Long-lived assets .............................................. $ 1,226.9 $ 1,948.2 $ 5.2 $ 2.1 $ 3,182.4
December 31, 2016 (In millions) U.S. Europe Asia Other Total
Product revenues from external customers.......... $ 7,050.4 $ 2,237.2 $ 217.3 $ 313.0 $ 9,817.9Revenues from anti-CD20 therapeutic programs .. $ 1,249.5 $ 1.9 $ — $ 63.1 $ 1,314.5Other revenues from external customers............. $ 224.7 $ 71.5 $ 20.2 $ — $ 316.4Long-lived assets .............................................. $ 1,272.3 $ 1,221.1 $ 7.0 $ 1.4 $ 2,501.8
Other
As of December 31, 2018, 2017 and 2016, approximately $1,748.5 million, $1,215.7 million and $545.5 million, respectively, of our long-lived assets were related to the construction of our large-scale biologics manufacturing facility in Solothurn, Switzerland.
As of December 31, 2018, 2017 and 2016, approximately $646.5 million, $707.1 million and $643.6 million, respectively, of our long-lived assets were related to our manufacturing facilities in Denmark.
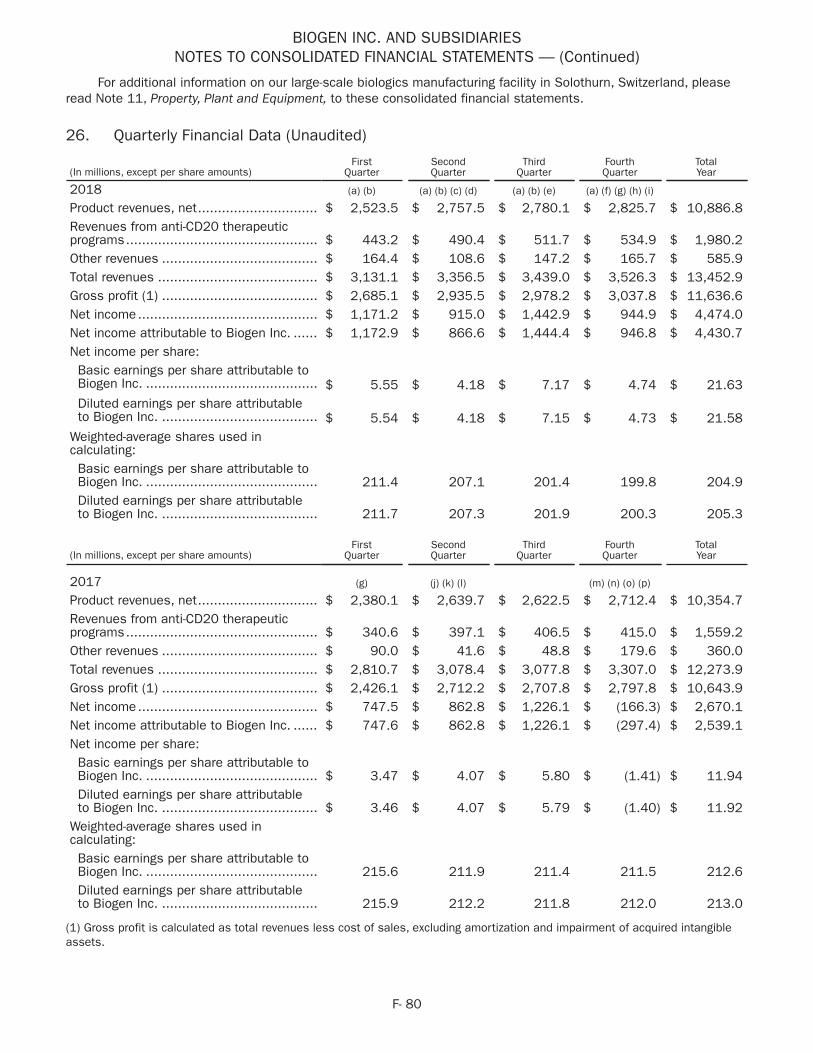
BIOGEN INC. AND SUBSIDIARIESNOTES TO CONSOLIDATED FINANCIAL STATEMENTS — (Continued)
F- 80
For additional information on our large-scale biologics manufacturing facility in Solothurn, Switzerland, please read Note 11, Property, Plant and Equipment, to these consolidated financial statements.
26. Quarterly Financial Data (Unaudited)
(In millions, except per share amounts)First
QuarterSecondQuarter
ThirdQuarter
FourthQuarter
TotalYear
2018 (a) (b) (a) (b) (c) (d) (a) (b) (e) (a) (f) (g) (h) (i)
Product revenues, net.............................. $ 2,523.5 $ 2,757.5 $ 2,780.1 $ 2,825.7 $ 10,886.8Revenues from anti-CD20 therapeuticprograms................................................ $ 443.2 $ 490.4 $ 511.7 $ 534.9 $ 1,980.2Other revenues ....................................... $ 164.4 $ 108.6 $ 147.2 $ 165.7 $ 585.9Total revenues ........................................ $ 3,131.1 $ 3,356.5 $ 3,439.0 $ 3,526.3 $ 13,452.9Gross profit (1) ....................................... $ 2,685.1 $ 2,935.5 $ 2,978.2 $ 3,037.8 $ 11,636.6Net income............................................. $ 1,171.2 $ 915.0 $ 1,442.9 $ 944.9 $ 4,474.0Net income attributable to Biogen Inc. ...... $ 1,172.9 $ 866.6 $ 1,444.4 $ 946.8 $ 4,430.7Net income per share:Basic earnings per share attributable toBiogen Inc. ........................................... $ 5.55 $ 4.18 $ 7.17 $ 4.74 $ 21.63Diluted earnings per share attributableto Biogen Inc. ....................................... $ 5.54 $ 4.18 $ 7.15 $ 4.73 $ 21.58
Weighted-average shares used incalculating:Basic earnings per share attributable toBiogen Inc. ........................................... 211.4 207.1 201.4 199.8 204.9Diluted earnings per share attributableto Biogen Inc. ....................................... 211.7 207.3 201.9 200.3 205.3
(In millions, except per share amounts)First
QuarterSecondQuarter
ThirdQuarter
FourthQuarter
TotalYear
2017 (g) (j) (k) (l) (m) (n) (o) (p)
Product revenues, net.............................. $ 2,380.1 $ 2,639.7 $ 2,622.5 $ 2,712.4 $ 10,354.7Revenues from anti-CD20 therapeuticprograms................................................ $ 340.6 $ 397.1 $ 406.5 $ 415.0 $ 1,559.2Other revenues ....................................... $ 90.0 $ 41.6 $ 48.8 $ 179.6 $ 360.0Total revenues ........................................ $ 2,810.7 $ 3,078.4 $ 3,077.8 $ 3,307.0 $ 12,273.9Gross profit (1) ....................................... $ 2,426.1 $ 2,712.2 $ 2,707.8 $ 2,797.8 $ 10,643.9Net income............................................. $ 747.5 $ 862.8 $ 1,226.1 $ (166.3) $ 2,670.1Net income attributable to Biogen Inc. ...... $ 747.6 $ 862.8 $ 1,226.1 $ (297.4) $ 2,539.1Net income per share:Basic earnings per share attributable toBiogen Inc. ........................................... $ 3.47 $ 4.07 $ 5.80 $ (1.41) $ 11.94Diluted earnings per share attributableto Biogen Inc. ....................................... $ 3.46 $ 4.07 $ 5.79 $ (1.40) $ 11.92
Weighted-average shares used incalculating:Basic earnings per share attributable toBiogen Inc. ........................................... 215.6 211.9 211.4 211.5 212.6Diluted earnings per share attributableto Biogen Inc. ....................................... 215.9 212.2 211.8 212.0 213.0
(1) Gross profit is calculated as total revenues less cost of sales, excluding amortization and impairment of acquired intangible assets.

BIOGEN INC. AND SUBSIDIARIESNOTES TO CONSOLIDATED FINANCIAL STATEMENTS — (Continued)
F- 81
(a) Net income and net income attributable to Biogen Inc. for the first, second, third and fourth quarters of 2018 includes pre-tax charges related to (losses) gains recorded in relation to changes in the fair value of our strategic investments of $(6.4) million, $5.4 million, $141.2 million and $(12.2) million, respectively.
(b) Net income and net income attributable to Biogen Inc. for the first, second and third quarters of 2018 include pre-tax charges to acquired IPR&D of $10.0 million, $75.0 million and $27.5 million, respectively, for upfront payments to Karyopharm, Pfizer and AliveGen, respectively, upon closing of the asset purchase transactions for BIIB100, BIIB104 and BIIB110, respectively, as the underlying assets had not yet reached technological feasibility.
(c) Net income and net income attributable to Biogen Inc. for the second quarter of 2018 includes pre-tax charges to research and development expense of $486.2 million upon the closing of the 2018 Ionis Agreement. Included in this amount was a charge of $162.1 million reflecting the premium paid above fair value for the purchase of approximately 11.5 million shares of Ionis' common stock upon the closing of the 2018 Ionis Agreement.
(d) Net income attributable to Biogen Inc. for the second quarter of 2018 includes a pre-tax charge to noncontrolling interest of $50.0 million for a payment to Neurimmune in exchange for a 5% reduction in the previously negotiated royalty rates payable on products developed under the Neurimmune Agreement, including royalties payable on potential commercial sales of aducanumab.
(e) Net income and net income attributable to Biogen Inc. for the third quarter of 2018 includes the impact of impairment charges totaling $189.3 million related to certain IPR&D assets associated with our vixotrigine program and an adjustment to the value of our contingent consideration obligations related to our vixotrigine program for the treatment of TGN to reflect the lower cumulative probabilities of success, which resulted in a gain of $89.6 million in the third quarter of 2018.
(f) In late December 2018 we received feedback from the FDA regarding the design of the Phase 3 vixotrigine program for the treatment of TGN. Following this feedback, we are now planning to initiate the Phase 3 vixotrigine program for the treatment of TGN and, as a result, we adjusted the fair value of our contingent consideration obligations related to our vixotrigine program for the treatment of TGN to reflect the increased probabilities of success and recognized a loss of $80.6 million in the fourth quarter of 2018.
(g) Net income and net income attributable to Biogen Inc. for the fourth quarter of 2018 and the first quarter of 2017 includes $176.8 million and $328.2 million, respectively, of impairment charges related to our intangible asset associated with our U.S. license to Forward Pharma's intellectual property, including Forward Pharma's intellectual property related to TECFIDERA.
(h) Net income and net income attributable to Biogen Inc. for the fourth quarter of 2018 includes a net increase to income tax expense of $135.8 million reflecting the impact of electing to record deferred taxes on GILTI.
(i) Net income and net income attributable to Biogen Inc. for the fourth quarter of 2018 includes an upfront payment of $35.0 million to Ionis, as we exercised our option to obtain a worldwide, exclusive, royalty-bearing license from Ionis to develop and commercialize BIIB067.
(j) Net income and net income attributable to Biogen Inc. for the second quarter of 2017 includes a pre-tax charge to research and development expense of $300.0 million for an upfront payment made to BMS upon entering into our agreement to exclusively license BIIB092.
(k) Net income and net income attributable to Biogen Inc. for the second quarter of 2017 includes a pre-tax charge to acquired IPR&D of $120.0 million for an upfront payment to Remedy upon closing of the asset purchase transaction for BIIB093.
(l) Net income and net income attributable to Biogen Inc. for the second quarter of 2017 includes a pre-tax charge to research and development expense of $60.0 million for a developmental milestone that became payable to the former shareholders of iPierian upon dosing of the first patient in the Phase 2 study of BIIB092 for PSP.
(m) Net income attributable to Biogen Inc. for the fourth quarter of 2017 includes a pre-tax charge to noncontrolling interest of $150.0 million for a payment made to Neurimmune in exchange for a 15% reduction in the

BIOGEN INC. AND SUBSIDIARIESNOTES TO CONSOLIDATED FINANCIAL STATEMENTS — (Continued)
F- 82
previously negotiated royalty rates payable on products developed under the Neurimmune Agreement, including royalties payable on potential commercial sales of aducanumab.
(n) Net income and net income attributable to Biogen Inc. for the fourth quarter of 2017 includes pre-tax charges to research and development expense of $28.0 million and $50.0 million for an upfront payment and a continuation payment, respectively, to Alkermes.
(o) Net income and net income attributable to Biogen Inc. for the fourth quarter of 2017 includes a pre-tax charge to research and development expense of $25.0 million for an upfront payment to Ionis upon entering into a new collaboration agreement to identify new ASO drug candidates for the treatment of SMA.
(p) Net income and net income attributable to Biogen Inc. for the fourth quarter of 2017 includes $1,173.6 million related to the provisions of the 2017 Tax Act, including a $989.6 million expense under the Transition Toll Tax.
For additional information on our acquisitions of BIIB100, BIIB104, BIIB110 and BIIB093, please read Note 2, Acquisitions, to these consolidated financial statements. For additional information on our collaboration arrangements with Ionis, BMS and Alkermes, please read Note 19, Collaborative and Other Relationships, to these consolidated financial statements. For additional information on our collaboration arrangement with Neurimmune, please read Note 20, Investments in Variable Interest Entities, to these consolidated financial statements. For additional information on the amortization and impairment of acquired intangible assets, including our IPR&D intangible asset related to our vixotrigine program for the treatment of TGN and our TECFIDERA settlement and license agreement, please read Note 7, Intangible Assets and Goodwill, to these consolidated financial statements. For additional information on the 2017 Tax Act, please read Note 17, Income Taxes, to these consolidated financial statements.
27. Subsequent Events
Skyhawk Therapeutics, Inc.
In January 2019 we entered into a collaboration and research and development services agreement with Skyhawk Therapeutics, Inc. (Skyhawk) pursuant to which the companies will leverage Skyhawk’s SkySTAR technology platform with the goal of discovering innovative small molecule treatments for patients with neurological diseases, including MS and SMA. We will be responsible for the development and potential commercialization of any therapies resulting from this collaboration.
In connection with this agreement, we made an upfront payment of $74.0 million to Skyhawk. We may also pay Skyhawk up to a total of approximately $2.0 billion in additional milestone payments as well as potential royalties on net commercial sales. We expect to record research and development expense of approximately $35.0 million in the first quarter of 2019 related to this collaboration.
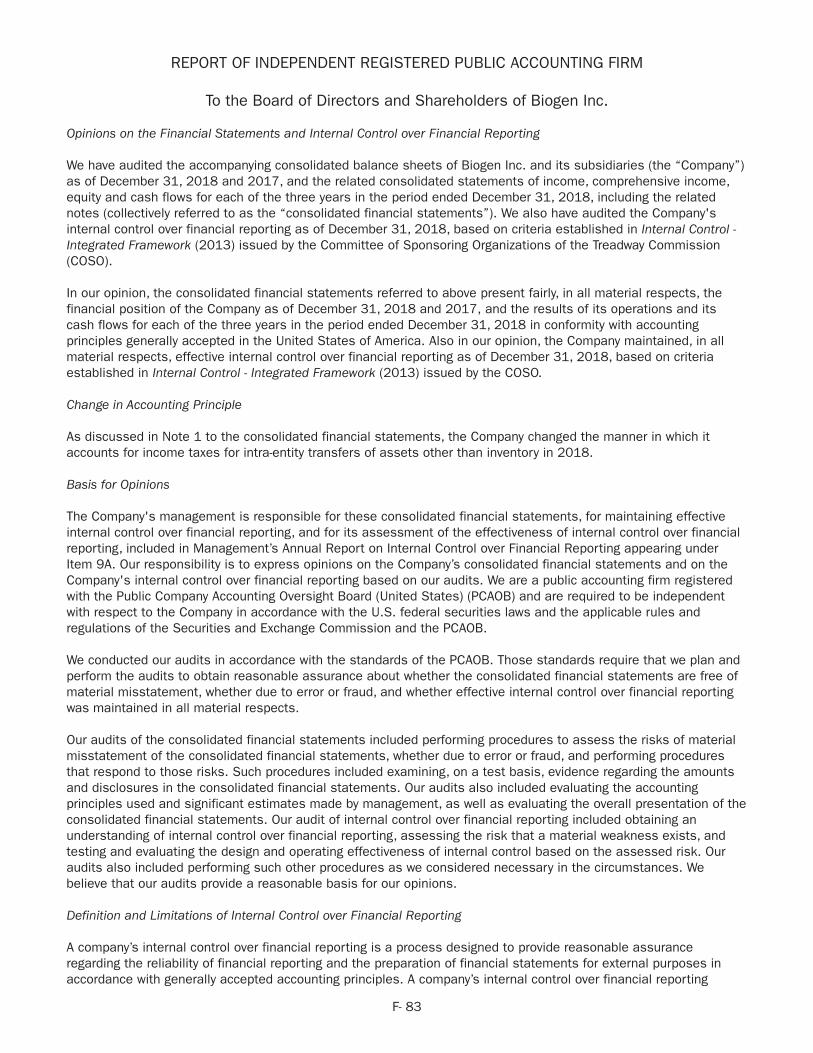
F- 83
REPORT OF INDEPENDENT REGISTERED PUBLIC ACCOUNTING FIRM
To the Board of Directors and Shareholders of Biogen Inc.
Opinions on the Financial Statements and Internal Control over Financial Reporting
We have audited the accompanying consolidated balance sheets of Biogen Inc. and its subsidiaries (the “Company”) as of December 31, 2018 and 2017, and the related consolidated statements of income, comprehensive income, equity and cash flows for each of the three years in the period ended December 31, 2018, including the related notes (collectively referred to as the “consolidated financial statements”). We also have audited the Company's internal control over financial reporting as of December 31, 2018, based on criteria established in Internal Control - Integrated Framework (2013) issued by the Committee of Sponsoring Organizations of the Treadway Commission (COSO).
In our opinion, the consolidated financial statements referred to above present fairly, in all material respects, the financial position of the Company as of December 31, 2018 and 2017, and the results of its operations and its cash flows for each of the three years in the period ended December 31, 2018 in conformity with accounting principles generally accepted in the United States of America. Also in our opinion, the Company maintained, in all material respects, effective internal control over financial reporting as of December 31, 2018, based on criteria established in Internal Control - Integrated Framework (2013) issued by the COSO.
Change in Accounting Principle
As discussed in Note 1 to the consolidated financial statements, the Company changed the manner in which it accounts for income taxes for intra-entity transfers of assets other than inventory in 2018.
Basis for Opinions
The Company's management is responsible for these consolidated financial statements, for maintaining effective internal control over financial reporting, and for its assessment of the effectiveness of internal control over financial reporting, included in Management’s Annual Report on Internal Control over Financial Reporting appearing under Item 9A. Our responsibility is to express opinions on the Company’s consolidated financial statements and on the Company's internal control over financial reporting based on our audits. We are a public accounting firm registered with the Public Company Accounting Oversight Board (United States) (PCAOB) and are required to be independent with respect to the Company in accordance with the U.S. federal securities laws and the applicable rules and regulations of the Securities and Exchange Commission and the PCAOB.
We conducted our audits in accordance with the standards of the PCAOB. Those standards require that we plan and perform the audits to obtain reasonable assurance about whether the consolidated financial statements are free of material misstatement, whether due to error or fraud, and whether effective internal control over financial reporting was maintained in all material respects.
Our audits of the consolidated financial statements included performing procedures to assess the risks of material misstatement of the consolidated financial statements, whether due to error or fraud, and performing procedures that respond to those risks. Such procedures included examining, on a test basis, evidence regarding the amounts and disclosures in the consolidated financial statements. Our audits also included evaluating the accounting principles used and significant estimates made by management, as well as evaluating the overall presentation of the consolidated financial statements. Our audit of internal control over financial reporting included obtaining an understanding of internal control over financial reporting, assessing the risk that a material weakness exists, and testing and evaluating the design and operating effectiveness of internal control based on the assessed risk. Our audits also included performing such other procedures as we considered necessary in the circumstances. We believe that our audits provide a reasonable basis for our opinions.
Definition and Limitations of Internal Control over Financial Reporting
A company’s internal control over financial reporting is a process designed to provide reasonable assurance regarding the reliability of financial reporting and the preparation of financial statements for external purposes in accordance with generally accepted accounting principles. A company’s internal control over financial reporting
F- 84
includes those policies and procedures that (i) pertain to the maintenance of records that, in reasonable detail, accurately and fairly reflect the transactions and dispositions of the assets of the company; (ii) provide reasonable assurance that transactions are recorded as necessary to permit preparation of financial statements in accordance with generally accepted accounting principles, and that receipts and expenditures of the company are being made only in accordance with authorizations of management and directors of the company; and (iii) provide reasonable assurance regarding prevention or timely detection of unauthorized acquisition, use, or disposition of the company’s assets that could have a material effect on the financial statements.
Because of its inherent limitations, internal control over financial reporting may not prevent or detect misstatements. Also, projections of any evaluation of effectiveness to future periods are subject to the risk that controls may become inadequate because of changes in conditions, or that the degree of compliance with the policies or procedures may deteriorate.
/s/PricewaterhouseCoopers LLPBoston, MassachusettsFebruary 6, 2019
We have served as the Company's auditor since 2003.

Bio
gen
201
8 A
nnua
l R
epor
t
215
Corporate Information
Board of Directors (as of April 22, 2019)
Stelios Papadopoulos, Ph.D.Chairman, Biogen Inc., Chairman, Exelixis, Inc. and Chairman, Regulus Therapeutics Inc.
Michel VounatsosChief Executive Officer, Biogen Inc.
Alexander J. Denner, Ph.D.Founding Partner and Chief Investment Officer, Sarissa Capital
Caroline D. DorsaRetired Executive Vice President and Chief Financial Officer, Public Service Enterprise Group Inc.
Nancy L. LeamingRetired Chief Executive Officer and President, Tufts Health Plan
Richard C. Mulligan, Ph.D.Mallinckrodt Professor of Genetics, Emeritus, Harvard Medical School and Executive Vice Chairman, Sana Biotechnology
Robert W. PangiaRetired Chief Executive Officer, Ivy Sports Medicine, LLC
Brian S. PosnerPrivate Investor and Founder and Managing Partner, Point Rider Group, LLC
Eric K. Rowinsky, M.D.President and Executive Chairman, RGenix, Inc.
The Honorable Lynn Schenk, J.D.Attorney, Former Chief of Staff to the Governor of California and Former U.S. Congresswoman
Stephen A. Sherwin, M.D.Clinical Professor of Medicine, University of California, San Francisco and Advisor to Life Sciences Companies
Stockholder InformationCorporate headquartersBiogen Inc.225 Binney StreetCambridge, MA 02142Phone: (617) 679-2000
SEC Form 10-KA copy of Biogen’s Annual Report on Form 10-K filed with the U.S. Securities and Exchange Commission is available at sec.gov and upon request to:
Investor RelationsBiogen Inc.225 Binney StreetCambridge, MA 02142Phone: (781) 464-2442
Transfer agentTo keep your contact information current and for stockholder questions regarding lost stock certificates, address changes and changes of ownership or names in which the shares are held, direct inquiries to:
ComputersharePhone: (781) 575-2879computershare.com
By regular mail:P.O. Box 505000Louisville, KY 40233-5000
By overnight delivery:462 South 4th StreetSuite 1600Louisville, KY 40202
Independent accountantPricewaterhouseCoopers LLP 101 Seaport BoulevardBoston, MA 02210
News releasesAs a service to our stockholders and prospective investors, Biogen’s news releases are usually posted within one hour of being issued and are available at no cost at investors.biogen.com.
Market informationOur common stock trades on the Nasdaq Global Select Market under the symbol “BIIB.”
blank page in Form 10-K paper

Concept, design and realisation PETRANIX Corporate and Financial Communications AGAdliswil, Zurichwww.petranix.com
PhotographyKate Parker, katetparker.comRenee Sprink, reneesprink.comLeah Cirker-Stark, leahcsphotography.com Jessica Tovar, jessicatovar.carbonmade.comDave White, davewhitephoto.comLara Woolfson, Studio Nouveau, thestudionouveau.com
PrintingDonnelley Financial Solutions, d�nsolutions.comB
ioge
n2
01
8 A
nnua
l R
epor
t 216

Bio
gen
201
8 A
nnua
l R
epor
t
02
1 Non-GAAP diluted earnings per share (EPS) and Free Cash Flow are Non-GAAP financial measures. A reconciliation of GAAP to Non-GAAP diluted EPS and Free Cash Flow amounts is set forth on pages 19–21 of this Annual Report.
2 GAAP diluted EPS for 2018 and 2017 includes charges of $125 million and $1,176 million, respectively, related to the impact of the Tax Cuts and Jobs Act of 2017.
3 Free Cash Flow for 2018 and 2017 reflects an increase in capital expenditures related to the construction of our large-scale biologics manufacturing facility in Solothurn, Switzerland.
HIG
HLI
GH
TS Strong financial performance
4 For 2018 and 2017 Other includes product revenues from FAMPYRA, FUMADERM, BENEPALI, FLIXABI and ZINBRYTA. For 2018 Other also includes product revenues from IMRALDI, which was launched in Europe in October 2018. For 2017 Other also includes product revenues from ALPROLIX and ELOCTATE through January 31, 2017. No product revenues for ALPROLIX and ELOCTATE were recognized subsequent to February 1, 2017, the effective date of the spin-off of our hemophilia business.
5 Interferon includes AVONEX and PLEGRIDY.
Free Cash Flow 1,3 ($ in millions)
2014
2015
2016
2017
2018
$2,279
$2,223
$2,706
$2,484
$3,917
Strong financial performance
Product Revenues ($ in millions and % of total product revenues)
Total Revenues ($ in millions)
GAAP Diluted EPS/Non-GAAP Diluted EPS 1
2014
2015
2016
2017
2018
$9,703
$10,764
$11,449
$12,274
$13,453
2014
2015
2016
2017
2018
$13.83
$17.01
$20.22
$12.37
$15.34
$16.93
$11.922
$21.582
$21.81
$26.20
TECFIDERA$4,274 $4,21439% 41%
Other4
$662 $6386% 5%
Interferon5
$2,363 $2,64622% 26%
TYSABRI$1,864 $1,97317% 19%
SPINRAZA$1,724 $88416% 9%
2017 2018
2018 2017
Product Revenues by Region (% of total product revenues)
U.S. Rest of the world
2016
62.5% 67.8%
71.8%
37.5% 32.2%
28.2%
20172018
+ 5 %Increase in total product revenues year over year
HIGHLIGHTS & CONTENTS CEO LETTER STRATEGY CULTURE & ENGAGEMENT PRODUCTS & PIPELINE EXECUTIVE COMMITTEE

2018 ANNUAL REPORT
Biogen
201
8 A
nnual Report
2018 ANNUAL REPORT
Biogen
201
8 A
nnual Report
2018 ANNUAL REPORT
Biogen
201
8 A
nnual Report
2018 ANNUAL REPORT
Biogen
201
8 A
nnual Report