bioimaging three-dimensional distribution of 7, 15 and 17 ... filebioimaging 3 (1995) 121–133....
TRANSCRIPT

Bioimaging3 (1995) 121–133. Printed in the UK
Three-dimensional distribution ofcentromeric or paracentromericheterochromatin of chromosomes 1,7, 15 and 17 in human lymphocytenuclei studied with light microscopicaxial tomography
Steffen Dietzel †, Eva Weilandt ‡¶, Roland Eils §‖, ChristianMunkel §‖, Christoph Cremer ‡§ and Thomas Cremer †§+
† Institute of Human Genetics and Anthropology, University of Heidelberg, D-69120Heidelberg, Germany‡ Institute of Applied Physics, University of Heidelberg, D-69120 Heidelberg, Germany§ Interdisciplinary Center of Scientific Computing, University of Heidelberg, D-69120Heidelberg, Germany‖ Graduiertenkolleg ‘Modeling and Scientific Computing in Mathematics and Science’University of Heidelberg, D-69120 Heidelberg, Germany
Submitted 29 December 1994, accepted 13 November 1995
Abstract. Light microscopic axial tomography was applied to examine the position ofperi- or paracentromeric chromosomal targets in nuclei of PHA-stimulated humanlymphocytes following two color fluorescencein situ hybridization with DNA probesfor 1q12 and 15p or 7c and 17c. Evaluation of hybridized nuclei was performed in aglass capillary device. By turning the capillary around its longitudinal axis eachnucleus could be viewed at any desired angle. To measure the true three-dimensionaldistance between two chromosomal targets, the nucleus was turned around until bothtargets were positioned in the same focal plane. Similarly, the true distance between atarget region and the center of the nucleus was estimated. The results provide evidencefor differences in the three-dimensional nuclear distribution of the target regions. Inparticular, 7c was positioned more peripherally than the other chromosomal targets.Experimental data were compared with several models for a distribution ofchromosomal targets under topological constraints. These models take into accountspatial limitations of the distribution of the chromosome territories which harbor thehybridized targets.
Keywords: nuclear topography, axial tomography, light microscopy
1. Introduction
Evidence that chromosomes occupy distinct territories inthe cell nucleus of animal and plant species has accumulated
¶ Present address: Abteilung fur experimentelle Physik, Universitat Ulm,D-89069 Ulm, Germany.+ To whom correspondence should be addressed at: Institut fur Human-genetik und Anthropologie, Universitat Heidelberg, Im Neuenheimer Feld328, D-69120 Heidelberg.
in recent years (for review see Cremeret al 1993),but data about the three-dimensional distribution of thesechromosome territories or of specific chromosome targetregions are still scarce. Different approaches have beenused to evaluate the distribution of target regions visualizedby in situ hybridization with chromosome specific DNA-probes. In two-dimensional approaches distances betweenhybridization signals were measured after projection ontoa plane (Rappoldet al 1984, Emmerichet al 1989a,
0966-9051/95/030121+13$19.50c© 1995 IOP Publishing Ltd 121

S Dietzelet al
Popp et al 1990, Hofers et al 1993b). The advantageof this approach is that conventional light microscopy issufficient to perform such studies and that large numbersof nuclei can be screened in a relative short time. Anobvious disadvantage is the loss of three-dimensionalinformation. For three-dimensional studies of chromosomaltarget positions, light optical sectioning with conventionalepifluorescence and confocal laser scanning microscopy(CLSM) has been applied (Manuelidis and Borden, 1988,Popp et al 1990, Ferguson and Ward 1992, Hofers et al1993a, Hulspaset al 1994). In spite of the advantagesof this approach, it should be noted that the optimallateral resolution which can be achieved with CLSM isconsiderably better than the axial resolution (200 nm versus500 nm). The optimal axial resolution of a conventionalfluorescence light microscope is even less (∼1 µm).
The anisotropic resolution of both conventional andconfocal light microscopy provides a severe problem foraccurate 3-D-distance measurements. In this study wedemonstrate the feasibility of a technique, termed lightmicroscopic axial tomography (Bradlet al 1992, 1994),which is suitable to overcome this problem. Nucleiwith specifically stained chromosome targets were placedinto a glass capillary. A device was constructed bywhich the capillary is placed exactly parallel to theobject stage of an epifluorescence microscope and can beturned around its axis for angles up to 360◦ (figure 1).This design makes it possible to choose anx, y-planefor any two object points (e.g. gravity centers of twohybridization signals) where both object points are in focus.Accordingly, the much better lateral resolution of thelight microscope can be exploited to obtain a true 3-D-distance measurement between the two points of interest.Images from signals positioned in the focal plane wererecorded by a CCD-camera. As compared with confocalmicroscopy the accuracy of distance 3-D-measurements bylight microscopic axial tomography is as good or even better(Bradl et al 1994). Axial tomography, however, is muchless expensive and the needs for computer-power and mass-storage requirements are smaller.
For a comparison of the distribution of target regionsfrom different chromosomes in the same population of cellnuclei, two color fluorescencein situ hybridization (FISH)experiments were carried out with probes delineating eitherthe chromosomal domains 1q12 and 15p1 or 7c and17c. To avoid problems which could possibly result fromchromatic aberrations when two target regions are stainedwith different fluorochromes, labeling of all targets in onenucleus was performed with one fluorochrome for axialtomographic measurements, while a second fluorochromewas used to achieve a discrimination between heterologoustargets.
Frequency distribution curves of observed distanceswere compared with several model distributions. Inaddition to a model which assumes the uniform andindependent distribution of point-like targets within a set
of nuclei (Rappoldet al 1984, Emmerichet al 1989a,Popp et al 1990, Ferguson and Ward 1992, Hofers et al1993a,b, Hulspaset al 1994), we have applied additionalmodels which take into account the spatial extension ofchromosome territories that harbor a given target region.(see the accompanying paper of Munkel et al).
2. Materials and methods
2.1. Cell culture and fixation
5 ml heparinized blood from five unrelated male and femalehealthy human donors were cultured for three days in50 ml RPMI 1640 with Na2CO3 (Serva), 20% fetal calfserum, 2 mM L-Glutamine (both Boehringer Mannheim),500 U/ml Penicillin, 0.5 mg/ml Streptomycin (Serva) and0.5 mg Phytohemagglutinin to stimulate proliferation ofT-lymphocytes (Seromed Biochrom, Berlin). Cells werecentrifuged at 180 g and pellets were washed with PBS(phosphate buffered saline, 140 mM NaCl, 2.7 mM KCl,1.5 mM KH2PO4, 6.5 mM Na2HPO4; pH 7,0) at 37◦C.Two fixation procedures were applied:
(a) fixation with hexandiol:Hexandiol-Buffer (750 mM 1,6-Hexandiol, Aldrich;
25 mM Tris-acetic acid pH 7,5; 5 mM MgCl2; adjustedto pH 3.2 with acetic acid) was dropped slowly into thecell suspension. After two washes in hexandiol-buffer thenuclei were stored in this buffer at 4◦C for two days up tosix months (Emmerichet al 1989b). Prior to hybridizationcells were washed with 2×SSC (standard saline citrate,1×SSC is 75 mM NaCl, 7,5 mM Na-citrate, pH 7,0).
(b) fixation with 1% formaldehyde:Cell suspensions were mixed with an equal volume of
2% formaldehyde buffered with PBS at pH 7.0 at roomtemperature and fixed for 10 minutes. Thereafter 30 mlice-cold PBS was added and cells were centrifuged. Aftera second wash in ice-cold PBS, cells were stored in PBScontaining 0.04% sodium azide at 4◦C for a minimumof one day or until use (up to several months). Prior tohybridization cells were washed in 0.9% NaCl at pH 2.0and 1µl 10% pepsin solution was added to 2 ml of thiscell suspension. After incubation at 37◦C for 5 minutesprotein digestion was stopped by adding 10 ml 0.9% NaClat pH 2 containing 50 mM MgCl2 and centrifugationwas carried out. Cells were suspended in 2 ml of thesupernatant. Postfixation was performed for 10 minutesby adding an equal volume of 2% formaldehyde in 2×PBScontaining 100 mM MgCl2. Thereafter 8 ml of ice-coldPBS was added, cells were centrifuged and washed twicewith 2×SSC.
2.2. DNA-probes and probe labeling
DNA-probes cloned from tandemly repetitive sequencesof human chromosomes 1, 7, 15 and 17 hybridizingto the following regions were applied: 1q12 (probe
122

3-D distribution of heterochromatin
Figure 1. Axial tomography of a human lymphocyte nucleus revealing two signals with a FITC-labeled 15p1 specific probe.In the image shown at the left the signals are positioned on top of each other and cannot be resolved. Successive turns ofthe nucleus, however, reveal two separate signals. The image on the right side shows both signals in focus and allows themeasurement of the true distance between the centers of the two hybridization targets. Bar indicates 10 µm. The turningaxis can be imagined in the paper plane from top to bottom.
pUC 1.77, Cookeet al 1979), 15p1 (D15Z1, Higginset al 1985), 7c (p7t1, Wayeet al 1987) and 17c(p17H8, Waye and Willard 1986). Nicktranslation wasperformed with fluorochrome-labeled nucleotides (FITC-12dUTP, Boehringer Mannheim, and TRITC- 4-dUTP,FluoroRed, Amersham) using standard procedures (Lichterand Cremer 1992). The two probes used in one two-colorFISH experiment were both labeled with FITC, while oneprobe was additionally labeled with TRITC.
2.3. Two-color FISH
Two-color FISH was performed (a) with pUC 1.77and D15Z1 and (b) with p7t1 and p17H8. Fixednuclei suspended in 2×SSC were equilibrated in 60%formamide/2×SSC overnight and then centrifuged. Tothe pellet 50µl of the following hybridization mixturewas added: 60% formamide, 2×SSC, 5% dextransulfate,including (a) 60 ng FITC-labeled D15Z1-DNA, 40 ngFITC- labeled pUC1.77 DNA, 20 ng TRITC- labeledpUC 1.77 DNA or (b) 60 ng FITC-labeled p7t1-DNA,40 ng FITC- labeled p17H8 DNA, 20 ng TRITC- labeledp17H8 DNA. Denaturation was carried out at 60◦C(hexandiol fixed nuclei) or 65◦C (formaldehyde fixednuclei) for 4 minutes; hybridization was accomplished at37◦C overnight. Finally, two washes with 2×SSC wereperformed.
2.4. Preparation of capillaries filled with nuclei foraxial tomography
5 µl of a suspension with hybridized nuclei were dilutedin 95 µl glycerol solution (90 parts glycerol and 5 partsPBS containing 100µg 1,4-Phenylendiamine) and filledinto a quartz-glass capillary (0.2 mm diameter, 1/100 mmthickness of wall, GLAS W. Muller, Berlin). The finalglycerol concentration (90%) had the same refraction indexas the capillary, which was placed into a tilting devicesimilar to that described elsewhere (Bradlet al 1992, 1994).90% glycerol was also used as immersion liquid.
2.5. Image acquisition
Images were taken with a cooled CCD-camera fromPhotometrics (Tucson, AZ) equipped with a Kodak KAF1400 chip. Only nuclei with a well preserved morphologyand round shape were included in the study.
Six FITC- and six TRITC-images were generally takenfrom each nucleus (figure 2). For each FITC- and TRITCimage pair the nucleus was turned interactively by the glasscapillary device to choose thex, y-plane optimally suitedto measure a particular distance within this focal plane,i.e. the distances from a given signal to the nuclear center(see below) or the distance between a pair of homologuesignals. For target–nuclear center distances an image of theequatorial plane of the nucleus according to the following
123

S Dietzelet al
Figure 2. Axial tomographic images were recorded in six turning positions (a–f) from a human lymphocyte nucleus afterdouble FISH with a 1q12 specific probe (labeled with FITC and TRITC) and a 15p1 specific probe (labeled with FITC only).For each position a schematic display of the recorded signals and distance measurements is shown in the center, the FITCimage is shown on the left and the corresponding TRITC image on the right side. Note that 1q12 signals are visible both inthe left and right series of images, while 15p1 signals are visible in the left images only. For measurements of the truetarget–nuclear-center distances the nucleus was turned around to a position where the respective target appeared both infocus and as close to the nuclear periphery as possible. For the two 1q12–nuclear center distances this was achieved atnuclear positions shown in (a) and (b), while the two 15p1–nuclear-center distances were recorded at the positions shown in(d) and (e). Homologous target–target distances were recorded at nuclear positions where both homologous signals were infocus and revealed their maximum distance (see (c) for 1q12 and (f) for 15p1). Bar indicates 10 µm.
criteria was recorded. The hybridization signal was in focusand at the same time positioned as near as possible atthe edge of the nucleus. In this plane the edge of thenucleus appeared sharpest and the diameter of the planewas maximal. For target–target distances thex, y-planewas chosen where both signals were observed in focus.
2.6. Nuclear center determination and distancemeasurements
Evaluation was done on a PC equipped with an Intel486DX50 processor. The hybridization signals wereidentified interactively, the software then thresholded thesignals and defined their centers. All distances werecalculated using the centers of the signals as referencepoints. The edge of the equatorial plane was fitted byan ellipse. Its center was calculated and defined as thenuclear center. The nuclear radius was then measured as thedistance from the nuclear center through the signal centerto the nuclear edge. For all 939 measured target–nuclear
center distances only one signal was noted outside the fittedellipse.
For comparison of distance measurements obtained innuclei with different radii, absolute distances were dividedby the nuclear radius. When relative target–nuclear centerdistances were calculated, the nuclear radius measured inthe respective equatorial image was used, while an averagenuclear radius from all equatorial images (up to four) wasused for the evaluation of relative target–target distances.
2.7. Statistics
To test for a statistically significant difference betweentwo experimentally derived cumulative frequency curvesof relative target–nuclear center or target–target distancesthe Kolmogorov–Smirnov two-sample test was applied.Differences between experimental and model curves weretested by the Kolmogorov–Smirnov one-sample test (Young1977). Ap-value smaller thanp < 0.05 was considered toindicate a significant difference.
124

3-D distribution of heterochromatin
Table 1. Number of 3-D-distance measurements in hexandiol- andformaldehyde-fixed human lymphocyte nuclei.
hexandiol-fixation formaldehyde-fixation
target–center target–target target–center target–target
1q12 158 71 67 3315p1 156 68 70 327c 129 59 107 6617c 137 65 115 65
2.8. Model distributions
Model curves used for comparison with experimentallyderived distances were obtained by Monte Carlo simulationexperiments as described in the accompanying paper(Munkel et al). These models take into account thattopological constraints play an important role even in thedistribution of point-like targets, if these targets are partof larger structures, such as chromosome territories. Incontrast to points, the distribution of a chromosome territoryrestricts the freedom of distribution for other territories.In each model hybridization signals were represented bypoints, while the nucleus was represented by a sphere.In addition, chromosome territories were represented bysmaller spheres with relative volumes corresponding to therelative DNA content of a given chromosome (Morten1991). Further, it was assumed that each point-likehybridization signal colocalized with its correspondingchromosome territory following certain topological rules(see Results).
3. Results
An axial tomographic device was used to measure 3-D-distances either between the gravity centers of hybridizationsignals and the gravity centers of PHA-stimulated humanlymphocyte nuclei (target–nuclear center distances) orbetween the gravity centers of the hybridization signalsof two homologous chromosome targets (target–targetdistances, figure 2). Figure 1 demonstrates the usefulnessof this device to turn around a given cell nucleus until twohybridization signals, which at first appear on top of eachother, can be resolved.
3.1. Measurements of distances between chromosometargets and the nuclear center
Cumulative frequency curves of target–nuclear center dis-tances were obtained in PHA-stimulated human lymphocytenuclei after two-color FISH experiments performed withthe 1q12 and 15p specific probes or the 7c and 17c probes(table 1, figure 3). For target–nuclear center distance mea-surements the turning of the capillary was continued untila given hybridization target was in focus and positionedas closely to the nuclear border as possible. While the
Table 2. Significance levels for the differences betweenexperimental target–nuclear center distributions accordingto the two-sided Kolmogorov–Smirnov test are given asp-values. Comparisons of target–nuclear center distancesperformed in the same nuclear population (i.e. 1q12/15p1or 7c/17c double hybridization experiments) are indicatedby asterisk. Significance levels were also calculated for allother combinations of targets from the differentexperiments. hex: hexandiol fixed human lymphocytenuclei; form: formaldehyde fixed human lymphocytenuclei.
hex form hex form hex form
15p1 7c 17c
1q12> 0.1∗ > 0.1∗ < 0.005 < 0.001 < 0.05> 0.117c > 0.05 > 0.1 < 0.001∗ < 0.001∗
7c < 0.005< 0.001
target–nuclear center distances for the 1q12 and 15p tar-gets showed no significant difference (p > 0.1), a highlysignificant difference was found for target–nuclear centerdistances obtained for the 7c and 17c targets (p < 0.001)(table 2). The same results were obtained in hexandiol-and formaldehyde fixed nuclei obtained from five unrelatedmale and female individuals. Table 1 gives the number of3-D-distance measurements performed in hexandiol fixedand formaldehyde fixed cell nuclei hybridized with the re-spective DNA probes.
3.2. Measurements of distances between homologouschromosome targets
For target–target distance measurements the turning ofthe capillary was continued until the two signals wereapparently both in focus and separated from each otheras much as possible. In this focal plane the true 3-D-distance between the two signals can be measured. Atany other angle the measured distance becomes smallerreflecting only a projection of the true distance.
The cumulative frequency distribution curves obtainedfor distances between the two 17c target regions show ashift towards smaller distances when compared with therespective curves for the 7c target regions (figure 4(b,d)).This shift is not significant, but corresponds to thedifference in the three-dimensional distribution of the 7c
125

S Dietzelet al
Figure 3. Cumulative frequency distribution curves obtained for target–nuclear center distances measured in axialtomographic sections of human lymphocyte nuclei. Nuclei were fixed with either hexandiol (a,b) or formaldehyde (c,d) andsubjected to double fluorescence in situ hybridization with probes specific for 1q12/15p1 (a, c) or 7c/17c (b,d) (for details ofmeasurements compare figure 2 and Methods). Distances are given as percent of the nuclear radius. The two-sidedKolmogorov–Smirnov test indicates a highly significant difference between 7c and 17c target–nuclear center distances bothin hexandiol- and formaldehyde-fixed nuclei (p < 0.001). No significant difference was obtained for 1q12 and 15p1target–nuclear-center distances (compare table 2).
and 17c targets as described above for target–nuclear centerdistances, since signals located more interior should also belocated closer to each other. A significant difference (p <
0.005) was obtained for homologous target–target distancesmeasured for the 1q12 and 15p regions in hexandiolfixed (figure 4(a)) but not in formaldehyde fixed nuclei(figure 4(c)). Significance levels are given in table 3.
Notably, the reported significant differences in thethree-dimensional distribution of chromosome targets referto overall differences observed in populations of cellnuclei. In individual nuclei a reverse order could be
observed; for example, both chromosome 17 centromereswere occasionally observed to be more peripheral than thetwo chromosome 7 centromeres.
3.3. Comparison of observed with model distributionsof distances
Observed distributions for target–nuclear-center and target–target distances were compared with various modeldistributions of distances (figures 5 and 6). A previouslyused model (model 1) describes the distribution of distances
126

3-D distribution of heterochromatin
Figure 4. Cumulative frequency distribution curves obtained for homologous target–target distances measured in axialtomographic sections of human lymphocyte nuclei fixed with either hexandiol (a,b) or formaldehyde (c,d) (for further detailscompare legend to figure 3)). The two-sided Kolmogorov–Smirnov test indicates a significant difference between the 1q12and 15p1 homologous target–target distances (p < 0.005) in hexandiol, but not in formaldehyde-fixed nuclei. In agreementwith target–center distances (compare figure 3 b,d), 17c target–target distances were generally smaller than 7c target–targetdistances, but this difference was not significant (compare table 3).
for points reflecting the position of the centromeric (orparacentromeric) heterochromatin under the assumptionthat these points are randomly, i.e. uniformly andindependently, distributed in a sphere. This model,however, does not take into account that the freedom ofchromosomal target distributions is restricted because thetargets are part of chromosome territories. Consideringseveral possible types of topological restrictions, models 2–5 were established (Munkelet al, see accompanying paper).While the new models have in common the assumptionof a ‘random’ nuclear distribution of entire, mutuallyexclusive chromosome territories, i.e. a distribution of
the territories which is solely influenced by topologicalconstraints of territory size and shape, they make differentassumptions regarding the distribution of the point-liketargets within and/or at the surface of these territories. Inmodel 2 we assume that targets are located at the center ofeach territory. Note that model 2 is suitable to describethe distribution of the gravity centers of chromosometerritories. In model 3 a random distribution of the targetswithin the model territories is considered, while in model 4targets are randomly distributed at the territory surface.Model 5 takes into account a possible ‘Rabl - orientation’of the targets towards a centrosome (Rabl 1885). For
127

S Dietzelet al
Table 3. Significance levels for the differencesbetween experimental homologous target–targetdistributions according to the two-sidedKolmogorov–Smirnov test are given asp-values.Comparisons of target–target distances performed inthe same nuclear population (i.e. 1q12/15p1 and7c/17c double hybridization experiments) are indicatedby asterisks. Significance levels were also calculatedfor all other combinations of targets from the differentexperiments. hex: hexandiol-fixed human lymphocytenuclei; form: formaldehyde-fixed human lymphocytenuclei.
hex form hex form hex form
15p1 7c 17c
1q12< 0.005∗ > 0.1∗ > 0.1 > 0.1 > 0.1 > 0.117c > 0.1 > 0.1 > 0.1∗ > 0.05∗
7c < 0.05 < 0.05
this purpose it is assumed that a point-like ‘centrosome’is located on the nuclear envelope. Model 5 shares theassumption with model 4 that the targets are located atchromosome territory surfaces but in contrast to model 4 thefreedom of distribution of target positioning at the territorysurface is restricted in model 5, i.e. chromosome territoriesare oriented in such a way that a line can be drawn throughthe center of the territory and the two points representing thecentromeric heterochromatin position and the ‘centrosome’position, respectively. Based on these assumptions theresulting frequency distributions of model target–nuclearcenter and target–target distances were computed in MonteCarlo simulations (for details see Munkel et al).
For all probes the measured target–nuclear-centerdistances were clearly discordant with the distributionspredicted by models 2 and 5 (figure 5). Better fitsof experimental target–nuclear center distances for 1q12(figure 5(a,b)), 15p1 (figure 5(c,d)) and 17c (figure 5(g,h))were observed with the distributions predicted by models 3and 4, although even then a significant difference betweenexperimental and model curves was quite often noted(table 4). For 7c-target–nuclear-center distances the bestapproximation was observed for model 1 (figure 5(e, f))(see Discussion).
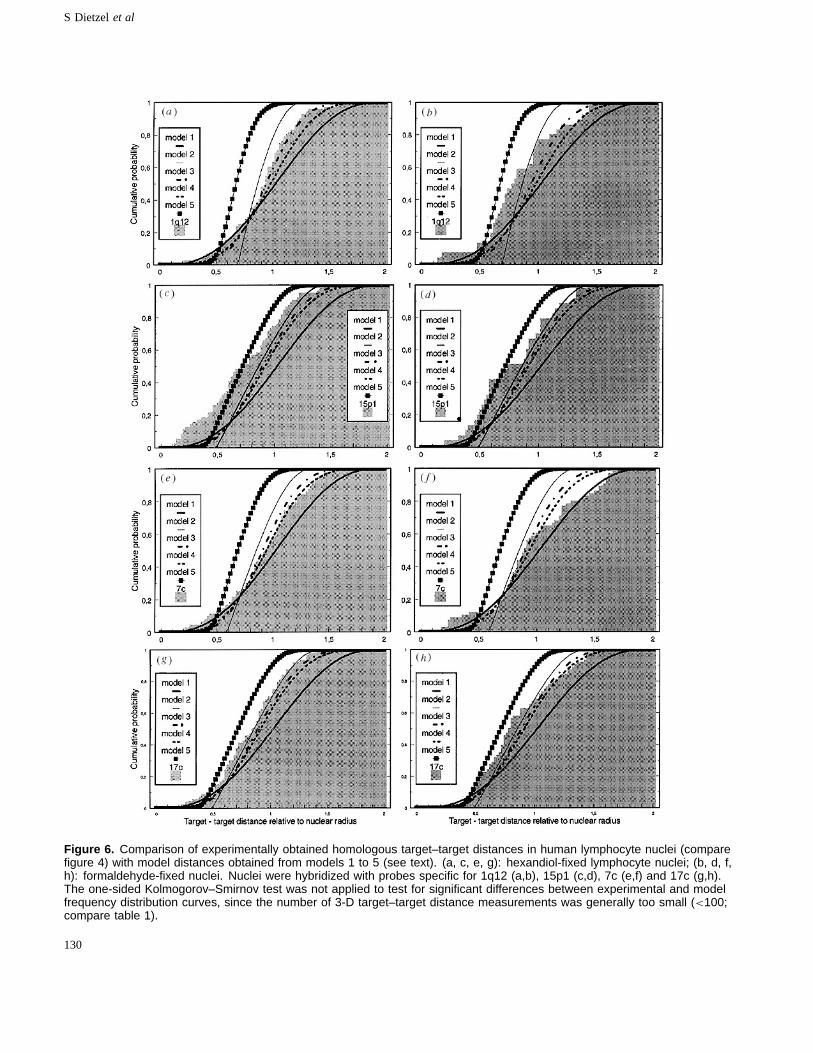
Target–target distances for 7c showed a more or lessreasonable fit with models 1, 3 and 4, but not with models 2and 5 (figure 6(e, f)). Target–target distances for probes1q12, 15p1 and 17c were also clearly discordant withmodel 1 and model 2 distributions (figure 6(a–d, g, h)).Closer fits of 1q12 and 17c target–target distances wereobtained with models 3 and 4 (figure 6(a,b,g,h)). 15p1target–target distances did not provide a reasonable fit withany of the models.
Table 4. Significance levels for the differences betweenexperimental target–nuclear center distributions and modeldistributions according to the one-sided Kolmogorov–Smirnovtest are given asp-values. The test was performed for allexperiments where the number of distance measurements fora given target was>100 (Young 1977). This condition wasnot fulfilled for1q12 and 15p1 target–nuclear center distancemeasurements in formaldehyde fixed nuclei. hex:hexandiol-fixed human lymphocyte nuclei; form:formaldehyde-fixed human lymphocyte nuclei.
hex hex hex form hex form
1q12 15p1 7c 17c
model 1< 0.001< 0.001< 0.001> 0.05 < 0.001< 0.001model 2< 0.001< 0.001< 0.001< 0.001< 0.001< 0.001model 3< 0.05 < 0.005< 0.001< 0.001< 0.001> 0.1model 4> 0.1 < 0.05 < 0.001< 0.001< 0.001> 0.1model 5< 0.001< 0.001< 0.001< 0.001< 0.05 < 0.001
4. Discussion
Fluorescencein situ hybridization (FISH) with DNA-probesfor the centromeric and paracentromeric heterochromatinof chromosomes 1, 7, 15 and 17 was performed inPHA-stimulated human lymphocyte cell nuclei. An axialtomographic approach was applied to study the three-dimensional arrangements of these targets. This studyfor the first time demonstrates the practical usefulnessof the axial tomographic approach to obtain 3-D-distancemeasurements with a resolution comparable to or evenbetter than the accuracy possible with a CLSM (Bradlet al1994). While 3-D-distances with the latter approach haveto be calculated from stacks of confocal serial sections, inthe case of axial tomography the operator can choose anappropriate single image to measure.
4.1. Association of the NOR-bearing 15p1 targets withnucleoli
In one of two experiments comparing 1q12 with 15p1target–target distances a remarkable frequency of short15p1 distances was noted. This result cannot be explainedby a more interior localization of 15p1 as compared with1q12 targets, since target–nuclear center distances were notsignificantly different. Instead, this result may suggesta frequent association of the NORs of both 15p1 targetswith the same nucleolus in this experiment but not in theother. Cell populations obtained from different individualsor cell cycle dependent differences in the number ofnucleoli and their association with chromosome 15 NORsprovide possible explanations for the interexperimentalvariability of 15p1 target–target distributions. The numberand distribution of nucleoli in PHA-stimulated lymphocyteschanges when these cells proceed through the first andsubsequent cell cycles. While in unstimulated lymphocytesmost nuclei have only one nucleolus, this number was
128

3-D distribution of heterochromatin
Figure 5. Comparison of experimental target–nuclear-center distances in human lymphocyte nuclei (compare figure 3) withdistances obtained from Monte Carlo simulations of models 1 to 5 (see text). (a, c, e, g): hexandiol-fixed lymphocyte nuclei;(b, d, f, h): formaldehyde-fixed nuclei. Nuclei were hybridized with probes specific for 1q12 (a,b), 15p1 (c,d), 7c (e,f) and 17c(g,h). The one-sided Kolmogorov–Smirnov test was applied to test for significant differences between experimental andmodel frequency distribution curves of distances (compare table 4).
129
S Dietzelet al
Figure 6. Comparison of experimentally obtained homologous target–target distances in human lymphocyte nuclei (comparefigure 4) with model distances obtained from models 1 to 5 (see text). (a, c, e, g): hexandiol-fixed lymphocyte nuclei; (b, d, f,h): formaldehyde-fixed nuclei. Nuclei were hybridized with probes specific for 1q12 (a,b), 15p1 (c,d), 7c (e,f) and 17c (g,h).The one-sided Kolmogorov–Smirnov test was not applied to test for significant differences between experimental and modelfrequency distribution curves, since the number of 3-D target–target distance measurements was generally too small (<100;compare table 1).
130

3-D distribution of heterochromatin
shown to increase in 3-day cultures to an average numberof 2.7 involving about 8 of the 10 NOR-regions (Wachtleret al 1980 and 1990).
4.2. Similarities and differences between observedtarget distributions
For both formaldehyde and hexandiol fixed nuclei our re-sults indicate that chromosome 7 centromeric heterochro-matin was distributed significantly more peripherally than17c heterochromatin. A significant difference was not ob-served for target–nuclear center distances of the paracen-tromeric heterochromatin of chromosomes 1 and 15. Acomparison of 7c distributions with the distribution of 1q12and 15p1 also supported the more peripheral localization of7c, but it should be remembered that 7c/17c and 1q12/15p1distributions were recorded in different experiments.
Two previous studies on the 3-D-positioning ofcentromeric or paracentromeric chromosome regions innuclei of PHA-stimulated human lymphocytes have focusedon the influence of the cell cycle. Ferguson and Ward(1992) noted a change in the positioning of peri- andparacentromeric heterochromatic blocks present at 1q12,7c, 11c and 17c when the cells proceeded from G0/G1 to G2
during the first cell cycle after stimulation. These targetsoccupied a more peripheral position in G1 and a morecentral position in G2. In comparison with the positioningof 7c, the 17c targets were located more interior in bothG0/G1- and G2-nuclei, although Ferguson and Ward do notexplicitly note such a finding. In another recent studyapplying laser confocal microscopy Hulspaset al (1994)found a more peripheral localization of 11c in the G1-phasecompared to non-stimulated nuclei. Cell cycle dependentchanges of centromer positions were also noted in a 2-D-study performed by Weimeret al (1992).
Our experiments, which were performed with unsyn-chronized lymphocyte cultures, cannot add to the questionof target positioning during the cell cycle. In spite of thislimitation the observed overall differences in the distribu-tions of two targets noted above remain valid since the re-spective distributions were compared after two-color FISHin the same set of nuclei. Hofers et al (1993 a,b) havedemonstrated a different distribution of 7c and 15p1 incultured human fibroblasts using both a 2-D- and a 3-D-approach. In their 3-D-study (Hofers et al 1993a) theseauthors observed a significantly more exterior location of7c as compared with 15p1. In summary, 3-D-studies fromthree groups support the conclusion that 7c is located moreexterior than 1q12, 15p1 and 17c targets (Ferguson andWard 1992, Hoferset al 1993a, present study).
Evidence for cell type dependent differences ofchromosome topology (for reviews see Manuelidis 1990,Lichter et al 1991, Haaf and Schmid 1991) suggests thatthis topology plays a role in the dynamic architecture of thecell nucleus. However, except for the positioning of 15p,which may change depending on the activity of its NORs,
we lack any functional clues for the possible significanceof cell cycle or cell type specific changes in the distributionof chromosome targets.
4.3. Comparison of observed target distributions withmodel distributions
In previous studies observed target distributions have oftenbeen compared with model distributions assuming therandom, i.e. uniform and independent, distribution of point-like targets within the nuclear space modeled e.g. by asphere, an ellipsoid or a flat cylinder with circular orellipsoid bottom (compare model 1; Rappoldet al 1984,Emmerichet al 1989a, Ferguson and Ward 1992, Weimeret al 1992, Hofers et al 1993a, b, Hulspaset al 1994).However, such a comparison neglects the fact that ahybridized chromosome target is part of a chromosometerritory. This fact has substantial implications for thefreedom of target distributions in the cell nucleus. Wehave therefore developed models 2–5, which simulatetarget distributions under topological constraints. Model 2describes the distribution of the centers of chromosometerritories, while models 3–5 describe the distribution ofpoint-like targets located randomly within (model 3) or atthe surface of the territories either at random (model 4)or in a specifically oriented way (model 5, for details seeMunkel et al, accompanying paper). These models predicta highly significantly more interior location of point-liketargets, which belong to large chromosome territories ascompared with small ones. The observations discussedabove point to the opposite tendency in PHA-stimulatedlymphocyte nuclei for 7c and 17c targets, i.e. the 17ctargets, although they belong to the smaller territory, werefound to be significantly more interior than the 7c targets.
A close fit of observed and model distributions ofdistances is intriguing, but such a correlation does not, ofcourse, prove that the assumptions on which the calculationof the model distribution was based are appropriate toexplain the observed distribution. The distribution of7c–nuclear-center distances provides a case in point:cumulative frequency curves showed more similarity withmodel 1 than with the other models. However, it would beinvalid to conclude from these comparisons that topologicalconstraints played an insignificant role in the distributionof these targets. Comparisons of the experimental dataobtained for 1q12, 15p1 and 17c target distributions withmodels 1–5 show the closest similarity for models 3 and4, while the data are clearly contradictory to models 2and 5. Confocal serial sections of painted chromosome7-territories, as well as other territories with differentlycolored centromeric targets have indicated the preferentialpositioning of centromeric heterochromatin at chromosometerritory surfaces, although occasionally these targets werealso noted in the territory interior (Eilset al 1995b andour unpublished data). Accordingly, models 3 and 4appear most suitable at present to describe the distribution
131

S Dietzelet al
of centromere targets under topological constraints. Thefact that 7c targets were distributed highly significantlymore peripherally and 17c targets more centrally thanpredicted by these models reinforces the view that unknownbiological factors may influence target distributions inaddition to topological constraints (see above). Thereis a strong need to develop more sophisticated models.For simplicity, our present models assume a sphericalconfiguration of chromosome territories and do not takeinto account the wide variability of territory shapes and thepossible influence of neighboring territories on their shapes(Eils et al 1995a,b and our unpublished data). Furthermore,these models neglect additional topological constraints,which arise in case that territories were generally attachedwith a part of their surface to the nuclear lamina. Thedevelopment of more refined models is at present limited bythe poor knowledge of the three-dimensional organization,flexibility and positioning of chromosome territories.
Acknowledgments
This work was supported by grants from the DeutscheForschungsgemeinschaft to C.C. and T.C. (Cr60/11-1 andCr59/14-3). We thank Dr J Bradl for valuable technicaladvice in axial tomography.
References
Bradl J, Hausmann M, Ehemann V, Komitowski D and CremerC 1992 A tilting device for three-dimensional microscopy:application toin situ imaging of interphase cell nucleiJ.Microsc. 168 47–57
Bradl J, Hausmann M, Schneider B, Rinke R and Cremer C1994 A versatile 2 Pi-tilting device for fluorescencemicroscopesJ. Microsc.176 211–21
Cooke H J and Hindley J 1979 Cloning of human satellite IIIDNA: Different components are on different chromosomesNucleic Acids Res.6 3177–97
Cremer T, Kurz A, Zirbel R, Dietzel S, Rinke B, Schrock E,Speicher M R, Mathieu U, Jauch A, Emmerich P, ScherthanH, Ried T, Cremer C and Lichter P 1993 Role ofChromosome Territories in the functionalcompartmentalization of the cell nucleusCold SpringHarbor Symp. Quant. Biol.58 777–92
Eils R, Bertin E, Saracoglu K, Rinke B, Schrock E, Parazza F,Usson Y, Robert-Nicoud M, Stelzer E H K, Chassery J M,Cremer T and Cremer C 1995 Application of laser confocalmicroscopy and 3-D-Voronoi diagrams for volume andsurface estimates of interphase chromosomesJ. Microsc.177 150–61
Eils R, Dietzel S, Bertin E, Granzow M, Schrock E, Speicher MR, Volm T, Ried T, Robert-Nicoud M, Cremer C andCremer T 1996 Three-dimensional reconstruction of paintedhuman interphase chromosomes: active and inactiveX-chromosome territories have similar volumes but differ insurface and shape, submitted
Emmerich P, Loos P, Jauch A, Hopman A H N, Wiegand J,Higgins M J, White B N, van der Ploeg M, Cremer C andCremer T 1989a Doublein situ hybridization incombination with digital image analysis: A new approach
to study interphase chromosome topologyExp. Cell. Res.181 126–40
Emmerich P, Jauch A, Hofmann M C, Cremer T and Walt H1989b Interphase cytogenetics in paraffin embeddedsections from human testicular germ cell tumor xenograftsand in corresponding cultured cellsLab. Invest.61 235–42
Ferguson M and Ward D C 1992 Cell cycle dependentchromosomal movement in pre-mitotic humanT-lymphocyte nucleiChromosoma101 557–65
Haaf T and Schmid M 1991 Chromosome topology inmammalian interphase nucleiExp. Cell. Res.192 325–32
Higgins M J, Wang H, Shtromas I, Haliotis T, Roder J L,Holden J J A andWhite B N 1985 Organization of arepetitive human 1.8 kb KpnI sequence localized in theheterochromatin of chromosome 15Chromosoma93 77–86
Hofers C, Baumann P, Hummer G, Jovin T M and Arndt-JovinD J 1993a The localization of chromosome domains inhuman interphase nuclei. Three-dimensional distancedeterminations of fluorescencein situ hybridization signalsfrom confocal laser scanning microscopyBioimaging196–106
Hofers C, Jovin T M, Hummer G and Arndt-Jovin D J 1993bThe localization of chromosome domains in humaninterphase nuclei. Semi-automated two-dimensional imageacquisition and analysis of fluorescencein situ hybridizationsignalsBioimaging1 107–18
Hulspas R, Houtsmuller A B, Krijtenburg P J, Bauman J G Jand Nanninga N 1994 The nuclear position ofpericentromeric DNA of chromosome 11 appears to berandom in G0 and non-random in G1 human lymphocytesChromosoma103 286–92
Lichter P, Boyle A L, Cremer T and Ward D C 1991 Analysisof genes and chromosomes by non-isotopicin situhybridizationGen. Anal. Tech. Appl.8 24–35
Lichter P and Cremer T 1992 Chromosome analysis bynon-isotopicin situ hybridizationHuman Cytogenetics—APractical Approach2nd edn, vol 1, ed D E Rooney and BH Czepulkowski (Oxford: IRL Press) p 157
Manuelidis L and Borden J 1988 Reproduciblecompartmentalization of individual chromosome domains inhuman CNS cells revealed byin situ hybridization andthree-dimensional reconstructionChromosoma96 397–410
Manuelidis L 1990 A view of interphase chromosomesScience250 1533–40
Morten N E 1991 Parameters of the human genomeProc. Natl.Acad. Sci. USA88 7474–6
Munkel C, Eils R, Imhoff J, Dietzel S, Cremer C and Cremer T1996 Simulation of the distribution of chromosome targetsin cell nuclei under topological constraintsBioimaging3108–20
Popp S, Scholl H P, Loos P, Jauch A, Stelzer E, Cremer C andCremer T 1990 Distribution of chromosome 18 and Xcentric heterochromatin in the interphase nucleus ofcultured human cellsExp Cell. Res.189 1–12
Rabl C 1885Uber ZelltheilungMorphologisches Jahrbuch(Leipzig) 10 214–330
Rappold G A, Cremer T, Hager H D, Davis K E, Muller C Rand Yang T 1984 Sex chromosome position in humaninterphase nuclei as studied byin situ hybridization withchromosome specific DNA probesHum. Gen.67 317–25
Wachtler F, Ellinger A and Schwarzacher H G 1980 Nucleolarchanges in human phytohemagglutinin-stimulatedlymphocytesCell Tissue Res.213 351–60
Wachtler F, Roubicek C, Schedle A, Mosgoller W, Bretis G andSchwarzacher H G 1990 Nucleolus organizer regions inhuman lymphocytes as studied with premature chromosome
132

3-D distribution of heterochromatin
condensationHum. Gen.84 244–8Waye J S, England S B and Willard H F 1987 Genomic
organization of alpha satellite DNA on human chromosome7: Evidence for two distinct alphoid domains on a singlechromosomeMolec. Cell Biol.7 349–56
Waye J S and Willard H F 1986 Molecular analysis of a deletionpolymorphism in alpha satellite of human chromosome 17:evidence for homologous unequal crossing-over andsubsequent fixationNucl. Acid Res.14 6915–27
Weimer R, Haaf T, Poot M and Schmid M 1992Characterization of centromere arrangements and test forrandom distribution in G0, G1, S, G2, G1′ and early S′
phase in human lymphocytesHum. Gen.88 673–82Young I T 1977 Proof without prejudice: use of the
Kolmogorov-Smirnov Test for the analysis of histogramsfrom flow systems and other sourcesJ. Histochem.Cytochem.25 935–41
133