bioinformatics databases - yale university
TRANSCRIPT

1(c
)M
ark
Ger
stei
n,1
999,
Yal
e,b
ioin
fo.m
bb
.yal
e.ed
u
BIOINFORMATICSDatabases
Mark Gerstein, Yale Universitybioinfo.mbb.yale.edu/mbb452a
2(c
)M
ark
Ger
stei
n,1
999,
Yal
e,b
ioin
fo.m
bb
.yal
e.ed
u
Contents: Databases
• Structuring Information inTables
• Keys and Joins• Normalization• Complex RDB encoding• Indexes and Optimization• Forms and Reports• Clustering & Trees• Function Classification and
Orthologs• The Genomic vs. Single-
molecule Perspective
• Folds in Genomes, shared &common folds
• Genome Trees• Bulk Structure Prediction• Extent of Fold Assignment:
the Bias Problem• Correcting for Biases with
Sampling• Cross-tabulation, folds and
functions• Analysis of Expression Data• Analysis of Other Whole
Genome Datasets
3(c
)M
ark
Ger
stei
n,1
999,
Yal
e,b
ioin
fo.m
bb
.yal
e.ed
u
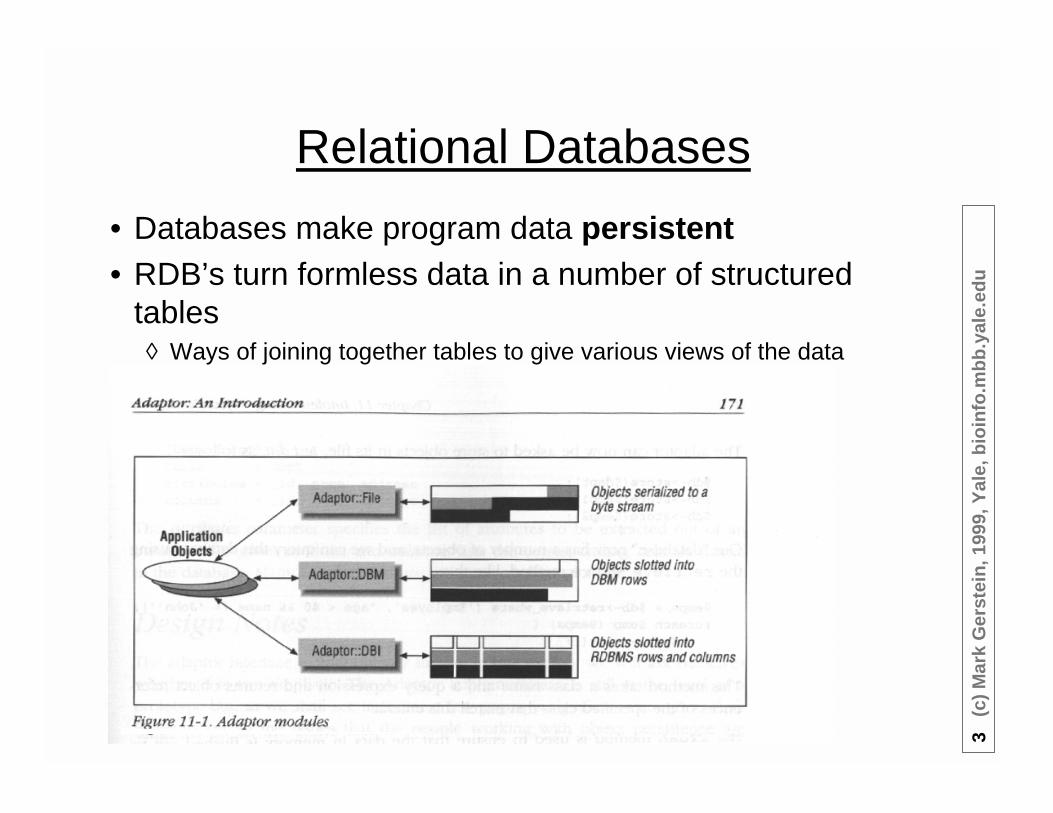
Relational Databases
• Databases make program data persistent• RDB’s turn formless data in a number of structured
tables◊ Ways of joining together tables to give various views of the data

4(c
)M
ark
Ger
stei
n,1
999,
Yal
e,b
ioin
fo.m
bb
.yal
e.ed
u
This type of “membership” analysis has been performed previously in termsof the occurrence of sequence motifs, families, functions, and biochemicalpathways. Starting from the most basic units, genomes have been compared interms of the relative frequencies of short oligonucleotide and oligopeptide“words” (Blaisdell et al., 1996; Karlin & Burge, 1995; Karlin et al., 1992;Karlin et al., 1996). The degree of gene duplication in a number of genomeshas been ascertained (Brenner et al., 1995; Koonin et al., 1996b; Riley &Labedan, 1997; Wolfe & Shields, 1997; Gerstein, 1997; Tamames et al.,1997). Other analyses have looked at how many highly conserved sequencefamilies in one organism are present in another (Green et al., 1993; Koonin etal., 1995; Tatusov et al., 1997; Ouzounis et al., 1995a,b; Clayton et al., 1997).Finally, if sequences can be related to specific functions and pathways, onecan see whether homologous sequences in two organisms truly have the samerole (ortholog vs. paralog) and whether particular pathways are present orabsent in different organisms (Karp et al., 1996a; Karp et al., 1996b; Kooninet al., 1996a; Mushegian & Koonin, 1996; Tatusov et al., 1996, 1997). Thiswork has yielded many interesting conclusions in terms of pathways that aremodified or absent in certain organisms. For instance, the essential citric acidcycle is found to be highly modified in H. influenzae (Fleischmann et al.,
UnstructuredData

5(c
)M
ark
Ger
stei
n,1
999,
Yal
e,b
ioin
fo.m
bb
.yal
e.ed
u
Semi-Structured
Data
REMARK 8 HET GROUP TRIVIAL NAME: FLAVIN ADENINE DINUCLEOTIDE (FAD) 1FNB 79
REMARK 8 CAS REGISTRY NUMBER: 146-14-5 1FNB 80
REMARK 8 SEQUENCE NUMBER: 315 1FNB 81
REMARK 8 NUMBER OF ATOMS IN GROUP: 53 1FNB 82
REMARK 8 1FNB 83
REMARK 8 HET GROUP TRIVIAL NAME: PHOSPHATE 1FNB 84
REMARK 8 SEQUENCE NUMBER: 316 1FNB 85
REMARK 8 NUMBER OF ATOMS IN GROUP: 5 1FNB 86
REMARK 8 1FNB 87
REMARK 8 HET GROUP TRIVIAL NAME: SULFATE 1FNB 88
REMARK 8 SEQUENCE NUMBER: 317 1FNB 89
REMARK 8 NUMBER OF ATOMS IN GROUP: 5 1FNB 90
REMARK 8 1FNB 91
REMARK 8 HET GROUP TRIVIAL NAME: K2 PT(CN)4 1FNB 92
REMARK 8 CHARGE: 2- ( PT(CN)4 -- ) 1FNB 93
REMARK 8 SEQUENCE NUMBER: PT1 - PT7 1FNB 94
REMARK 8 NUMBER OF ATOMS IN GROUP: 9 1FNB 95
REMARK 8 ADDITIONAL COMMENTS: BINDING SITES USED IN MIR PHASING 1FNB 96
REMARK 8 1FNB 97
REMARK 8 HEAVY ATOM PARAMETERS ARE AS FOLLOWS: 1FNB 98
REMARK 8 PT PT 1 11.832 -8.309 27.027 0.68 33.00 1FNB 99
REMARK 8 PT PT 2 13.996 -2.135 13.212 0.42 40.00 1FNB 100
REMARK 8 PT PT 3 33.293 18.752 27.229 0.32 42.00 1FNB 101
REMARK 8 PT PT 4 19.961 -15.348 -10.328 0.23 28.00 1FNB 102
REMARK 8 PT PT 5 8.312 14.713 35.679 0.26 31.00 1FNB 103
REMARK 8 PT PT 6 27.594 -7.790 23.540 0.14 35.00 1FNB 104
REMARK 8 PT PT 7 15.917 -9.001 12.608 0.30 50.00 1FNB 105
REMARK 8 1FNB 106
REMARK 8 HET GROUP TRIVIAL NAME: URANYL NITRATE (UO2--) 1FNB 107
REMARK 8 EMPIRICAL FORMULA: UO2 (NO3)2 1FNB 108
REMARK 8 CHARGE: 2- 1FNB 109
REMARK 8 SEQUENCE NUMBER: UR1 - UR13 1FNB 110
REMARK 8 NUMBER OF ATOMS IN GROUP: 3 1FNB 111
REMARK 8 ADDITIONAL COMMENTS: BINDING SITES USED IN MIR PHASING 1FNB 112
REMARK 8 1FNB 113
REMARK 8 HEAVY ATOM PARAMETERS ARE AS FOLLOWS: 1FNB 114
REMARK 8 U UR 1 8.513 16.214 36.081 0.49 27.00 1FNB 115

6(c
)M
ark
Ger
stei
n,1
999,
Yal
e,b
ioin
fo.m
bb
.yal
e.ed
u
StructuredData
did_ fidsd2rs51_ 1.002.007d1imr__ 1.010.002d1pyib1 1.007.030d1dxtd_ 1.001.001d181l__ 1.004.002d1vmoa_ 1.002.044d2gsq_1 1.001.031d1etb2_ 1.002.003d1guha1 1.001.031d1hrc__ 1.001.003d150lc_ 1.004.002d1dmf__ 1.007.035d1l19__ 1.004.002d1yrnc_ 1.010.002d1apld_ 1.001.004d1ndab2 1.003.004d2rmai_ 1.002.036
fid_ bestrep N_minsp N_scop objname1.001.001 d1flp__ 8 340 Globin-like1.001.002 d1hdj__ 4 33 Long alpha-hairpin1.001.003 d1ctj__ 9 78 Cytochrome c1.001.004 d1enh__ 18 76 DNA-binding 3-helical bundle1.001.005 d1dtr_2 1 3 Diphtheria toxin repressor (DtxR) dimeriz1.001.006 d1tns__ 1 2 Mu transposase, DNA-binding domain1.001.007 d2spca_ 1 2 Spectrin repeat unit1.001.008 d1bdd__ 1 4 Immunoglobulin-binding protein A modules1.001.009 d1bal__ 1 5 Peripheral subunit-binding domain of 2-ox1.001.010 d2erl__ 3 5 Protozoan pheromone proteins
gid_ TrgStrt TrgStop didHI0299 119 135 d193l__HI0572 180 240 d1aba__HI0989 56 125 d1aco_1HI0988 106 458 d1aco_2HI0154 2 76 d1acp__HI1633 2 432 d1adea_HI0349 1 183 d1aky__HI1309 35 52 d1alo_3HI0589 8 25 d1alo_3HI1358 239 444 d1amg_2HI1358 218 410 d1amy_2HI0460 20 24 d1ans__HI1386 139 147 d1ans__HI0421 11 14 d1ans__HI0361 285 295 d1ans__HI0835 100 106 d1ans__

7(c
)M
ark
Ger
stei
n,1
999,
Yal
e,b
ioin
fo.m
bb
.yal
e.ed
u
Turn the Survey into a Table (I)
UniqueIdentifierforPerson?

8 (c) Mark Gerstein, 1999, Yale, bioinfo.mbb.yale.edu
Turn
theS
urveyinto
aT
able(II)
Standard-
izedV
alues

9(c
)M
ark
Ger
stei
n,1
999,
Yal
e,b
ioin
fo.m
bb
.yal
e.ed
u
Turn the Survey into a Table (III)
• Dependencies between Values (dates)• Unstructured Text

10 (c) Mark Gerstein, 1999, Yale, bioinfo.mbb.yale.edu
Statistics
areonly
Possible
onS
tandarizedV
alues

11(c
)M
ark
Ger
stei
n,1
999,
Yal
e,b
ioin
fo.m
bb
.yal
e.ed
u
SQL
• SIMPLE Language for Building and Querying Tables• CREATE a table• INSERT values into it• SELECT various entries from it (tuples, rows)• UPDATE the values
• Example: How Many Globin Foldsare there in E. coli versus Yeast?

12(c
)M
ark
Ger
stei
n,1
999,
Yal
e,b
ioin
fo.m
bb
.yal
e.ed
u
matches table
gid_ TrgStrt TrgStop did scoreHI0299 119 135 d193l__ 3.1HI0572 180 240 d1aba__ 0.0032HI0989 56 125 d1aco_1 0.0049HI0988 106 458 d1aco_2 4.4e-14HI0154 2 76 d1acp__ 1.2e-23HI1633 2 432 d1adea_ 0HI0349 1 183 d1aky__ 7.6e-36HI1309 35 52 d1alo_3 1.1HI0589 8 25 d1alo_3 1.8HI1358 239 444 d1amg_2 0.002HI1358 218 410 d1amy_2 0.00037HI0460 20 24 d1ans__ 1.8HI1386 139 147 d1ans__ 3.3HI0421 11 14 d1ans__ 6.4HI0361 285 295 d1ans__ 8.2HI0835 100 106 d1ans__ 9.7
create table
matches(gid char255,
# Genome_ID
TrgStrt int,
# Start of
# Match in GeneTrgStop int,
# End of Match
# in Genedid char255,
# ID Matching
# Structurescore real
# e-value
# of Match
)
13(c
)M
ark
Ger
stei
n,1
999,
Yal
e,b
ioin
fo.m
bb
.yal
e.ed
u
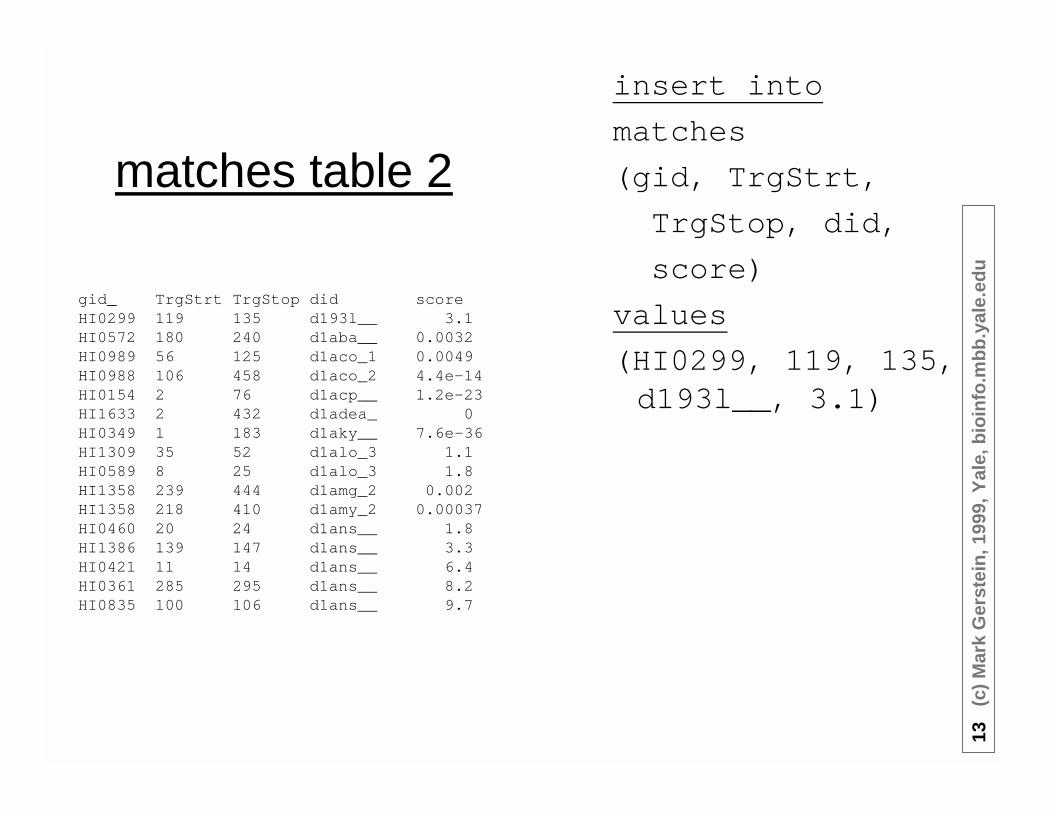
matches table 2
gid_ TrgStrt TrgStop did scoreHI0299 119 135 d193l__ 3.1HI0572 180 240 d1aba__ 0.0032HI0989 56 125 d1aco_1 0.0049HI0988 106 458 d1aco_2 4.4e-14HI0154 2 76 d1acp__ 1.2e-23HI1633 2 432 d1adea_ 0HI0349 1 183 d1aky__ 7.6e-36HI1309 35 52 d1alo_3 1.1HI0589 8 25 d1alo_3 1.8HI1358 239 444 d1amg_2 0.002HI1358 218 410 d1amy_2 0.00037HI0460 20 24 d1ans__ 1.8HI1386 139 147 d1ans__ 3.3HI0421 11 14 d1ans__ 6.4HI0361 285 295 d1ans__ 8.2HI0835 100 106 d1ans__ 9.7
insert into
matches
(gid, TrgStrt,
TrgStop, did,
score)
values
(HI0299, 119, 135,d193l__, 3.1)

14(c
)M
ark
Ger
stei
n,1
999,
Yal
e,b
ioin
fo.m
bb
.yal
e.ed
u
structures table
create table
structures(did char255,
# ID Matching
# Structurefid char255,
# ID of fold that
# structure has
)
did_ fidd2rs51_ 1.002.007d1imr__ 1.010.002d1pyib1 1.007.030d1dxtd_ 1.001.001d181l__ 1.004.002d1vmoa_ 1.002.044d2gsq_1 1.001.031d1etb2_ 1.002.003d1guha1 1.001.031d1hrc__ 1.001.003d150lc_ 1.004.002d1dmf__ 1.007.035d1l19__ 1.004.002d1yrnc_ 1.010.002d1apld_ 1.001.004d1ndab2 1.003.004d2rmai_ 1.002.036
10 K domainstructure IDs (did)vs. 300 fold IDs(fid)

15(c
)M
ark
Ger
stei
n,1
999,
Yal
e,b
ioin
fo.m
bb
.yal
e.ed
u
folds table
create table
folds(fid char255,
# fold ID
bestrep char255,
N_hlx int,
N_beta int,
# number of helices & sheets
name char255
# name of fold
)
fid_ bestrep N_hlx N_beta name1.001.001 d1flp__ 8 0 Globin-like1.001.002 d1hdj__ 4 0 Long alpha-hairpin1.001.003 d1ctj__ 9 0 Cytochrome c1.001.004 d1enh__ 2 0 DNA-binding 3-helical bundle1.001.005 d1dtr_2 1 3 Diphtheria toxin repressor (DtxR) dimeriz1.001.006 d1tns__ 1 2 Mu transposase, DNA-binding domain1.001.007 d2spca_ 0 2 Spectrin repeat unit1.001.008 d1bdd__ 0 4 Immunoglobulin-binding protein A modules1.001.009 d1bal__ 0 5 Peripheral subunit-binding domain of 2-ox1.001.010 d2erl__ 3 5 Protozoan pheromone proteins

16(c
)M
ark
Ger
stei
n,1
999,
Yal
e,b
ioin
fo.m
bb
.yal
e.ed
u
TableInterpretation
Match Table: Ways Structures A, B, and C can match HIGenome
Structures have a limitednumber of folds, whichhave variouscharacteristics

17(c
)M
ark
Ger
stei
n,1
999,
Yal
e,b
ioin
fo.m
bb
.yal
e.ed
u
Structure of a Table
• Row◊ Entity, Tuple, Instance
• Column◊ Field
◊ Attribute of an Entity
◊ dimension
• Key◊ Certain Attributes (or
combination of attributes) canuniquely identify an object,these are keys
• NULL◊ Variant Records
key keyTable attr-a attr-b attr-c attr-d attr-e attr-f
tuple-1 a1 b1 c1 d1 e1 f1tuple-2 a2 b2 c2 d2 e2 f2tuple-3 a3 b3 c3 d3 e3 f3tuple-4 a4 b4 c4 d4 e4 f4tuple-5 a5 b5 c5 d5 e5 f5tuple-6 a6 b6 c6 d6tuple-7 a7 b7 c7 d7 f7tuple-8 a8 b8 c8 d8 e8 f8tuple-9 a9 b9 c9 d9 e9 f9tuple-10 a10 b10 c10 d10 f10tuple-11 a11 b11 c11 d11 e11 f11tuple-12 a12 b12 c12 d12 e12 f12tuple-13 a13 b13 c13 d13 e13 f13tuple-14 a14 b14 c14 d14 e14 f14

18(c
)M
ark
Ger
stei
n,1
999,
Yal
e,b
ioin
fo.m
bb
.yal
e.ed
u
What is a Key?
table matches(gid, TrgStrt, TrgStop, did, score)
table structures(did, fid)
table folds(fid, bestrep, N_hlx, N_beta, name)
gid -> many matchesgid,TrgStrt -> unique match (one tuple)thus, primary key gid,TrgStrtgid,TrgStop -> unique match as wellfid -> many did’s, but did -> one fidthus, primary key didone-to-one between fid and name
1<->11->manymany->1

19(c
)M
ark
Ger
stei
n,1
999,
Yal
e,b
ioin
fo.m
bb
.yal
e.ed
u
SQLSelect ona Single
Table
• Select {columns} from {a table}where {row-selection is true}
• projection of a selection• Sort result on a attribute

20(c
)M
ark
Ger
stei
n,1
999,
Yal
e,b
ioin
fo.m
bb
.yal
e.ed
u
SQL Select on aSingle Table,
Example
• Select * from matches where gid= HI0016HI0016 1 173 d1dar_2 2e-07
HI0016 179 274 d1dar_1 8.5e-06
HI0016 399 476 d1dar_4 0.00031
• Select * from matches where gid= HI0016 andTrgStrt=179
HI0016 179 274 d1dar_1 8.5e-06
gid_ TrgStrt TrgStop did scoreHI0299 119 135 d193l__ 3.1HI0572 180 240 d1aba__ 0.0032HI0989 56 125 d1aco_1 0.0049HI0349 1 183 d1aky__ 7.6e-36HI1309 35 52 d1alo_3 1.1HI0589 8 25 d1alo_3 1.8HI1358 239 444 d1amg_2 0.002HI0016 1 173 d1dar_2 2e-07HI0016 179 274 d1dar_1 8.5e-06HI0016 399 476 d1dar_4 0.00031HI0460 20 24 d1ans__ 1.8HI1386 139 147 d1ans__ 3.3HI0421 11 14 d1ans__ 6.4HI0361 285 295 d1ans__ 8.2HI0835 100 106 d1ans__ 9.7

21(c
)M
ark
Ger
stei
n,1
999,
Yal
e,b
ioin
fo.m
bb
.yal
e.ed
u
SQL Select on aSingle Table,Example 2
• Select did from matches where score < 0.0001
d1aky__, d1dar_2, d1dar_1
HI0349 1 183 d1aky__ 7.6e-36
I0016 1 173 d1dar_2 2e-07
HI0016 179 274 d1dar_1 8.5e-06
gid_ TrgStrt TrgStop did scoreHI0299 119 135 d193l__ 3.1HI0572 180 240 d1aba__ 0.0032HI0989 56 125 d1aco_1 0.0049HI0349 1 183 d1aky__ 7.6e-36HI1309 35 52 d1alo_3 1.1HI0589 8 25 d1alo_3 1.8HI1358 239 444 d1amg_2 0.002HI0016 1 173 d1dar_2 2e-07HI0016 179 274 d1dar_1 8.5e-06HI0016 399 476 d1dar_4 0.00031HI0460 20 24 d1ans__ 1.8HI1386 139 147 d1ans__ 3.3HI0421 11 14 d1ans__ 6.4HI0361 285 295 d1ans__ 8.2HI0835 100 106 d1ans__ 9.7
22(c
)M
ark
Ger
stei
n,1
999,
Yal
e,b
ioin
fo.m
bb
.yal
e.ed
u
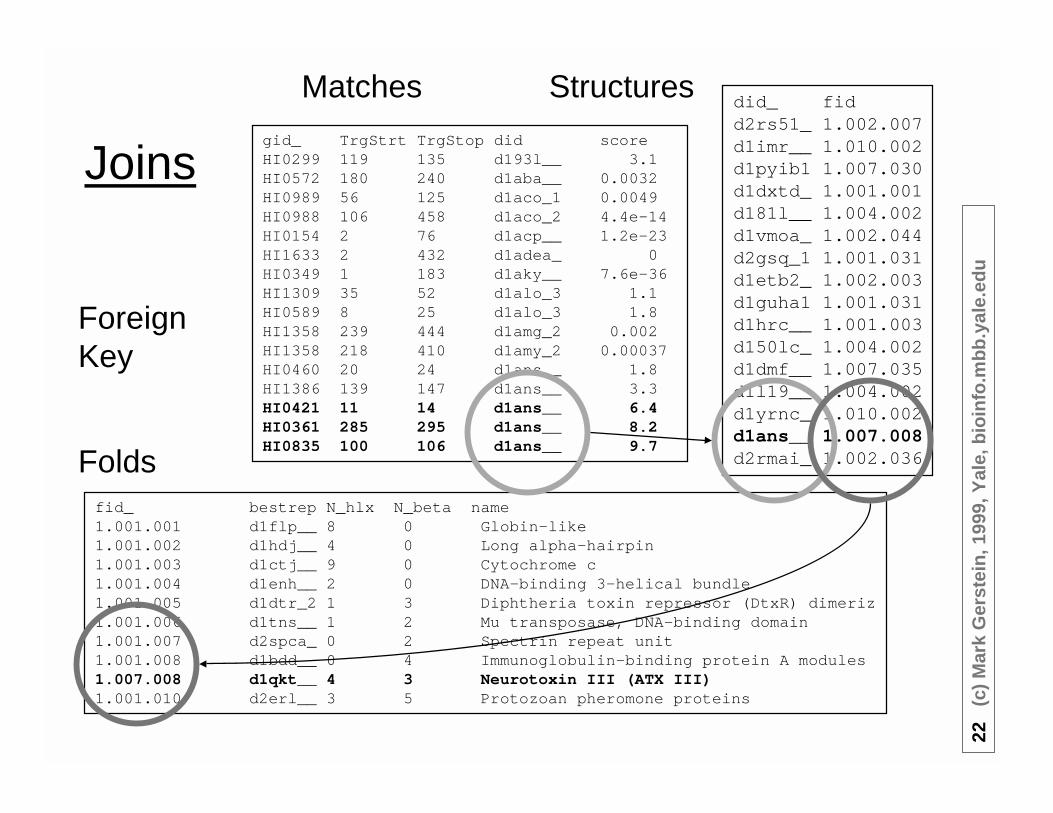
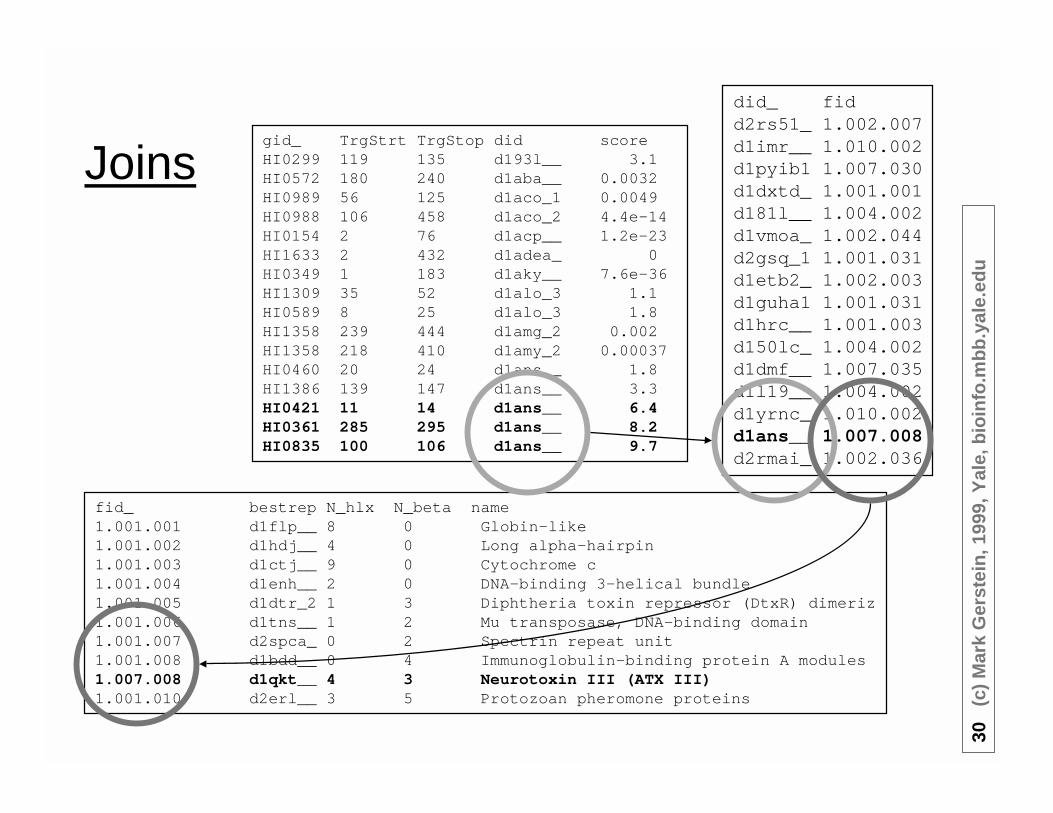
Joinsgid_ TrgStrt TrgStop did scoreHI0299 119 135 d193l__ 3.1HI0572 180 240 d1aba__ 0.0032HI0989 56 125 d1aco_1 0.0049HI0988 106 458 d1aco_2 4.4e-14HI0154 2 76 d1acp__ 1.2e-23HI1633 2 432 d1adea_ 0HI0349 1 183 d1aky__ 7.6e-36HI1309 35 52 d1alo_3 1.1HI0589 8 25 d1alo_3 1.8HI1358 239 444 d1amg_2 0.002HI1358 218 410 d1amy_2 0.00037HI0460 20 24 d1ans__ 1.8HI1386 139 147 d1ans__ 3.3HI0421 11 14 d1ans__ 6.4HI0361 285 295 d1ans__ 8.2HI0835 100 106 d1ans__ 9.7
did_ fidd2rs51_ 1.002.007d1imr__ 1.010.002d1pyib1 1.007.030d1dxtd_ 1.001.001d181l__ 1.004.002d1vmoa_ 1.002.044d2gsq_1 1.001.031d1etb2_ 1.002.003d1guha1 1.001.031d1hrc__ 1.001.003d150lc_ 1.004.002d1dmf__ 1.007.035d1l19__ 1.004.002d1yrnc_ 1.010.002d1ans__ 1.007.008d2rmai_ 1.002.036
fid_ bestrep N_hlx N_beta name1.001.001 d1flp__ 8 0 Globin-like1.001.002 d1hdj__ 4 0 Long alpha-hairpin1.001.003 d1ctj__ 9 0 Cytochrome c1.001.004 d1enh__ 2 0 DNA-binding 3-helical bundle1.001.005 d1dtr_2 1 3 Diphtheria toxin repressor (DtxR) dimeriz1.001.006 d1tns__ 1 2 Mu transposase, DNA-binding domain1.001.007 d2spca_ 0 2 Spectrin repeat unit1.001.008 d1bdd__ 0 4 Immunoglobulin-binding protein A modules1.007.008 d1qkt__ 4 3 Neurotoxin III (ATX III)1.001.010 d2erl__ 3 5 Protozoan pheromone proteins
Matches
Folds
Structures
ForeignKey

23(c
)M
ark
Ger
stei
n,1
999,
Yal
e,b
ioin
fo.m
bb
.yal
e.ed
u
SQL Select on Multiple Tables
• Select *from matches, structures, foldswherematches.gid = HI0361and matches.did=structures.didand structures.fid = folds.fid
• Returnsmatches | structures | foldsHI0361,285,295,d1ans__ ,8.2 | d1ans__,1.007.008 | 1.007.008,d1qkt__,4, 3,Neurotoxin III ...
• Select score,name from matches, structures, foldswhere gid = HI0361and matches.did=structures.didand structures.fid = folds.fid8.2, Neurotoxin III ...

24(c
)M
ark
Ger
stei
n,1
999,
Yal
e,b
ioin
fo.m
bb
.yal
e.ed
u
gid_ TrgStrt TrgStop did scoreHI0299 119 135 d193l__ 3.1HI0572 180 240 d1aba__ 0.0032HI0989 56 125 d1aco_1 0.0049HI0988 106 458 d1aco_2 4.4e-14HI0154 2 76 d1acp__ 1.2e-23HI1633 2 432 d1adea_ 0HI0349 1 183 d1aky__ 7.6e-36HI1309 35 52 d1alo_3 1.1HI0589 8 25 d1alo_3 1.8HI1358 239 444 d1amg_2 0.002HI1358 218 410 d1amy_2 0.00037HI0460 20 24 d1ans__ 1.8HI1386 139 147 d1ans__ 3.3HI0421 11 14 d1ans__ 6.4HI0361 285 295 d1ans__ 8.2HI0835 100 106 d1ans__ 9.7
did_ fidd2rs51_ 1.002.007d1imr__ 1.010.002d1pyib1 1.007.030d1dxtd_ 1.001.001d181l__ 1.004.002d1vmoa_ 1.002.044d2gsq_1 1.001.031d1etb2_ 1.002.003d1guha1 1.001.031d1hrc__ 1.001.003d150lc_ 1.004.002d1dmf__ 1.007.035d1l19__ 1.004.002d1yrnc_ 1.010.002d1ans__ 1.007.008d2rmai_ 1.002.036
Foreign Key
matches.did is a (foreign) key in the structures table --i.e. looks up exactly one structure.
matchesstructures

25(c
)M
ark
Ger
stei
n,1
999,
Yal
e,b
ioin
fo.m
bb
.yal
e.ed
u
Selection as Array Lookup
• Same for a fold identifier from a structure id◊ $fid=$structure{$did}
◊ (perl pseudo-code)
• Same for matches and folds tables, but this time arraysreturn multiple values and have multiple field keys◊ ($bestrep, $N_hlx, $N_beta, $name) = $folds{$fid}◊ ($TrgStop,$did,$score)=$match{$gid,$TrgStrt}
• Joining as a double-lookup◊ $did = 1mbd__
($bestrep, $N_hlx, $N_beta, $name) = $folds{ $structures{$did} }◊ Select bestrep,N_hlx,N_beta,name from structures, folds where
structures.fid = folds.fid and structures.did = 1mbd__

26(c
)M
ark
Ger
stei
n,1
999,
Yal
e,b
ioin
fo.m
bb
.yal
e.ed
u
SQLSelect
onMultipleTables
• Select {columns} from {huge cross-product of tables}where {row-selection is true}◊ cross-product T(1) x T(2) builds a huge virtual table where every row of
T(1) is paired with every row of T(2). Then perform selection on this.
• Select fid from matches,structures where gid=HI009 andmatches.did = structures.did
Matches Structures

27(c
)M
ark
Ger
stei
n,1
999,
Yal
e,b
ioin
fo.m
bb
.yal
e.ed
u
Cross Product A x B
A(1) = Row 1 of Table AA(2) = Row 2 of Table AA(i) = Row i of Table A
A has N rowsand C columns
B(1) = Row 1 of Table BB(2) = Row 2 of Table BB(i) = Row i of Table B
B has M rowsand K columns
A x B =
A x B hasN x M rowsandC+K columns
A(1)B(1)A(1)B(2)A(1)B(3)...A(1)B(M)A(2)B(1)A(2)B(2)A(2)B(3)...A(2)B(M)A(N)B(1)A(N)B(2)A(N)B(3)...A(N)B(M)

28(c
)M
ark
Ger
stei
n,1
999,
Yal
e,b
ioin
fo.m
bb
.yal
e.ed
u
• Korth & Silberschatz◊ branch <=> matches (gid-start +++ did)◊ customer <=> folds (fid +++)
◊ linked byaccount <=> structures (did fid)
ER-diagrams
Start gid structure
fold

29(c
)M
ark
Ger
stei
n,1
999,
Yal
e,b
ioin
fo.m
bb
.yal
e.ed
u
Aggregate Functions--Statistics on Attributes
• Query Statistics◊ select gid, count (distinct did) from matches◊ select max(N_hlx) from folds where N_beta = 0
• How many matches to globins in the E. coli genome• Complex Query by nesting selections
◊ F <= select fid from folds where name contains “globin”
◊ D <= select did from structures where fid in F◊ N <= select count(distinct gid,TrgStrt) from matches
where did in D and score < .01
30(c
)M
ark
Ger
stei
n,1
999,
Yal
e,b
ioin
fo.m
bb
.yal
e.ed
u
Joinsgid_ TrgStrt TrgStop did scoreHI0299 119 135 d193l__ 3.1HI0572 180 240 d1aba__ 0.0032HI0989 56 125 d1aco_1 0.0049HI0988 106 458 d1aco_2 4.4e-14HI0154 2 76 d1acp__ 1.2e-23HI1633 2 432 d1adea_ 0HI0349 1 183 d1aky__ 7.6e-36HI1309 35 52 d1alo_3 1.1HI0589 8 25 d1alo_3 1.8HI1358 239 444 d1amg_2 0.002HI1358 218 410 d1amy_2 0.00037HI0460 20 24 d1ans__ 1.8HI1386 139 147 d1ans__ 3.3HI0421 11 14 d1ans__ 6.4HI0361 285 295 d1ans__ 8.2HI0835 100 106 d1ans__ 9.7
did_ fidd2rs51_ 1.002.007d1imr__ 1.010.002d1pyib1 1.007.030d1dxtd_ 1.001.001d181l__ 1.004.002d1vmoa_ 1.002.044d2gsq_1 1.001.031d1etb2_ 1.002.003d1guha1 1.001.031d1hrc__ 1.001.003d150lc_ 1.004.002d1dmf__ 1.007.035d1l19__ 1.004.002d1yrnc_ 1.010.002d1ans__ 1.007.008d2rmai_ 1.002.036
fid_ bestrep N_hlx N_beta name1.001.001 d1flp__ 8 0 Globin-like1.001.002 d1hdj__ 4 0 Long alpha-hairpin1.001.003 d1ctj__ 9 0 Cytochrome c1.001.004 d1enh__ 2 0 DNA-binding 3-helical bundle1.001.005 d1dtr_2 1 3 Diphtheria toxin repressor (DtxR) dimeriz1.001.006 d1tns__ 1 2 Mu transposase, DNA-binding domain1.001.007 d2spca_ 0 2 Spectrin repeat unit1.001.008 d1bdd__ 0 4 Immunoglobulin-binding protein A modules1.007.008 d1qkt__ 4 3 Neurotoxin III (ATX III)1.001.010 d2erl__ 3 5 Protozoan pheromone proteins
31(c
)M
ark
Ger
stei
n,1
999,
Yal
e,b
ioin
fo.m
bb
.yal
e.ed
u
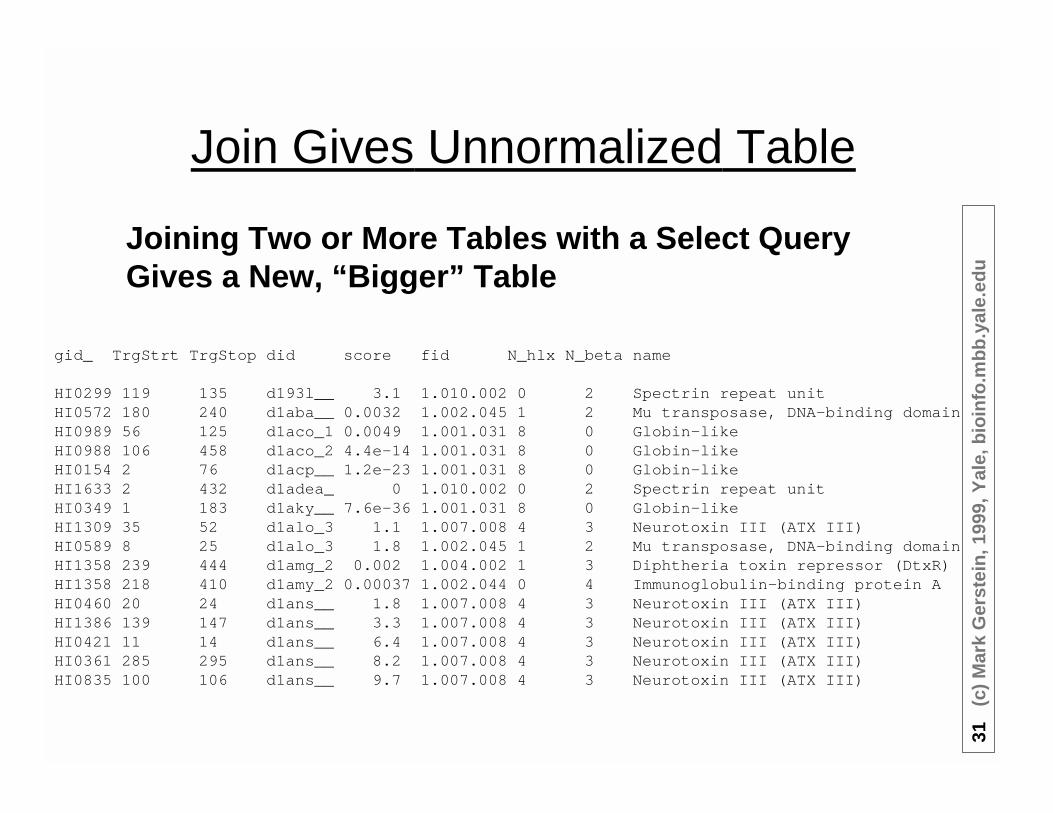
Join Gives Unnormalized Table
gid_ TrgStrt TrgStop did score fid N_hlx N_beta name
HI0299 119 135 d193l__ 3.1 1.010.002 0 2 Spectrin repeat unitHI0572 180 240 d1aba__ 0.0032 1.002.045 1 2 Mu transposase, DNA-binding domainHI0989 56 125 d1aco_1 0.0049 1.001.031 8 0 Globin-likeHI0988 106 458 d1aco_2 4.4e-14 1.001.031 8 0 Globin-likeHI0154 2 76 d1acp__ 1.2e-23 1.001.031 8 0 Globin-likeHI1633 2 432 d1adea_ 0 1.010.002 0 2 Spectrin repeat unitHI0349 1 183 d1aky__ 7.6e-36 1.001.031 8 0 Globin-likeHI1309 35 52 d1alo_3 1.1 1.007.008 4 3 Neurotoxin III (ATX III)HI0589 8 25 d1alo_3 1.8 1.002.045 1 2 Mu transposase, DNA-binding domainHI1358 239 444 d1amg_2 0.002 1.004.002 1 3 Diphtheria toxin repressor (DtxR)HI1358 218 410 d1amy_2 0.00037 1.002.044 0 4 Immunoglobulin-binding protein AHI0460 20 24 d1ans__ 1.8 1.007.008 4 3 Neurotoxin III (ATX III)HI1386 139 147 d1ans__ 3.3 1.007.008 4 3 Neurotoxin III (ATX III)HI0421 11 14 d1ans__ 6.4 1.007.008 4 3 Neurotoxin III (ATX III)HI0361 285 295 d1ans__ 8.2 1.007.008 4 3 Neurotoxin III (ATX III)HI0835 100 106 d1ans__ 9.7 1.007.008 4 3 Neurotoxin III (ATX III)
Joining Two or More Tables with a Select QueryGives a New, “Bigger” Table

32(c
)M
ark
Ger
stei
n,1
999,
Yal
e,b
ioin
fo.m
bb
.yal
e.ed
u
Normalization
gid_ TrgStrt TrgStop did score fid N_hlx N_beta name
HI0299 119 135 d193l__ 3.1 1.010.002 0 2 Spectrin repeat unitHI0572 180 240 d1aba__ 0.0032 1.002.045 1 2 Mu transposase, DNA-binding domainHI0989 56 125 d1aco_1 0.0049 1.001.031 8 0 Globin-likeHI0988 106 458 d1aco_2 4.4e-14 1.001.031 8 0 Globin-likeHI0154 2 76 d1acp__ 1.2e-23 1.001.031 8 0 Globin-likeHI1633 2 432 d1adea_ 0 1.010.002 0 2 Spectrin repeat unitHI0349 1 183 d1aky__ 7.6e-36 1.001.031 8 0 Globin-likeHI1309 35 52 d1alo_3 1.1 1.007.008 4 3 Neurotoxin III (ATX III)HI0589 8 25 d1alo_3 1.8 1.002.045 1 2 Mu transposase, DNA-binding domainHI1358 239 444 d1amg_2 0.002 1.004.002 1 3 Diphtheria toxin repressor (DtxR)HI1358 218 410 d1amy_2 0.00037 1.002.044 0 4 Immunoglobulin-binding protein AHI0460 20 24 d1ans__ 1.8 1.007.008 4 3 Neurotoxin III (ATX III)HI1386 139 147 d1ans__ 3.3 1.007.008 4 3 Neurotoxin III (ATX III)HI0421 11 14 d1ans__ 6.4 1.007.008 4 3 Neurotoxin III (ATX III)HI0361 285 295 d1ans__ 8.2 1.007.008 4 3 Neurotoxin III (ATX III)HI0835 100 106 d1ans__ 9.7 1.007.008 4 3 Neurotoxin III (ATX III)
• What if Want to update Fold1.007.008 to be “Neurotoxin IV”?◊ Many Updates
• So Good if Previously Normalizedinto Separate Tables◊ Eliminate Redundancy
◊ Allow Consistent Updating

33(c
)M
ark
Ger
stei
n,1
999,
Yal
e,b
ioin
fo.m
bb
.yal
e.ed
u
Normalization Example
Name City Area-Code Phone-NumberCharles NY 212 345-6789Mark SF 415 236-8982Jane NY 212 567-2345Jeff SF 415 435-3535Jack Boston 617 234-9988
Name City Phone-NumberCharles NY 345-6789Mark SF 236-8982Jane NY 567-2345Jeff SF 435-3535Jack Boston 234-9988
City Area-CodeNY 212SF 415Boston 617
Un-normalized Normalized

34(c
)M
ark
Ger
stei
n,1
999,
Yal
e,b
ioin
fo.m
bb
.yal
e.ed
u
Normalized Tablesgid_ TrgStrt TrgStop did scoreHI0299 119 135 d193l__ 3.1HI0572 180 240 d1aba__ 0.0032HI0989 56 125 d1aco_1 0.0049HI0988 106 458 d1aco_2 4.4e-14HI0154 2 76 d1acp__ 1.2e-23HI1633 2 432 d1adea_ 0HI0349 1 183 d1aky__ 7.6e-36HI1309 35 52 d1alo_3 1.1HI0589 8 25 d1alo_3 1.8HI1358 239 444 d1amg_2 0.002HI1358 218 410 d1amy_2 0.00037HI0460 20 24 d1ans__ 1.8HI1386 139 147 d1ans__ 3.3HI0421 11 14 d1ans__ 6.4HI0361 285 295 d1ans__ 8.2HI0835 100 106 d1ans__ 9.7
did_ fidd2rs51_ 1.002.007d1imr__ 1.010.002d1pyib1 1.007.030d1dxtd_ 1.001.001d181l__ 1.004.002d1vmoa_ 1.002.044d2gsq_1 1.001.031d1etb2_ 1.002.003d1guha1 1.001.031d1hrc__ 1.001.003d150lc_ 1.004.002d1dmf__ 1.007.035d1l19__ 1.004.002d1yrnc_ 1.010.002d1ans__ 1.007.008d2rmai_ 1.002.036
fid_ bestrep N_hlx N_beta name1.001.001 d1flp__ 8 0 Globin-like1.001.002 d1hdj__ 4 0 Long alpha-hairpin1.001.003 d1ctj__ 9 0 Cytochrome c1.001.004 d1enh__ 2 0 DNA-binding 3-helical bundle1.001.005 d1dtr_2 1 3 Diphtheria toxin repressor (DtxR) dimeriz1.001.006 d1tns__ 1 2 Mu transposase, DNA-binding domain1.001.007 d2spca_ 0 2 Spectrin repeat unit1.001.008 d1bdd__ 0 4 Immunoglobulin-binding protein A modules1.007.008 d1qkt__ 4 3 Neurotoxin III (ATX III)1.001.010 d2erl__ 3 5 Protozoan pheromone proteins
Theory ofNormaliz-ation

35(c
)M
ark
Ger
stei
n,1
999,
Yal
e,b
ioin
fo.m
bb
.yal
e.ed
u
Query Optimization
• Get at the Data Quickly!!• Indexes• Hash Function Reproduce the Effect of Indexes
◊ Rapidly Associate a Bucket with Each Key
• Joining 10 tables, which to do first?◊ Joining is slow so store some tables in unnormalized form
o Speed vs Memory

36 (c) Mark Gerstein, 1999, Yale, bioinfo.mbb.yale.edu
IndexesS
peedA
ccess
No
Ind
ex
On
eIn
dex
Do
ub
leIn
dex

37 (c) Mark Gerstein, 1999, Yale, bioinfo.mbb.yale.edu
Object
Databases
C,fo
rtranvs.C
++

38(c
)M
ark
Ger
stei
n,1
999,
Yal
e,b
ioin
fo.m
bb
.yal
e.ed
u
Forms & reports [user views]
• Reports are the result of running a succession ofselects queries on a database, joining together anumber of tables, and then pasting the resultstogether
• Forms are the same but they are editable• Forms and Reports represent particular views of the
data◊ For instance, one can be keyed on gene id listing all the structures
matching a gene and the other could be keyed on structure id listingall the gene matching a given structure

39(c
)M
ark
Ger
stei
n,1
999,
Yal
e,b
ioin
fo.m
bb
.yal
e.ed
u
Aspects of Forms:Transactions and Security
• Transactions◊ Genome Centers and United Airlines!
◊ Log each entry and enable UNDO• Security
◊ Only certain users can modify certain fields
40(c
)M
ark
Ger
stei
n,1
999,
Yal
e,b
ioin
fo.m
bb
.yal
e.ed
u
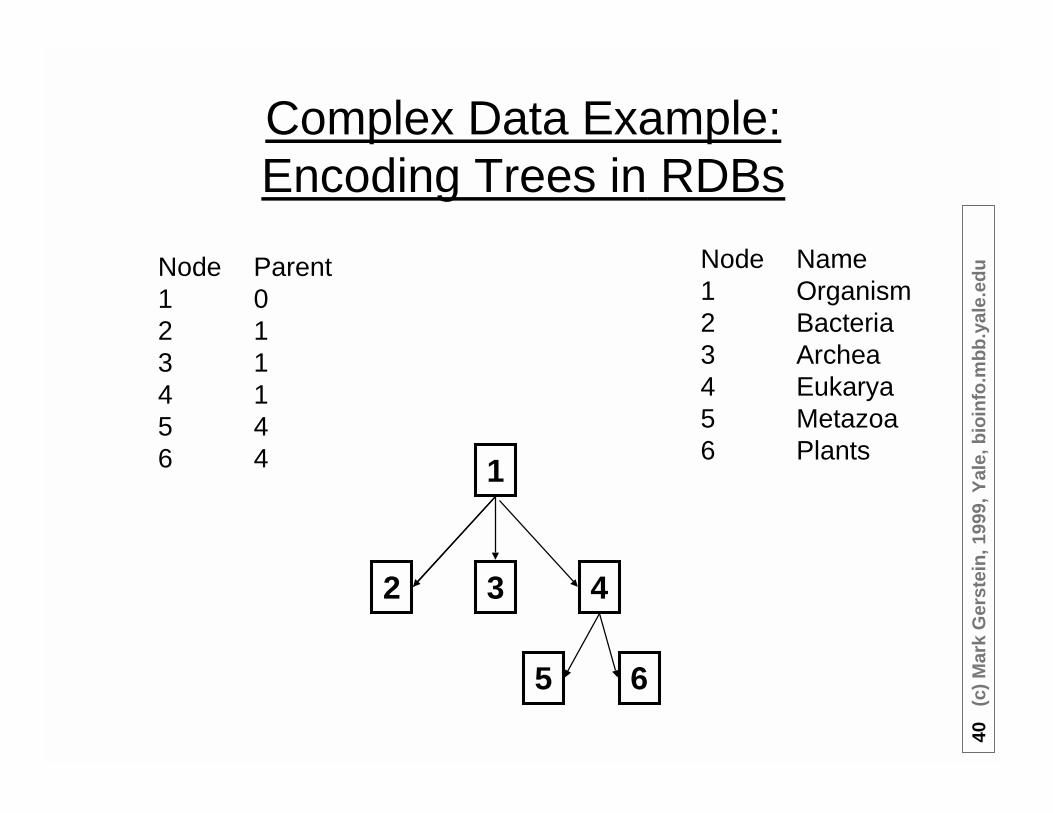
Complex Data Example:Encoding Trees in RDBs
1
32
5
4
6
Node Name1 Organism2 Bacteria3 Archea4 Eukarya5 Metazoa6 Plants
Node Parent1 02 13 14 15 46 4
41 (c) Mark Gerstein, 1999, Yale, bioinfo.mbb.yale.edu
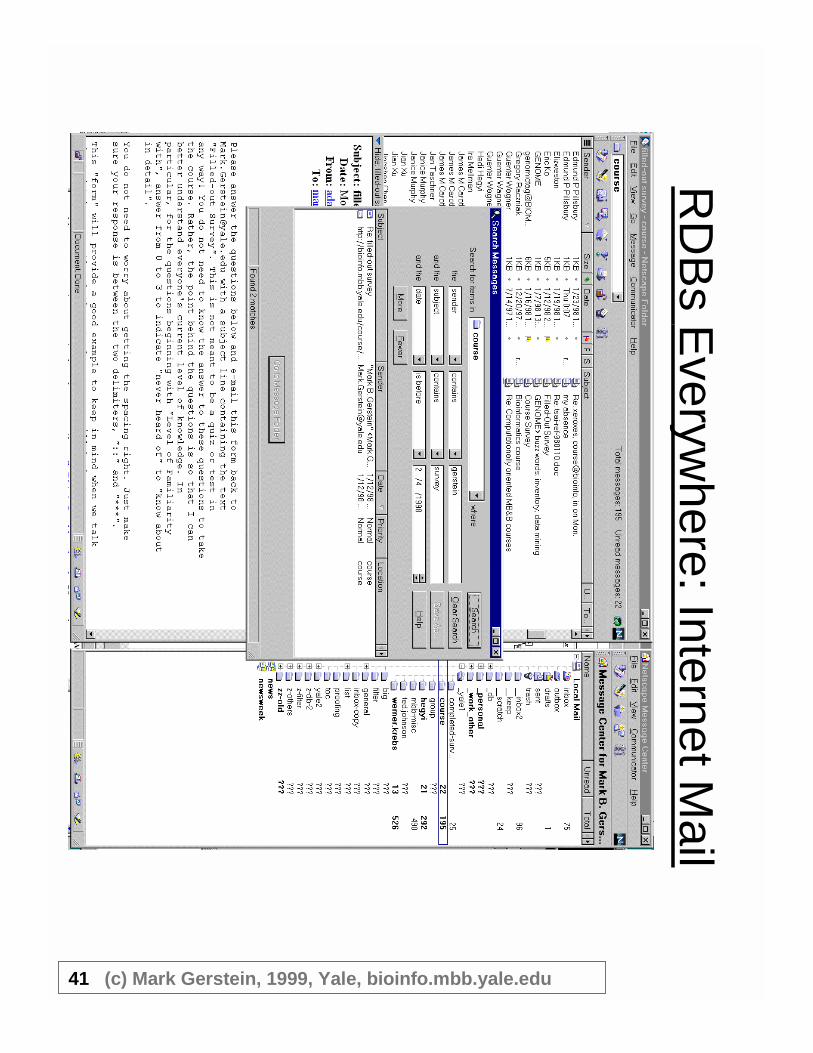
RD
Bs
Everyw
here:InternetMail
42(c
)M
ark
Ger
stei
n,1
999,
Yal
e,b
ioin
fo.m
bb
.yal
e.ed
u
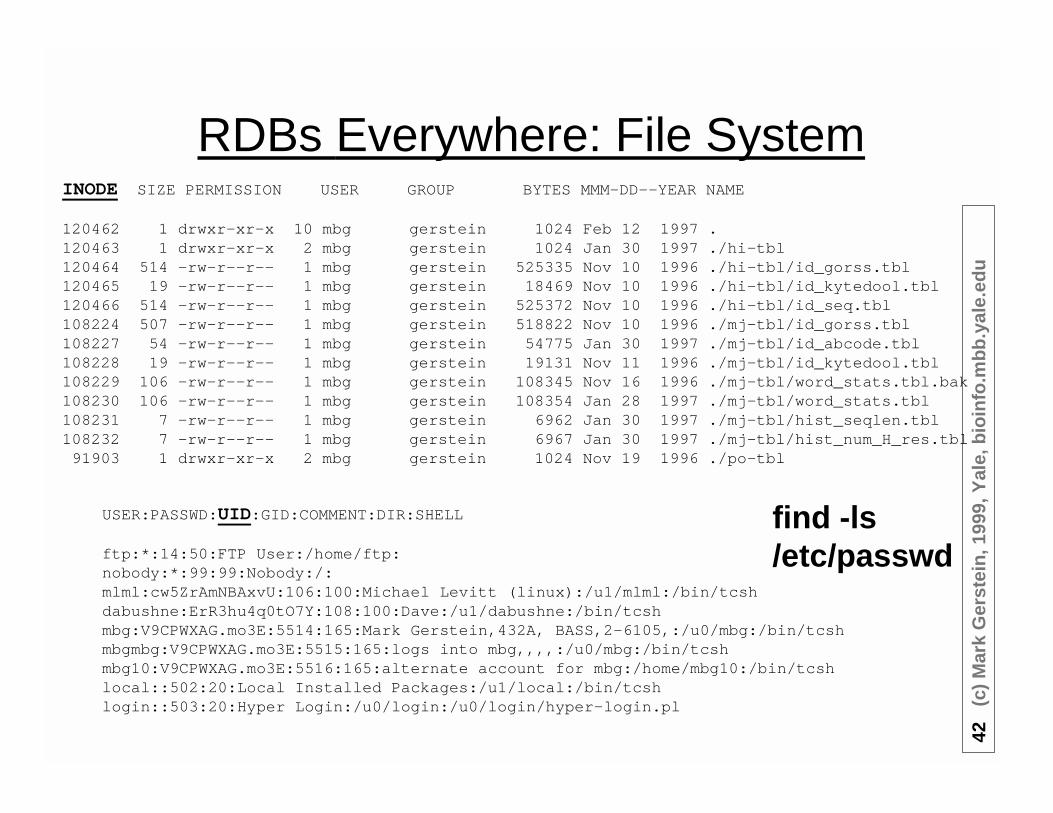
RDBs Everywhere: File SystemINODE SIZE PERMISSION USER GROUP BYTES MMM-DD--YEAR NAME
120462 1 drwxr-xr-x 10 mbg gerstein 1024 Feb 12 1997 .120463 1 drwxr-xr-x 2 mbg gerstein 1024 Jan 30 1997 ./hi-tbl120464 514 -rw-r--r-- 1 mbg gerstein 525335 Nov 10 1996 ./hi-tbl/id_gorss.tbl120465 19 -rw-r--r-- 1 mbg gerstein 18469 Nov 10 1996 ./hi-tbl/id_kytedool.tbl120466 514 -rw-r--r-- 1 mbg gerstein 525372 Nov 10 1996 ./hi-tbl/id_seq.tbl108224 507 -rw-r--r-- 1 mbg gerstein 518822 Nov 10 1996 ./mj-tbl/id_gorss.tbl108227 54 -rw-r--r-- 1 mbg gerstein 54775 Jan 30 1997 ./mj-tbl/id_abcode.tbl108228 19 -rw-r--r-- 1 mbg gerstein 19131 Nov 11 1996 ./mj-tbl/id_kytedool.tbl108229 106 -rw-r--r-- 1 mbg gerstein 108345 Nov 16 1996 ./mj-tbl/word_stats.tbl.bak108230 106 -rw-r--r-- 1 mbg gerstein 108354 Jan 28 1997 ./mj-tbl/word_stats.tbl108231 7 -rw-r--r-- 1 mbg gerstein 6962 Jan 30 1997 ./mj-tbl/hist_seqlen.tbl108232 7 -rw-r--r-- 1 mbg gerstein 6967 Jan 30 1997 ./mj-tbl/hist_num_H_res.tbl91903 1 drwxr-xr-x 2 mbg gerstein 1024 Nov 19 1996 ./po-tbl
USER:PASSWD:UID:GID:COMMENT:DIR:SHELL
ftp:*:14:50:FTP User:/home/ftp:nobody:*:99:99:Nobody:/:mlml:cw5ZrAmNBAxvU:106:100:Michael Levitt (linux):/u1/mlml:/bin/tcshdabushne:ErR3hu4q0tO7Y:108:100:Dave:/u1/dabushne:/bin/tcshmbg:V9CPWXAG.mo3E:5514:165:Mark Gerstein,432A, BASS,2-6105,:/u0/mbg:/bin/tcshmbgmbg:V9CPWXAG.mo3E:5515:165:logs into mbg,,,,:/u0/mbg:/bin/tcshmbg10:V9CPWXAG.mo3E:5516:165:alternate account for mbg:/home/mbg10:/bin/tcshlocal::502:20:Local Installed Packages:/u1/local:/bin/tcshlogin::503:20:Hyper Login:/u0/login:/u0/login/hyper-login.pl
find -ls/etc/passwd
43(c
)M
ark
Ger
stei
n,1
999,
Yal
e,b
ioin
fo.m
bb
.yal
e.ed
u
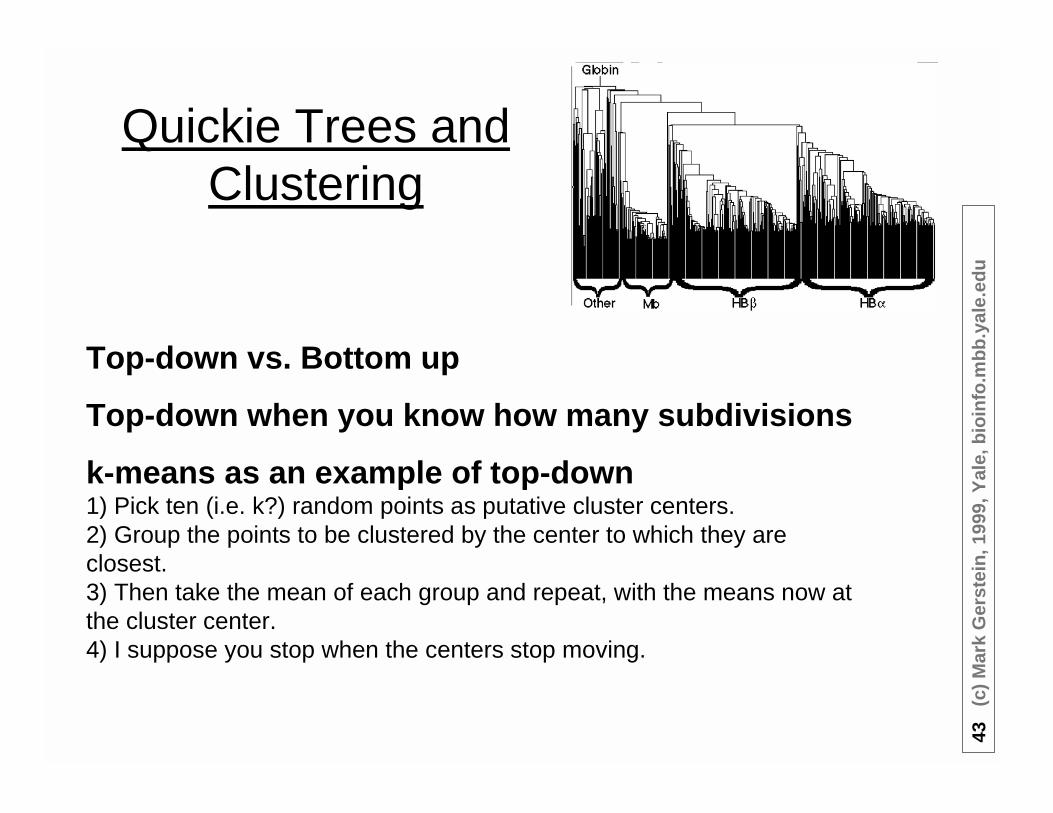
Quickie Trees andClustering
Top-down vs. Bottom up
Top-down when you know how many subdivisions
k-means as an example of top-down1) Pick ten (i.e. k?) random points as putative cluster centers.2) Group the points to be clustered by the center to which they areclosest.3) Then take the mean of each group and repeat, with the means now atthe cluster center.4) I suppose you stop when the centers stop moving.

44(c
)M
ark
Ger
stei
n,1
999,
Yal
e,b
ioin
fo.m
bb
.yal
e.ed
u
Methods of Building Trees from thebottom up
CHOOSE METHOD- Parsimony
• Minimizing the number of changes at each node• Requires greater computer resources than distance
methods• Depends on phylogenetically informative sites• Retains all sequence information throughout the
analysisProblems:• As the sequences diverge, the accuracy of the
inference drops• Long Edge Attraction• Multiple islands of “almost the most parsimonious trees”
can exist• Requires greater computer resources than distance
methods
CHOOSE METHOD- Distance Based
Distance Methods• Compute distance measures• Build the tree from the table of distances
Assumptions• A single coefficient of sequence similarity contains the
information necessary to reconstruct the phylogeny• May reduce the available information
Measuring Distances• Compute all pairwise distances• Correct for multiple substitution events• Weight according to nucleotide substitution frequency• Weight according to codon degeneracy• Different measures presuppose different models of
character evolution

45(c
)M
ark
Ger
stei
n,1
999,
Yal
e,b
ioin
fo.m
bb
.yal
e.ed
u
Bootstrapto Test
the Tree
ANALYZE TREE- Bootstrap
• Randomly resample the data with replacement,creating a new dataset that is then used to infer aphylogeny
• Generating replicate samples• Observe tree topology• Percentage of grouping• Majority Rule Consensus

46(c
)M
ark
Ger
stei
n,1
999,
Yal
e,b
ioin
fo.m
bb
.yal
e.ed
u
Popular Tree Program SystemsPREPARE THE DATA- PAUP
• Phylogenetic Analysis Using Parsimony• David Swofford, Smithsonian• Sophisticated parsimony program with a wide variety of options
o Tree building algorithms
o Weighting schemes
o Resampling procedures
PREPARE THE DATA- Phylip• J. Felsenstein, University of Washington• A comprehensive set of phylogenetic inference programs
o Maximum Likelihood
o Parsimony
o Distance
o Single and multiple tree algorithms

47(c
)M
ark
Ger
stei
n,1
999,
Yal
e,b
ioin
fo.m
bb
.yal
e.ed
u
Tree ofLife
,---------------------------------- Chlamydia psittaci|
,-----------------| Chlamydia| `---------------------------------- Chlamydia trachomatis
,-----------------| Eubacteria| || |--------------------------------------------------- Borrelia burgdorferi| | ,---------------------------------- Bacteroides fragilis| | || |-----------------| Bacteroidaceae| | || | `---------------------------------- Porphyromonas gingivalis| | ,----------------- Microcystis aeruginosa| | ,-----------------| Chroococcales| | | || | | |----------------- Synechococcus sp.| | | || | | `----------------- Synechocystis sp.| |-----------------| Cyanobacteria| | | ,----------------- Anabaena sp.| | | || | |-----------------| Anabaena| | | || | | `----------------- Anabaena variabilis| | `---------------------------------- Fremyella diplosiphon| | ,---------------------------------- gamma subdivision ----| |-----------------| Proteobacteria| | | ,----------------- Myxococcus xanthus| | | || | |-----------------| delta subdivision| | | || | | `----------------- Desulfovibrio vulgaris| | | ,----------------- Campylobacter jejuni| | | || | |-----------------| epsilon subdivision| | | || | | `----------------- Helicobacter pylori| | `---------------------------------- Pseudomonas sp.| || |--------------------------------------------------- Thermotoga maritima| || `--------------------------------------------------- Thermus aquaticus-| Universal Ancestor| ,----------------- Sulfolobus
acidocaldarius| || ,-----------------| Sulfolobus| | `----------------- Sulfolobus solfataricus| ,-----------------| Archaea| | `---------------------------------- Euryarchaeota ----`-----------------| Archaea and Eukarotae
| ,---------------------------------- Giardia lamblia| |`-----------------| Eukaryotae
`---------------------------------- mitochondrial eukaryotes----

48(c
)M
ark
Ger
stei
n,1
999,
Yal
e,b
ioin
fo.m
bb
.yal
e.ed
u
GenProtEC -Functional
Classification
the E. coli databasehttp://genprotec.mbl.edu/start

49(c
)M
ark
Ger
stei
n,1
999,
Yal
e,b
ioin
fo.m
bb
.yal
e.ed
u
COGs - OrthologsOrtholog ~ gene withprecise same role in diff.organism, directly relatedby descent from acommon ancesor
Ortholog,homolog,fold
vsParalog
50 (c) Mark Gerstein, 1999, Yale, bioinfo.mbb.yale.edu
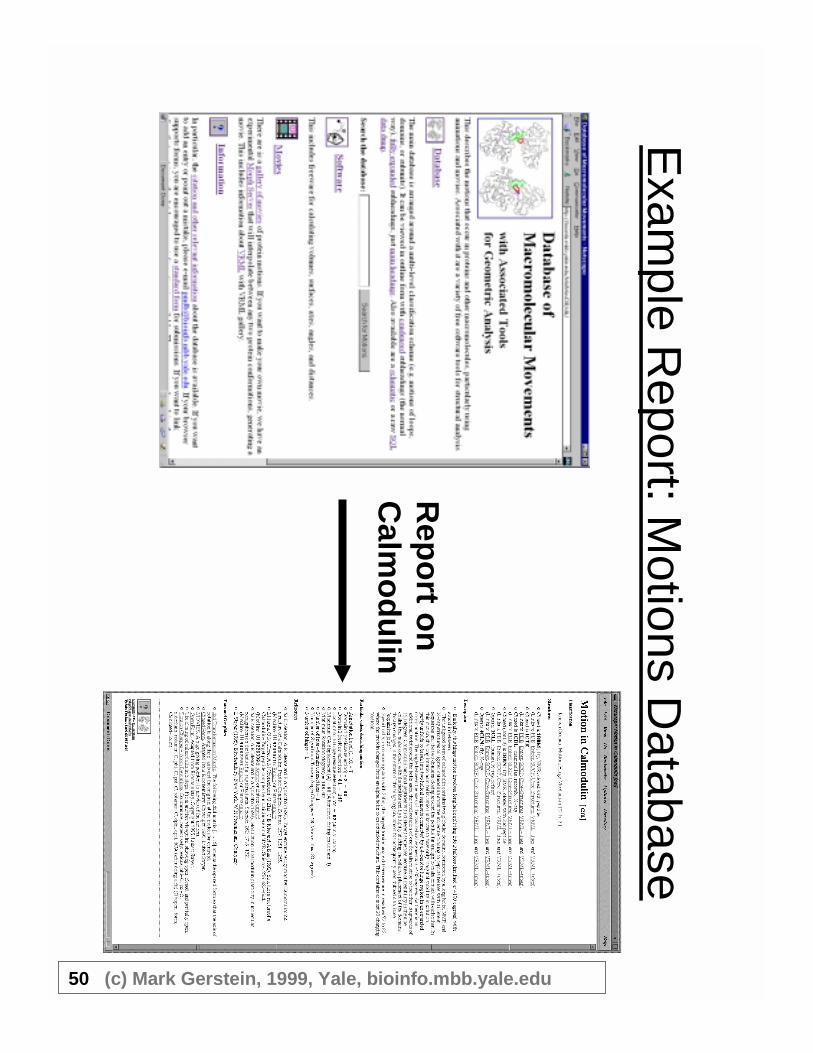
Exam
pleR
eport:Motions
Database
Rep
ort
on
Calm
od
ulin

51(c
)M
ark
Ger
stei
n,1
999,
Yal
e,b
ioin
fo.m
bb
.yal
e.ed
u
Example Report: Motions DatabaseCREATE TABLE classes (
class_num_ CHAR(10),new CHAR(10),class_name CHAR(80)
)CREATE TABLE classifications (
id_ CHAR(10),
class_num CHAR(10))CREATE TABLE links (
id_ CHAR(10),
url_ CHAR(150),hilit_text CHAR(100),other_text CHAR(500),flag CHAR(5)
)CREATE TABLE names (
id_ CHAR(10),
seq_num_n INT,name CHAR(255)
)CREATE TABLE refs (
id_ CHAR(10),
medline_I INT,endnote_I INT,flag_n INT
)CREATE TABLE descriptions (
id_ CHAR(10),
num_I INT,prose CHAR(5000)
)
CREATE TABLE relations (
id_ CHAR(15),
id_to_ CHAR(15),type CHAR(30),comment CHAR(512)
)CREATE TABLE single_vals (
id_ CHAR(10),
name_ CHAR(30),val CHAR(30),comment CHAR(500)
)CREATE TABLE structures (
id_ CHAR(10),
pdb_id_ CHAR(8),name_short CHAR(50),chain CHAR(1),name_long CHAR(100)
)CREATE TABLE value_names (abbrev_ CHAR(15),name CHAR(50)
)CREATE TABLE endnote_refs (num_I INT,name CHAR(512)
)
Reportshowsinformation,mergingtogethermany tableswith variableamounts ofinformation.Form samebut allowsentry.
Schema
52(c
)M
ark
Ger
stei
n,1
999,
Yal
e,b
ioin
fo.m
bb
.yal
e.ed
u
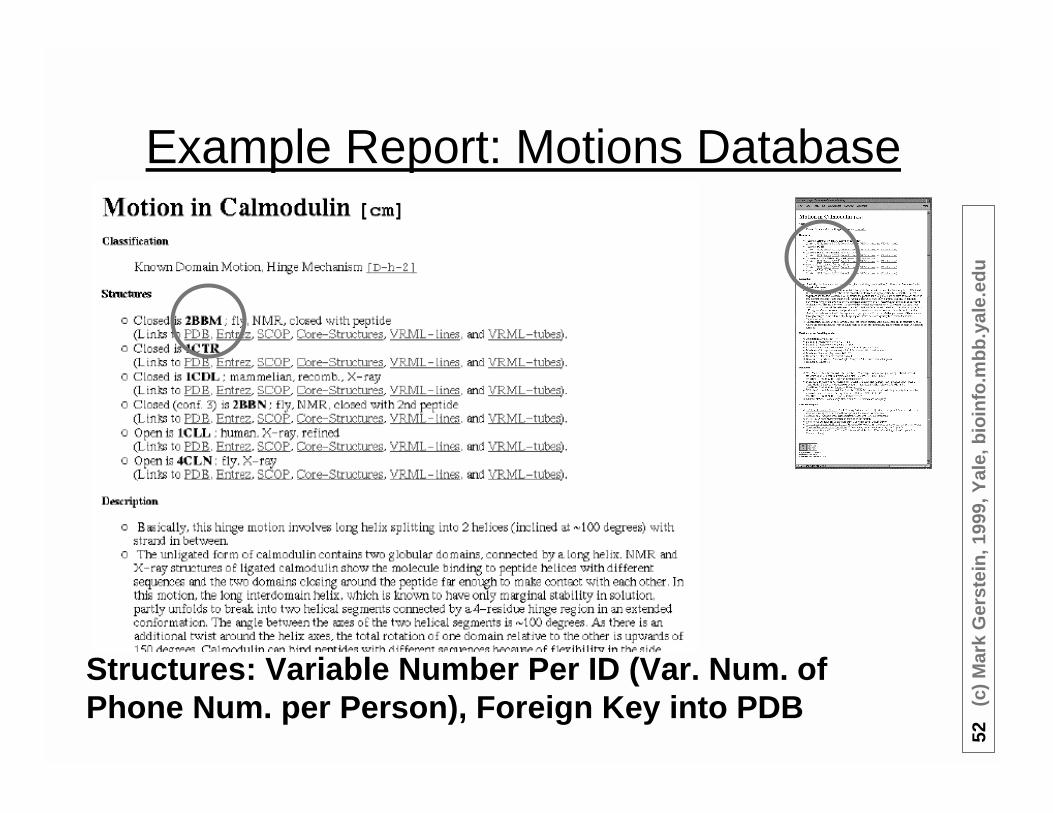
Example Report: Motions Database
Structures: Variable Number Per ID (Var. Num. ofPhone Num. per Person), Foreign Key into PDB

53(c
)M
ark
Ger
stei
n,1
999,
Yal
e,b
ioin
fo.m
bb
.yal
e.ed
u
Example Report: Motions Database
Single Values:Joining TwoTables andIterating in Perl
$sth = $dbh->query("SELECT value_names.name,single_vals.val,single_vals.comment ".
"FROM value_names,single_vals "."WHERE single_vals.id_ = '$id' ANDsingle_vals.name_ = value_names.abbrev_ "."ORDER BY value_names.name");
$rows = $sth->numrows;
if ($rows > 0) {&PrintHead("Particular values describing motion");for ($i=0; $i<$rows; $i++) {
@values = $sth->fetchrow;PrintSingleVals(@values);
}}

54(c
)M
ark
Ger
stei
n,1
999,
Yal
e,b
ioin
fo.m
bb
.yal
e.ed
u
Example Report: Motions Database
NAMESid_ seq_num_n nameaat 7 Aspartate Amino Transferase (AAT)acetyl 1005 Acetylcholinesterasebr 97 Bacteriorhodopsin (bR)cm 23 Calmodulin
REFSid_ medline_I endnote_Iacetyl 0 1007br 90294303 893br 93154310 313cm 92263094 648cm 92390716 647cm 94082290 673
ENDNOTE_REFSnum_I name313 S Subramaniam, M Gerstein, D Oesterhelt and R H Hender893 R Henderson, J M Baldwin, T A Ceska, F Zemlin, E Beckm1007 M K Gilson, T P Straatsma, JA A McCammon, D R Ripoll,647 W E Meador, A R Means and F A Quiocho (1992). Target e648 M Ikura, G M Clore, A M Gronenborn, G Zhu, C B Klee an649 B-H Oh, J Pandit, C-H Kang, K Nikaido, S Gokcen, G F-L
References:Join Two Lists (Protein Namesand References) with a TableContaining Key for each List (aRelation: protein has reference.)
SELECT endnote_refs.name, refs.medline_IFROM endnote_refs,refs WHERE refs.id_ =’cm' AND refs.endnote_I =endnote_refs.num_I

55(c
)M
ark
Ger
stei
n,1
999,
Yal
e,b
ioin
fo.m
bb
.yal
e.ed
u
Example Report: Motions Database
Graphics:How to StoreComplex Data?(File Pointers,BLOBS, OODB)

56(c
)M
ark
Ger
stei
n,1
999,
Yal
e,b
ioin
fo.m
bb
.yal
e.ed
u
Large-scale Example: Census DB
• 9 Genome Comparison• 1437 Relational Tables• 442 Mb• Simple ASCII Layout

57(c
)M
ark
Ger
stei
n,1
999,
Yal
e,b
ioin
fo.m
bb
.yal
e.ed
u
Major Application II:Overall Genome Characterization
• Overall Occurrence of aCertain Feature in theGenome◊ e.g. how many kinases in Yeast
• Compare Organisms andTissues◊ Expression levels in Cancerous vs
Normal Tissues
• Databases, Statistics
(Clock figures, yeast v. Synechocystis,adapted from GeneQuiz Web Page, Sander Group, EBI)

58(c
)M
ark
Ger
stei
n,1
999,
Yal
e,b
ioin
fo.m
bb
.yal
e.ed
u
• Structure helps to understand genomes insimplest terms -- fewest parts & most duplication
• Structural domain more precisely defined thansequence module
• Sequence Similarity more reliably related toStructure than Function
• Many approaches to building Library◊ Manual (scop, Murzin)
~1000 folds
~100000 genes
~1000 genes
1 2 3 4 5 6 7 8 9 10 11 12 13 14 15 …
1 2 3 4 5 6 7 8 9 10 11 12 13 14 15 16 17 18 19 20 …
(human)
(T. pallidum)
The World ofStructures isalso Finite:
A FoldLibrary Automatic:
FSSP-HSSP(Holm/Sander),Entrez-MMDB(Bryant)
Semi-automatic:CATH (Thornton),HOMALDB (Sali)
Sequences 1st:Pfam(Durbin/Eddy),COGs(Koonin/Lipman),Blocks (Henikoff),ProSite (Bairoch)

59(c
)M
ark
Ger
stei
n,1
999,
Yal
e,b
ioin
fo.m
bb
.yal
e.ed
u
Cross-Reference:Folds→Sequences
→ Organisms
Abbrev. Kingdom(subgroup)
Genome Num.ORFs
Reference
EC Bacteria (gram negative) Escherichia coli 4290 Blattner et al.
HI Bacteria (gram negative) Haemophilusinfluenzae
1680 TIGR
HP Bacteria (gram negative) Helicobacter pylori 1577 TIGR
MG Bacteria (gram positive) Mycoplasmagenitalium
468 TIGR
MJ Archaea (Euryarchaeota) Methanococcusjannaschii
1735 TIGR
MP Bacteria (gram positive) Mycoplasmapneumoniae
677 Himmelreichet al.
SC Eukarya (fungi) Saccharomycescerevisiae
6218 Goffeau et al.
SS Bacteria (Cyanobacteria) Synechocystis sp. 3168 Kaneko et al.
class Fold# EC SC HI SS HP MJ MP MG total Fam.PDB Rep. Struc. Name
α/β 18 60 46 23 40 19 7 4 3 202 16 183 1xel - NAD(P)-binding Rossmann Fold
α/β 24 20 69 17 19 17 16 10 11 179 13 132 1gky - P-loop Containing NTP Hydrolases
α+β 31 37 28 18 16 12 40 3 3 157 23 160 1fxd - like Ferrodoxin
α/β 01 45 36 13 22 11 10 5 4 146 37 399 1byb - TIM-barrel
α/β 23 18 17 7 9 4 8 2 2 67 5 36 1pyd a:2-181 Thiamin-binding
α/β 04 15 11 7 10 1 9 5 5 63 13 132 2tmd a:490-645 FAD/NAD(P)-binding
α+β 55 8 9 7 8 9 3 6 6 56 4 23 1sry a:111-421 Class-II-aaRS/Biotin Synthetases
β 27 7 10 8 8 4 4 3 3 47 5 19 1fnb 19-154 Reductase/Elongation Factor Domain
β 24 13 7 4 3 3 3 3 3 39 18 177 1snc - OB-fold
α+β 11 10 8 4 8 2 2 2 1 37 11 48 1igd - beta-Grasp
β 55 9 10 5 5 2 2 2 2 37 7 19 1bdo - Barrel-sandwich hybrid
α/β 15 5 5 4 4 5 6 3 3 35 3 22 2ts1 1-217 ATP pyrophoshatases
α/β 05 10 4 2 4 2 2 2 3 29 4 35 1zym a: The "swivell ing" beta/beta/alpha domain
α/β 60 5 7 4 6 3 2 1 1 29 3 18 3pmg a:1-190 Phosphoglucomutase, firs t 3 domains
α+β 68 4 2 3 6 4 2 4 3 28 2 3 1mat - Creat inase/methionine aminopept idase
α+β 39 6 4 3 4 4 1 1 1 24 3 42 1gad o:149-312 like G3P dehydrogenase, Ct-dom
α+β 18 5 4 4 1 2 2 1 2 21 3 23 1fkd - FKBP-like
α/β 41 3 3 3 3 1 3 1 1 18 3 16 1opr - Phosphoribosyltransferases (PRTases)
α 78 1 9 1 2 1 1 1 1 17 1 23 1oel a:(*) GroEL, the ATPase domain
α+β 10 2 2 2 4 2 1 2 2 17 2 5 1dar 477-599 Ribosomal protein S5 domain 2-like
α+β 43 4 3 2 2 1 1 2 2 17 4 50 3grs 364-478 FAD/NAD-linked reductases, dimer-dom.
α+β 09 3 4 3 1 2 1 1 1 16 3 12 1kpa a: HIT-like
α/β 47 4 2 3 1 2 1 1 1 15 2 10 1ulb - Purine and uridine phosphorylases
α+β 33 3 1 3 3 2 1 1 1 15 2 3 1tig - IF3-like
α+β 26 2 3 1 2 2 1 1 1 13 3 4 1stu - dsRBD & PDA domains
α+β 29 2 5 1 1 1 1 1 1 13 3 26 1one a:1-141 like Enolase, Nt-dom.
Μ 11 2 1 2 1 2 2 1 1 12 1 1 1ecl - type I DNA topoisomerase
β 23 1 3 1 1 1 1 1 1 10 1 1 1whi - Ribosomal protein L14
α/β 31 2 2 1 1 1 1 1 1 10 1 10 1trk a:535-680 Transketolase, Ct-dom.
α/β 61 1 1 1 1 1 1 1 1 8 1 4 3pgk - Phosphoglycerate kinase
α/β 13 49 8 14 57 12 5 1 146 15 100 3chy - Flavodoxin-like
α/β 38 24 54 15 11 4 4 5 117 19 112 2rn2 - Ribonuclease H-like motif
α 02 7 18 6 9 4 5 5 54 4 33 1hdj - Long alpha-hairpin
β 21 14 13 3 3 2 2 1 38 2 44 1lep a: GroES-like
α/β 30 7 13 4 10 2 1 1 38 7 83 1srx - Thioredoxin-like
α/β 56 8 4 2 4 2 4 2 26 3 105 2at2 a: Asp-carbamoyltransferase, Cat.-chain
α+β 70 3 6 3 3 3 3 3 24 3 24 1mxa 1-101 S-adenosylmethionine synthetase. MAT
α/β 44 2 1 3 5 6 4 2 23 5 16 1vid - SAM-dependent methyltransferases
Μ 12 4 1 4 3 2 4 4 22 1 1 1bgw - type II DNA topoisomerase
Μ 16 3 10 2 3 1 1 1 21 1 4 1dkz a: like HSP70, Ct-dom.
β 31 4 2 3 3 3 2 1 18 3 20 1bmf a:24-94 like F1 ATP synthase, a & b sub., A-dom.
α 21 4 2 4 3 2 1 1 17 5 54 1fha - Ferrit in-like
α/β 55 3 6 1 2 1 2 1 16 1 29 1xaa - Isocit rate/isopropylmalate dehydrogenases
α+β 71 3 2 3 3 2 2 1 16 5 10 2pol a:1-122 DNA clamp
α 49 2 2 2 2 2 2 2 14 2 18 1bmf a:380-510 Left-handed superhelix
α/β 50 4 4 1 2 1 1 1 14 3 27 2ctb - Zn-dependent exopeptidases
α/β 43 4 1 2 3 1 1 1 13 1 7 1cde - Glycinamide ribonucleotide transformylase
β 53 2 1 2 2 2 1 1 11 1 4 1lxa - Single-stranded left-handed beta-helix
β 38 2 2 1 2 1 1 1 10 1 7 1pkn 116-217 Pyruvate kinase beta-barrel domain
β 28 2 1 2 1 1 1 1 9 1 6 1efu a:297-393 EF-Tu, Ct-dom.
α/β 03 2 2 1 1 1 1 1 9 1 1 1rlr 221-748 ribonucleotide reductase, R1 sub., Ct-dom.
α+β 85 1 3 1 1 1 1 1 9 3 43 1mld a:145-313 like LDH/MDH, Ct-dom.
α 15 1 1 1 1 1 1 1 7 1 3 1bmf g: F1-ATPase, gamma subunit
α+β 24 1 1 1 1 1 1 1 7 1 1 1ctf - Ribosomal protein L7/12, Ct-dom.
1 A1
2 C1
3 B1
4
5
6 B1 B1
7
8
9 C1 A1
10 D1 D1 D1
A1
A26 pairs
A3
A4
B1
C11 pair
C2
D1
Folds
("Superfold")
IndividualStructures
SequenceFamilies
class Fold# EC SC HI SS HP MJ MP MG total Fam.PDB Rep. Struc. Name
α/β 18 60 46 23 40 19 7 4 3 202 16 183 1xel - NAD(P)-bindin
α/β 24 20 69 17 19 17 16 10 11 179 13 132 1gky - P-loop Contai
α+β 31 37 28 18 16 12 40 3 3 157 23 160 1fxd - like Ferrodoxi
α/β 01 45 36 13 22 11 10 5 4 146 37 399 1byb - TIM-barrel
α/β 23 18 17 7 9 4 8 2 2 67 5 36 1pyd a:2-181 Thiamin-bindin
α/β 04 15 11 7 10 1 9 5 5 63 13 132 2tmd a:490-645 FAD/NAD(P)-
α+β 55 8 9 7 8 9 3 6 6 56 4 23 1sry a:111-421 Class-II-aaRS
β 27 7 10 8 8 4 4 3 3 47 5 19 1fnb 19-154 Reductase/El
β 24 13 7 4 3 3 3 3 3 39 18 177 1snc - OB-fold
α+β 11 10 8 4 8 2 2 2 1 37 11 48 1igd - beta-Grasp
(1) Structures in Folds (scop)
(2) MatchSequences(fasta,blast)
(3) OrganizeSequencesby Genomeor Taxon
(4) Results in “Fold Table”
Structurally Uncharacterized (186)
1 4 3 3 2 5 6 1 4 2 4
1 PDB Match (152) 3 TM helix (30) 5 Coiled-Coil
2 Low Complexity Region (116) 4 Linker Region (5) 6 All-alpha or All-beta Region
3+5
Virus
Eubacteria
Other Euk.
Eukaryote
1
2
3
4
5
6
7
Plant
Other Met.
Metazoa Arthropod
Chordate

60(c
)M
ark
Ger
stei
n,1
999,
Yal
e,b
ioin
fo.m
bb
.yal
e.ed
u
Venn Diagrams forShared Folds
58 40
715
6
106
50
Eukaryotes (229)
Eubacteria (202)
other (virus) (78)
62
15
88
1296
Metazoa (194)
28
Plants (124)
other eukaryotes (151)
10
315
087
Chordates (181)
50
29
other metazoa (126)
Arthropods (105)
~300-350 folds(282 folds in scop1.32 [‘96])
~120K sequencesin OWL 27.1
7 phylogeneticgroups oforganisms
5 genomes --HI, EC (bacteria),MJ (archeon),SC (eukaryote),CE (worm, animal)
HI
8
3 2538
2 2 20MJ SC
α/β
HI
23
3 3545
3 3 36MJ SC
of 339

61(c
)M
ark
Ger
stei
n,1
999,
Yal
e,b
ioin
fo.m
bb
.yal
e.ed
u
Patterns ofFolds Usage in
8 Genomes
0%
20%
40%
60%
80%
100%
120%
0 1 2 3 4 5 6 7 8
superfold
fold
family
"Fold" Present in at Least this Many Genomes
Fra
ctio
no
fTot
alK
no
wn
"Fo
lds"
ESHSHMMM (##) ESHSHMMM (##) ESHSHMMM (##) ESHSHMMM (##) ESHSHMMM (##)CCISPJPG CCISPJPG CCISPJPG CCISPJPG CCISPJPG
11111111 (30) .1...... (23) 1....... (19) 11111.11 (16) 111111.. (16)1111.... (09) 11111... (08) 1.1..... (08) 1.111.11 (06) 11...... (06)...1.... (06) 1.11.... (05) .1.1.... (05) 1.111... (04) 11.1.... (04).1...1.. (04) ..1..... (04) 111111.1 (03) 1111111. (03) 1111..11 (03)1111.1.. (03) .....1.. (03) 1111.111 (02) 111...11 (02) 111.11.. (02)1.11.1.. (02) ..111... (02) .1.11... (02) 1..1.1.. (02) 1.1..1.. (02)111..... (02) .11..... (02) ......1. (02) ....1... (02) 111..111 (01)111.1.11 (01) 1.111..1 (01) 1.1111.. (01) .1.1..11 (01) .1.11.1. (01).11.1..1 (01) 1....111 (01) 1..111.. (01) 1.1...11 (01) 1.1..11. (01)11....11 (01) 11.1.1.. (01) 11.11... (01) 111..1.. (01) 111.1... (01).11...1. (01) 1.....11 (01) 1...11.. (01) 1.1.1... (01) ......11 (01)....1..1 (01) ...1.1.. (01) ...11... (01) ..1.1... (01) .1....1. (01)1....1.. (01) .......1 (01)
fold fam.superfold
total in PDB 338 990 25
in at least one of8 genomes 240 547 23
present in thismany genomes
1 60 192 12 32 82 43 23 54 34 27 53 35 17 50 06 27 49 37 24 41 28 30 26 7
A1
A2
A3
A4
B1
Folds
("Superfold")
SequenceFamilies Superfold = fold
that allows manynon-homologousseq. (Thornton)

62(c
)M
ark
Ger
stei
n,1
999,
Yal
e,b
ioin
fo.m
bb
.yal
e.ed
u
Cluster Trees Grouping InitialGenomes on Basis of Shared Folds
20 3010
D=10/(20+10+30)
Fold Tree “Classic” Tree
0.1
E
Tpal
Mgen
Hpyl
Syne
Aful
Ctra
Scer
Rpro
Mpne
sub Mjan
Bbur
Mtub
Cpne
Mthe
Hinf
Phor
Aaeo
Cele
T= total #folds in both
D = shared fold dist.betw. 2 genomes
D=S/T S = # shared folds
20 Genomes

63 (c) Mark Gerstein, 1999, Yale, bioinfo.mbb.yale.edu
Whole
Genom
eT
rees
64(c
)M
ark
Ger
stei
n,1
999,
Yal
e,b
ioin
fo.m
bb
.yal
e.ed
u
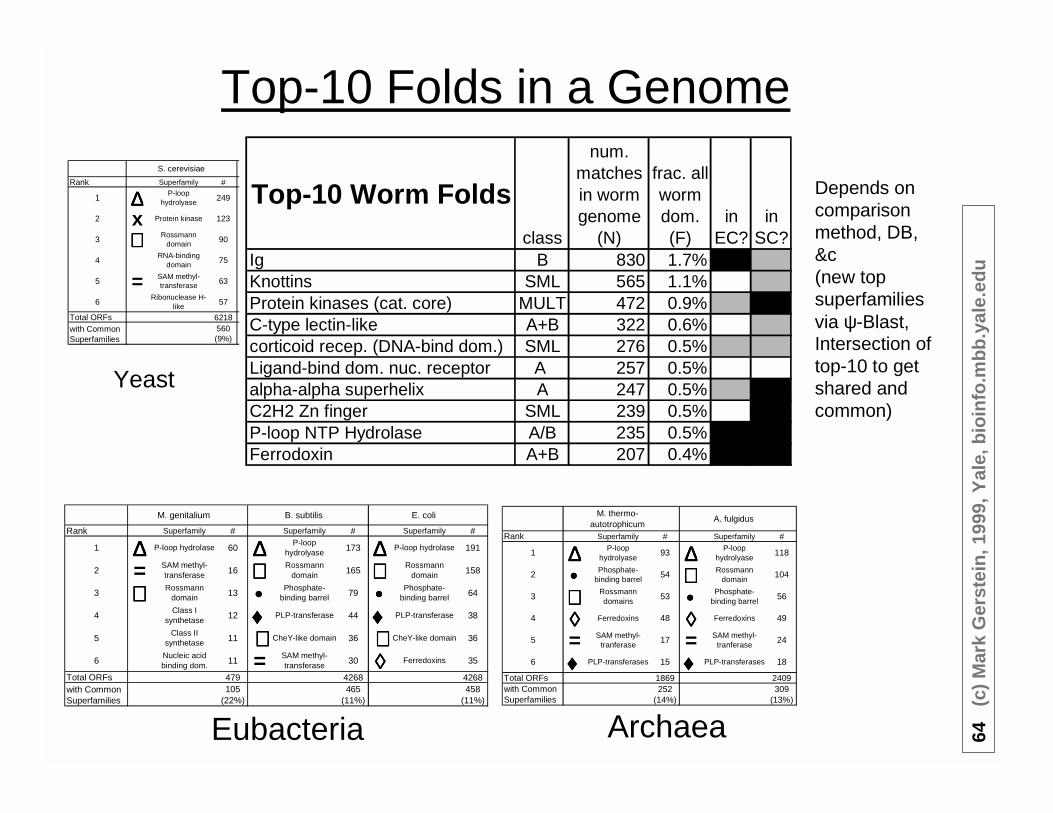
Top-10 Folds in a Genome
M. genitalium B. subtilis E. coli
Rank Superfamily # Superfamily # Superfamily #
1 ∆∆∆∆ P-loop hydrolase 60 ∆∆∆∆ P-loophydrolyase 173 ∆∆∆∆ P-loop hydrolase 191
2 = SAM methyl-transferase 16 ⊗⊗⊗⊗ Rossmann
domain 165 ⊗⊗⊗⊗ Rossmanndomain 158
3 ⊗⊗⊗⊗ Rossmanndomain 13 •••• Phosphate-
binding barrel 79 •••• Phosphate-binding barrel 64
4Class I
synthetase 12 ♦♦♦♦ PLP-transferase 44 ♦♦♦♦ PLP-transferase 38
5Class II
synthetase 11 ∗∗∗∗ CheY-like domain 36 ∗∗∗∗ CheY-like domain 36
6Nucleic acidbinding dom. 11 = SAM methyl-
transferase 30 ◊◊◊◊ Ferredoxins 35
Total ORFs 479 4268 4268with CommonSuperfamilies
105(22%)
465(11%)
458(11%)
M. thermo-autotrophicum
A. fulgidus
Rank Superfamily # Superfamily #
1 ∆∆∆∆ P-loophydrolyase
93 ∆∆∆∆ P-loophydrolyase
118
2 •••• Phosphate-binding barrel
54 ⊗⊗⊗⊗ Rossmanndomain
104
3 ⊗⊗⊗⊗ Rossmanndomains
53 •••• Phosphate-binding barrel
56
4 ◊◊◊◊ Ferredoxins 48 ◊◊◊◊ Ferredoxins 49
5 = SAM methyl-tranferase
17 = SAM methyl-tranferase
24
6 ♦♦♦♦ PLP-transferases 15 ♦♦♦♦ PLP-transferases 18
Total ORFs 1869 2409with CommonSuperfamilies
252(14%)
309(13%)
Rank Superfamily #
1 ∆∆∆∆ P-loophydrolyase
249
2 x Protein kinase 123
3 ⊗⊗⊗⊗ Rossmanndomain
90
4RNA-binding
domain75
5 = SAM methyl-transferase 63
6Ribonuclease H-
like57
Total ORFs 6218with CommonSuperfamilies
560(9%)
S. cerevisiae
Eubacteria
Yeast
Archaea
Depends oncomparisonmethod, DB,&c(new topsuperfamiliesvia ψ-Blast,Intersection oftop-10 to getshared andcommon)
Top-10 Worm Foldsclass
num.matchesin wormgenome
(N)
frac. allwormdom.(F)
inEC?
inSC?
Ig B 830 1.7% 18 4Knottins SML 565 1.1% 0 3Protein kinases (cat. core) MULT 472 0.9% 1 142C-type lectin-like A+B 322 0.6% 0 1corticoid recep. (DNA-bind dom.) SML 276 0.5% 1 10Ligand-bind dom. nuc. receptor A 257 0.5% 0 0alpha-alpha superhelix A 247 0.5% 6 114C2H2 Zn finger SML 239 0.5% 0 78P-loop NTP Hydrolase A/B 235 0.5% 72 133Ferrodoxin A+B 207 0.4% 83 114

65(c
)M
ark
Ger
stei
n,1
999,
Yal
e,b
ioin
fo.m
bb
.yal
e.ed
u
Characteristicsof Common,
Shared Folds:βαβ structure
All share α/β structure withrepeated R.H. βαβ units
connecting adjacent strandsor nearly so (18+4+2 of 24)
HI, MJ, SC vs scop 1.32
336: 42

66(c
)M
ark
Ger
stei
n,1
999,
Yal
e,b
ioin
fo.m
bb
.yal
e.ed
u
What are the most common folds:Overall? In plants? In animals?
Num. of Sequences
Fam
ilies
Tot
al
Vir
us
Eub
acte
ria
Eukaryote
Exa
mpl
e S
truc
ture
(P
DB
)
Cla
ss Fold Name
Num
. S
eq.
Pla
nt
Met
azoa
n
Oth
er
Totals
719
3770
6 3139
7032
4960
1931
9
1828
Overall Top-10 ∇ 1REI-A β Immunoglobulin-like 32 13 ◊ 1 ◊ 25 ◊6TIM-B α/β TIM-barrel 29 6 ◊ 7 20 2 13
1ATP-E O Protein Kinases (catalytic core) 1 4 3 ◊ 3 6 61FXD O Ferredoxin-like 17 4 2 2 17 ◊ 81AKE-A α/β NTP Hydrolases containing P-loop 9 3 ◊ 5 3 2 71HDD-C α DNA-binding 3-helical bundle 13 3 ◊ ◊ 2 5 ◊2HSD-A α/β Rossmann Fold (NAD binding) 11 3 ◊ 7 3 1 31MBD α Globin-like 3 2 1 ◊ 4 12RN2 α/β like Ribonuclease H 15 2 5 1 2 1 5
1ZNF S Classic Zinc Finger 2 1 ◊ 3 1
Sequence Family Top-11 ∇
1REI-A β Immunoglobulin-like 32 13 ◊ 1 ◊ 25 ◊6TIM-B α/β TIM-barrel 29 6 ◊ 7 20 2 13
1FXD O Ferredoxin-like 17 4 2 2 17 ◊ 82RN2 α/β like Ribonuclease H 15 2 5 1 2 1 51PYP β OB-fold 15 ◊ ◊ 1 ◊ ◊ ◊1PTX S Small inhibitors, toxins, lectins 14 ◊ 3 ◊ ◊2TBV-C β Viral coat and capsid proteins 14 1 12 1HDD-C α DNA-binding 3-helical bundle 13 3 ◊ ◊ 2 5 ◊2HSD-A α/β Rossmann Fold (NAD binding) 11 3 ◊ 7 3 1 31RCF α/β Flavodoxin-like 11 ◊ ◊ 4 ◊ ◊ ◊1RCB α 4-helical cytokines 11 ◊ ◊ ◊ 2
Percent of Sequences
Viru
s
Eub
acte
ria
Eukaryote
Fold Name
Num
ber
Pla
nt
Met
azoa
n
Oth
er
Plant Top-10 ∇∇∇∇α/β TIM-barrel 29 6 ³ 7 20 2 13
O like Ferredoxin 17 4 2 2 17 ³ 8α/β NTP Hydrolases containing P-loop 9 3 ³ 5 3 2 7
O Protein Kinases (catalytic core) 1 4 3 ³ 3 6 6
S Small inhibitors, toxins, lectins 14 ³ 3 ³ ³α/β Rossmann Fold (NAD binding) 11 3 ³ 7 3 1 3
O RuBisCO (small subunit) 1 ³ ³ 2 ³β like Concanavalin A 6 ³ ³ ³ 2 ³ 2
α like Hydrophobic Seed Protein 2 ³ 2
α/β like Ribonuclease H 15 2 5 1 2 1 5
Metazoan Top-10 ∇∇∇∇β like Immunoglobulin 32 13 ³ 1 ³ 25 ³
O Protein Kinases (catalytic core) 1 4 3 ³ 3 6 6α DNA-binding 3-helical bundle 13 3 ³ ³ 2 5 ³α like Globin 3 2 1 ³ 4 1
S Classic Zinc Finger 2 1 ³ 3 1α/β NTP Hydrolases containing P-loop 9 3 ³ 5 3 2 7
β Trypsin-like serine proteases 4 1 1 ³ 2 ³
α Cytochrome P450 1 1 ³ ³ 2 1
S like Glucocort. receptor (DNA-binding) 4 1 ³ 2 ³α EF-hand 3 1 ³ 1 2 1

67(c
)M
ark
Ger
stei
n,1
999,
Yal
e,b
ioin
fo.m
bb
.yal
e.ed
u
An Issue withFold Counting:Biases in theDatabanks
ExampleStructure Fold
Percentage ofknown folds
(PDB) Name in genome
Top-10 in a bacterial genome (H. influenzae)2HSD-A Rossmann Fold (NAD binding) 9.6 11AKE-A NTP Hydrolases containing P-loop 5.7 31RCF Flavodoxin-like 5.1 46TIM-B TIM-barrel 4.5 21FXD Ferredoxin-like 4.2 52RN2 like Ribonuclease H 3.0 161SBP like Periplasmic binding protein (class II) 3.0 112DRI like Periplasmic binding protein (class I) 3.0 191SRY-* Class II aaRS and biotin synthetases 2.7 501PYP OB-fold 2.7 9
Rank ineubacterial
Top-10
• Over-representation of certain species and functionsin the databanks (e.g. human v. plant globins, Ig’s)
• Nevertheless HI top-10 like eubacterial top-10
• PDB small, biased sample of genome (6-12%)• Diff. numbers with diff. comparison sensitivity
• FASTA, HMM, &c• Some Correction with Seq. Weighting, Diff. Sampling• Uniform sampling is better than high sensitivity for some and low
for others (ψ-blast problem)• Best to avoid FPs than FNs for Venn
}}}}
HBαHBβMbOther
Globin
Same Issues withReal US Census!!
Sampling

68(c
)M
ark
Ger
stei
n,1
999,
Yal
e,b
ioin
fo.m
bb
.yal
e.ed
u
Using a Tree toCorrect for Biases
x
y
z
DCBA100%
50%
0%
1
2
3
.8 .8 1.1 1.4
• Databank has biases.• Assuming "fair"
distribution spreadssequences uniformlythrough "space", want toweight sequences:◊ over-represented, down
(mammal)
◊ under-represented, up (plant& NV)
• Weights derived from atree◊ Length of an unshared
branch is allotted directly tosequence
◊ Length of a shared branch isdivided proportionally amongsequences
Other schemes (Argos, Sander)

69(c
)M
ark
Ger
stei
n,1
999,
Yal
e,b
ioin
fo.m
bb
.yal
e.ed
u
Know All Folds in aGenome: How arewe doing on MG?
• MG smallest genome with 479 ORFs
• Separate PDB Match, TMs, LC (SEG),linkers
• How many residues in genome matched byknown folds, in 1975, ‘76, ‘77...’00...’50
• The impact of PSI-blast in comparison topairwise methods
◊ Two way PSI-blast gives an improvement(genome vs PDB, PDB vs. genome)
• Union of many sets of PDB matches finds>40% of a.a. and more than half the ORFs(242/479)
◊ (Eisenberg, Godzik, Bork, Koonin, Frishman)
• ~65% structurally characterizedStructurally Uncharacterized (186)
1 4 3 3 2 5 6 1 4 2 4
1 PDB Match (152) 3 TM helix (30) 5 Coiled-Coil
2 Low Complexity Region (116) 4 Linker Region (5) 6 All-alpha or All-beta Region 0%
10%
20%
30%
40%
50%
60%
70%
80%
90%
100%
74 76 78 80 82 84 86 88 90 92 94 96 98
PDB matches
Good TMs, Low-complexity Regions
Fraction of the MG Genome(by residue) with Structural
Annotation over Time
TM
allmatchessig.+
link lowcplx.
knownfunc.
low-qual.TM, LC,
link
1-way
orig. '97fasta
2-way
nofunc.
Pooror
None
PDBMatch
ψψψψblast
GoodPrediction

70(c
)M
ark
Ger
stei
n,1
999,
Yal
e,b
ioin
fo.m
bb
.yal
e.ed
u
Know All Folds inGenome: MGOptimistic →
Prediction
• Just use one pairwise method formatching
• Multiple, big genomes (e.g. SC)
25%
30%
35%
40%
45%
50%
55%
1987 1988 1989 1990 1991 1992 1993 1994 1995 1996 1997Year
Fra
ctio
no
fa.
a.in
Gen
om
e
FITSCMJHIMPMGECSSHP
Structurally Uncharacterized (186)
1 4 3 3 2 5 6 1 4 2 4
1 PDB Match (152) 3 TM helix (30) 5 Coiled-Coil
2 Low Complexity Region (116) 4 Linker Region (5) 6 All-alpha or All-beta Region
0%
10%
20%
30%
40%
50%
60%
70%
80%
90%
100%
1970 1980 1990 2000 2010 2020 2030 2040 2050Year
Fra
ctio
nof
a.a.
inG
eno
me FIT
SCMJ
HIMPMG
EC
SSHP

71(c
)M
ark
Ger
stei
n,1
999,
Yal
e,b
ioin
fo.m
bb
.yal
e.ed
u
TM-helix“prediction”
• TM prediction (KD, GES).Count number with2 peaks, 3 peaks, &c.
• Similar conclusions to others:von Heijne, Rost, Jones, &c.
• Divide Predictions into sureand marginal(Boyd & Beckwith’s criteria)
0%
5%
10%
15%
20%
25%
1 2 3 4 5 6 7 8 9 10 11 12 13 14
Number of TM Helices
Fre
qu
ency
inG
eno
me
(as
afr
acti
on
of
tota
lnu
mb
ero
fse
qu
ence
s) Bacteria (HI)
Eukaryote (SC)
Archaeon (MJ)
0.0%
0.5%
1.0%
1.5%
2.0%
2.5%
3.0%
-3.0
0
-2.7
5
-2.5
0
-2.2
5
-2.0
0
-1.7
5
-1.5
0
-1.2
5
-1.0
0
-0.7
5
-0.5
0
-0.2
5
0.00
0.25
0.50
Min H value
Fre
q.i
nw
orm
gen
om
e
TM Marginal
Thresholds
Soluble
0
500
1000
1500
2000
2500
1 2 3 4 5 6 7 8 9 10 11 12 13 14 15 16 17 18 19
Number of TM helices per ORF
Nu
mb
er
of
Wo
rmO
RF
s
marginal
sure

72(c
)M
ark
Ger
stei
n,1
999,
Yal
e,b
ioin
fo.m
bb
.yal
e.ed
u
Comparative Genomicsof Membrane Proteins
• Yeast has moremem. prots., esp.2-TMs
• Similarconclusions toothers: vonHeijne, Rost,Jones, &c.
• Overall, no strongpreference for particularsupersecondary structures
◊ Freq. of Number of TMhelixes follows a Zipf-like law: F=1/[5n2]
• In detail, worm has a peakfor 7-TMs and E. coli for12-TMs
0%
5%
10%
15%
20%
25%
1 2 3 4 5 6 7 8 9 10 11 12 13 14
Number of TM Helices
Fre
qu
ency
inG
eno
me
(as
afr
acti
on
of
tota
lnu
mb
ero
fse
qu
ence
s) Bacteria (HI)
Eukaryote (SC)
Archaeon (MJ)
0.01
0.1
1
10
100
1 10 100Number of TM Helices
Fre
qu
ency
(as
ap
erce
nta
ge
of
tota
lseq
uen
ces) FIT
SC
MJ
HI
MP
MG
EC
SS
HP
0.0%
2.0%
4.0%
6.0%
8.0%
10.0%
12.0%
1 2 3 4 5 6 7 8 9 10 11 12 13 14 15 16 17
Number of TM helices
Fra
c.o
fG
eno
me
OR
Fs
wormyeastE. coli

73(c
)M
ark
Ger
stei
n,1
999,
Yal
e,b
ioin
fo.m
bb
.yal
e.ed
u
2º StructurePrediction
Fraction ofresiduesPredictedto be in... strand helix
Avg 17% 39%SD 1% 2%
EC 17% 39%HI 16% 41%HP 15% 42%MG 17% 39%MJ 19% 37%MP 17% 39%SC 17% 34%SS 16% 38%
Structurally Uncharacterized (186)
1 4 3 3 2 5 6 1 4 2 4
1 PDB Match (152) 3 TM helix (30) 5 Coiled-Coil
2 Low Complexity Region (116) 4 Linker Region (5) 6 All-alpha or All-beta Region
• Bulk prediction of 2º struc. in genomes• Same fraction of α and β (by element,
half each)
• Both overall and only for unknownsoluble proteins.
• Diff From PDB:31% helical and 21% strand.
• Related results: FrishmanNot expectedsince.…..

74(c
)M
ark
Ger
stei
n,1
999,
Yal
e,b
ioin
fo.m
bb
.yal
e.ed
u
DifferentAmino AcidCompositionShould GiveDifferent 2ºStructure
Each a.a. has differentpropensity for localstructure->Different Compositions (Kfrom 4.4 in EC to 10.4 inMJ, Q too)->Different Local Structure(but compensation?)
Propensities from Regan(beta) and Baldwin (alpha)
EC HI SS SC HP MP MG MJ TM-hlx helix strand
K 4.4 6.3 4.2 7.3 8.9 8.6 9.5 10.4 8.8 -1.5 -0.4
C 1.2 1.0 1.0 1.3 1.1 .8 .8 1.3 -2 -1.1 -0.8
R 5.5 4.5 5.1 4.5 3.5 3.5 3.1 3.8 12.3 -1.9 -0.4
N 4.0 4.9 4.0 6.1 5.9 6.2 7.5 5.3 4.8 -1 -0.5
Q 4.4 4.6 5.6 3.9 3.7 5.4 4.7 1.5 4.1 -1.3 -0.4
A 9.5 8.2 8.5 5.5 6.8 6.7 5.6 5.5 -1.6 -1.9 0
I 6.0 7.1 6.3 6.6 7.2 6.6 8.2 10.5 -3.1 -1.2 -1.3
H 2.3 2.1 1.9 2.2 2.1 1.8 1.6 1.4 3 -1.1 -0.4
S 5.8 5.8 5.8 9.0 6.8 6.5 6.6 4.5 -0.6 -1.1 -0.9
M 2.8 2.4 2.0 2.1 2.2 1.6 1.5 2.2 -3.4 -1.4 -0.9
P 4.4 3.7 5.1 4.3 3.3 3.5 3.0 3.4 0.2 3 >3.0
G 7.4 6.6 7.4 5.0 5.8 5.5 4.6 6.3 -1 0 1.2
F 3.9 4.5 4.0 4.5 5.4 5.6 6.1 4.2 -3.7 -1 -1.1
E 5.7 6.5 6.0 6.5 6.9 5.7 5.7 8.7 8.2 -1.2 -0.2
Y 2.9 3.1 2.9 3.4 3.7 3.2 3.2 4.4 0.7 -1.2 -1.6
V 7.1 6.7 6.7 5.6 5.6 6.5 6.1 6.9 -2.6 -0.8 -0.9
T 5.4 5.2 5.5 5.9 4.4 6.0 5.4 4.0 -1.2 -0.6 -1.4
D 5.1 5.0 5.0 5.8 4.8 5.0 4.9 5.5 9.2 -1 0.9
L 10.6 10.5 11.4 9.6 11.2 10.3 10.7 9.5 -2.8 -1.6 -0.5
W 1.5 1.1 1.6 1.0 .7 1.2 1.0 .7 -1.9 -1.1 -1
total propensityα -1.00 -1.02 -0.96 -1.00 -1.05 -1.03 -1.05 -1.01
β -0.27 -0.33 -0.26 -0.36 -0.37 -0.38 -0.42 -0.36
Amino Acid Composition Propensity(kcal/mole)

75(c
)M
ark
Ger
stei
n,1
999,
Yal
e,b
ioin
fo.m
bb
.yal
e.ed
u
Supersecondary structure words• Look at super-secondary
patterns (“words” such as ααor βαβ) in predictions
• Compare observed freq. withexpected freq.
odds = f(αβ)/f(α)f(β)(Freq. Words, Karlin)
• Do have differences betweengenomes (and PDB) here
HI more αα, ααα, αααα ...
SC more ββ, βββ, βββββ...
MJ more αβαβ, βαβα …
Super- Maximum
Secondary DifferenceStructure between 3"Word" Genomes HI MJ SC PDB
ββ 26% 0.96 1.06 1.24 1.22
αα 15% 0.97 0.85 0.83 0.85
αβ 10% 1.09 1.09 0.99 0.95
βα 7% 0.98 1.00 0.93 0.99
ββ βββ βββ βββ β 41% 0.96 1.15 1.46 1.62
αααααααααααα 19% 1.01 0.83 0.84 0.92
αβααβααβααβα 18% 1.04 1.03 0.87 1.16
ααβ 15% 1.03 0.97 0.89 0.70
βαββαββαββαβ 12% 1.15 1.24 1.10 1.19
βαα 11% 0.93 0.87 0.83 0.78
ββα 9% 0.90 0.94 0.99 0.82
αββ 6% 0.97 0.98 1.03 0.80
ββ β βββ β βββ β βββ β β 54% 1.03 1.35 1.78 2.28
αααααααααααααααα 29% 1.10 0.82 0.89 1.18
βββα 25% 0.85 0.94 1.10 0.98
βαβ αβαβ αβαβ αβαβ α 23% 1.11 1.18 0.94 1.48
αβαβαβαβαβαβαβαβ 21% 1.21 1.23 0.99 1.39
αβαα 21% 1.00 0.95 0.81 1.00
… … … … … …
Relative Abundance
(Odds Ratio)
76(c
)M
ark
Ger
stei
n,1
999,
Yal
e,b
ioin
fo.m
bb
.yal
e.ed
u
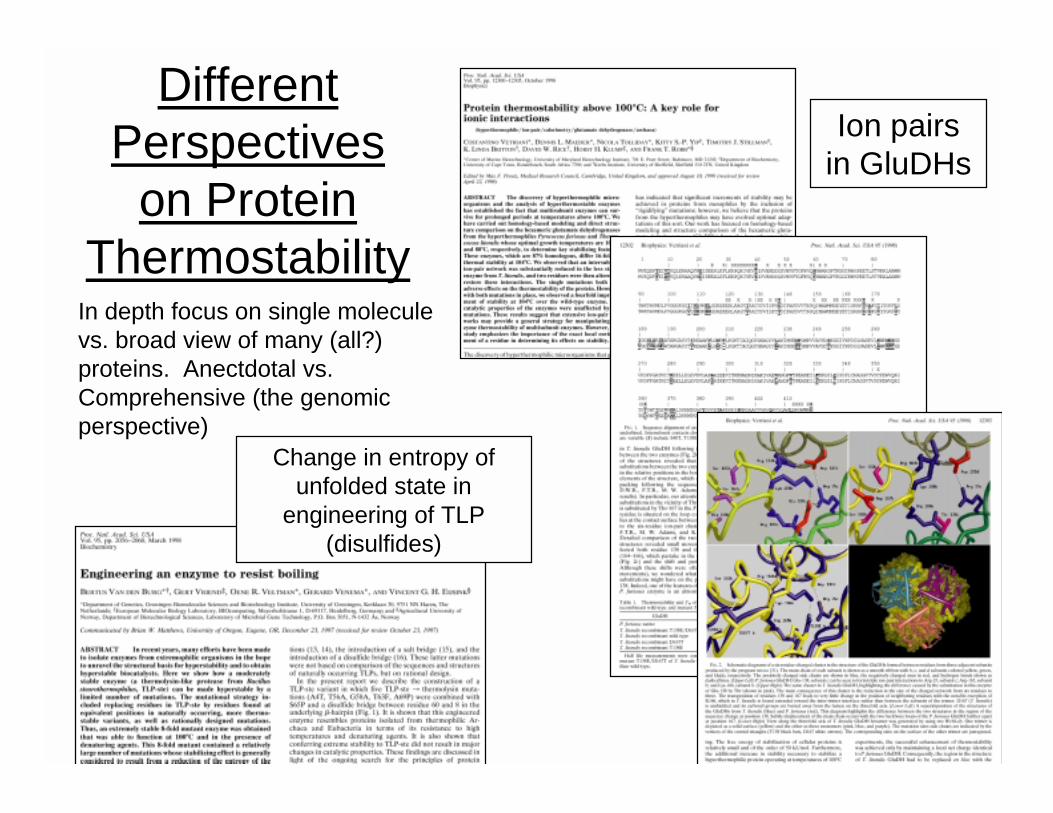
DifferentPerspectives
on ProteinThermostability
In depth focus on single moleculevs. broad view of many (all?)proteins. Anectdotal vs.Comprehensive (the genomicperspective)
Ion pairsin GluDHs
Change in entropy ofunfolded state in
engineering of TLP(disulfides)

77(c
)M
ark
Ger
stei
n,1
999,
Yal
e,b
ioin
fo.m
bb
.yal
e.ed
u
Thermostability: Analyzing a few Factorswith Genome Comparison
Organism Category GenomeAbbreviation
# ofProteins
Physiologicalcondition
Pyrococcus horikoshii(Strain OT3)(Kawarabayasi et al.,1998)
archaea OT 2061 98°°°°C,
anaerobe
Aquifex aeolicus(Deckert et al., 1998)
eubacteria,gram negative AA 1522 95°°°°C
Methanococcusjanaschii(Bult et al., 1996)
archaea MJ 1735 85°°°°C,
anaerobeArchaeoglobus fulgidus(Klenk et al., 1997) archaea AF 2409 83°°°°C,
anaerobeMethanobacteriumthermoautotrophicum(Smith et al., 1997)
archaea MT 1869 65°°°°C,
anaerobeHaemophilus influenzae(Fleischmann et al.,1995)
eubacteria,gram negative HI 1680 mesophilic temp.
Mycoplasma genitalium(Fraser et al., 1995)
eubacteria,gram positive MG 470 mesophilic temp.
Mycoplasmapneumoniae(Himmelreich et al.,1996)
eubacteria,gram positive MP 677 mesophilic temp.
Helicobactor pylori(Tomb et al., 1997)
eubacteria,gram negative HI 1590 mesophilic temp.
Escherichia coli(Blattner et al., 1997)
eubacteria,gram negative EC 4288 mesophilic temp.
Synechocystis sp.(Kaneko et al., 1996)
cyanobacteria SS 3168 mesophilic temp.
Saccharomycescerevisiae (Goffeau etal., 1997)
eukaryote,fungus SC 6218 mesophilic temp.
CEEEEHHHHHHHHHCCEEEEEEEEECCCMEAPAGNIDIIKAGMKSPVQLTVKNDT
__
tertiary (EK)
local (DK)
78(c
)M
ark
Ger
stei
n,1
999,
Yal
e,b
ioin
fo.m
bb
.yal
e.ed
u
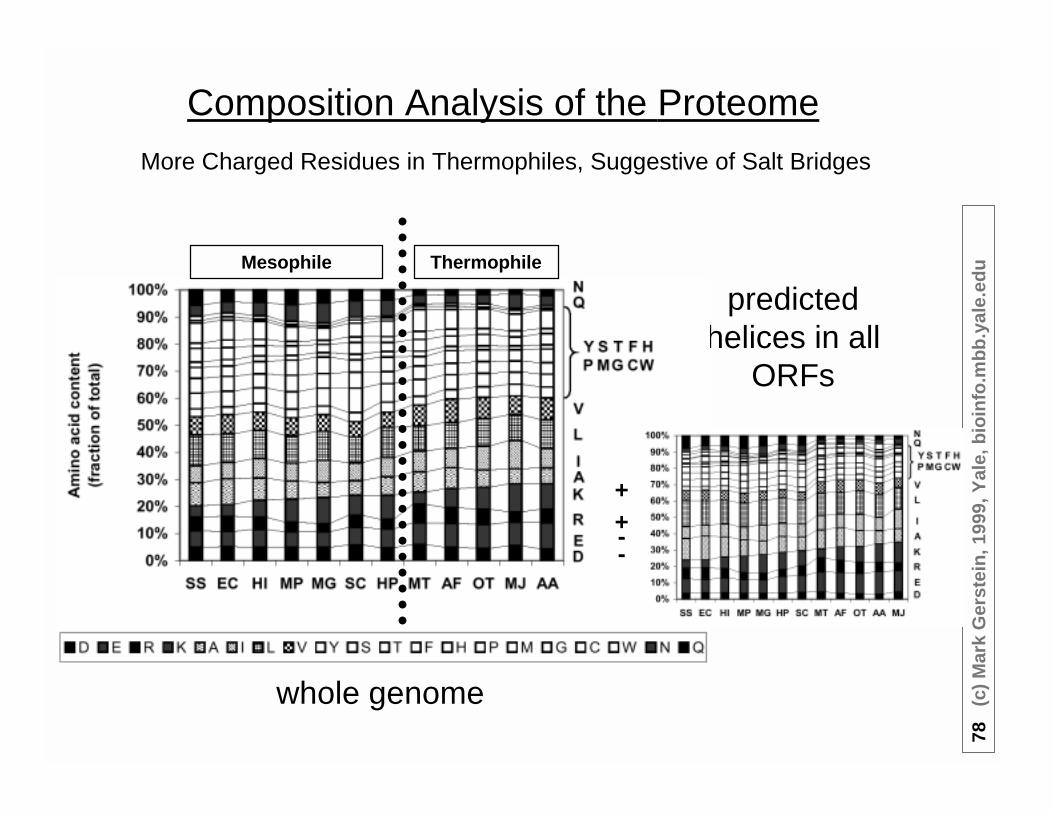
Composition Analysis of the Proteome
whole genome
More Charged Residues in Thermophiles, Suggestive of Salt Bridges
predictedhelices in all
ORFs
ThermophileMesophile
++--

79(c
)M
ark
Ger
stei
n,1
999,
Yal
e,b
ioin
fo.m
bb
.yal
e.ed
u
1-4 Spacing of ChargedResidues More than
Expected in ThermophileHelices ⇒ Salt Bridges
Quantify with LOD scoreLOD = log (observed/expected)For inst.,expected[EK(4)] ~ f(E)*f(K)LOD > 0, greater than expected
0.00
0.10
0.20
0.30
0.40
0.50
0.60
0.70
MP MG EC SC HP SS HI MT MJ AF AA OT
Mesophile Thermophile
LO
Dva
lue
EK(3)
EK(4)
10 to 45
Physiological temperature in C
9865 85 83 95
CEEEEHHHHHHHHHCCEEEEEEEEECCCMEAPAGNIDIIKAGMKSPVQLTVKNDT
__
tertiary (EK)
local (DK)

80(c
)M
ark
Ger
stei
n,1
999,
Yal
e,b
ioin
fo.m
bb
.yal
e.ed
u
0%
2%
4%
6%
8%
10%
12%
14%
16%
0 50 115
183
250
315
383
450
515
583
650
715
783
850
915
983
Length
Fre
qu
ency
(as
frac
tio
no
fto
tals
equ
ence
s)(%
)
mesophilic cog
thermophilic cog
thermophile
mesophile
Sequence LengthDoesn’t Completely
Relate toThermostability
But this neglects special case of AA(eubacterial thermophile): archealsequences shorter
Simple distributions of sequencelength have thermophiles shorter
(Eisenberg)

81(c
)M
ark
Ger
stei
n,1
999,
Yal
e,b
ioin
fo.m
bb
.yal
e.ed
u
Controllingfor Biases:StratifiedSample Stratified Sampling based on COGs
Meso, MT AF OT AA MJ Meso, AA MT AF OT MJ
Ortho.ALL
Correct forduplications, repeats,unique families;Extend COGs to get52 ortholog families
(COGs, Lipman, Koonin)
82(c
)M
ark
Ger
stei
n,1
999,
Yal
e,b
ioin
fo.m
bb
.yal
e.ed
u
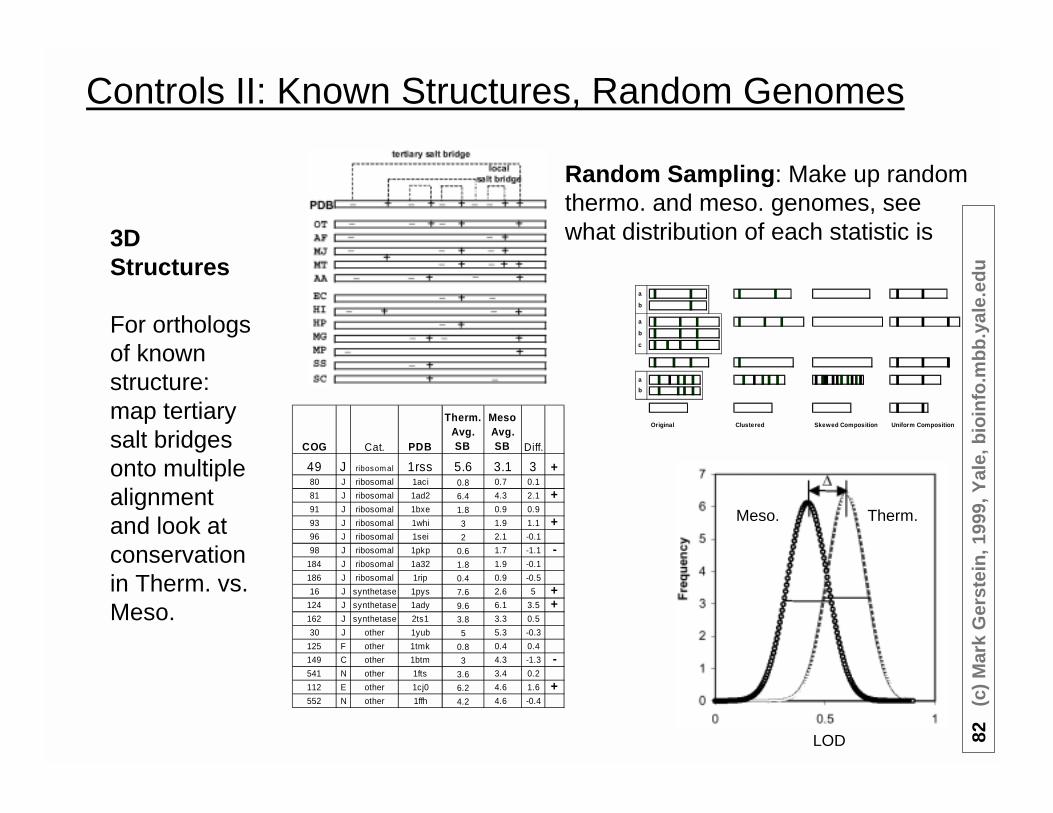
Controls II: Known Structures, Random Genomes
49 J ribosom al 1rss 3 +80 J ribosomal 1aci 0.7 0.1
81 J ribosomal 1ad2 4.3 2.1 +91 J ribosomal 1bxe 0.9 0.9
93 J ribosomal 1whi 1.9 1.1 +96 J ribosomal 1sei 2.1 -0.1
98 J ribosomal 1pkp 1.7 -1.1 -184 J ribosomal 1a32 1.9 -0.1
186 J ribosomal 1rip 0.9 -0.5
16 J synthetase 1pys 2.6 5 +124 J synthetase 1ady 6.1 3.5 +162 J synthetase 2ts1 3.3 0.5
30 J other 1yub 5.3 -0.3
125 F other 1tmk 0.4 0.4
149 C other 1btm 4.3 -1.3 -541 N other 1fts 3.4 0.2
112 E other 1cj0 4.6 1.6 +552 N other 1ffh 4.6 -0.4
3
3.6
6.2
4.2
9.6
3.8
5
0.8
0.6
1.8
0.4
7.6
6.4
1.8
3
2
0.8
Therm.Avg.SBCOG Cat. PDB Diff.
5.6 3.1
MesoAvg.SB
a
b
a
b
c
a
b
Uniform CompositionClusteredOriginal Skewed Composition
3DStructures
For orthologsof knownstructure:map tertiarysalt bridgesonto multiplealignmentand look atconservationin Therm. vs.Meso.
Random Sampling: Make up randomthermo. and meso. genomes, seewhat distribution of each statistic is
LOD
Therm.Meso.

83(c
)M
ark
Ger
stei
n,1
999,
Yal
e,b
ioin
fo.m
bb
.yal
e.ed
u
How Representative are theKnown Structures of theProteins in a Complete
Genome? The issue of Bias
0%
2%
4%
6%
8%
10%
12%
0 50 115
183
250
315
383
450
515
583
650
715
783
850
915
983
Length
Fre
qu
ency
(as
frac
tio
no
fto
tals
equ
ence
s)
FITSCMJHIMPMGECSSHP
0%
5%
10%
15%
20%
25%
30%
0 50 115
183
250
315
383
450
515
583
650
715
783
850
915
983
>1015
Length
Fre
qu
ency
(as
frac
tio
no
fto
tals
equ
ence
s) genomes
PDB domains
whole chains
Assess 2º,TM predictions(+) comprehensive, statistical(-) predictions inaccurate
(~65%)(-) extrapolate from PDB (esp. TM),
domain problem
Is prediction (extrapolation) based on knownstructures justified?
Length: Genomes Sequences are longerthan those in Known Structures
340 aa for avg. genome seq.(470 aa for yeast)205 aa for PDB chain~160 aa for PDB domain

84(c
)M
ark
Ger
stei
n,1
999,
Yal
e,b
ioin
fo.m
bb
.yal
e.ed
u
Amino Acid Composition
ABS. rms K I C Q W N F L G A P S R H M E D T Y V
EC 4.4 6.0 1.2 4.4 1.5 4.0 3.9 10.6 7.4 9.5 4.4 5.8 5.5 2.3 2.8 5.7 5.1 5.4 2.9 7.1
HI 6.3 7.1 1.0 4.6 1.1 4.9 4.5 10.5 6.6 8.2 3.7 5.8 4.5 2.1 2.4 6.5 5.0 5.2 3.1 6.7
SS 4.2 6.3 1.0 5.6 1.6 4.0 4.0 11.4 7.4 8.5 5.1 5.8 5.1 1.9 2.0 6.0 5.0 5.5 2.9 6.7
SC 7.3 6.6 1.3 3.9 1.0 6.1 4.5 9.6 5.0 5.5 4.3 9.0 4.5 2.2 2.1 6.5 5.8 5.9 3.4 5.6
HP 8.9 7.2 1.1 3.7 .7 5.9 5.4 11.2 5.8 6.8 3.3 6.8 3.5 2.1 2.2 6.9 4.8 4.4 3.7 5.6
MP 8.6 6.6 .8 5.4 1.2 6.2 5.6 10.3 5.5 6.7 3.5 6.5 3.5 1.8 1.6 5.7 5.0 6.0 3.2 6.5
MG 9.5 8.2 .8 4.7 1.0 7.5 6.1 10.7 4.6 5.6 3.0 6.6 3.1 1.6 1.5 5.7 4.9 5.4 3.2 6.1
MJ 10.4 10.5 1.3 1.5 .7 5.3 4.2 9.5 6.3 5.5 3.4 4.5 3.8 1.4 2.2 8.7 5.5 4.0 4.4 6.9
AVG 7.5 7.3 1.1 4.2 1.1 5.5 4.8 10.5 6.1 7.0 3.8 6.4 4.2 1.9 2.1 6.5 5.1 5.2 3.3 6.4
SD 2.3 1.4 .2 1.3 .3 1.2 .8 .7 1.0 1.5 .7 1.3 .9 .3 .4 1.0 .3 .7 .5 .6
Diff.
EC 16 -25 8 -29 19 7 -15 -2 28 -6 13 -5 -3 16 3 28 -7 -14 -7 -22 1
HI 17 8 27 -38 24 -21 6 12 26 -15 -2 -20 -2 -6 -7 10 5 -17 -11 -14 -4
SS 20 -29 13 -39 49 9 -13 1 37 -6 1 11 -3 6 -15 -8 -2 -16 -6 -20 -4
SC 21 24 18 -21 5 -27 31 14 15 -36 -34 -7 51 -7 -2 -4 5 -4 0 -8 -20
HP 27 52 29 -34 0 -51 27 36 34 -26 -18 -29 14 -28 -4 2 11 -20 -25 1 -20
MP 28 45 18 -55 44 -17 35 41 24 -29 -20 -25 8 -27 -18 -28 -8 -17 2 -11 -7
MG 36 61 48 -50 27 -32 62 53 28 -41 -33 -36 11 -35 -28 -30 -8 -18 -8 -11 -12
MJ 38 77 88 -23 -61 -49 14 6 14 -19 -35 -28 -25 -20 -35 1 40 -8 -31 20 -2
AVG 26 31 -36 13 -23 19 20 26 -22 -16 -17 6 -13 -13 -4 4 -14 -11 -8 -9
RMS 45 39 38 35 31 30 28 27 25 24 23 21 21 18 18 16 15 15 15 11
How Representative are the KnownStructures of the Proteins in
Complete Genome?
Name SolublePDB
= all-β + all-α
A 8.40% 6.8% 9.2%C 1.72% 1.6% 1.4%D 5.91% 5.9% 5.8%E 6.29% 5.2% 7.3%F 3.94% 4.2% 4.2%G 7.79% 8.4% 6.4%H 2.19% 2.1% 2.2%I 5.54% 5.4% 5.1%K 6.02% 5.6% 6.5%L 8.37% 7.3% 9.6%M 2.15% 1.7% 2.4%N 4.57% 5.3% 4.4%P 4.70% 5.1% 4.4%Q 3.73% 3.5% 4.2%R 4.78% 4.2% 5.4%S 5.97% 7.2% 5.7%T 5.87% 7.2% 5.2%V 6.96% 7.6% 5.7%W 1.46% 1.7% 1.5%Y 3.64% 3.8% 3.5%

85(c
)M
ark
Ger
stei
n,1
999,
Yal
e,b
ioin
fo.m
bb
.yal
e.ed
u
Compositionof DifferentRegions ofGenomes
• Are compositiondifferencesuniform?
• Resampling• Non-globular
regions differ mostin occurrence andcomposition
• Remove RepetitiveRegions (SEG)
a
b
a
b
c
3
a
b
5
4
2
1
AVG SD EC HI HP MG MJ MP SC SS
Statistics for Amino Acids
Total Number 775998 1358465 505279 500616 170400 497968 237905 2900670 1033450
Fraction Masked by...
PDB Match 8.7% 3.7% 11.1% 13.7% 8.8% 12.9% 7.1% 9.7% 6.2% 9.0%
Non-globular Region 21.7% 6.9% 16.7% 13.9% 22.2% 28.2% 35.1% 24.7% 23.9% 20.5%
TM-helix 4.9% 1.4% 7.3% 6.1% 4.8% 3.8% 2.9% 4.5% 5.2% 5.9%
Linker Region 5.1% 0.4% 5.3% 4.8% 4.8% 5.0% 5.0% 5.2% 4.6% 5.1%
Fraction Remaining
Uncharacterized 59.7% 8.9% 59.6% 61.5% 59.4% 50.2% 49.9% 55.8% 60.0% 59.6%
AVG SD EC HI HP MG MJ MP SC SS
Overall 23% 10% 16% 17% 27% 36% 38% 28% 21% 20%
PDB Match 18% 9% 12% 14% 24% 27% 34% 20% 12% 15%
Non Globular Region 36% 13% 32% 33% 39% 50% 52% 40% 42% 35%
TM-helix 49% 15% 55% 53% 55% 57% 55% 56% 56% 51%
Linker Region 27% 10% 22% 24% 29% 39% 33% 35% 21% 25%
Uncharacterized Region 23% 6% 15% 17% 26% 34% 32% 27% 20% 19%
Structurally Uncharacterized (186)
1 4 3 3 2 5 6 1 4 2 4
1 PDB Match (152) 3 TM helix (30) 5 Coiled-Coil
2 Low Complexity Region (116) 4 Linker Region (5) 6 All-alpha or All-beta Region

86(c
)M
ark
Ger
stei
n,1
999,
Yal
e,b
ioin
fo.m
bb
.yal
e.ed
u
Name Hydroph.
Polar
Soluble
PDB
biophys.
proteins
Rel.
Diff.
PS BP BP/PS -1
P H 4.7% 3.7% -21%
F H 4.0% 3.2% -19%
M H 2.1% 1.8% -16%
D P 6.0% 5.1% -16%
V H 7.0% 6.2% -12%
C H 1.7% 1.5% -9%
S P 6.0% 5.7% -5%
G . 7.8% 7.7% -1%
I H 5.6% 5.5% -1%
N P 4.6% 4.6% 0%
W H 1.4% 1.5% 1%
T P 5.8% 6.0% 2%
L H 8.4% 8.7% 5%
A . 8.4% 8.8% 6%
Y . 3.7% 3.9% 6%
H P 2.2% 2.4% 6%
Q P 3.7% 4.0% 6%
R P 4.8% 5.2% 9%
E P 6.2% 7.0% 13%
K P 5.9% 7.7% 30%
PDB Select length class name
1sty - 137 β Staph nuclease
1cgp a:9-137 129 β CAP
1bgh - 85 β Gene V protein
1pht - 83 β SH3 domain
1tpf a: 250 α/β TIM
1wsy a: 248 α/β Trp Synthase
8dfr - 186 α/β DHFR
2rn2 - 155 α/β Ribonuclease H
1brs d: 87 α/β Barstar
1gbs - 185 α+β Hen Lyzozyme
119l - 162 α+β T4 lysozyme
193l - 129 α+β alpha-Lactabumin
7rsa - 124 α+β RNAse A
1brn l: 108 α+β Barnase
1fkd - 107 α+β FK506
9rnt - 104 α+β RNAse T1
1sha a: 103 α+β SH2 domain
1ubi - 76 α+β Ubiquitin
1cse i: 63 α+β CI-2 inhibitor
1igd - 61 α+β B1 domain
1mbd - 153 α Globin
1hrc - 105 α Cytochrome c
2wrp r: 104 α Trp Repressor
1lli a: 89 α Cro Repressor
1cop d: 66 α Lambda Repressor
1rpo - 61 α ROP
1myk a: 47 α Arc Repressor
2zta a: 31 α GCN4 zipper
1btl - 263 Μ beta-Lactamase
1bpi - 58 S BPTI
AVG 116
BiophysicalProteins
Proteins thatinform our viewof the foldingprocess -- ascompared tothe PDB.
Shorter(116 v 161)
Fewerhydrophobes

87(c
)M
ark
Ger
stei
n,1
999,
Yal
e,b
ioin
fo.m
bb
.yal
e.ed
u
Adding Structure toFunctional Genomics,Function to Structural
Genomics
Function
Folds v.Genomes
?
%ID v.RMS
Purely Seq.Based
Analysis --e.g. EcoCyc,
ENZYME,GenProtEC,COGs, MIPS
%ID
RM
SD
?
Why Structure?Do we really need it?
1 MostHighlyConserved
2 PreciselyDefinedModules
3 Seq. ⇔Struc.Clearerthan Seq.⇔Func.
4 Link toChemistry,Drugs
1 2 3 4 5 6 7 8 9 10 11 12 13 14 15 16 17 18 19 20 …
Drug

88(c
)M
ark
Ger
stei
n,1
999,
Yal
e,b
ioin
fo.m
bb
.yal
e.ed
u
Fold-FunctionCombinations
• Two Different FoldsCatalyze the SameReaction -- e.g.Carbonic Anhydrases(4.2.1.1)
Many Functions onthe Same Fold-- e.g. the TIM-barrel

89 (c) Mark Gerstein, 1999, Yale, bioinfo.mbb.yale.edu
91 Enzymatic Functions+ Non-Enzyme
229F
olds
Fold-F
unctionC
ombinations
~20K
(=92x229)
Possible,
331O
bserved

90(c
)M
ark
Ger
stei
n,1
999,
Yal
e,b
ioin
fo.m
bb
.yal
e.ed
u
The MostVersatile Folds,
Versatile Functions16 9 6 6 6 5 4 4 4 3 3 3 3 3 3 3
1byb
2ace
1xel
1gky
1fxd
1ph
c
3ch
y
1am
a
1bd
o
1jb
c
1sn
c
1lxa
3pte
1im
f
1fh
a
1rie
3.00
1
3.04
8
3.01
8
3.02
4
4.03
1
1.06
3
3.01
3
3.04
5
2.05
5
2.01
8
2.02
4
2.05
3
5.00
3
5.00
7
1.02
1
7.03
5
0.0.0 22 5 40 666 374 168 11 464 105 1 1 7 102
1.1.1 106 2661.1.3 4 11.10.2 51.11.1 41.14.13 3 61.14.14 21 501.14.15 21.14.99 71.17.4 361.18.6 421.3.1 15 82 31.3.99 101.6.5 21.6.99 8 2 41.9.3 62.1.3 6 12.3.1 6 82.6.1 1282.7.1 102.7.4 291 1562.7.7 13.1.1 122 12 13.1.2 33.1.3 773.1.31 43.1.4 43.2.1 170 1213.2.3 33.4.11 23.4.16 4 13.5.2 1423.5.4 53.6.1 14 403.7.1 23.8.1 34.1.1 28 14.1.2 584.1.3 4 14.1.99 74.2.1 48 15 15.1.3 255.3.1 3825.3.3 15.4.3 15.4.99 16.3.2 56.3.3 96.3.4 176.4.1. 6
LY
ISO
LIG
NONENZ
OX
TRAN
HYD
1en
hd
1mm
og
_1f
ha
d2g
sta1
d1o
cch
_1l
lp2a
bk
1gai
1ph
c1v
nc
d1o
cce_
1fp
s1p
oc
1aac
1jb
c1n
yf1s
nc
1arb
2en
g2s
il1h
cbd
1cau
a_1b
do
1du
d1b
yb1t
ml
d1r
vva_
1ud
h3c
hy
1xel
d1n
baa
_1g
ky1p
hr
2hn
q1s
rx1p
do
3pg
m1o
pr
1cd
e1a
ma
d1g
pm
a21u
lb2a
ced
1mas
a_d
1alk
a_1x
aad
1ttq
b_
3pg
k1a
gx
3pfk
1ayl
1fu
s2b
aad
2kau
a_d
1mka
a_1f
xdd
3ru
bs_
d1d
coa_
1ib
a1m
ut
1lb
a1h
qi
d1p
ya.1
d1f
jma_
1mrj
1dtp
1hcl
2cae
1tp
t1i
mf
1rp
l1h
ip
1.00
41.
019
1.02
11.
034
1.03
71.
053
1.05
41.
061
1.06
31.
068
1.07
01.
077
1.08
02.
005
2.01
82.
020
2.02
42.
029
2.03
32.
043
2.04
72.
053
2.05
52.
056
3.00
13.
002
3.00
93.
011
3.01
33.
018
3.02
13.
024
3.02
83.
029
3.03
03.
037
3.04
03.
041
3.04
33.
045
3.04
63.
047
3.04
83.
049
3.05
43.
055
3.05
73.
061
3.06
43.
065
3.06
64.
001
4.00
24.
005
4.02
04.
031
4.03
54.
036
4.04
94.
058
4.06
04.
073
4.08
24.
084
4.08
64.
087
5.00
15.
004
5.00
55.
007
5.00
97.
029
150 0.0.0 # # # # # # # # # 8 6 1 # # # # # # 1 5 1 # 4 # 7 #
7 3.2.1 4 # 1 # # 3 #7 4.2.1 # 1 # # # 2 26 3.1.3 9 7 5 4 # #6 3.5.1 # 1 1 # # 25 1.11.1 # 1 # 4 #5 1.9.3 3 5 #5 2.7.1 # 3 # 1 #5 3.6.1 # # # 35 4.1.1 # 1 8 # 14 1.14.13 2 6 3 24 2.4.2 # # 4 74 2.5.1 # 3 #4 3.1.1 # 1 # #4 3.2.2 1 # 1 #3 1.1.1 # #3 1.3.1 # # 33 1.6.99 8 4 2
SMBA A+B MULTIA/B
Top-4 Functions:Glycosidases, carboxy-lyases, phosphoricmonoester hydrolases,linear monoesterhydrolases (3.2.1, 4.2.13.1.3, 3.5.1)
Top-5 Folds:TIM-barrel (16),alpha-beta hydrolase fold (9),Rossmann fold (6), P-loopNTP hydrolase fold (6),Ferrodoxin fold (6)
Top Multifunctional Folds →→→→
To
pM
ultifo
ldF
un
ction
s→→ →→

91(c
)M
ark
Ger
stei
n,1
999,
Yal
e,b
ioin
fo.m
bb
.yal
e.ed
u
Fold-FunctionCombinations
Cross-TabulationSummaryDiagram
A B A/B A+B MULTI SML sumNONENZ 34 30 14 28 4 26 136OX 13 5 17 3 4 5 47TRAN 3 3 16 8 5 35HYD 4 11 30 18 4 67LY 2 3 13 5 23ISO 1 2 7 4 2 16LIG 1 2 3 1 7sum 57 55 99 69 20 31 331
3
A B A/B A+B
MU
LT
I
SM
L
NONENZ 7.1 5.7 7.1 9.2 2.8 0.7
OX 3.5 2.1 9.2 2.1 0.7 0.7
TRAN 0.7 10.6 1.4 1.4 0.7
HYD 2.8 2.8 6.4 5.7 1.4
LY 2.1 4.3
ISO 0.7 1.4 2.8 0.7
LIG 1.4 1.4
SCOP
EN
ZY
ME
[ Similar analysis in Martin et al. (1998), Structure 6: 875 ]

92(c
)M
ark
Ger
stei
n,1
999,
Yal
e,b
ioin
fo.m
bb
.yal
e.ed
u
A B
A/B
A+B
MU
LTI
SM
L
0
5
10
15
20
25
30
Both
ENZ
nonENZ
A B
A/B
A+
B
MU
LTI
SM
L
02468
10
12
14
Both
ENZ
nonENZYeast
A B
A/B
A+
B
MU
LTI
SM
L
05
101520253035
Both
ENZ
nonENZ
A B
A/B
A+
B
MU
LTI
SM
L
012345678
Both
EC
nonEC
E. coli
A B ABNONENZ 10 9.0 15
OX 5.1 5.1 10
TRAN 1.3 13
HYD 2.6 1.3 14
LY 2.6 1.3
ISO 1.3 1.3 5.1
LIG 1.3
CATH
EN
ZY
ME
A B A/B A+B
MU
LT
I
SM
L
metabolism 1 3.5 2.3 10 4.5 1.3 0.8
energy 2 1.1 1.2 5 1.5 0.3 0.2
growth, div.,DNA syn. 3 4.9 3.6 4 4.5 1.8 1.2
transcription 4 1.5 1.3 2.2 1.5 0.5 0.8
proteinsynthesis 5 1 0.9 0.7 1.3 0.3 0.2
proteintargetting 6 1.2 1.7 2 1.6 0.5 0.3
transportfacilitation 7 0.9 0.5 0.7 0.6 0.4
intracellulartransport 8 1.8 2.1 1.6 0.6 1
cellularbiogenesis 9 0.9 0.7 1.2 0.3 0.3 0.1
signaltransduction 10 1 1 1.1 0.3 0.7 0.3
cell rescue,defense… 11 1.5 1 2.6 1.9 0.7 0.5
ionichomeostatis 13 0.5 0.3 0.4 0.4 0.2
MIP
SF
un
ctio
nal
Cat
.
SCOP
A B A/B A+B
MU
LT
I
SM
L
NONENZ 7.1 5.7 7.1 9.2 2.8 0.7
OX 3.5 2.1 9.2 2.1 0.7 0.7
TRAN 0.7 10.6 1.4 1.4 0.7
HYD 2.8 2.8 6.4 5.7 1.4
LY 2.1 4.3
ISO 0.7 1.4 2.8 0.7
LIG 1.4 1.4
SCOP
EN
ZY
ME
Compare Classifications and Genomes
wormSwissProt
Compare 1 Structure-Function Cross-Tab forDifferent Genomes andDifferent Functional &
Structural Classificationsfor the Yeast Genome
CATH (Thornton)
MIPS YFC (Mewes)

93(c
)M
ark
Ger
stei
n,1
999,
Yal
e,b
ioin
fo.m
bb
.yal
e.ed
u
COGs vs SCOP: Different StructureFunction Relationships for Most
Conserved Proteins
A B A/B A+B
MU
LT
I
SM
L
C 2.2 2.6 4.8 3 0.4
E 2.2 1.1 7.4 2.6 0.7
F 1.1 3.7 1.8
G 0.4 0.4 3.3 0.7
H 1.1 0.7 4.8 3
I 0.7 0.7 2.2 0.4 0.4
J 2.2 1.8 3 3 0.4 0.4
K 1.1 0.4
L 1.1 1.5 1.1 1.1
M 0.4 0.4 0.7
N 1.8 0.7 0.4 0.7 0.4
O 1.5 1.1 3 2.2 0.4 0.4
P 0.4 1.1 0.7 0.4
SCOP
Met
abo
lism
Info
rmat
ion
Sto
rag
e&
Pro
cess
ing
Cel
lula
rP
roce
sses
All
Yea
stC
OG
s
A B A/B A+B
MU
LT
I
SM
L
C 7.2 2.9
E 1.4 1.4 1.4
F 2.9
G 4.3 1.4
H 1.4 2.9 1.4
I
J 8.7 7.2 7.2 10 1.4 1.4
K
L 1.4
M
N 1.4 1.4
O 2.9 7.2 2.9
P 1.4 2.9 1.4
SCOP
Met
abo
lism
Info
rmat
ion
Sto
rag
e&
Pro
cess
ing
Cel
lula
rP
roce
sses
Mo
stC
on
serv
edC
OG
s
(Scop, Murzin, Ailey, Brenner, Hubbard, Chothia; COGs, Tatusov, Koonin, Lipman)

94(c
)M
ark
Ger
stei
n,1
999,
Yal
e,b
ioin
fo.m
bb
.yal
e.ed
u
Gene ExpressionDatasets: theTranscriptome
Yeast Expression Data in Academia:levels for all 6000 genes!
X-ref. with other genome data: protein foldfeatures common in Transcriptome....
Also: SAGE;Samson andChurch, Chips;Aebersold,ProteinExpression
Young/Lander, Chips,Abs. Exp.
Brown, µµµµarray,Rel. Exp. overTimecourse
Snyder,Transposons,Protein Exp.

95(c
)M
ark
Ger
stei
n,1
999,
Yal
e,b
ioin
fo.m
bb
.yal
e.ed
u
-30%
-20%
-10%
0%
10%
20%
30%
40%
50%
N S C L F I D H Q Y P M W E T K R V G A
Amino Acid
Tra
nsc
rip
tom
eE
nri
chm
ent
SamsonSAGE-SSAGE-LSAGE-G/MChurch-heatChurch-galChurch-alphaChurch-aYoung
GenomeComposition
TranscriptomeComposition
Composition of Genome vs. Transcriptome
VGA ↑NS ↓

96(c
)M
ark
Ger
stei
n,1
999,
Yal
e,b
ioin
fo.m
bb
.yal
e.ed
u
Which Protein Folds are Highly Expressed?
Top-10folds ingenomeand tran-scriptome
Fold Fol
dC
lass
Rep
.PD
B
Gen
ome
[%]
Tra
nscr
ipto
me
[%]
Rel
.Diff
.[%
]
Gen
ome
You
ng
Sam
son
Chu
rch-
a
Chu
rch-
alph
a
Chu
rch-
gal
Chu
rch-
heat
SA
GE
-GM
SA
GE
-L
SA
GE
-S
TIM barrel α/ β 1byb 4.2 8.3 +98 5 1 1 1 1 1 1 1 1 1P-loop NTP hydrolases α/ β 1gky 5.8 5.2 -11 3 2 2 4 4 4 5 5 6 7
Ferredoxin like α+β 1fxd 3.9 3.4 -14 6 3 7 11 9 8 10 4 10 11
Rossmann fold α/ β 1xel 3.3 3.3 0 8 4 3 3 3 2 2 19 15 9
7-bladed beta-propeller β 1mda* 6.4 2.9 -55 2 5 4 5 6 6 7 9 9 16
aplha-alpha superhelix α 2bct 4.4 2.7 -37 4 6 11 15 16 12 12 8 5 8
Thioredoxin fold α/ β 2trx 1.7 2.7 +63 14 7 6 8 2 5 4 11 10 6G3P dehydrogenase-like α+β 1drw† 0.2 2.7 +1316 81 8 12 2 5 3 3 35 19 30
beta grasp α+β 1igd 0.6 2.6 +348 36 9 10 21 9 18 21 82 122 120
HSP70 C-term. fragment multi 1dky 0.8 2.6 +231 31 10 16 17 11 16 12 48 25 56
long helices oligomers α 1zta 3.8 2.1 -46 7 15 8 14 21 15 19 21 20 33
Protein kinases (cat. core) multi 1hcl 6.8 1.6 -77 1 18 19 9 16 11 15 13 16 17
alpha/beta hydrolases α/ β 2ace 2.2 0.9 -62 10 32 31 25 26 21 23 26 26 26
Zn2/C6 DNA-bind. dom. sml 1aw6 2.6 0.3 -89 9 75 94 27 50 32 40 48 39 50
Composition Rank

97(c
)M
ark
Ger
stei
n,1
999,
Yal
e,b
ioin
fo.m
bb
.yal
e.ed
u
Broad Categories Const. inTranscriptome over Timecourse,
Not Specific Genes (or Folds)
-30%
-20%
-10%
0%
10%
20%
30%
40%
50%
N S C L F I D H Q Y P M W E T K R V G A
Amino Acid
Tra
nsc
rip
tom
eE
nri
chm
ent
YoungBrown Timepoint 1Brown Timepoint 7
-30%
-20%
-10%
0%
10%
20%
30%
40%
50%
N S C L F I D H Q Y P M W E T K R V G A
Amino Acid
Tra
nsc
rip
tom
eE
nri
chm
ent
SamsonSAGE-SSAGE-LSAGE-G/MChurch-heatChurch-galChurch-alphaChurch-aYoung
Fold class composition weighted bytranscript frequency
0
5
10
15
20
25
30
35
40
A ll a lp h
A l l b e tA lp ha / b e
A lp ha + b eM ultid
om aSm all p ro te i
Co
mp
osi
tio
n(%
)
First timepoint
Last timepoint
Common Yeast Folds (scop) Rep.Structure
GenomeDuplication
Expression(aerobic)
Expression(anaerobic)
Protein kinases (cat. core) 1hcl 1 3 4
NTP Hydrolases with P-loop 1gky 2 1 2
Classic Zn finger 1ard 3 9 5
Ribonuclease H-like motif 2rn2 4 2 1
Rossmann Fold 1xel 5 4 3
Zn2/Cys6 DNA-binding dom. 125d 6 6 7
7-bladed beta-propeller 2bbk-H 7 8 16
TIM-barrel 1byb 8 5 6
like Ferrodoxin 1fxd 9 7 10
DNA-binding 3-helix bundle 1enh 10 30 36
… …
GroES-like 1lep-A 17 10 9
… …
like HSP70, Ct-dom. 1dkz-A 22 11 8
Brown cDNA microarray expts. not as useful for X-ref.at individual timepts
Nevertheless, they show same aa composition andfold class usage at different timepts. However, top foldchanges and also specific TM proteins....

98(c
)M
ark
Ger
stei
n,1
999,
Yal
e,b
ioin
fo.m
bb
.yal
e.ed
u
Different Classes ofMembrane Proteins
Have DifferentChanges in Expression
Level (esp. 12 TMs)Differential expression of
transmembrane proteins (12 segments)
0
0.5
1
1.5
2
2.5
1 2 3 4 5 6 7
Time
Exp
ress
ion
leve
l
Transmembrane (12 segments)
All open reading frames
Most Expressed TMsin anaerobic conditionsORF TMsYPR149W 4YDR343C 9YDR342C 9YKL217W 7YHR096C 9YBR116C 2YIL088C 6YBR012W-B 2YBR054W 7YBR218C 2
Most Expressed TMsin aerobic conditionsORF TMsYHR078W 4YGL008C 6YBR012W-B 2YLR340W 2YPL131W 2YHR099W 2YMR205C 2YHR216W 2YLR432W 2YIL075C 5
Hexose permease expression
0
0.5
1
1.5
2
2.5
3
3.5
1 2 3 4 5 6 7
Time
Exp
ress
ion
leve
l
Transmembrane (12 segments)
Hexose permeases
Expression of lactate transporter
0
2
4
6
8
10
12
14
16
1 2 3 4 5 6 7
Time
Exp
ress
ion
leve
l
Transmembrane (12 segments)
Lactate transporter
Column gives the expression in aerobic conditions (high sugar, second time-series data point inDeRisi et al.), and other column, in anaerobic conditions (low sugar, high ethanol, last time-series datapoint in DeRisi et al.). 9 hexose permeases, 1 lactate transporter.

99(c
)M
ark
Ger
stei
n,1
999,
Yal
e,b
ioin
fo.m
bb
.yal
e.ed
u
Functional category number Function Average correlation # ORFs01 METABOLISM 0.1001 100501.01 amino-acid metabolism 0.1488 19901.01.01 amino-acid biosynthesis 0.239 11401.01.04 regulation of amino-acid metabolism 0.23 3201.01.07 amino-acid transport 0.1198 2301.01.10 amino-acid degradation 0.0524 3601.01.99 other amino-acid metabolism activities 0.2205 401.02 nitrogen and sulphur metabolism 0.1869 7301.02.01 nitrogen and sulphur utilization 0.0726 3701.02.04 regulation of nitrogen and sulphur utilization 0.3715 2801.02.07 nitrogen and sulphur transport 0.2829 801.03 nucleotide metabolism 0.1708 13401.03.01 purine-ribonucleotide metabolism 0.3639 4201.03.04 pyrimidine-ribonucleotide metabolism 0.176 2801.03.07 deoxyribonucleotide metabolism 0.1095 1201.03.10 metabolism of cyclic and unusual nucleotides 0.2848 801.03.13 regulation of nucleotide metabolism 0.2696 1301.03.16 polynucleotide degradation 0.2461 2001.03.19 nucleotide transport 0.1187 1201.03.99 other nucleotide-metabolism activities -0.0328 701.04 phosphate metabolism 0.1348 3101.04.01 phosphate utilization 0.1612 1301.04.04 regulation of phosphate utilization 0.0599 801.04.07 phosphate transport 0.0724 1001.05 carbohydrate metabolism 0.0779 40901.05.01 carbohydrate utilization 0.075 25601.05.04 regulation of carbohydrate utilization 0.1174 120
Functional category number Function Average correlation # ORFs01 METABOLISM 0.1001 100501.01 amino-acid metabolism 0.1488 19901.01.01 amino-acid biosynthesis 0.239 11401.01.04 regulation of amino-acid metabolism 0.23 32
Correlate withExpression Levelwith Functional
Category
MIPS YFC: 66 bottom classes, 10 top classesAverage correlation of uncharacterized genes is 0.16Similar to Botstein analysis.

100
(c)
Mar
kG
erst
ein
,199
9,Y
ale,
bio
info
.mb
b.y
ale.
edu
Results from Analysisof Correlation of
Functional Class andExpression
Correlation for small and large groupsof genes
-5
0
5
10
15
20
25
30
35
0.00 0.20 0.40 0.60 0.80 1.00
Average correlation
#M
IPS
gro
up
s(%
)
Groups with more than 30 genes
Groups with 6-30 genes
• Many groups ofgenes categorizedby MIPS do nothave highercorrelation thanrandom ORFs
• Smaller groupstend to have aslightly highercorrelation
Functional category numberFunction Average correlation # ORFs10.04.11 key kinases 0.9403 210.04.13 key phosphatases 0.9283 211.11 ageing 0.8634 202.22 glyoxylate cycle 0.8136 610.02.07 G-proteins 0.8122 304.03.99 other tRNA-transcription activities 0.6932 409.08 biogenesis of Golgi 0.6647 209.19 peroxisomal biogenesis 0.6512 208.10 peroxisomal transport 0.646 1204.01.04 rRNA processing 0.6074 5301.20 secondary metabolism 0.5921 401.20.05 amines metabolism 0.5921 410.05.11 key kinases 0.5549 490 RETROTRANSPOSONS AND PLASMID PROTEINS 0.5299 702.10 tricarboxylic-acid pathway 0.5236 2204.07 RNA transport 0.5111 27
Highest Correlations

101
(c)
Mar
kG
erst
ein
,199
9,Y
ale,
bio
info
.mb
b.y
ale.
edu
Whole GenomePhenotype Profiles
YPD + 8mM caffeine CaffCycloheximide hypersensitivity: YPD + 0.08 ? g/mlcycloheximide at 30°C CycS
White/ red color on YPD W/RYPGlycerol YPGCalcofluor hypersensitivity: YPD + 12 ? g/ml calcofluor at30°C CalcS
YPD + 46 ? g/ml hygromycin at 30°C HygYPD + 0.003% SDS SDSBenomyl hypersensitivity: YPD + 10 ? g/ml benomyl BenS
YPD + 5-bromo-4-chloro-3-indolyl phosphate 37°C BCIPYPD + 0.001% methylene blue at 30°C MBBenomyl resistance: YPD + 20 ? g/ml benomyl BenR
YPD at 37°C YPD37
YPD + 2 mM EGTA EGTAYPD + 0.008% MMS MMSYPD + 75 mM hydroxyurea HUYPD at 11°C (COLD) YPD11
Calcofluor resistance: YPD + 66.7 ? g/ml calcofluor at30°C CalcR
Cycloheximide resistance: YPD + 0.3 ? g/mlcycloheximide CycR
Hyperhaploid invasive growth mutants HHIGYPD + 0.9 M NaCl NaCl
YE
R021w
YA
L009c
YM
R009c
YC
L029cY
BR
01w
Affectedby ColdWT
Affectedby AnotherCondition
YB
R102c
Transposon insertions into (almost)each yeast gene to see how yeast isaffected in 20 conditions. Generates aphenotype pattern vector, which canbe treated similarly to expressiondata
YPD + 8mM caffeine CaffCycloheximide hypersensitivity: YPD + 0.08 ? g/mlcycloheximide at 30°C CycS
White/ red color on YPD W/RYPGlycerol YPGCalcofluor hypersensitivity: YPD + 12 ? g/ml calcofluor at30°C CalcS
YPD + 46 ? g/ml hygromycin at 30°C HygYPD + 0.003% SDS SDSBenomyl hypersensitivity: YPD + 10 ? g/ml benomyl BenS
YPD + 5-bromo-4-chloro-3-indolyl phosphate 37°C BCIPYPD + 0.001% methylene blue at 30°C MBBenomyl resistance: YPD + 20 ? g/ml benomyl BenR
YPD at 37°C YPD37
YPD + 2 mM EGTA EGTAYPD + 0.008% MMS MMSYPD + 75 mM hydroxyurea HUYPD at 11°C (COLD) YPD11
Calcofluor resistance: YPD + 66.7 ? g/ml calcofluor at30°C CalcR
Cycloheximide resistance: YPD + 0.3 ? g/mlcycloheximide CycR
Hyperhaploid invasive growth mutants HHIGYPD + 0.9 M NaCl NaCl
<--Conditions-->
Clustering Conditions
M Snyder

102
(c)
Mar
kG
erst
ein
,199
9,Y
ale,
bio
info
.mb
b.y
ale.
edu
k-meansclusteringof ORFsbased on“phenotypepatterns,”cross-ref.to MIPsFunctionalClasses
20 Conditions20 Conditions
Metabolism
Cold
28O
RF
sin
clu
ster
28O
RF
sin
clu
ster
Phenotype ORF Clustering
Cluster showing coldphenotype(containing genesmost necessary incold) is enriched inmetabolic functions