bioinformatics@ ipk · pdf fileaba fatty acid catabolism peroxisome mrna related processes...
TRANSCRIPT

Biodiversity Informatics - Systems Analysis and Modelling
Bioinformatics @ IPK Gatersleben

Slide # 2Biodiversity Informatics - Systems Analysis and Modelling
Applied Bioinformatics Research @ IPK
Systems Analysis and Modelling (coordination: N.N.)
Biodiverstity Informatics(coordination: Uwe Scholz)
28 research groups in total at IPK (as of October, 2017)
Prof. Dr. Thomas Altmann (temporary)
Slide # 3Biodiversity Informatics - Systems Analysis and Modelling
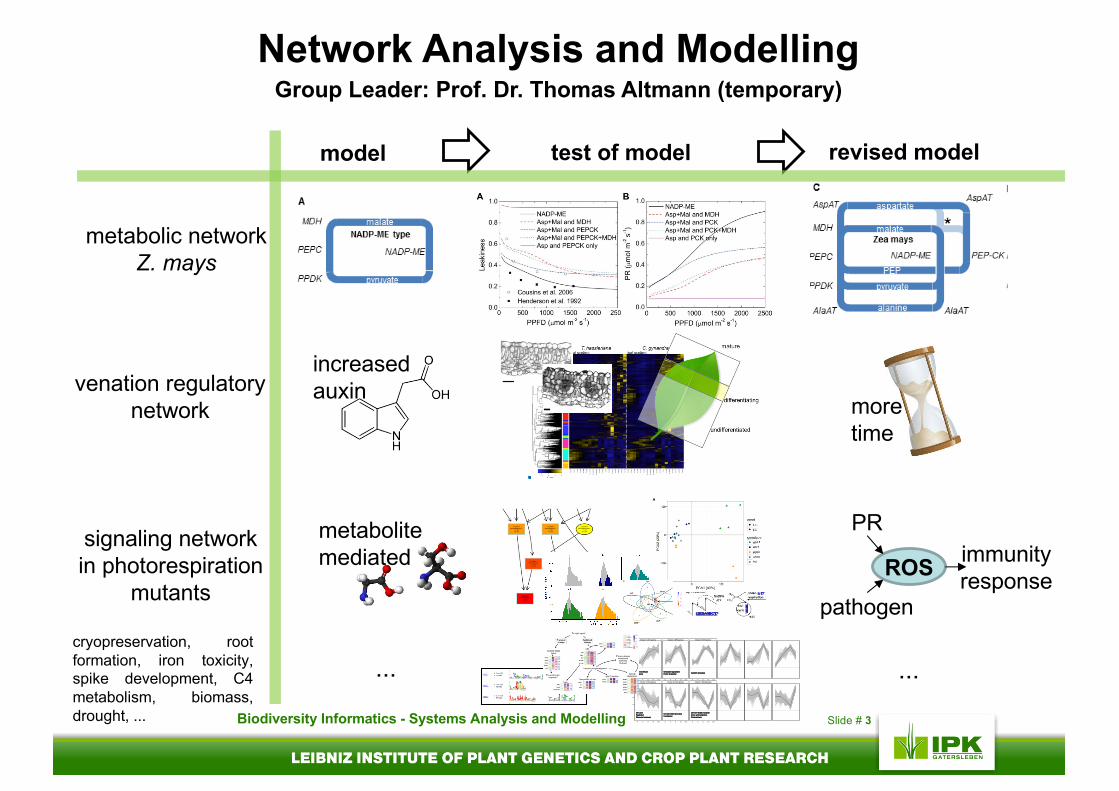
Network Analysis and ModellingGroup Leader: Prof. Dr. Thomas Altmann (temporary)
model test of model revised model
metabolic networkZ. mays
increasedauxin more
time
venation regulatory network
signaling network in photorespiration
mutants
metabolite mediated ROS
PR
pathogen
immunityresponse
cryopreservation, rootformation, iron toxicity,spike development, C4metabolism, biomass,drought, ...
... ...External stimulusResponseExternal stimulusResponseExternal stimulusResponseExternal stimulusResponseExternal stimulusResponse
Chloroplast oganizationProtein localizationChloroplast oganizationProtein localizationChloroplast oganizationProtein localizationChloroplast oganizationProtein localizationChloroplast oganizationProtein localization Catabolic processesCatabolic processesCatabolic processesCatabolic processesCatabolic processes Response
EthyleneResponseEthyleneResponseEthyleneResponseEthyleneResponseEthylene
ABAFatty acid catabolismPeroxisome
ABAFatty acid catabolismPeroxisome
ABAFatty acid catabolismPeroxisome
ABAFatty acid catabolismPeroxisome
ABAFatty acid catabolismPeroxisome
mRNA related processesDevelopmentProtein modification
mRNA related processesDevelopmentProtein modification
mRNA related processesDevelopmentProtein modification
mRNA related processesDevelopmentProtein modification
mRNA related processesDevelopmentProtein modification
Cell cycleReplicationRibosome biogenesis
Cell cycleReplicationRibosome biogenesis
Cell cycleReplicationRibosome biogenesis
Cell cycleReplicationRibosome biogenesis
Cell cycleReplicationRibosome biogenesis
Cell wall related processesCytoskeletonCell wall related processesCytoskeletonCell wall related processesCytoskeletonCell wall related processesCytoskeletonCell wall related processesCytoskeleton
Cell wall related processesAmino acid metabolismPhotosynthesis
Cell wall related processesAmino acid metabolismPhotosynthesis
Cell wall related processesAmino acid metabolismPhotosynthesis
Cell wall related processesAmino acid metabolismPhotosynthesis
Cell wall related processesAmino acid metabolismPhotosynthesis
Endomembrane systemProtein localizationin secretory pathway
Endomembrane systemProtein localizationin secretory pathway
Endomembrane systemProtein localizationin secretory pathway
Endomembrane systemProtein localizationin secretory pathway
Endomembrane systemProtein localizationin secretory pathway
ATP metabolic processesATP metabolic processesATP metabolic processesATP metabolic processesATP metabolic processes PhosphorylationTransportPhosphorylationTransportPhosphorylationTransportPhosphorylationTransportPhosphorylationTransport
Cluster 1 (375 genes) Cluster 2 (696 genes) Cluster 3 (979 genes) Cluster 4 (155 genes) Cluster 5 (448 genes) Cluster 6 (471 genes)
Cluster 7 (543 genes) Cluster 8 (1023 genes) Cluster 9 (1046 genes) Cluster 10 (258 genes) Cluster 11 (208 genes) Cluster 12 (598 genes)
−1
0
1
−1
0
1
0 4 9 12 re2 0 4 9 12 re2 0 4 9 12 re2 0 4 9 12 re2 0 4 9 12 re2 0 4 9 12 re2
0 4 9 12 re2 0 4 9 12 re2 0 4 9 12 re2 0 4 9 12 re2 0 4 9 12 re2 0 4 9 12 re2Days after drought
Rel
ative
exp
ress
ion
[z−s
core
]

Slide # 4Biodiversity Informatics - Systems Analysis and Modelling
Image Analysis Group Leader: Dr. Evgeny Gladilin
Analysis-Report
IAP (Integrated Analysis Platform)• Systems biology cloud storage, analysis and visualization system• Web-based GUI, command line client• Integration of data sets (LemnaTec, greenhouse climate data, …)• Statistic analysis (R-based diagrams, PDF reports)
IAP - Web-based GUI
VolumeIAP formular
areatopareaside average ..Biomass Digital 2IAP ×=
Area Ratio (dry/normal)
Image
Pipline
Research Areas• Advanced image analysis algorithms for
automated phenotyping• Software system development (IAP) • Cooperation with the biological research groups
VolumeIAP

Slide # 5Biodiversity Informatics - Systems Analysis and Modelling
Bioinformatics @ Dept. of Physiology & Cell Biology
Dr. Anja Hartmann• Modelling, analysis, simulation and visualization of biological
processes using systems biology standards • Integration and exploration of multi-omics data within the functional
context of biological networks
Multi-omics data Visualization + Exploration
MetaCrop
Tools + Methods
VANTED

Slide # 6Biodiversity Informatics - Systems Analysis and Modelling
Bioinformatics and Information TechnologyGroup Leader: Dr. Uwe Scholz
Research DataManagement:
Information Systems and Retrieval:
Sequence Analysis:

Slide # 7Biodiversity Informatics - Systems Analysis and Modelling
Genebank DocumentationGroup Leader: Dr. Helmut Knüpffer
Information systems for Plant Genetic Resources
Participation in international networks for PGR and biodiversity informatics
PGR-related data analysis
http://www.ecpgr.cgiar.org/ http://www.tdwg.org/ http://www.gbif.org/ http://www.europeana.eu
Slide # 8Biodiversity Informatics - Systems Analysis and Modelling
●●●●
●
●
●●
●●●
● ●
●
●
●●
●●
●●
●
●
●
●●
●
●
●
●
●●
●
●●●●●●
●●●●●●●
●●
●
●●●
●●●
●
●●
●
●
●●
●
●● ●
●●
●●
●
●
●
●
●●●●●
●
●
●●●
●
● ●
●●
●
●
●
●
●
●
●
●
●
●●●
●●
●●● ●
●●●●●●●
●
●●
●
●●
●●
●
●●●
●●●●●●
●
●
●
●●
●●●
●●
●
●
●●
●
●
●
●●●
●
●
●
●
●
●
●
● ●●
●
●
●
●●
●
●●●●
●
●
● ●●
●
●
●
●●
●●
●●
●
●
●
●●
●
●
●
●
●
●
●●
●
●
●
●
●●●
●●
●
●
●
●●
●
●
●
●
●
● ●
●
●
●
●
●
●
●●
●
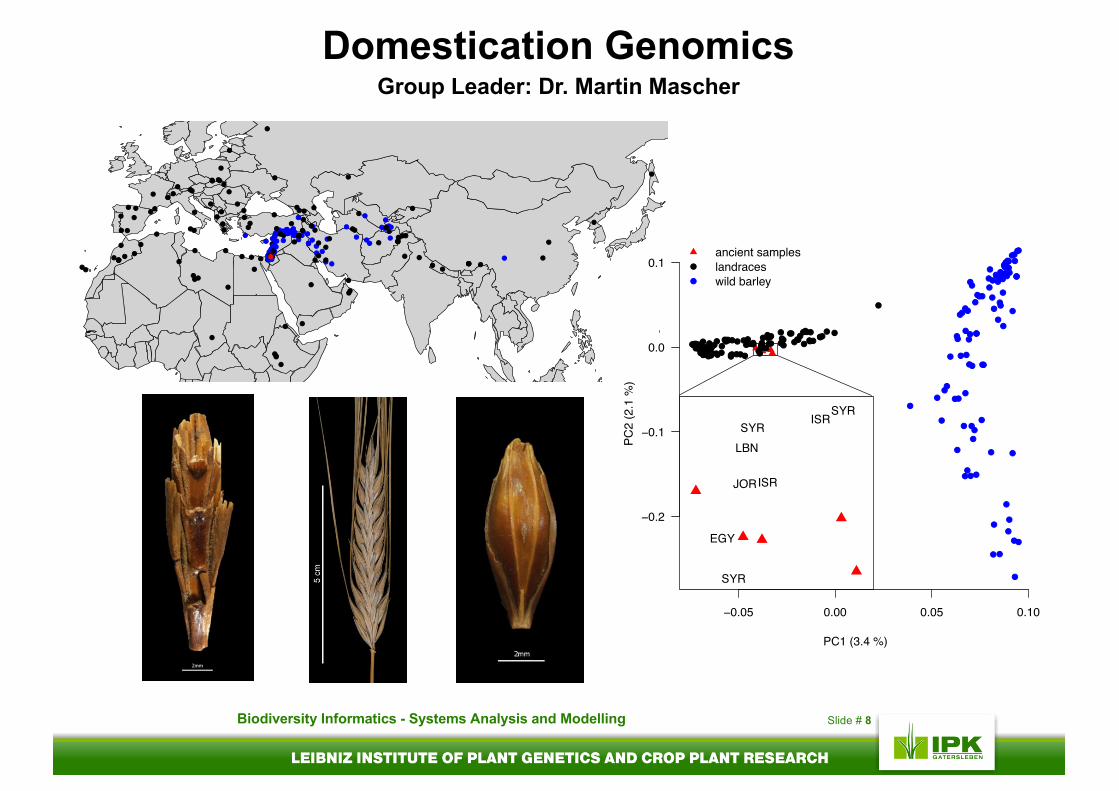
Domestication GenomicsGroup Leader: Dr. Martin Mascher
−0.05 0.00 0.05 0.10
−0.2
−0.1
0.0
0.1
●
●
●
●
●
●●
●●
●
●●●
●● ●● ● ●●●
●
● ●
●
●
●
●
●●●●
●●●●
●●●●●●
●●
●●
●● ●●●
●●
●
●
●
●●
●
●
●
●●
●●●
●
●
●
●
●
●
●
●
●
●●
●
●●●●
●
●●
●
●
●
●●●
●●
●●●
●●
●
●
●
●● ●
●
●●
●
●
●●●
●● ●
●●
●●
●●
●
●
●
●●●
● ●●
●●●
●●● ●
●
●●●●
●
●●●
●●
●●●
●● ●
●
●●
●●
●
●
●
●
●
●
●
● ●
●
●●
●
●
●
●●
●
●
●
●
●
●
●
●●●
●
●
●
●●●
●● ●●●
●
●
●●●●●
●● ●
●
●
●
●
●
●
●●
●
●
●
●
●
●●
●
●●●
●
●
●
●
ancient sampleslandraceswild barley
PC1 (3.4 %)PC
2 (2
.1 %
)
EGY
SYR
SYRSYR
ISR
JOR
LBN
ISR

Slide # 9Biodiversity Informatics - Systems Analysis and Modelling
Quantitative GeneticsGroup Leader: Prof. Dr. Jochen C. Reif
Biometric data analyses:
Genome-wide prediction:
QTL and association mapping:

Slide # 10Biodiversity Informatics - Systems Analysis and Modelling
Computational Resources (as of October, 2017)Hardware• Compute power:
11 SMP machines with total:o 912 physical coreso 9 Terabyte main memory
• Storage capacity:• Network attached storage capacity: 646 Terabyte• Storage and archive capacity: 1.1 Petabyte
• Network: 2 x 200 MBits internet connection, internal 10 GBits backbone
Software• Oracle Database • Oracle WebLogic Application Server• Various web-based information systems• Infrastructure for IPK internal use• Laboratory information management system• Data publication infrastructure• The Integrated Analysis Platform for high throughput plant image analysis

Slide # 11Biodiversity Informatics - Systems Analysis and Modelling
Bioinformatics @ IPK - Training ActivitiesRecommendation of online trainings:
• Primer in Linux - http://linuxsurvival.com/• Primer in R - http://tryr.codeschool.com/• Primer in regular expressions - http://regexone.com/
Annual BioEXCEL courses:• Excel-1: Basic excel functions in logic, string manipulation, calculation, and
advanced logic for the analysis of -omics data• Excel-2: Pivot tables for the analysis of -omics data
(Bi)-annual R courses:• R-1: Basic R functions• R-2: Statistics with R• R-3: Quantitative genetics with R
Training courses in the framework of collaborative projects as example:• User Training – Summer School:
BBB – Basic Bioinformatics training for Biologists

Slide # 12Biodiversity Informatics - Systems Analysis and Modelling
Data Management @ IPK
Support the pipeline from experiment to publication
AnalysisSamples Measurement Quantification Publication
Establishment of a data management task force• Goal: Development of a data management plan • Composition: experimentalists/bioinformaticians from all departments and
scientific data management, LIMS and bioinformatics coordination
Development of integrated infrastructure for standardized dataAssessment of Data Types
Pheno-CEPheno-FRNA-seq
Genome-seqmetabolomics
…
Storage SolutionsExperimental Descriptions
Raw DataProcessed DataInterpreted Data
Access SolutionsSearch
Restricted AccessMaterial IDs
Data Publication

Slide # 13Biodiversity Informatics - Systems Analysis and Modelling
© Anja HartmannVisualized with VANTED
Bioinformatics Publications2012 – 2017 (Jul)
© C
atrin
Kayd
amov # IPK Pubs with IF: 891
Sum IFs: 4,314.2# Pubs with BI: 190 (21%)Sum IFs with BI: 1,097.6 (25%)BI = BA+BIT+DG+DI+DOK+NAM+PBI+SYS
Slide # 14Biodiversity Informatics - Systems Analysis and Modelling
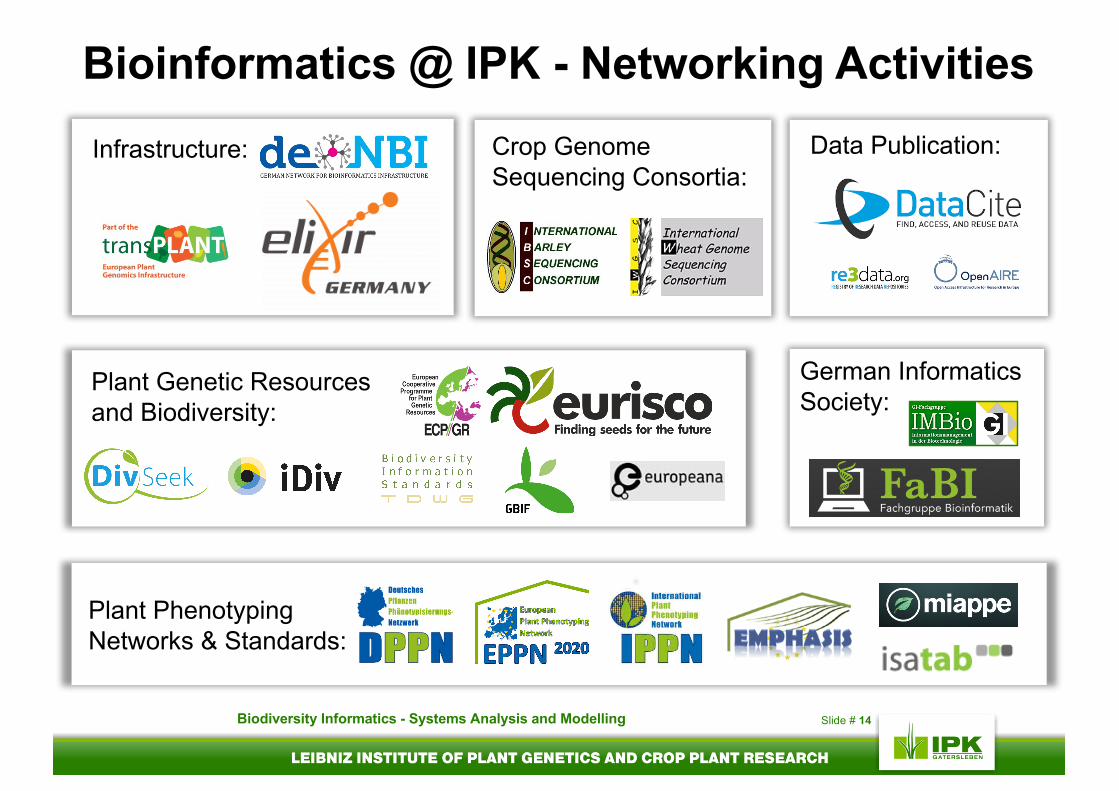
Bioinformatics @ IPK - Networking ActivitiesData Publication:Infrastructure:
Plant PhenotypingNetworks & Standards:
Plant Genetic Resourcesand Biodiversity:
German InformaticsSociety:
Crop Genome Sequencing Consortia: