biological, chemical, and physical drinking water quality
TRANSCRIPT

1
BIOLOGICAL, CHEMICAL, AND PHYSICAL DRINKING WATER
QUALITY FROM SHALLOW WELLS IN MALAWI; CASE STUDY OF BLANTYRE, CHIRADZULU, AND MULANJE DISTRICTS
M. Pritchard1, T. Mkandawire2 and J.G. O’Neill3
1Leeds Metropolitan University, School of the Built Environment, Leeds, LS2 8AJ, United Kingdom. Email: [email protected]
2University of Malawi, The Polytechnic, Department of Civil Engineering, Private Bag 303, Chichiri, Blantyre 3, MALAWI. Email: [email protected] (contact
person). 3Centre for Research in Environment and Health, 6 Abbotsway, York, YO31 9LD,
United Kingdom. Email:[email protected]
ABSTRACT
A study was conducted in Blantyre, Chiradzulu and Mulanje districts in Malawi to
determine the biological, chemical and physical drinking water quality from shallow
wells. An in-situ membrane filtration test kit (Paqualab 50) was used to determine the
microbiological quality of water and a photometer was used for the chemical analyses.
Water samples were collected from twenty one covered/protected and five
open/unprotected shallow wells at four different times in a year to determine the
change in quality with different seasons. The results of microbiological analysis show
that the drinking water quality is very poor, i.e. grossly polluted with faecal matter.
Total coliform (TC) and faecal coliform (FC) values in the wet season (February and
April) were much higher than those in the dry season (August and October). In terms
of total coliform, the results show that approximately 80% of the shallow wells tested
in the dry season and 100% of the wells in the wet season did not meet the drinking
water temporary guidelines, set by the Ministry of Water Development (MoWD), of a
maximum of 50 TC/100ml for untreated water. Approximately 50% of the wells
failed to meet the faecal coliform drinking water guideline of 50 FC/100ml in the dry
season while this figure had increased to 94% of the wells failing to meet the standard

2
in the wet season. Covered wells were not as grossly contaminated as open wells but
all of the wells tested failed the MoWD standards in at least one sample. Chemical
analyses results were within the drinking water guideline and variations during
seasons were insignificant. pH values were within the guidelines in the dry season
except for Mulanje district where on average 45% of the wells had pH values below
the lower limit of 6.0. In the wet season 50% of the samples had pH values below 6.0.
Turbidity values were within the guideline for all covered wells in the dry season,
while about 22% had turbidity values greater than the guideline of 25 NTU in the wet
season. From these results it is very clear to see that the drinking water from the
shallow wells tested, in southern districts of Malawi, is grossly contaminated
microbiologically, with this contamination becoming worse in the wet season.
Keywords: groundwater, Malawi, shallow well, water quality.
1. INTRODUCTION
Supply of potable water is important to the development of any country. Clean water
sustains a healthy population and it contributes to the quality of life of households
through the provision of basic needs of water and sanitation. It is reported that 80% of
all illness in developing countries is related to water and sanitation (Tebbutt, 1998).
Potable water supports public health and ensures economic growth. Water of poor
quality can cause social and economic damages through water-related epidemics such
as cholera which in turn increases medical treatment costs.
According to the Ministry of Health, about 80% of school going children in Malawi
lack clean and safe drinking water leaving many of them infected with or dying of

3
diarrhoea from water borne diseases (Nkawihe, 2006). It was further reported that
3,000 children were infected with diarrhoea in 2005 and 1,000 of them died. Nkawihe
also reported that 43 % of the population obtains water from wells, streams and other
unreliable water sources leaving them prone to water-related diseases including
cholera. In Malawi, nearly 50% of all illness is related to water borne diseases
(Kaluwa & Chipeta, 2005). It is estimated that only 65% of the country’s population
(about 12 million) has access to safe water (85% urban and 45% rural), however
recent studies on the district water supplies indicate that 40% of the facilities have
fallen into disrepair (Mandowa, 2005).
The vision of Malawi’s new water policy is “water and sanitation for all, always” and
seeks to provide every Malawian with “equitable” access to water and sanitation
services for sustainable socio-economic development of the country (Anon, 2004).
This is in line with the Millennium Development Goals (MDG’s) and the World
Summit on Sustainable Development (WSSD) targets of 2002 to strive to halve the
population of people without access to water and sanitation by 2015. This is a big
challenge for Malawi due to the country’s economic problems where over 60% of the
people live below the poverty line.
Potable water is one that is free from disease causing microorganisms (pathogens),
low in concentrations of compounds that are acutely toxic or that have serious long
term effects on health. Potable water should also be clear, not saline, and free from
compounds that can cause colour, taste and odour. The conventional way of extracting
drinking water from the ground is by drilling boreholes and shallow wells through the
existing water table to form a well point. In certain regions of Southern Africa, as the

4
water percolates through the soil, harmful physical, biological and chemical
constituents (e.g. fine suspended matter, faecal coliform and fluoride) become
contained in the water making it unsuitable for human consumption.
The main sources of water for rural communities are boreholes, covered/protected and
open/unprotected shallow wells, gravity-fed piped systems, springs and lakes and
rivers. Boreholes are small diameter (approx. 0.1 to 0.2m) mechanically drilled holes,
with depths ranging from 20 to 80m. In comparison, shallow wells have larger
diameter holes (≥1m), which are either hand dug or drilled, with depths not normally
exceeding 15m. According to Staines (2002), 2.6 million (37%) of Malawians have
access to boreholes as their main source of drinking water, 2.5 million (26%) draw
their water from shallow wells, 2.1 million (21%) use either piped water or communal
standpipes and the remaining 1.6 million (16%) use other water sources such as rivers,
and lakes.
1.1 Aim of the study
The majority of research work undertaken on water in developing countries has
focussed on surface and borehole water quality with hardly any work being
undertaken on shallow wells. Shallow wells are one of the most important types of
water supplies for domestic purposes for rural districts in Malawi. This research work
was undertaken to develop a data-base on water quality from shallow wells. This
study investigated biological, chemical and physical shallow well water quality. It
compared the difference in water quality between the dry and wet season.

5
2. METHODOLOGY
2.1 Area/timescale of the study
The study was conducted in three districts in the southern region of Malawi namely;
Blantyre, Chiradzulu, and Mulanje. These districts were chosen for the study as a
result of poor drinking water quality i.e. a large number of water-related diseases (e.g.
cholera) have been reported (e.g. Michael-Phiri, 2003, Nkawihe, 2006). Blantyre is
the largest commercial city and has a population of about 1 million people with the
rural population in the region of 358,940. Chiradzulu has a total population of
282,158 while Mulanje has a population of 522,893 (Anon, 2002). These districts
receive an average rainfall ranging from 700 to about 1,300 mm annually (Nkhokwe,
2005). This rainfall occurs from October or November and continues until April. The
heaviest rains are experienced from December to March. To account for this seasonal
variation in the rainfall pattern, water samples were obtained and analysed from the
same shallow wells at four different times within a period of a year; two different
batches of samples were taken in both the dry season (August and October) and wet
season (February and April). This allowed a data-base of 26 shallow wells to be
established on the change in water quality, in the selected districts during the
changing of the seasons within a typical year. Visits to the water points were made in
liaison with Water Officials from the Ministry of Irrigation and Water Development
and Regional Water Boards.
2.2 Test Equipment/Sampling Method
An in-situ water quality testing kit ‘Paqualab 50’ was used to determine
microbiological, chemical and physical contamination of the water from shallow
wells. This test kit enabled water quality to be tested in line with the World Health

6
Organisation (WHO) standards and Malawi Bureau of Standards (MBS). Sterile
conditions were obtained prior to sampling by using an autoclave steamer and during
sampling by using flaming techniques around water exit points. Sample bottles were
either rinsed three times with source water before collecting the sample or rinsed with
70% methanol to minimise the risk of external contamination. For covered wells, the
water outlet was flame sterilised using tissue paper soaked in 70% methanol for 20–30
seconds. Water was pumped out to waste for 30-60 seconds to discharge water that
had stood for a period in the service pipe if not found in use. The sample bottle was
then rinsed and the sample drawn. For the open wells, the sample bottle was held by a
bottle holder then plunged into the well to a depth of 0.3m below the water level to
draw the sample. Microbiological analysis was carried out in-situ so that the
microbiological parameters would not change with time. Water samples were
collected for physico-chemical analyses in the laboratory.
2.2.1 Microbiological analyses
The numbers of total and faecal coliforms were determined using membrane filtration
technique. A measured volume of water (as guided by WHO, 1993) was filtered
through a membrane. Bacteria were retained on the membrane and incubated, after a
recover period of one hour, at 37oC and 44oC for total and faecal coliforms
respectively for 24 hours. If present, bacteria grew into visible colonies that were
counted manually. Each test was duplicated for consistency and the results were
converted to represent a count per 100ml. To ensure sterile conditions, Petri dishes,
medium and forceps were autoclaved. After each sample collection, the filtration unit
was flame sterilised using 70% methanol.
7
2.2.2 Physico-chemical analyses
Data for turbidity, pH, temperature, total dissolved solids and electrical conductivity
were obtained by using the appropriate test meters from the Paqualab 50. For the
chemical analyses, water samples were collected in dark sample bottles and upon
return to the laboratory, reagents together with a photometer were used to determine
the amount of ammonia, arsenic, nitrite, nitrate, sulphate, hardness and chlorine.
3. RESULTS
The water quality analysis parameters were compared to the WHO, MBS and MoWD
temporary guidelines to ascertain if the quality of the water were in accordance with
appropriate drinking water standards. The standards are given in Table 3.2 followed
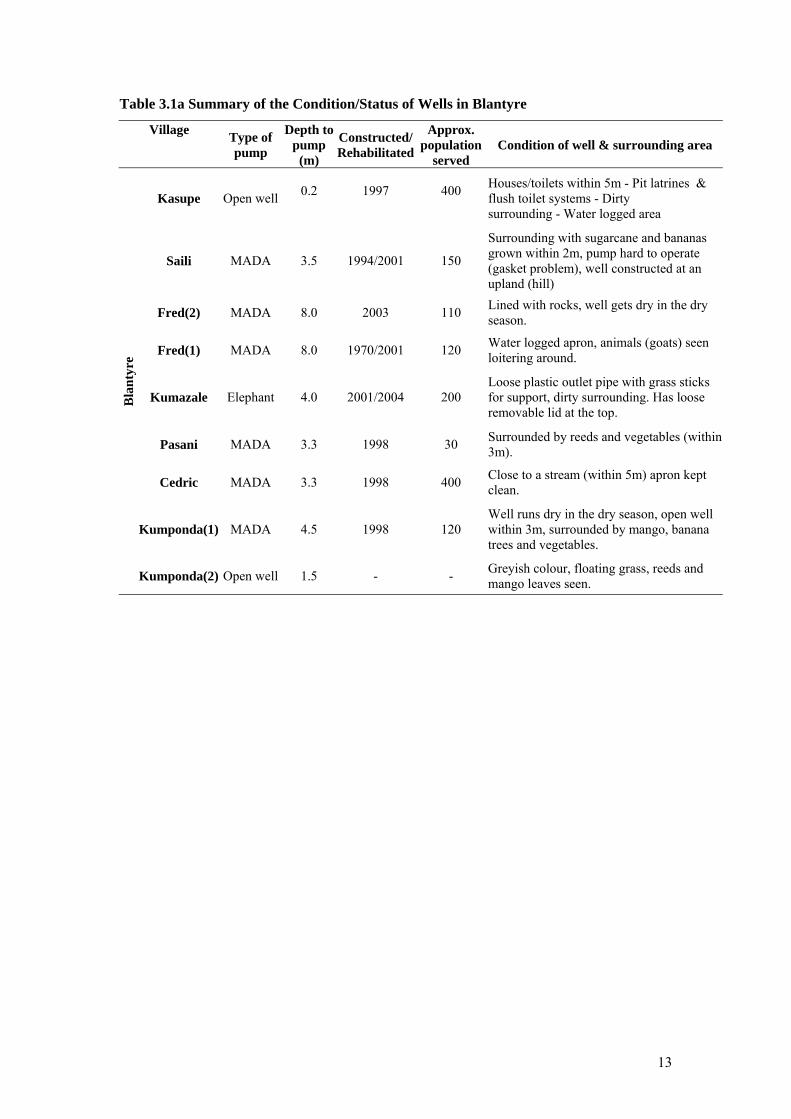
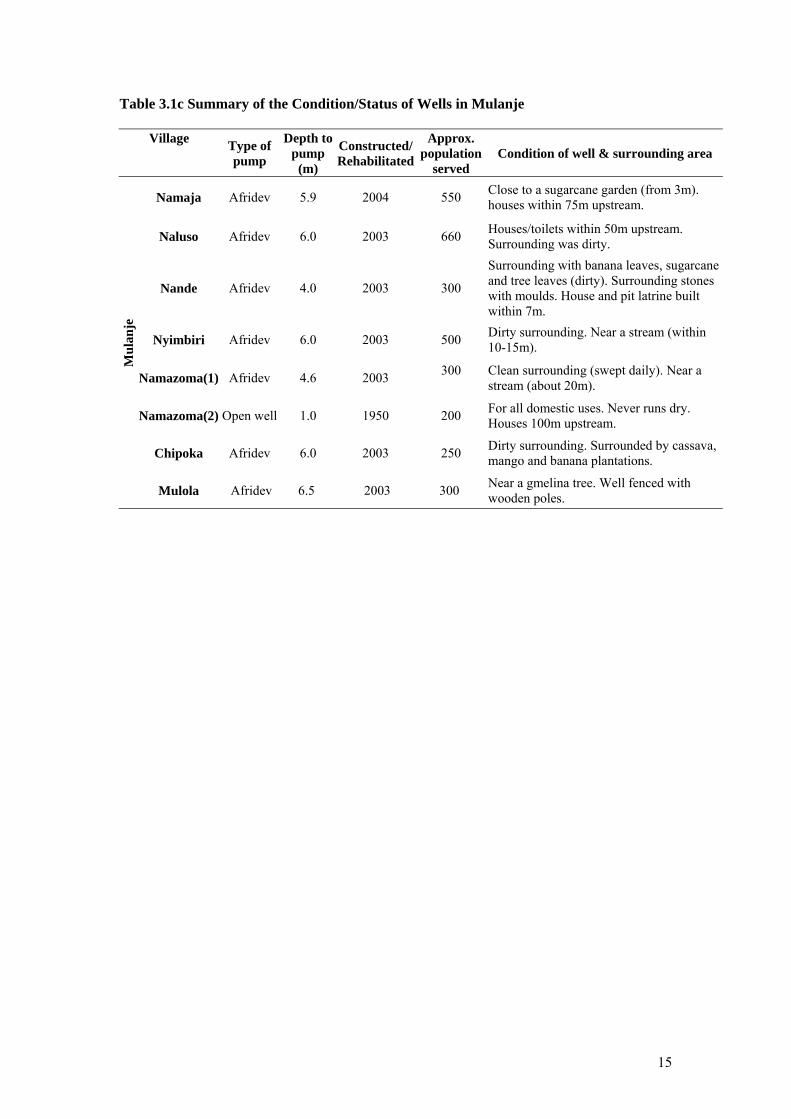
by the on-site microbiological analysis in Table 3.3. Prior to this in Tables 3.1a, 3.1b
and 3.1c a description of the condition and status of the wells is given for the
Blantyre, Chiradzu and Mulanje wells respectively. Chemical standards are given in
Table 3.4 followed by tables containing the data for the wells again separated into the
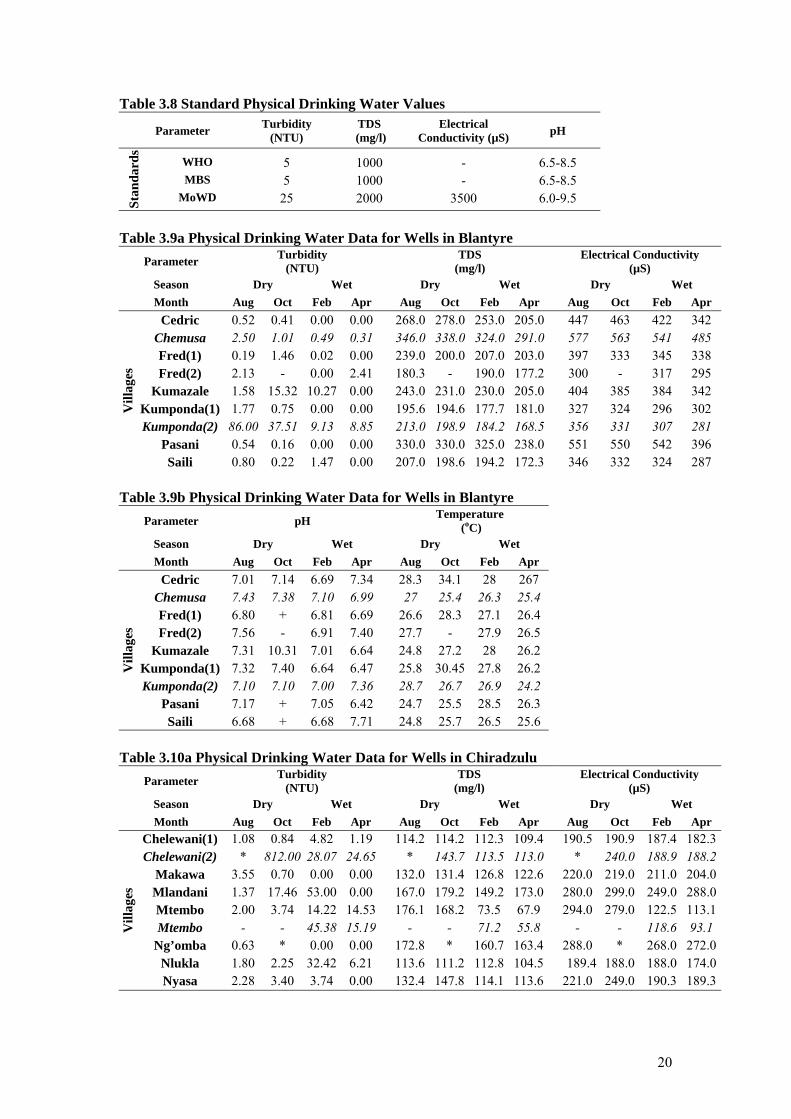
three districts in Tables 3.5 – 3.7. The physical data follows the same pattern with the
standards in Table 3.8 followed by Tables 3.9 – 3.11. The mean of two results are
shown in the data tables.
4. DISCUSSION OF RESULTS
4.1 Microbiological Water Quality
Microbiological water quality results show that the water is grossly polluted with
faecal matter. In terms of total coliform, the results show that approximately 80% of
the shallow wells tested in the dry season and 100% of the wells in the wet season did
not meet the temporary drinking water guidelines set by the MoWD, of a maximum of
50 TC/100ml for untreated water. Approximately 50% of the wells failed to meet the

8
faecal coliform drinking water guideline of 50 FC/100ml in the dry season while this
figure had increased to 94% of the wells failing to meet the standard in the wet
season. All the wells fail to meet the standard in at least one of the four samples.
There was a noticeable increase in the number of coliform counts in the wet season
compared to the dry season. This increase could be attributed to the fact that
pollutants are easily transported to water points by rain water. There appears to be a
lot of variation between the wells with some containing a very high level of faecal
contamination. The open wells appear generally worse than the covered wells, but
even the least polluted is clearly in excess of the MoWD temporary standard.
4.2 Physico-Chemical Water Quality
The majority of the physico-chemical parameters were found to be within the
recommended limits for the WHO, MBS, and MoWD. Parameters that were found to
be slightly out of the range were pH and turbidity. That is 45% of water samples from
Mulanje did not meet the MoWD minimum pH standard of 6.0 in the dry season,
while about 50% of water samples did not meet the minimum standard in the wet
season. pH values of less than 6.0 indicate that water is acidic. This could be
attributed to tea that is grown in Mulanje district. Blantyre and Chiradzulu had pH
values within the recommended range. Acidic water can cause corrosion of
construction materials that are used in wells e.g. casing and screens (Lakudzala and
Mukhuwa, 2005).
Turbidity values were higher in the wet season than in the dry season for protected
shallow wells. Almost 100% met the MoWD standard in the dry season. In the wet
season, about 22% of the wells did not meet the MoWD standard. These results are

9
comparable with other published data (e.g. Palamuleni, 2001), in that turbidity is
always higher in the wet season than the dry season. The impact of turbidity is that the
colloidal particles which cause turbidity can harbour pathogenic microorganisms
thereby making disinfection ineffective. Turbidity also makes the water aesthetically
unacceptable.
The recommended temperature for drinking water is 25oC according to UK standards
(Tebutt, 1998). There is no guideline value set by WHO, MBS and MoWD. High
temperature enhances microbial activity and other chemical reactions. For the samples
analysed, 90% had temperatures greater than 25oC in Blantyre, 31% in Chiradzulu
and 84% in Mulanje. The difference in temperature with season was not noticeable.
Although hardness values were within the set guideline values, they were higher in
the wet season than in the dry season. This could be due to dissolution of chemicals in
water. The impacts of hardness are scale deposition and high soap consumption.
Both the total dissolved solids (TDS) and electrical conductivity results were below
the guideline values. However, TDS values were slightly higher in the dry season than
in the wet season. Electrical conductivity values were also slightly higher in the dry
season compared to the wet season. This could be attributed to the dilution effect of
these types of pollutant in the wet season.
5. CONCLUSIONS AND RECOMMENDATIONS
The study showed that shallow wells yield water of unacceptable microbiological
quality and that the situation is significantly worse in the wet season; almost certainly

10
due to the mobility of this type of pollutant increasing. However, in general the
physical and chemical parameters did not change significantly with season. Certain
parameters such as pH and turbidity are worse in the wet season; however other
parameters such as TDS and electrical conductivity actually improve in the wet
season, probably as a result of dilution. The study also highlighted the fact that a
number of wells dry up during the dry season, which in turn forces people to use open
water sources such as rivers. These alternative water sources are normally more
grossly contaminated. Another fact highlighted in the study is that a number of the
shallow wells serve more people than is required by the MoWD standard of 250 per
borehole/shallow well (Mandowa, 2005). About 30% of shallow wells in Blantyre and
Chiradzulu serve more than 250 people, this is worse in Mulanje where 75% of the
shallow wells serve more than 250 people.
The water pollution control regulations in the Water Resources Act stipulate that
water points be 100m upstream of sanitation facilities (e.g. pit latrines) (Lakudzala
and Mukhuwa, 2005). Some shallow wells in the study were located less than 100m
(1 in 4 were within 40m distance) from pit latrines and waste dumps. There is a need
for the government to enforce standard construction procedures in order to minimise
pollution of water sources. Unsewered sanitation can cause groundwater
contamination by chlorides, nitrates and pathogenic microorganisms. Ndolo et al
(2002) noted that the provision of water, sanitation and good hygiene is vital for the
protection and development of human resources. The provision of water supply alone
does not guarantee freedom from pollution and water-related diseases.

11
The present form of construction and method of water extraction for shallow wells is
insufficient to yield potable water for rural communities. However, conventional
water treatment technologies e.g. disinfection of water using chlorine are
unaffordable/unsustainable for rural livelihoods. Therefore there is a vital need to
develop sustainable cost effective technologies to treat groundwater for rural
communities.
The authors of this paper are working on the development of an innovative,
sustainable and economical process that utilises natural extracts from indigenous
plants/crops in the form of a filter geotextile to purify the groundwater from shallow
wells.
ACKNOWLEDGEMENTS
Thank you to WARFSA, Leeds Metropolitan University and the Malawi Polytechnic
for their financial support.
REFERENCES
Anon. (2002). ‘Global Information and early warning system on food and agriculture. World Food Programme. Special Report. FAO/WFP Crop and Food Supply Assessment Mission to Malawi. 29 May. Available: www.fao.org/docrep/005/y6811e/y6811e00.htm Anon. (2004).Government of Malawi National Water Policy. Ministry of Water Development, Lilongwe. Kalua, P.W.R. and Chipeta, W.P.C. (2005). ‘A Situation Analysis of Water Sector in Malawi.’ A paper presented at the workshop on Situation Analysis of Water Sector in Malawi, September, 2005. Lakudzala, D.D. and Mukhuwa, T. (2005). ‘Rural Water Supply in Malawi: Case Study of Tizola and Ndirande Villages in Chikwawa District.’ A paper presented at the University of Malawi, The Polytechnic Annual Research Conference, November 2005, Mangochi, Malawi.

12
Mandowa, W. (2005). ‘Rapid Assessment of Malawi Rural Water Supply and Sanitation.’ Final Draft Report for ADB. Michael-Phiri, M. (2003). ‘One Dies of Cholera in Blantyre: Dirty water is the issue’ Nation Newspaper, National News, April 2, pg3. Ndolo, V.U., Masamba, W.R.L., Binauli, L., and Kambewa, P. (2002). ‘Unsafe Drinking Water: Examination of Water Quality in Drought-Prone Areas in Balaka District, Malawi,’ In: 3rd WaterNet/WAFSA Symposium ‘Water Demand Management for Sustainable Development,’ Dar es Salaam. Nkawihe, M. (2006). ‘80 % School Children Lack Safe Water’. In: The Daily Times, Wednesday, March 15, National News. Nkhokwe, J.L. (2005). ‘Meteorological Observations’. A paper presented at the workshop on Situation Analysis of Water Sector in Malawi, September, 2005.
Palamuleni, L.G. (2001). ‘Effect of sanitation facilities, domestic solid waste disposal and hygiene practices on water quality in Malawi’s urban poor areas: a case of South Lunzu Township in the city of Blantyre.” Available: http:/www.waternetonline.ihe.nl)
Staines, M. (2002). ‘Water/Wastewater Problems and Solutions in Rural Malawi.’ MPhil Thesis, University of Strathclyde, Glasgow.
Tebutt, T.H.Y. (1998). ‘Principles of water quality control,’ 5th edition, Butterworth- Heinemann, ISBN 0 7506 3658 0. Malawi Bureau of Standards
Drinking Water Standards
World Health Organisation (1984). ‘Guidelines for Drinking Water Quality,’ Volume 1: Recommendations, World Health Organisation Standards.
World Health Organisation –WHO (1993). ‘Guidelines for Drinking Water Quality,’ Volume 3: Second Edition, Surveillance and control of community supplies. World Health Organisation - WHO (1996). ‘Guidelines for Drinking -Water Quality,’ Volume 2: Second Edition, Health criteria and other supporting information. Malawi Bureau of Standards – MBS (1990). ‘Potable Water Standards for Treated Water Supply Schemes.’ (MBS 214:1990). Malawi Bureau of Standards – MBS (2005). ‘Malawi Standard; Drinking water – Specification’ Malawi Standards Board; MS 214:2005, ICS 13.030.40 (First revision). Ministry of Water Development - MoWD (2003). ‘Government of Malawi; Devolution of Functions of Assemblies: Guidelines and Standards.’
13
Table 3.1a Summary of the Condition/Status of Wells in Blantyre
Village Type of pump
Depth to pump
(m)
Constructed/ Rehabilitated
Approx. population
served Condition of well & surrounding area
Bla
ntyr
e
Kasupe
Open well
0.2
1997
400
Houses/toilets within 5m - Pit latrines & flush toilet systems - Dirty surrounding - Water logged area
Saili MADA 3.5 1994/2001 150
Surrounding with sugarcane and bananas grown within 2m, pump hard to operate (gasket problem), well constructed at an upland (hill)
Fred(2) MADA 8.0 2003 110 Lined with rocks, well gets dry in the dry season.
Fred(1) MADA 8.0 1970/2001 120 Water logged apron, animals (goats) seen loitering around.
Kumazale Elephant 4.0 2001/2004 200 Loose plastic outlet pipe with grass sticks for support, dirty surrounding. Has loose removable lid at the top.
Pasani MADA 3.3 1998 30 Surrounded by reeds and vegetables (within 3m).
Cedric MADA 3.3 1998 400 Close to a stream (within 5m) apron kept clean.
Kumponda(1)
MADA 4.5 1998 120
Well runs dry in the dry season, open well within 3m, surrounded by mango, banana trees and vegetables.
Kumponda(2) Open well 1.5 - - Greyish colour, floating grass, reeds and mango leaves seen.

14
Table 3.1b Summary of the Condition/Status of Wells in Chiradzulu
Village Type of pump
Depth to pump
(m)
Constructed/ Rehabilitated
Approx. population
served Condition of well & surrounding area
Mlandani Elephant 9.0 2005 200 Dirty surrounding (with sugarcane wastes). Loose lid at the top which is opened sometimes for maintenance.
Chi
radz
ulu
Nlukla Elephant 6.0 2004 700 Surrounding swept daily. Houses within 30-40m. Sugarcane, mangoes within 2m.
Chelewani(1) MADA 4.0 1998/2003 100 Dirty surrounding, houses within 90m upstream, surrounded by gardens (maize, peas, etc). Open well 3-4m downstream.
Chelewani(2) Open well 1.0 - 0 Water for gardening only. Well covered with green seed-like plants in the wet season. Well gets dry in the dry season.
Nyasa Afridev 7.5 2004 300 Water logged apron with moulds, surrounding very dirty with grass and other solid waste. Houses/shops within 10m.
Makawa Afridev 7.0 1970/2004 200 Cracks around pump, surrounded by banana plants and vegetables.
Ng’omba MADA 6.0 1999 500 Near a stream (5m) with reeds, bananas, and mango trees in the vicinity. Cracks on the slab. Houses about 100m upstream.
Mtembo Elephant 8.0
2004
100
Water with tiny black spots. Water dries up in the dry season. Open well within 5m.
Mtembo Open well 4.0 - 0 Water used for washing and gardening.
15
Table 3.1c Summary of the Condition/Status of Wells in Mulanje
Village Type of pump
Depth to pump
(m)
Constructed/ Rehabilitated
Approx. population
served Condition of well & surrounding area
Mul
anje
Namaja Afridev 5.9 2004 550 Close to a sugarcane garden (from 3m). houses within 75m upstream.
Naluso Afridev 6.0 2003 660 Houses/toilets within 50m upstream. Surrounding was dirty.
Nande Afridev 4.0 2003 300
Surrounding with banana leaves, sugarcane and tree leaves (dirty). Surrounding stones with moulds. House and pit latrine built within 7m.
Nyimbiri Afridev 6.0 2003 500 Dirty surrounding. Near a stream (within 10-15m).
Namazoma(1) Afridev 4.6 2003 300
Clean surrounding (swept daily). Near a stream (about 20m).
Namazoma(2) Open well 1.0 1950 200 For all domestic uses. Never runs dry. Houses 100m upstream.
Chipoka Afridev 6.0 2003 250 Dirty surrounding. Surrounded by cassava, mango and banana plantations.
Mulola Afridev 6.5 2003 300 Near a gmelina tree. Well fenced with wooden poles.

16
Table 3.2 Standard Microbiological Drinking Water Values
Parameters Total Coliforms per 100ml
Faecal Coliforms per 100ml
WHO 0 0 MBS 0 0
MoWD 50 50 Table 3.3 Microbiological Drinking Water Data for Districts/Villages in Malawi
Parameter Total Coliforms per 100ml Faecal Coliforms per 100ml Season Dry Wet Dry Wet Month Aug Oct Feb Apr Aug Oct Feb Apr
Dis
tric
ts/V
illag
es
Bla
ntyr
e
Cedric 80 241 299 790 2 2 94 233 Chemusa 170 1390 4240 870 170 55 310 100 Fred (1) 16 143 85 218 0 5 58 90 Fred (2) 0 - 233 605 0 - 128 98
Kumazale 2 5625* 2340 500 290 4775* 610 30 Kumponda 20 330 1900 1820 10 5 95 120 Kumponda 3350 26000 23950 10400 2600 8700 28450 2000
Pasani 120 1413 400 250 4 85 40 830
Saili 36 124 1600 1100 4 16 800 70
Chi
radz
ulu
Chelewani 10 413 # 1685 0 73 1218 490 Chelewani* - # 20900 24800 - 29600 435 1200
Makawa 820 7880 2180 2150 40 460 435 310 Mlandani 165 700 # 3660 15 100 # 470 Mtembo 1000 2940 852 875 0 60 820 385 Mtembo - - 38800 6550 - - 7350 1750
Ng’omba 60 * 870 1000 190 * 330 160
Nlukla 65 1350 4320 5820 35 438 1015 630
Nyasa 0 100 2040 4490 0 25 1120 345
Mul
anje
Chipoka 1940 * * * 0 * * * Mulola -- 275 1435 535 -- 0 1025 95 Naluso 50 1050 2720 1090 70 133 1920 15 Namaja 95 200 # 6850 15 5 4020 2100
Namazoma (1) 225 100 3050 860 20 10 1190 240 Namazoma (2) 19280 3900 22000 2900 160 3100 300 400
Nande 5700 * * * 200 * * *
Nyimbiri 5 230 2210 640 0 206 2580 420 - well was dry --unable to gain access to village well * well has fallen into disrepair # result was nullified (membrane was stuck to Petri dish) Italics indicate open/unprotected wells - all other wells are covered/protected

17
Table 3.4 Standard Chemical Drinking Water Values
Parameter Chlorine, Free (mg/l
Chlorine, Total (mg/l)
Sulphate, SO4 (mg/l)
Hardness CaCO3 (mg/l)
Nitrate, N (mg/l)
Ammonia, N (mg/l)
Arsenic (mg/l)
Nitrite, NO2 (mg/l)
Stan
dard
s
WHO 0.6-1.0 250 1.5 50 1.5 0.01 3 MBS 400 2 10 0.05
MoWD 800 3 100 0.05
~ no guideline value set Table 3.5a Chemical Drinking Water Data for Wells in Blantyre
Parameter Chlorine (Free) (mg/l)
Chlorine (Total) (mg/l)
Sulphate SO4 (mg/l) Hardness
CaCO3 (mg/l) Season Dry Wet Dry Wet Dry Wet Dry Wet Month Aug Oct Feb Apr Aug Oct Feb Apr Aug Oct Feb Apr Aug Oct Feb Apr
Vill
ages
Cedric 0.00 0.02 0.16 0.01 0.00 0.02 0.16 0.01 3 0 3 5 122 108 145 195 Chemusa 0.02 0.04 0.02 0.02 0.02 0.04 0.04 0.05 83 60 81 77 145 137 115 325 Fred(1) 0.00 0.01 0.01 0.05 0.00 0.01 0.01 0.05 5 0 3 0 85 90 95 195 Fred(2) 0.00 - 0.01 0.02 0.00 - 0.01 0.04 10 - 0 7 47 - 115 165
Kumazale 0.00 0.05 0.00 0.02 0.00 0.05 0.01 0.02 3 8 5 3 115 95 90 195 Kumponda(1) 0.00 0.02 0.00 0.06 0.01 0.06 0.01 0.07 5 5 5 0 75 38 80 195 Kumponda(2) 0.22 0.06 0.00 0.00 0.24 0.11 0.00 0.00 8 8 0 0 85 65 85 155
Pasani 0.00 0.02 0.00 0.04 0.00 0.02 0.00 0.04 17 0 37 0 130 210 235 185 Saili 0.00 0.00 0.01 0.06 0.00 0.00 0.01 0.06 8 13 12 0 56 56 70 165
Table 3.5b Chemical Drinking Water Data for Wells in Blantyre
Parameter Nitrate N (mg/l)
Ammonia N (mg/l)
Arsenic (µg/l) Nitrite
NO2 (mg/l) Season Dry Wet Dry Wet Dry Wet Dry Wet Month Aug Oct Feb Apr Aug Oct Feb Apr Aug Oct Feb Apr Aug Oct Feb Apr
Vill
ages
Cedric 0.000 0.012 0.003 0.021 0.03 0.00 0.00 0.02 ≤3 ≤3 ≤3 ≤3 0.001 0.032 0.004 0.000
Chemusa 0.000 0.000 0.000 0.055 0.83 0.00 0.10 0.12 ≤3 ≤3 ≤3 ≤3 0.012 0.000 0.004 0.055
Fred(1) 0.070 0.100 0.140 0.140 1.00 0.00 0.00 0.10 ≤3 ≤3 ≤3 ≤3 0.000 0.000 0.000 0.007
Fred(2) 0.430 - 0.580 0.900 0.00 - 0.00 0.05 ≤3 - ≤3 ≤3 0.006 - 0.004 0.007
Kumazale 0.000 0.000 3.200 0.640 0.00 0.38 0.00 0.04 ≤3 ≤3 ≤3 ≤3 0.004 0.000 0.011 0.007
Kumponda(1) 0.900 0.310 0.072 0.036 0.00 0.00 0.00 0.05 ≤3 ≤3 ≤3 ≤3 0.000 0.006 0.001 0.001
Kumponda(2) 0.000 0.130 0.320 0.006 0.08 0.33 0.16 0.02 ≤3 ≤3 ≤3 ≤3 0.004 0.108 0.012 0.003
Pasani 0.000 0.009 0.059 0.063 0.00 0.00 0.37 0.02 ≤3 ≤3 ≤3 ≤3 0.000 0.000 0.012 0.000
Saili 0.040 0.000 0.059 0.120 0.00 0.00 0.00 0.10 ≤3 ≤3 ≤3 ≤3 0.003 0.000 0.001 0.004
Table 3.6a Chemical Drinking Water Data for Wells in Chiradzulu
Parameter Chlorine (Free) (mg/l)
Chlorine (Total) (mg/l)
Sulphate SO4 (mg/l) Hardness
CaCO3 (mg/l) Season Dry Wet Dry Wet Dry Wet Dry Wet Month Aug Oct Feb Apr Aug Oct Feb Apr Aug Oct Feb Apr Aug Oct Feb Apr
Vill
ages
Chelewani(1) 0.00 0.04 0.00 0.00 0.00 0.04 0.00 0.00 0 5 5 5 6 3 34 80 Chelewani(2) * 0.14 0.05 0.18 * 0.15 0.12 0.18 * 113 15 0 * 65 14 65
Makawa 0.00 0.00 0.00 0.01 0.00 0.00 0.00 0.01 7 8 5 8 52 26 10 90 Mlandani 0.02 0.02 0.11 0.04 0.04 0.02 0.14 0.04 3 3 17 0 60 70 75 165 Mtembo 0.00 0.04 0.02 0.04 0.01 0.05 0.02 0.04 0 3 9 7 65 56 3 56 Mtembo - - 0.06 0.00 - - 0.15 0.00 - - 8 5 - - 3 56
Ng’omba 0.00 * 0.10 0.00 0.05 * 0.10 0.00 9 * 5 3 34 * 56 155 Nlukla 0.01 0.00 0.14 0.04 0.01 0.00 0.14 0.05 3 5 19 3 22 22 42 85 Nyasa 0.01 0.02 0.05 0.06 0.01 0.02 0.05 0.06 0 0 7 5 42 22 14 108

18
Table 3.6b Chemical Drinking Water Data for Wells in Chiradzulu
Parameter Nitrite N (mg/l)
Ammonia N (mg/l)
Arsenic (µg/l) Nitrate
NO2 (mg/l) Season Dry Wet Dry Wet Dry Wet Dry Wet Month Aug Oct Feb Apr Aug Oct Feb Apr Aug Oct Feb Apr Aug Oct Feb Apr
Vill
ages
Chelewani(1) 0.000 0.001 0.003 0.001 0.00 0.00 0.00 0.02 ≤3 ≤3 ≤3 ≤3 0.94 0.13 1.36 1.10
Chelewani(2) * 0.155 0.018 0.004 * 1.00 0.34 0.68 * ≤3 ≤3 ≤3 * 0.85 0.00 0.04
Makawa 0.003 0.000 0.000 0.000 0.00 0.00 0.00 0.02 ≤3 ≤3 ≤3 ≤3 0.00 0.00 0.00 0.04
Mlandani 0.010 0.019 0.027 0.004 0.00 0.00 0.01 0.08 ≤3 ≤3 ≤3 ≤3 0.03 0.11 0.07 0.03
Mtembo 0.030 0.003 0.004 0.006 0.03 0.00 0.00 0.01 ≤3 ≤3 ≤3 ≤3 0.13 0.16 3.80 +
Mtembo - - 0.069 0.000 - - 0.34 0.03 - - ≤3 ≤3 - - 1.38 +
Ng’omba 0.000 * 0.004 0.001 0.00 * 0.00 0.02 ≤3 * ≤3 ≤3 1.18 * 2.00 1.52
Nlukla 0.000 0.006 0.021 0.003 0.00 0.00 0.00 0.05 ≤3 ≤3 ≤3 ≤3 4.00 0.90 2.00 2.00
Nyasa 0.000 0.000 0.004 0.003 0.00 0.00 0.00 0.03 ≤3 ≤3 ≤3 ≤3 0.26 0.18 0.64 0.80
Table 3.7a Chemical Drinking Water Data for Wells in Mulanje
Parameter Chlorine (Free) (mg/l)
Chlorine (Total) (mg/l)
Sulphate SO4 (mg/l) Hardness
CaCO3 (mg/l) Season Dry Wet Dry Wet Dry Wet Dry Wet Month Aug Oct Feb Apr Aug Oct Feb Apr Aug Oct Feb Apr Aug Oct Feb Apr
Vill
ages
Chipoka 0.02 * * * 0.02 * * * 5 * * * 0 * * *
Mulola -- 0.00 0.07 0.06 -- 0.00 0.07 0.06 -- 3 0 5 -- 56 60 65 Naluso 0.02 0.02 0.21 0.02 0.03 0.02 0.21 0.02 5 0 0 0 47 * 235 165 Namaja 0.01 0.00 0.96 0.05 0.02 0.01 1.00 0.14 4 0 8 3 42 3 325 75
Namazoma 0.03 0.00 0.05 0.02 0.04 0.00 0.07 0.02 3 0 0 0 0 0 70 22 Namazoma 0.04 0.05 0.06 0.05 0.04 0.05 0.06 0.05 6 0 5 5 0 0 14 14
Nande 0.04 * * * 0.05 * * * 4 * * * 0 * * * Nyimbiri 0.04 0.02 0.32 0.01 0.05 0.02 0.33 0.01 7 3 5 0 16 6 210 85
Table 3.7b Chemical Drinking Water Data for Wells in Mulanje
Parameter Nitrite N (mg/l)
Ammonia N (mg/l)
Arsenic (µg/l) Nitrate
NO2 (mg/l) Season Dry Wet Dry Wet Dry Wet Dry Wet Month Aug Oct Feb Apr Aug Oct Feb Apr Aug Oct Feb Apr Aug Oct Feb Apr
Vill
ages
Chipoka 0.000 * * * 0.07 * * * ≤3 * * * 0.59 * * *
Mulola -- 0.000 0.000 0.001 -- 0.00 0.01 0.05 -- ≤3 ≤3 ≤3 -- 1.60 0.12 0.24
Naluso 0.003 0.000 0.003 0.003 0.01 0.00 0.06 0.04 ≤3 ≤3 ≤3 ≤3 1.14 1.76 2.00 1.36
Namaja 0.000 0.000 0.012 0.004 0.00 0.00 0.08 0.10 ≤3 ≤3 ≤3 ≤3 0.00 0.00 0.55 0.23
Namazoma 0.001 0.000 0.000 0.000 0.04 0.00 0.02 0.02 ≤3 ≤3 ≤3 ≤3 1.18 1.60 0.86 1.10
Namazoma 0.000 0.004 0.001 0.003 0.00 0.00 0.01 0.04 ≤3 ≤3 ≤3 ≤3 0.83 1.40 1.02 1.36
Nande 0.004 * * * 0.00 * * * ≤3 * * * 1.60 * * *
Nyimbiri 0.003 0.000 0.006 0.003 0.02 0.00 0.09 0.11 ≤3 ≤3 ≤3 ≤3 0.76 1.50 0.85 0.24 - well was dry -- unable to gain access to village well * well has fallen into disrepair # result was nullified (membrane was stuck to Petri dish) + failure of test equipment

19
Italics indicate open/unprotected wells - all other wells are covered/protected
20
Table 3.8 Standard Physical Drinking Water Values
Parameter Turbidity (NTU)
TDS (mg/l)
Electrical Conductivity (µS) pH
Stan
dard
s
WHO 5 1000 - 6.5-8.5 MBS 5 1000 - 6.5-8.5
MoWD 25 2000 3500 6.0-9.5
Table 3.9a Physical Drinking Water Data for Wells in Blantyre
Parameter Turbidity (NTU) TDS
(mg/l) Electrical Conductivity (µS)
Season Dry Wet Dry Wet Dry Wet Month Aug Oct Feb Apr Aug Oct Feb Apr Aug Oct Feb Apr
Vill
ages
Cedric 0.52 0.41 0.00 0.00 268.0 278.0 253.0 205.0 447 463 422 342 Chemusa 2.50 1.01 0.49 0.31 346.0 338.0 324.0 291.0 577 563 541 485 Fred(1) 0.19 1.46 0.02 0.00 239.0 200.0 207.0 203.0 397 333 345 338 Fred(2) 2.13 - 0.00 2.41 180.3 - 190.0 177.2 300 - 317 295
Kumazale 1.58 15.32 10.27 0.00 243.0 231.0 230.0 205.0 404 385 384 342 Kumponda(1) 1.77 0.75 0.00 0.00 195.6 194.6 177.7 181.0 327 324 296 302 Kumponda(2) 86.00 37.51 9.13 8.85 213.0 198.9 184.2 168.5 356 331 307 281
Pasani 0.54 0.16 0.00 0.00 330.0 330.0 325.0 238.0 551 550 542 396 Saili 0.80 0.22 1.47 0.00 207.0 198.6 194.2 172.3 346 332 324 287
Table 3.9b Physical Drinking Water Data for Wells in Blantyre
Parameter pH Temperature (oC)
Season Dry Wet Dry Wet Month Aug Oct Feb Apr Aug Oct Feb Apr
Vill
ages
Cedric 7.01 7.14 6.69 7.34 28.3 34.1 28 267 Chemusa 7.43 7.38 7.10 6.99 27 25.4 26.3 25.4 Fred(1) 6.80 + 6.81 6.69 26.6 28.3 27.1 26.4 Fred(2) 7.56 - 6.91 7.40 27.7 - 27.9 26.5
Kumazale 7.31 10.31 7.01 6.64 24.8 27.2 28 26.2 Kumponda(1) 7.32 7.40 6.64 6.47 25.8 30.45 27.8 26.2 Kumponda(2) 7.10 7.10 7.00 7.36 28.7 26.7 26.9 24.2
Pasani 7.17 + 7.05 6.42 24.7 25.5 28.5 26.3 Saili 6.68 + 6.68 7.71 24.8 25.7 26.5 25.6
Table 3.10a Physical Drinking Water Data for Wells in Chiradzulu
Parameter Turbidity (NTU) TDS
(mg/l) Electrical Conductivity (µS)
Season Dry Wet Dry Wet Dry Wet Month Aug Oct Feb Apr Aug Oct Feb Apr Aug Oct Feb Apr
Vill
ages
Chelewani(1) 1.08 0.84 4.82 1.19 114.2 114.2 112.3 109.4 190.5 190.9 187.4 182.3Chelewani(2) * 812.00 28.07 24.65 * 143.7 113.5 113.0 * 240.0 188.9 188.2
Makawa 3.55 0.70 0.00 0.00 132.0 131.4 126.8 122.6 220.0 219.0 211.0 204.0Mlandani 1.37 17.46 53.00 0.00 167.0 179.2 149.2 173.0 280.0 299.0 249.0 288.0Mtembo 2.00 3.74 14.22 14.53 176.1 168.2 73.5 67.9 294.0 279.0 122.5 113.1Mtembo - - 45.38 15.19 - - 71.2 55.8 - - 118.6 93.1
Ng’omba 0.63 * 0.00 0.00 172.8 * 160.7 163.4 288.0 * 268.0 272.0Nlukla 1.80 2.25 32.42 6.21 113.6 111.2 112.8 104.5 189.4 188.0 188.0 174.0Nyasa 2.28 3.40 3.74 0.00 132.4 147.8 114.1 113.6 221.0 249.0 190.3 189.3

21
Table 3.10b Physical Drinking Water Data for Wells in Chiradzulu Parameter pH Temperature
(oC) Season Dry Wet Dry Wet Month Aug Oct Feb Apr Aug Oct Feb Apr
Vill
ages
Chelewani(1) 6.54 6.34 6.37 6.48 23.7 24.6 24.5 22.2 Chelewani(2) * 7.14 6.26 6.58 * 28.1 23.5 21.0
Makawa 6.72 6.58 6.56 6.38 27.0 23.6 25.6 23.6 Mlandani 7.97 6.97 6.74 6.88 27.2 23.1 24.8 22.6 Mtembo 7 7.61 6.89 6.49 24.6 24.0 26.3 23.7 Mtembo - - 6.83 7.91 - - 29.6 24.2
Ng’omba 6.14 * 7.24 6.13 30.3 * 27.6 25.0 Nlukla 6.58 6.53 6.28 7.37 24.4 24.3 24.7 23.5 Nyasa 7.18 6.69 6.27 6.23 26.8 25.3 24.7 23.9
Table 3.11a Physical Drinking Water Data for Wells in Mulanje
Parameter Turbidity (NTU)
TDS (mg/l)
Electrical Conductivity (µS)
Season Dry Wet Dry Wet Dry Wet Month Aug Oct Feb Apr Aug Oct Feb Apr Aug Oct Feb Apr
Vill
ages
Namaja 0.50 1.03 502.00 138.00 138.7 137.1 73.0 97.7 231.0 228.5 121.7 162.9Naluso 2.04 2.73 36.06 5.80 161.1 161.7 153.9 160.3 268.0 268.0 256.0 267.0Nande 1.63 * * * 39.6 39.6 * * 66.1 66.1 * *
Nyimbiri 0.32 0.94 67.00 22.80 108.3 104.9 94.6 94.6 180.6 174.5 157.8 157.7Namazoma 2.50 2.54 16.53 4.80 56.0 46.8 41.1 39.2 93.3 78.9 68.5 65.4 Namazoma 5.66 15.86 4.72 2.40 27.9 52.9 27.5 27.4 46.3 28.4 45.9 45.7 Chipoka 1.96 * * * 35.5 33.4 * * 59.6 56.6 * * Mulola -- 1.67 4.64 1.12 -- 83.7 89.0 79.8 -- 139.6 148.2 133.0
Table 3.11b Physical Drinking Water Data for Wells in Mulanje
Parameter pH Temperature
(oC) Season Dry Wet Dry Wet Month Aug Oct Feb Apr Aug Oct Feb Apr
Vill
ages
Namaja 6.91 6.93 5.88 + 27.2 28.2 26.8 26.2 Naluso 6.35 6.4 6.21 + 26.6 26.1 25.9 25.5 Nande 5.33 * * * 23.4 * * *
Nyimbiri 6.67 6.71 6.29 + 29.8 26.4 27.7 26.1 Namazoma 5.64 5.78 5.22 + 25.0 27.2 27.2 26.6 Namazoma 5.42 5.7 5.22 + 24.7 28.0 25.5 24.6 Chipoka 5.66 * * * 26.0 * * * Mulola -- 6.15 6.03 + -- 27.1 26.4 26.4
- well was dry -- unable to gain access to village well * well has fallen into disrepair # result was nullified (membrane was stuck to Petri dish) + failure of test equipment Italics indicate open/unprotected wells - all other wells are covered/protected