biological oceanography school of biology atlanta, ga 30332
TRANSCRIPT

Biological Oceanography School of Biology
Atlanta, GA 30332
A Unit of the University System of Georgia An Equal Education and Employment Opportunity Institution
MEMORANDUM To: Stan Winslow
UH Marine Operations From: Joe Montoya
Chief Scientist, KM0703 Re: Cruise KM0703 Date: 16 April 2007
A preliminary report on Cruise KM0703 follows. On the whole, this has been an extremely successful cruise for us. This was my first time sailing on the Kilo Moana and I have been quite impressed by the ship's officers and crew – we enjoyed excellent support from the entire ship's company during our month working through the SW Pacific.
In addition to a summary of our shipboard activities, I have included a few recommendations for future cruises focused on blue water oceanography. I'd be happy to discuss any of these suggestions with you or to provide additional details if you wish.

p. 1 of 45
KM0703 Preliminary Cruise Report General Comments
Cruise KM0703 was organized around an NSF-funded study of the diversity and activity of nitrogen-fixing organisms (diazotrophs) in the oligotrophic ocean (J.P. Zehr and J.P. Montoya, PIs). The core project focused on characterization of the diazotroph community using molecular tools in combination with a suite of geochemical methods designed to quantify the contribution of diazotrophy to the local and regional nitrogen budget. This cruise was the second of two associated with this project and represented our primary field effort for this year.
During Cruise KM0703, we received outstanding support from the captain and crew of the R/V Kilo Moana. We accomplished all the major goals of our core research program and were able to accommodate a significant number of outside scientists and projects. Although all members of the crew were helpful, a number deserve special mention for their efforts. Captain Rick Meyer was always willing to work to accommodate our sampling and transit needs and really set the tone for a productive working relationship between the ship's company and the shipboard scientific party. The entire deck crew (Craig, Lawson, Mike, Roger, Thomas, and Warren) worked cheerfully through long shifts in the winch control cab and were always willing to help us with our deck operations and deployments. And, of course, the mess staff (Sean,

KM0703 Preliminary Cruise Report
p. 2 of 45
Donny, and Jan) provided us with great meals served up with good humor, even when our station and work schedule made it hard for us to fully enjoy their efforts.
Throughout this cruise, we worked closely with the University of Hawaii OTG marine techs in deploying and recovering our gear. We were fortunate to have three trainees on board, which effectively doubled the usual complement of marine technicians during our cruise. The lead marine technician, Tim McGovern, is absolutely outstanding – he's an excellent group leader who interfaces well with the science party. The three trainees on our cruise (Tobin Chen, Brad Issler, and Elly Speicher) all learned the ropes very quickly and were quite effective in running deck operations by the midpoint of our cruise. I’d be happy to go to sea with any of them in the future.
Overall Cruise Assessment We accomplished all the primary goals of our research program by extensively sampling the
planktonic community at twenty-six stations in the Tropical Southwest Pacific (Table 1). The geochemical, biological, and molecular samples we collected, and the suite of experiments we carried out constitute the most extensive data set on diazotrophs (N2-fixing organisms) and their activity in the South Pacific and perhaps the world ocean. On balance, this was a very successful cruise and we hope to return to the Tropical Pacific on the Kilo Moana in the future.
Scientific Party and Research Overview The core research project of this cruise focused on the diversity and activity of recently
discovered diazotrophs (N2-fixers) and was supported by NSF grants OCE-0425583 (Montoya) and OCE-0425363 (Zehr), and a grant from the Gordon and Betty Moore Foundation (Zehr). This project involved the research groups from Georgia Tech and UC Santa Cruz. In addition, scientists from a number of other institutions in the US (, MIT , RSMAS, UH, WHOI), Australia (UWA), and France (IRD-Marseille) joined the scientific party to carry out complementary ancillary projects. Table 2 lists the members of the scientific party, with each member's institutional affiliation, and the cruise legs he/she took part in.
Our station operations centered on a combination of hydrographic and water column
Table 1: Summary of major sampling activities on cruise KM0703.
Activity Leg 1 Leg 2 Total
Stations sampled 12 14 26 CTD/rosette casts 45 60 105 High volume pump deployments 14 13 27 Trace-metal vane deployments (lost at Stn. 012) 7 0 7 ATE Trace-metal sampler deployments 0 33 33 MITESS trace-metal sampler deployments 0 3 3 Optics casts 0 20 20 Hand net tows 12 16 28 Meter net tows 6 8 14 MOCNESS tows 7 8 15

KM0703 Preliminary Cruise Report
p. 3 of 45
sampling with a CTD/rosette system. We also carried out net tows (meter net, MOCNESS, and smaller hand nets) to sample zooplankton, and collected large volumes of surface water with air-driven pumps. Finally, hand nets were deployed at most stations to collect large phytoplankton (e.g., Trichodesmium colonies) for focused experiments. Table 1 summarizes our major sampling activities.
A more detailed summary of sampling and experimental activities of each research group in the shipboard party is appended to this report.
Cruise Track (Fig. 1) The first leg of KM0703 took us from Townsville, Australia to Noumea, New Caledonia,
covering a latitudinal range from 15˚S to 30˚S and extending over 3800 km. We began this leg of the cruise with an abbreviated shakedown station (Stn 001) and then carried out a full suite of sampling activities at the other 11 stations. We enjoyed generally good weather and sea conditions during this leg of the cruise and spent a total of 110 h on station.
KM0703 Leg 1 ended with our arrival in Noumea on the afternoon of 27 March. Four scientists (Drexel, Waterbury, Welsh, and Zehr) departed and two (London and White) joined the ship during our port call, which ended on the morning of 29 March.
Figure 1: Track of Cruise KM0703 from Townsville to Noumea to Suva.

KM0703 Preliminary Cruise Report
p. 4 of 45
We began the second leg of our cruise (Noumea to Suva) as Cyclone Becky approached New Caledonia from the north. This led us to shorten Station 013 so we could run around the storm, but this was the only real weather-related disruption we experienced. During Leg 2 of the cruise, we ran eastward to 20˚S 170˚W, then returned to the west on 15˚S, giving us two meriodonal transects through the region and a total track length of over 5800 km. We enjoyed good weather for the most part and encountered massive blooms of Trichodesmium as well as unexpectedly high abundances of unicellular cyanobacteria at several stations. We spent a total of 162 h on station during this leg.
Cruise KM0703 ended in Suva, Fiji on the afternooon of 16 April 2007. Table 2: KM0703 scientific party. Leg 1: Townsville to Noumea. Leg 2: Noumea to Suva.
Name Institution Leg 1 Leg 2 Becker, Jamie University of Hawaii • • Beinart, Roxanne University of California, Santa Cruz • • Biegala, Isabelle IRD–Marseilles • • Boyle, Edward MIT • • Hayakawa, Darin University of Hawaii • • Hewson, Ian University of California, Santa Cruz • • Drexel, Jan Georgia Insitute of Technology • – Garae, Camillia Government of Vanuatu • • Landrum, Jason Georgia Insitute of Technology • • London, Katie University of California, Santa Cruz – • Moisander, Pia University of California, Santa Cruz • • Montoya, Joseph Georgia Insitute of Technology • • Orchard, Elizabeth Woods Hole Oceanographic Institution • • Paerl, Ryan University of California, Santa Cruz • • Peterson, Tawnya University of California, Santa Cruz • • Poretsky, Rachel University of Georgia • • Rachel Horak Georgia Insitute of Technology • • Rousseaux, Cecile University of Western Australia • • van Gessel, Beth Georgia Insitute of Technology • • Waterbury, John Woods Hole Oceanographic Institution • – Welsh, Rory RSMAS, University of Miami • – White, Angel Oregon State University – • Zehr, Jonathan P. University of California, Santa Cruz • – OTG Personnel Chen, Tobin University of Hawaii • • Issler, Brad University of Hawaii • • McGovern, Tim University of Hawaii • • Speicher, Elly University of Hawaii • •

KM0703 Preliminary Cruise Report
p. 5 of 45
Shipboard Equipment and Ship Operations In general, the shipboard equipment and systems worked well and we had only minor
problems with UH or UNOLS gear during this cruise. We found that the trawl winch and stern A-frame worked very well for deployment of the MOCNESS, and we had no more than the usual problems with net misfires and loss/breakage of net cod ends. The CTD/rosette system caused us only minor problems -- we had to delay and abort several CTD casts because of problems with the SeaBird software or with the CTD winch hydraulics. The engineers were able to repair the hydraulic leaks quickly in each instance and we lost only a few hours of work time in total. On the other hand, the entire arrangement for deploying and recovering the CTD/rosette is by far the most cumbersome I've seen on any US research vessel. Although the marine technicians and crew are very adept at deployment and recovery of the CTD/rosette, it becomes challenging in any sea and requires more time than necessary because the winch operator has to relocate twice in the course of a single cast (winch deck to winch cab to fantail control box).
We had more difficulty with our deployment of smaller and/or specialized gear over the stern. The main problems are that the fantail is relatively high off the water and does not extend significantly aft of the screws. This makes it very easy to get gear and lines into the screws, which occurred twice during our cruise:
1. In the first instance, a set of Trace-metal sampling vanes deployed on a line fed through the A-frame was caught in the port screw at Station 012. The line was cut and four of five vanes belonging to Dr. Ed Boyle of MIT were lost, which greatly reduced our opportunities to collect trace-metal clean samples during the second leg of the cruise. Dr. Boyle was able to jury-rig a single trace-metal sampler, which we used during the second leg, but station time constraints limited us to collecting at most three samples at each station rather than the five originally planned using the vanes.
2. The second instance of gear loss occurred at Station 021, when a hand net was dragged under the hull and into the port screw almost immediately after deployment. We had spare nets aboard, so this loss didn't significantly affect our sampling and research efforts.
All members of the scientific party enjoyed access to email and the web via HiSeasNet, but we were puzzled by the restrictions imposed on access to remote ftp and pop servers. For many of us, these are critical sources of information/data and our preferred method for email access, respectively, and this is the first time I've encountered such restrictions.
Finally, I should mention that we all appreciated the efforts of the crew and engineers aimed at minimizing eruptions of "sewer gas" into our work spaces, but we would all prefer some more permanent solution to this problem.
Recommendations 1. I recommend reworking the arrangements for deploying and recovering the CTD/rosette
system as soon as possible. 2. I recommend exploring the possibility of adding a work platform extending aft of the
current transom for deployment of smaller gear and nets. 3. I don't understand the restrictions on access to ftp and pop servers and suggest revisiting
that policy. 4. I don't know what can be done about the noxious vapors seeping into the labs and
passageways, but any improvement would surely be appreciated by future science parties.

Appendix: KM0703 Research Activities
p. 6 of 45
Montoya Group (Georgia Tech) Support: NSF grant OCE-0425583
Personnel
Name Institution email address Joseph Montoya Georgia Tech [email protected] Jan Drexel Georgia Tech [email protected] Rachel Horak Georgia Tech [email protected] Jason Landrum Georgia Tech [email protected] Beth van Gessel Georgia Tech [email protected]
Sampling Activities At each station, we measured the basic physical properties of the water column with a CTD
and collected water samples throughout the upper 2000 m of the water column using the CTD/rosette system. These water samples were processed for measurement of nutrient concentrations (NO3
-, NO2-, PO4
3-, and SiO2), particulate nitrogen (PN) and carbon (PC) concentrations, and the isotopic composition of PN, PC, and NO3
-. In all, we collected 26 vertical profiles of nutrient and particle samples on this cruise. Nutrient concentrations were measured on board ship using a Lachat QuickChem 8000 flow injection analysis system. Particles were collected by gentle pressure filtration (P≤15 PSI) through precombusted GF/F filters and aliquots of filtrate were preserved with HCl for extraction and isotopic analysis of NO3
- ashore. We collected zooplankton samples using either a meter net towed through the upper 150 m of
the water column or a MOCNESS towed through the upper 500m of the water column. All zooplankton samples were size-fractionated for measurement of δ15N and δ13C. Where present, Trichodesmium was collected using small nets towed by hand through the upper 5 m of the water column.
Experimental Activities At each station, we measured N2- and CO2-fixation activity for four depths in the water
column by adding 15N2 and 13C-HCO3- to triplicate 4.5 L polycarbonate bottles filled with water
collected with the CTD/rosette system. All bottles were incubated for 24 h under simulated in situ conditions in a deck incubator. Experiments were terminated by gentle pressure filtration onto a precombusted GF/F filter after passage through a 10 µm Nitex filter. The >10µm size fraction was filtered separately. All experimental samples were dried for isotopic analysis ashore. In all, we carried out N2-fixation measurements for 25 vertical profiles during this cruise.
Preliminary Results We will provide standard hydrographic data from our CTD/rosette casts in electronic format
as a supplement to this report. We also measured nutrient concentrations at sea and will provide our preliminary data in electronic format as a supplement to this report. Our other samples

Appendix: KM0703 Research Activities
p. 7 of 45
require isotopic and elemental analysis ashore, which typically requires a minimum of 1 - 2 years of effort following a cruise.
Montoya Group: Overall Sampling and Experimental Summary (Stns. 1 - 26)
Sample/Measurement Number Notes Suspended particles 500 (approx) GF/F filtered samples for PN/PC and isotopic
analysis. Dissolved inorganic N 250 (approx) Preserved water samples. Nutrient concentrations 500 (approx) NO3
-, PO43-, SiO2 concentrations
Mixed layer zooplankton. 70 Zooplankton collected from the upper 100-120m of the water column with a meter net.
Depth-stratifiied zooplankton 390 Zooplankton were taken from upper 500m of the water column with a MOCNESS.
N2-fixation rate measurements 298 Whole water incubated with 15N2 and 13C-bicarbonate under simulated in situ conditions. Experiments were carried out in triplicate with water from four depths at each station.
Montoya Lab Samples and Experiments: Australian Waters (Stns. 1-6, 8-11) Sample/Measurement Number Notes Suspended particles 190 (approx) 10 stations Dissolved inorganic N 100 (approx) 10 stations Nutrient concentrations 190 (approx) 10 stations Mixed layer zooplankton. 25 5 tows Depth-stratifiied zooplankton 140 5 tows N2-fixation rate measurements 108 9 experiments

Appendix: KM0703 Research Activities
p. 8 of 45
Montoya Lab Samples and Experiments: Fijian Waters (Stns. 15, 16, 17, 24, 25) Sample/Measurement Number Notes Suspended particles 95 (approx) 5 stations Dissolved inorganic N 50 (approx) 5 stations Nutrient concentrations 95 (approx) 5 stations Mixed layer zooplankton. 15 3 tows Depth-stratifiied zooplankton 50 2 tows N2-fixation rate measurements 66 5 experiments; 6 extra bottles collected
Montoya Lab Samples and Experiments: New Caledonian Waters (Stns. 7, 12, 13, 14) Sample/Measurement Number Notes Suspended particles 76 (approx) 4 stations Dissolved inorganic N 40 (approx) 4 stations Nutrient concentrations 76 (approx) 4 stations Mixed layer zooplankton. 10 2 tows Depth-stratifiied zooplankton 75 3 tows N2-fixation rate measurements 44 4 experiments
Montoya Lab Samples and Experiments: Niue Waters (Stns. 19, 20) Sample/Measurement Number Notes Suspended particles 38 (approx) 2 stations Dissolved inorganic N 20 (approx) 2 stations Nutrient concentrations 38 (approx) 2 stations Mixed layer zooplankton. 10 2 tows Depth-stratifiied zooplankton 0 0 tows N2-fixation rate measurements 20 2 experiments

Appendix: KM0703 Research Activities
p. 9 of 45
Montoya Lab Samples and Experiments: Tongan Waters (Stns. 18, 22) Sample/Measurement Number Notes Suspended particles 38 (approx) 2 stations Dissolved inorganic N 20 (approx) 2 stations Nutrient concentrations 38 (approx) 2 stations Mixed layer zooplankton. 0 0 tows Depth-stratifiied zooplankton 75 3 tows N2-fixation rate measurements 24 2 experiments
Montoya Lab Samples and Experiments: US Waters (Stn. 21) Sample/Measurement Number Notes Suspended particles 19 (approx) 1 station Dissolved inorganic N 10 (approx) 1 station Nutrient concentrations 19 (approx) 1 station Mixed layer zooplankton. 5 1 tow Depth-stratifiied zooplankton
0 0 tows
N2-fixation rate measurements
12 1 experiment
Montoya Lab Samples and Experiments: Vanuatuan Waters (Stn. 26) Sample/Measurement Number Notes Suspended particles 19 (approx) 1 station Dissolved inorganic N 10 (approx) 1 station Nutrient concentrations 19 (approx) 1 station Mixed layer zooplankton. 5 1 tow Depth-stratifiied zooplankton
25 1 tow
N2-fixation rate measurements
12 1 experiment

Appendix: KM0703 Research Activities
p. 10 of 45
Montoya Lab Samples and Experiments: Wallis & Futuna Waters (Stn. 23) Sample/Measurement Number Notes Suspended particles 19 (approx) 1 station Dissolved inorganic N 10 (approx) 1 station Nutrient concentrations 19 (approx) 1 station Mixed layer zooplankton. 0 0 tows Depth-stratifiied zooplankton
25 1 tow
N2-fixation rate measurements
12 1 experiment

Appendix: KM0703 Research Activities
p. 11 of 45
Zehr Group (UC Santa Cruz) Support
NSF grant OCE-0425363 and a grant from the Gordon and Betty Moore Foundation
Personnel
Name Institution email address Jonathan Zehr UC Santa Cruz [email protected] Pia Moisander UC Santa Cruz [email protected] Ian Hewson UC Santa Cruz [email protected] Katie London UC Santa Cruz [email protected] Ryan Paerl UC Santa Cruz [email protected] Roxanne Beinart UC Santa Cruz [email protected] Isabelle Biegala IRD, Marseilles, France [email protected] Rachel Poretsky University of Georgia [email protected] Tawnya Peterson UC Santa Cruz [email protected]
Sampling Activities
Water samples for analyses of nucleic acids, dissolved and particulate nutrients, pigments and cell numbers were routinely collected from the upper surface layer (5 m-175 m depth). Concentrations of the major cell pigment chlorophyll a were measured onboard, while other analyses will be carried out at the University of California Santa Cruz. Routine high volume filtrations were conducted at each sampling station for collection of up to 150 L seawater per station using a positive pressure system. 10-L samples were also collected from deep water (>1000 m) at most stations. These samples will be used for molecular analysis later in the laboratory. Samples will be analyzed for gene diversity and expression of a variety of structural (16S rRNA gene) and functional microbial genes (nitrogen fixation, nitrate reduction, phosphorus cycling, genes involved in degradation of organic matter). A subset of the large volume samples collected will be processed for community sequencing (metagenomic analysis).
Overall Sampling Effort Sample Number Notes Nucleic acids 576 Pigments 215 Cell numbers 617 Dissolved nutrients 208 Particulate phosphorus 182 Dissolved organic matter 208

Appendix: KM0703 Research Activities
p. 12 of 45
Zehr Lab Samples: Australian Waters (Stns. 1-6, 8-11) Sample Number Notes Nucleic acids 223 Pigments 82 Cell numbers 242 Dissolved nutrients 80 Particulate phosphorus 80 Dissolved organic matter 60
Zehr Lab Samples: Fijian Waters (Stns. 15, 16, 17, 24, 25) Sample Number Notes Nucleic acids 118 Pigments 41 Cell numbers 124 Dissolved nutrients 40 Particulate phosphorus 30 Dissolved organic matter 40
Zehr Lab Samples: New Caledonian Waters (Stns. 7, 12, 13, 14) Sample Number Notes Nucleic acids 85 Pigments 35 Cell numbers 97 Dissolved nutrients 32 Particulate phosphorus 30 Dissolved organic matter 32
Niue Waters (Stns. 19, 20) Sample Number Notes Nucleic acids 38 Pigments 16 Cell numbers 32 Dissolved nutrients 16 Particulate phosphorus 12 Dissolved organic matter 16

Appendix: KM0703 Research Activities
p. 13 of 45
Zehr Lab Samples: Tongan Waters (Stns. 18, 22) Sample Number Notes Nucleic acids 49 Pigments 17 Cell numbers 49 Dissolved nutrients 16 Particulate phosphorus 12 Dissolved organic matter 16
Zehr Lab Samples: US Waters (Stn. 21) Sample Number Notes Nucleic acids 22 Pigments 8 Cell numbers 24 Dissolved nutrients 8 Particulate phosphorus 6 Dissolved organic matter 8
Zehr Lab Samples: Vanuatuan Waters (Stn. 26) Sample Number Notes Nucleic acids 21 Pigments 8 Cell numbers 24 Dissolved nutrients 8 Particulate phosphorus 6 Dissolved organic matter 8
Zehr Lab Samples: Wallis & Futuna Waters (Stn. 23) Sample Number Notes Nucleic acids 20 Pigments 8 Cell numbers 25 Dissolved nutrients 8 Particulate phosphorus 6 Dissolved organic matter 8

Appendix: KM0703 Research Activities
p. 14 of 45
Experimental Activities Following types of experiments were carried out. Some of the experiments described below
were repeated several times during the cruise. Experiment 1. At six stations (2, 5, 8, 13, 17, 21), water was collected for experiments to study nutrient limitations growth, physiological activities, and community composition of phytoplankton and bacterioplankton (nutrient limitation experiments). Each of these samples was incubated onboard for three days under different nutrient regimes (nitrate+ammonium, phosphate, iron, glucose+mannitol, and their combinations). Sub samples from these experiments were collected for detection of pigments (chlorophyll a), cell numbers, and nucleic acids. Sub samples from the experiments were also taken for cell specific analysis using Fluorescence in Situ Hybridization (Dr. Biegala), and photosynthetic efficiencies (Dr. Petersen). Experiment 2. At two stations, we collected 12 samples (20L each) and inoculated half with nutrients (phosphate or nitrate), while the other half remained un-amended. The experiments were incubated for 48h, after which they were filtered to retain nucleic acids. We also measured the biomass of organisms by taking samples for chlorophyll a (plant pigments) and for microscopy of cyanobacteria, bacteria, and viruses. Back in the lab, the communities will be assessed using molecular biological techniques, which will examine the abundance of different types of organisms as well as their relative gene expression. Experiment 3. Experiments were also conducted on seawater collected from depths within 100 m, in attempt to characterize the physiology of a nitrogen-fixing photosynthetic microbe (Crocosphaera watsonii). Phosphate, at concentrations comparable to those in the deep ocean was added to the bottles and microbial growth and physiological activities were followed for 8 days in bottles kept in tanks on deck filled with continuously flowing seawater. Experiment 4. Three experiments with high sampling frequency (every 6 h) were conducted over the course of 24 to 30 h for detection of microbial growth and gene expression by cell counts and nucleic acid analyses, respectively. The experiments were conducted to determine the effect of nutrients on microbial community composition and genetic expression. Experiment 5. Surface waters were collected via a deck pump and incubated in 4L bottles in large containers on deck and were cooled using surface seawater. Nitrate was added to some bottles in order to monitor responses by the microbial communities native to surface waters and responses were followed by collection of sub samples for molecular analyses.
Australian Waters (Stns. 1-6, 8-11) Samples were collected from vertical casts for routine measurements listed above. High volume sampling from 5-m surface and deep in the water column. Experiment 1: Three nutrient limitation experiments (Stations 2, 5, 8). Experiment 2. One large volume nutrient addition experiment (phosphorus addition). Experiment 5: 96-h surface water incubation with nitrate, a 48-h surface water incubation with nitrate. Fijian Waters (Stns. 15, 16, 17, 24, 25) Samples were collected from vertical casts for routine measurements listed above. High volume sampling from 5-m depth and deep in the water column. Experiment 1. One nutrient limitation experiment (Station 17).

Appendix: KM0703 Research Activities
p. 15 of 45
Experiment 2. One large volume nutrient addition experiment (nitrogen addition). Experiment 4. A 24-h experiment (Station 25). Experiment 5: A 48-h surface water incubation by mixing surface water with water from deeper in the water column. New Caledonian Waters (Stns. 7, 12, 13, 14) Samples were collected from vertical casts for routine measurements listed above. High volume sampling from 5-m depth. Deep water sampling. Experiment 1. One nutrient limitation experiment (Station 13). Niue Waters (Stns. 19, 20) Samples were collected from vertical casts for routine measurements listed above. High volume sampling from 5-m depth. Deep water sampling. Tongan Waters (Stns. 18, 22) Samples were collected from vertical casts for routine measurements listed above. High volume sampling from 5-m depth and deep (5800 m) in the water column. Experiment 5. 48-h surface water incubation with nitrate addition. US Waters (Stn. 21) Samples were collected from vertical casts for routine measurements listed above. High volume sampling from 5-m depth and deep in the water column. Deep water sampling. Experiment 1. A nutrient limitation experiment. Vanuatuan Waters (Stn. 26) Samples were collected from vertical casts for routine measurements listed above. High volume sampling from 5-m depth. Deep water sampling. Wallis & Futuna Waters (Stn. 23) Samples were collected from vertical casts for routine measurements listed above. High volume sampling from 5-m depth.
Preliminary Results Overall summary of results Most of the analyses will be carried out in the laboratory after the cruise has ended. A major proportion of the data from nutrient analyses, cell counts, and nucleic acid analyses are estimated to be available in April 30, 2008. Chlorophyll a analyses were carried out onboard. Chlorophyll a data from the vertical profiles are currently in the raw data format and the data analysis will be carried out later on, and will be available by June 2007. Some initial conclusions can be drawn from the nutrient limitation experiments based on the chlorophyll a data. In all six experiments, carried out in the waters of Australia, Fiji, New

Appendix: KM0703 Research Activities
p. 16 of 45
Kaledonia, and USA, nitrogen was the nutrient that limited the increase in phytoplankton biomass. In three of the six experiments, evidence was seen for the fact that nitrogen and iron added in combination had an additional stimulatory effect on phytoplankton growth. Iron, phosphorus, or glucose+mannitol mixture added alone never stimulated phytoplankton growth over the control treatment. Australian Waters (Stns. 1-6, 8-11) In the nutrient limitation experiments, nitrogen stimulated phytoplankton growth. When nitrogen was added in combination of phosphorus, iron, and glucose+mannitol, phytoplankton biomass increased even more. Fijian Waters (Stns. 15, 16, 17, 24, 25) In the nutrient limitation experiment, addition of nitrogen stimulated phytoplankton growth. There was a further increase in biomass if nitrogen was added in combination with iron. The biomass was stimulated even more if all nutrients (phosphorus, glucose, and mannitol) were added. New Caledonian Waters (Stns. 7, 12, 13, 14) In the nutrient limitation experiment, addition of nitrogen stimulated phytoplankton growth. There was a further increase in biomass if nitrogen was added in combination with either iron or phosphorus. The biomass was stimulated even more if all nutrients were added. Niue Waters (Stns. 19, 20) No results are available yet. Tongan Waters (Stns. 18, 22) No results are available yet. US Waters (Stn. 21) In the nutrient limitation experiment, addition of nitrogen stimulated phytoplankton growth. There was a further clear increase in biomass if nitrogen was added in combination with iron. There was no further increase in phytoplankton biomass if phosphorus, glucose, and mannitol were additionally provided. Vanuatuan Waters (Stn. 26) No results are available yet. Wallis & Futuna Waters (Stn. 23) No results are available yet.

Appendix: KM0703 Research Activities
p. 17 of 45
Isabelle Biegala (IRD-Marseille) Support: French national project PNEC-EC2CO New Caledonia 2006-2008 and support from the Gordon and Betty Moore Foundation
Personnel
Name Institution email address Isabelle Biegala IRD (Institut de Recherche
pour le Développement) [email protected]
Pia Moisander UCSC (University of California Santa Cruz)
Cécile Rousseaux UWA (University of Western Australia)
Sampling Activities Biegala Group: Overall Sampling Effort Sample Number Notes Filters from three size fractions: >10µm, 3µm, 0.2µM
315 Fixed samples for future TSA-FISH analysis with specific diazotrophs probe
Tubes with < 10µm filtered sea water concentrated by centrifugation
92 Fixed samples for future TSA-FISH analysis with specific diazotrophs probe
Tubes with non filtered sea water incubated with different nutrients and concentrated by centrifugation
28 Fixed samples for future TSA-FISH analysis with specific diazotrophs probe. Pia Moisander’s experiment.
Filters from three size fractions: >10µm, 3µm, 0.2µM
22 Fixed samples for future TSA-FISH analysis with specific diazotrophs probe. Cécile Rousseaux’s experiment.

Appendix: KM0703 Research Activities
p. 18 of 45
Biegala Group Sampling Effort: Australian Waters (Stns. 1-6, 8-11) Sample Number Notes Filters from three size fractions: >10µm, 3µm, 0.2µM
117 Fixed samples for future TSA-FISH analysis with specific diazotrophs probe
Tubes with < 10µm filtered sea water concentrated by centrifugation
32 Fixed samples for future TSA-FISH analysis with specific diazotrophs probe
Tubes with non filtered sea water incubated with different nutrients and concentrated by centrifugation
7 Fixed samples for future TSA-FISH analysis with specific diazotrophs probe. Pia Moisander experiment.
Biegala Group Sampling Effort: Fijian Waters (Stns. 15, 16, 17, 24, 25) Sample Number Notes Filters from three size fractions: >10µm, 3µm, 0.2µM
60 Fixed samples for future TSA-FISH analysis with specific diazotrophs probe
Tubes with < 10µm filtered sea water concentrated by centrifugation
20 Fixed samples for future TSA-FISH analysis with specific diazotrophs probe
Tubes with non filtered sea water incubated with different nutrients and concentrated by centrifugation
7 Fixed samples for future TSA-FISH analysis with specific diazotrophs probe. Pia Moisander experiment.

Appendix: KM0703 Research Activities
p. 19 of 45
Biegala Group Sampling Effort: New Caledonian Waters (Stns. 7, 12, 13, 14) Sample Number Notes Filters from three size fractions: >10µm, 3µm, 0.2µM
54 Fixed samples for future TSA-FISH analysis with specific diazotrophs probe
Tubes with < 10µm filtered sea water concentrated by centrifugation
12 Fixed samples for future TSA-FISH analysis with specific diazotrophs probe
Tubes with non filtered sea water incubated with different nutrients and concentrated by centrifugation
7 Fixed samples for future TSA-FISH analysis with specific diazotrophs probe. Pia Moisander’s experiment.
Filters from three size fractions: >10µm, 3µm, 0.2µM
6 Fixed samples for future TSA-FISH analysis with specific diazotrophs probe. Cécile Rousseaux’s experiment.
Biegala Group Sampling Effort: Niue Waters (Stns. 19, 20) Sample Number Notes Filters from three size fractions: >10µm, 3µm, 0.2µM
24 Fixed samples for future TSA-FISH analysis with specific diazotrophs probe
Tubes with < 10µm filtered sea water concentrated by centrifugation
8 Fixed samples for future TSA-FISH analysis with specific diazotrophs probe
Filters from three size fractions: >10µm, 3µm, 0.2µm
6 Fixed samples for future TSA-FISH analysis with specific diazotrophs probe. Cécile Rousseaux’s experiment.

Appendix: KM0703 Research Activities
p. 20 of 45
Biegala Group Sampling Effort: Tongan Waters (Stns. 18, 22) Sample Number Notes Filters from three size fractions: >10µm, 3µm, 0.2µM
24 Fixed samples for future TSA-FISH analysis with specific diazotrophs probe
Tubes with < 10µm filtered sea water concentrated by centrifugation
8 Fixed samples for future TSA-FISH analysis with specific diazotrophs probe
Filters from three size fractions: >10µm, 3µm, 0.2µM
6 Fixed samples for future TSA-FISH analysis with specific diazotrophs probe. Cécile Rousseaux’s experiment.
Biegala Group Sampling Effort: US Waters (Stn. 21) Sample Number Notes Filters from three size fractions: >10µm, 3µm, 0.2µM
12 Fixed samples for future TSA-FISH analysis with specific diazotrophs probe
Tubes with < 10µm filtered sea water concentrated by centrifugation
4 Fixed samples for future TSA-FISH analysis with specific diazotrophs probe
Tubes with non filtered sea water incubated with different nutrients and concentrated by centrifugation
7 Fixed samples for future TSA-FISH analysis with specific diazotrophs probe. Pia Moisander experiment.
Biegala Group Sampling Effort: Vanuatuan Waters (Stn. 26) Sample Number Notes Filters from three size fractions: >10µm, 3µm, 0.2µm
12 Fixed samples for future TSA-FISH analysis with specific diazotrophs probe
Tubes with < 10µm filtered sea water concentrated by centrifugation
4 Fixed samples for future TSA-FISH analysis with specific diazotrophs probe

Appendix: KM0703 Research Activities
p. 21 of 45
Biegala Group Sampling Effort: Wallis & Futuna Waters (Stn. 23) Sample Number Notes Filters from three size fractions: >10µm, 3µm, 0.2µm
12 Fixed samples for future TSA-FISH analysis with specific diazotrophs probe
Tubes with < 10µm filtered sea water concentrated by centrifugation
4 Fixed samples for future TSA-FISH analysis with specific diazotrophs probe
Experimental/Analytical Activities
Plankton from different size fraction (>10µm, 3µm, 0.2µm, or < 10µm) was collected and the cells were fixed and preserved for future quantification and 16S or nifH sequencing of unicellular diazotrophs (able to fix dissolved di-nitrogen) cyanobacteria using specific fluorescent molecular probes. The targeted unicellular algae will then fluoresce when seen under the microscope when cells are collected on filters, or detected by flow cytometry when cells are collected by centrifugation. Microscopy allows to provide exact counts from free living and associated targeted cells. After flow cytometry detection cells can be specifically sorted for further 16S or nifH gene sequencing. The main technique which will be used to analyze the samples is the TSA-FISH (Tyramid Signal Amplification of Fluorescent In Situ Hybridization)
Overall analytical/experimental effort Four different kind of preserved samples were collected: 1) Cells from different size fractions >10µm, 10-3µm and 3-0.2µm were collected at different.
They were fixed in paraformaldehyde and stored in ethanol at -80°C. 2) Cells belonging to the < 10µm size fraction were concentrated by centrifugation only from
the sub-surface depth at each station. They were fixed in paraformaldehyde and stored in ethanol at -80°C.
3) Cells were concentrated by centrifugation only from the sub-surface depth and incubated for 72 h with different nutrients (ammunium, nitrate, phosphate, iron, glucose manitol). They were fixed in paraformaldehyde and stored in ethanol at -80°C. Contribution to Pia Moisander’s experiment.
4) Cells from different size fractions >10µm, 10-3µm and 3-0.2µm were collected from the subsurface after beeing incubated for 24 h to estimate the grazing. They were fixed in paraformaldehyde and stored in ethanol at -80°C. Contribution to Cécile Rousseaux experiment.
Preliminary Results
So far there are no preliminary results available. First results will be acquired by the end of December 2007 and through 2008.

Appendix: KM0703 Research Activities
p. 22 of 45
Ed Boyle (MIT) Support National Science Foundation, CMORE (subcontract from University of Hawaii, contract # Z792093); National Science Foundation, Chemical Oceanography OCE-0647446.
Personnel
Name Institution email address Ed Boyle MIT [email protected]
Sampling Activities Boyle Lab Overall Sampling Effort Sample Number Notes Seawater samples 453 For trace metal analysis
Boyle Lab Sampling Activities: Australian Waters (Stns. 1-6, 8-11) Sample Number Notes Seawater samples 128 For trace metal analysis
Boyle Lab Sampling Activities: Fijian Waters (Stns. 15, 16, 17, 24, 25) Sample Number Notes Seawater samples 34 For trace metal analysis
Boyle Lab Sampling Activities: New Caledonian Waters (Stns. 7, 12, 13, 14) Sample Number Notes Seawater samples 64 For trace metal analysis
Boyle Lab Sampling Activities: Niue Waters (Stns. 19, 20) Sample Number Notes Seawater samples 138 For trace metal analysis
Boyle Lab Sampling Activities: Tongan Waters (Stns. 18, 22) Sample Number Notes Seawater samples 67 For trace metal analysis
Boyle Lab Sampling Activities: US Waters (Stn. 21) Sample Number Notes Seawater samples 8 For trace metal analysis

Appendix: KM0703 Research Activities
p. 23 of 45
Boyle Lab Sampling Activities: Vanuatuan Waters (Stn. 26) Sample Number Notes Seawater samples 0 For trace metal analysis
Boyle Lab Sampling Activities: Wallis & Futuna Waters (Stn. 23) Sample Number Notes Seawater samples 14 For trace metal analysis
Experimental/Analytical Activities Overall analytical/experimental effort
At all of the stations we worked on, we obtain water samples from the euphotic zone to define the trace metal exposure of marine phytoplankton. At one station (19), we obtained a full water column profile. All seawater analyses will be performed in the shore-based laboratory at MIT. Most of the samples will be analyzed for iron, a trace essential micronutrient. Some samples will be analyzed for lead and mercury, trace anthropogenic contaminants.
Australian Waters (Stns. 1-6, 8-11) We obtained water samples from the euphotic zone to define the trace metal exposure of
marine phytoplankton Fijian Waters (Stns. 15, 16, 17, 24, 25)
We obtained water samples from the euphotic zone to define the trace metal exposure of marine phytoplankton New Caledonian Waters (Stns. 7, 12, 13, 14)
We obtained water samples from the euphotic zone to define the trace metal exposure of marine phytoplankton Niue Waters (Stns. 19, 20)
We obtained water samples from the euphotic zone to define the trace metal exposure of marine phytoplankton. At one station (19), we obtained a full water column profile. Tongan Waters (Stns. 18, 22)
We obtained water samples from the euphotic zone to define the trace metal exposure of marine phytoplankton US Waters (Stn. 21)
We obtained water samples from the euphotic zone to define the trace metal exposure of marine phytoplankton

Appendix: KM0703 Research Activities
p. 24 of 45
Vanuatuan Waters (Stn. 26)
We did not obtain any samples in these waters.
Wallis & Futuna Waters (Stn. 23) We obtained water samples from the euphotic zone to define the trace metal exposure of
marine phytoplankton.
Experimental/Analytical Activities All data will come from shore lab, most of it within 1-2 years of sample collection (an
archive is maintained for future uses).
Overall summary of results All findings will come after shore-based trace metal analyses of seawater samples. Australian Waters (Stns. 1-6, 8-11) All findings will come after shore-based trace metal analyses of seawater samples. Fijian Waters (Stns. 15, 16, 17, 24, 25) All findings will come after shore-based trace metal analyses of seawater samples. New Caledonian Waters (Stns. 7, 12, 13, 14) All findings will come after shore-based trace metal analyses of seawater samples. Niue Waters (Stns. 19, 20) All findings will come after shore-based trace metal analyses of seawater samples. Tongan Waters (Stns. 18, 22) All findings will come after shore-based trace metal analyses of seawater samples. US Waters (Stn. 21) All findings will come after shore-based trace metal analyses of seawater samples. Vanuatuan Waters (Stn. 26) All findings will come after shore-based trace metal analyses of seawater samples. Wallis & Futuna Waters (Stn. 23) All findings will come after shore-based trace metal analyses of seawater samples.

Appendix: KM0703 Research Activities
p. 25 of 45
Letelier Lab (Oregon State University) Support
Primary funding for our participation in this cruise is provided by a National Science Foundation grant to R.M. Letelier and Y.H. Spitz (contact A. White or R. Letelier for grant number). Funding for travel and a portion of shipping costs were provided by J.P. Zehr
Personnel
Name Institution email address Angelicque E.White* Oregon State University [email protected]
Sampling Activities Letelier/White Group: Overall Sampling Effort Sample Number Notes Particulate Phosphorus 101 GFF, for determination of the composition of
particulate phosphorus pools Phycoerythrin 52 GFF Absorbance Spectra/HPLC
44 GFF, for validation of optical data; most of these samples will be used for abs. spec while select samples will be analyzed via HPLC
Particulate Carbon/Nitrogen
6 Select samples from net tow collections of Trichodesmium colonies
Letelier/White Group Sampling Activities: Australian Waters (Stns. 1-6, 8-11) Sample Number Notes N/A 0 we did not participate in the first leg of this
cruise Letelier/White Group Sampling Activities: Fijian Waters (Stns. 15, 16, 17, 24, 25) Sample Number Notes Particulate Phosphorus 46 See summary Phycoerythrin 25 See summary Absorbance Spectra/HPLC
21 See summary
Carbon/Nitrogen 5 See summary

Appendix: KM0703 Research Activities
p. 26 of 45
Letelier/White Group Sampling Activities: New Caledonian Waters (Stns. 7, 12, 13, 14) Sample Number Notes Particulate Phosphorus 12 See summary Phycoerythrin 6 See summary Absorbance Spectra/HPLC
5 See summary
Carbon/Nitrogen 1 See summary Letelier/White Group Sampling Activities: Niue Waters (Stns. 19, 20) Sample Number Notes Particulate Phosphorus 12 See summary Phycoerythrin 6 See summary Absorbance Spectra/HPLC
3 See summary
Letelier/White Group Sampling Activities: Tongan Waters (Stns. 18, 22) Sample Number Notes Particulate Phosphorus 13 See summary Phycoerythrin 6 See summary Absorbance Spectra/HPLC
6 See summary
Letelier/White Group Sampling Activities: US Waters (Stn. 21) Sample Number Notes Particulate Phosphorus 6 See summary Phycoerythrin 3 See summary Absorbance Spectra/HPLC
3 See summary
Letelier/White Group Sampling Activities: Vanuatuan Waters (Stn. 26) Sample Number Notes Particulate Phosphorus 6 See summary Phycoerythrin 3 See summary Absorbance Spectra/HPLC
3 See summary

Appendix: KM0703 Research Activities
p. 27 of 45
Letelier/White Group Sampling Activities: Wallis & Futuna Waters (Stn. 23) Sample Number Notes Particulate Phosphorus 6 See summary Phycoerythrin 3 See summary Absorbance Spectra/HPLC
3 See summary
Experimental/Analytical Activities Overall analytical/experimental effort No onboard analyses or experiments were carried out by our group. All collected samples were frozen for shore-based laboratory analysis . An optical package designed to characterize the absorption, scattering and fluorescence properties of particles in the upper 100-150m of the water column was deployed at stations 13-26. No water was collected during these optical surveys. Australian Waters (Stns. 1-6, 8-11) Our group was not present for this leg of the cruise. Fijian Waters (Stns. 15, 16, 17, 24, 25) Collected water, deployed optics instrumentation New Caledonian Waters (Stns. 7, 12, 13, 14) Collected water, deployed optics instrumentation Niue Waters (Stns. 19, 20) Collected water, deployed optics instrumentation Tongan Waters (Stns. 18, 22) Collected water, deployed optics instrumentation US Waters (Stn. 21) Collected water, deployed optics instrumentation Vanuatuan Waters (Stn. 26) Collected water, deployed optics instrumentation. Wallis & Futuna Waters (Stn. 23) Collected water, deployed optics instrumentation
Preliminary Results All of the samples collected will be analyzed at Oregon State University (OSU). All optical
data collected will also be processed and quality controlled at OSU. Once these analyses are

Appendix: KM0703 Research Activities
p. 28 of 45
performed we expect to have a composite data set including: phosphorus (P) composition of particulate matter (i.e. relative proportions of nucleic acid-P, lipid-P, inorganic P, acid-insoluble P,…), phycoerythrin concentrations (extracted data will be compared to optical assessments of phycoerythrin fluorescence), distribution of pigments as assessed by high pressure liquid chromatography and the absorbance spectra of particulate matter. At all possible opportunities, we also collected Trichodesmium biomass for analysis of elemental (carbon, nitrogen and P-components) and pigment composition. In combination these data will provide a rough assessment of the P-status of Trichodesmium as compared to the bulk phytoplankton community and the optical characteristics of the water column. Overall summary of results As our data have not been processed, there is nothing to summarize as of yet. Again, we did not sample in Australian waters

Appendix: KM0703 Research Activities
p. 29 of 45
Tawnya Peterson (UCSC) Support:
Support provided by the Government of Canada through a NSERC postdoctoral fellowship to TDP, shipping costs and travel covered by J. Zehr (National Science Foundation, Gordon and Betty Moore Foundation).
Personnel Name Institution email address Tawnya Peterson Univ California Santa Cruz [email protected] Pia Moisander Univ California Santa Cruz [email protected] Ian Hewson Univ California Santa Cruz [email protected] Ryan Paerl Univ California Santa Cruz [email protected] Angelicque White Oregon State University [email protected]
Sampling Activities Overall Sampling Effort Sample Number Notes Phytoplankton species composition
157 Live samples run on imaging flow cytometer; no samples returned to the United States
Phytoplankton active fluorescence
169 Live samples run on fast repetition rate fluorometer; no samples returned to the United States
Chlorophyll a 40 Glass fiber filters with seawater particles; stored in Zehr dewar to return to the United States
Carbon fixation 146 Samples run at sea; waste to be disposed of in Hawai’i

Appendix: KM0703 Research Activities
p. 30 of 45
Tawnya Peterson Sampling Activities: Australian Waters (Stns. 1-6, 8-11) Sample Number Notes Phytoplankton species composition
48 Live samples run on imaging flow cytometer; no samples returned to the United States
Phytoplankton active fluorescence
40 Live samples run on fast repetition rate fluorometer; no samples returned to the United States
Chlorophyll a 6 Glass fiber filters with seawater particles; stored in Zehr dewar to return to the United States
Carbon fixation 72 Samples run at sea; waste to be disposed of in Hawai’i
Tawnya Peterson Sampling Activities: Fijian Waters (Stns. 15, 16, 17, 24, 25) Sample Number Notes Phytoplankton species composition
48 Live samples run on imaging flow cytometer; no samples returned to the United States
Phytoplankton active fluorescence
38 Live samples run on fast repetition rate fluorometer; no samples returned to the United States
Chlorophyll a 18 Glass fiber filters with seawater particles; stored in Zehr dewar to return to the United States
Carbon fixation 30 Samples run at sea; waste to be disposed of in Hawai’i
Optical profile 3 Active fluorescence Tawnya Peterson Sampling Activities: New Caledonian Waters (Stns. 7, 12, 13, 14) Sample Number Notes Phytoplankton species composition
24 Live samples run on imaging flow cytometer; no samples returned to the United States
Phytoplankton active fluorescence
32 Live samples run on fast repetition rate fluorometer; no samples returned to the United States
Chlorophyll a 0 Glass fiber filters with seawater particles; stored in Zehr dewar to return to the United States
Carbon fixation 8 Samples run at sea; waste to be disposed of in Hawai’i

Appendix: KM0703 Research Activities
p. 31 of 45
Tawnya Peterson Sampling Activities: Niue Waters (Stns. 19, 20) Sample Number Notes Phytoplankton species composition
12 Live samples run on imaging flow cytometer; no samples returned to the United States
Phytoplankton active fluorescence
14 Live samples run on fast repetition rate fluorometer; no samples returned to the United States
Chlorophyll a 6 Glass fiber filters with seawater particles; stored in Zehr dewar to return to the United States
Carbon fixation 12 Samples run at sea; waste to be disposed of in Hawai’i
Optical profile 2 Active fluorescence Tawnya Peterson Sampling Activities: Tongan Waters (Stns. 18, 22) Sample Number Notes Phytoplankton species composition
12 Live samples run on imaging flow cytometer; no samples returned to the United States
Phytoplankton active fluorescence
11 Live samples run on fast repetition rate fluorometer; no samples returned to the United States
Chlorophyll a 0 Glass fiber filters with seawater particles; stored in Zehr dewar to return to the United States
Carbon fixation 0 Samples run at sea; waste to be disposed of in Hawai’i
Optical profile 2 Active fluorescence

Appendix: KM0703 Research Activities
p. 32 of 45
Tawnya Peterson Sampling Activities: US Waters (Stn. 21) Sample Number Notes Phytoplankton species composition
6 Live samples run on imaging flow cytometer; no samples returned to the United States
Phytoplankton active fluorescence
4 Live samples run on fast repetition rate fluorometer; no samples returned to the United States
Chlorophyll a 6 Glass fiber filters with seawater particles; stored in Zehr dewar to return to the United States
Carbon fixation 12 Samples run at sea; waste to be disposed of in Hawai’i
Optical profile 1 Active fluorescence Tawnya Peterson Sampling Activities: Vanuatuan Waters (Stn. 26) Sample Number Notes Phytoplankton species composition
6 Live samples run on imaging flow cytometer; no samples returned to the United States
Phytoplankton active fluorescence
8 Live samples run on fast repetition rate fluorometer; no samples returned to the United States
Chlorophyll a 0 Glass fiber filters with seawater particles; stored in Zehr dewar to return to the United States
Carbon fixation 0 Samples run at sea; waste to be disposed of in Hawai’i
Optical profile 1 Active fluorescence
Appendix: KM0703 Research Activities
p. 33 of 45
Tawnya Peterson Sampling Activities: Wallis & Futuna Waters (Stn. 23) Sample Number Notes Phytoplankton species composition
6 Live samples run on imaging flow cytometer; no samples returned to the United States
Phytoplankton active fluorescence
8 Live samples run on fast repetition rate fluorometer; no samples returned to the United States
Chlorophyll a 0 Glass fiber filters with seawater particles; stored in Zehr dewar to return to the United States
Carbon fixation 0 Samples run at sea; waste to be disposed of in Hawai’i
Optical profile 1 Active fluorescence
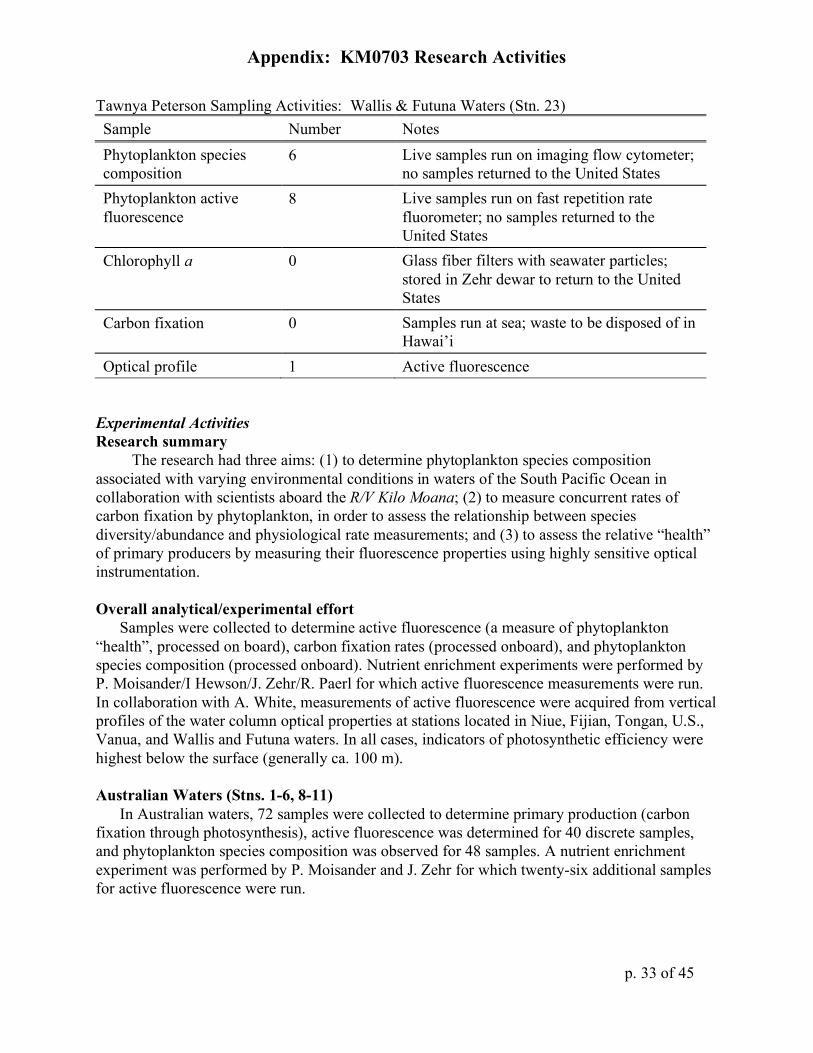
Experimental Activities Research summary
The research had three aims: (1) to determine phytoplankton species composition associated with varying environmental conditions in waters of the South Pacific Ocean in collaboration with scientists aboard the R/V Kilo Moana; (2) to measure concurrent rates of carbon fixation by phytoplankton, in order to assess the relationship between species diversity/abundance and physiological rate measurements; and (3) to assess the relative “health” of primary producers by measuring their fluorescence properties using highly sensitive optical instrumentation.
Overall analytical/experimental effort
Samples were collected to determine active fluorescence (a measure of phytoplankton “health”, processed on board), carbon fixation rates (processed onboard), and phytoplankton species composition (processed onboard). Nutrient enrichment experiments were performed by P. Moisander/I Hewson/J. Zehr/R. Paerl for which active fluorescence measurements were run. In collaboration with A. White, measurements of active fluorescence were acquired from vertical profiles of the water column optical properties at stations located in Niue, Fijian, Tongan, U.S., Vanua, and Wallis and Futuna waters. In all cases, indicators of photosynthetic efficiency were highest below the surface (generally ca. 100 m).
Australian Waters (Stns. 1-6, 8-11)
In Australian waters, 72 samples were collected to determine primary production (carbon fixation through photosynthesis), active fluorescence was determined for 40 discrete samples, and phytoplankton species composition was observed for 48 samples. A nutrient enrichment experiment was performed by P. Moisander and J. Zehr for which twenty-six additional samples for active fluorescence were run.

Appendix: KM0703 Research Activities
p. 34 of 45
Fijian Waters (Stns. 15, 16, 17, 24, 25) In Fijian waters, 38 samples were collected to determine active fluorescence, 30 for carbon
fixation rates, 7 for chlorophyll, and 31 for phytoplankton species composition.
New Caledonian Waters (Stns. 7, 12, 13, 14) In New Caledonian waters, 32 samples were collected to determine active fluorescence, 8 for
carbon fixation rates, 4 for chlorophyll, and 24 for phytoplankton species composition.
Niue Waters (Stns. 19, 20) In Niue waters, 14 samples were collected to determine active fluorescence, 12 for carbon
fixation rates, 6 for chlorophyll, and 12 for phytoplankton species composition.
Tongan Waters (Stns. 18, 22) In Tongan waters, 11 samples were collected to determine active fluorescence, and 12
samples for phytoplankton species composition.
US Waters (Stn. 21) In US waters, 4 samples were collected to determine active fluorescence, 12 for carbon
fixation rates, 6 for chlorophyll, and 6 for phytoplankton species composition.
Vanuatuan Waters (Stn. 26) In Vanua waters, 8 samples were collected to determine active fluorescence and 6 for
phytoplankton species composition.
Wallis & Futuna Waters (Stn. 23) In Wallis and Futuna waters, 8 samples were collected to determine active fluorescence and 6
for phytoplankton species composition.
Preliminary Results Overall summary of results Phytoplankton species counts and data reduction will be performed in the laboratory and should take 6 months to complete. Based on preliminary observations, the deep chlorophyll maximum was most often composed of large pennate diatoms (siliceous plankton). Two large blooms of the nitrogen-fixing cyanobacteria Trichodesmium were sampled: one in New Caledonian waters, and one in Fijian waters. The first was accompanied by an abundance of siliceous plankton whereas the latter was not. Active fluorescence measurements indicated that the latter bloom was in better physiological condition compared to the former. Rates of carbon fixation by large cells (> 5 µm) were similar to those of cells < 5 µm during the first Trichodesmium bloom. These preliminary results will be quality-controlled back in the laboratory at UC Santa Cruz. Australian Waters (Stns. 1-6, 8-11) No major differences in phytoplankton physiological status were observed during a nutrient enrichment experiment carried out by P. Moisander/J. Zehr at Station 8, indicating that photosynthetic rates were not significantly improved by nutrient enrichment (see report by P.

Appendix: KM0703 Research Activities
p. 35 of 45
Moisander). Relatively low rates of primary production were observed at Stations 2, 4, 6 compared to sites in Fijian waters. Fijian Waters (Stns. 15, 16, 17, 24, 25) Relatively high rates of primary production were observed in these waters. On April 12 and 13, high biomass of Trichodesmium and Crocosphaera were observed, respectively. New Caledonian Waters (Stns. 7, 12, 13, 14) Station 7: phytoplankton were mainly small flagellates and small pinnate diatoms (siliceous). Station 12: large flagellates and centric diatoms were observed. Some calcium-carbonate-bearing coccolithophores were noted. Niue Waters (Stns. 19, 20) Rates of carbon fixation and species composition will be assessed in the laboratory within 1 month and 6 months, respectively. Tongan Waters (Stns. 18, 22) Rates of carbon fixation were lower in waters of Tonga and the US compared to other sites. Rates will be assessed in the laboratory within 1 month. Phytoplankton species composition will be determined within 6 months. US Waters (Stn. 21) Small phytoplankton cells were observed in the surface waters, while larger pennate diatoms were abundant in the deep chlorophyll maximum. Rates of carbon fixation and phytoplankton species composition will be available in 1 and 6 months, respectively. Vanuatuan Waters (Stn. 26) Species composition will be assessed in the laboratory within 6 months. Wallis & Futuna Waters (Stn. 23) Species composition will be assessed in the laboratory within 6 months.

Appendix: KM0703 Research Activities
p. 36 of 45
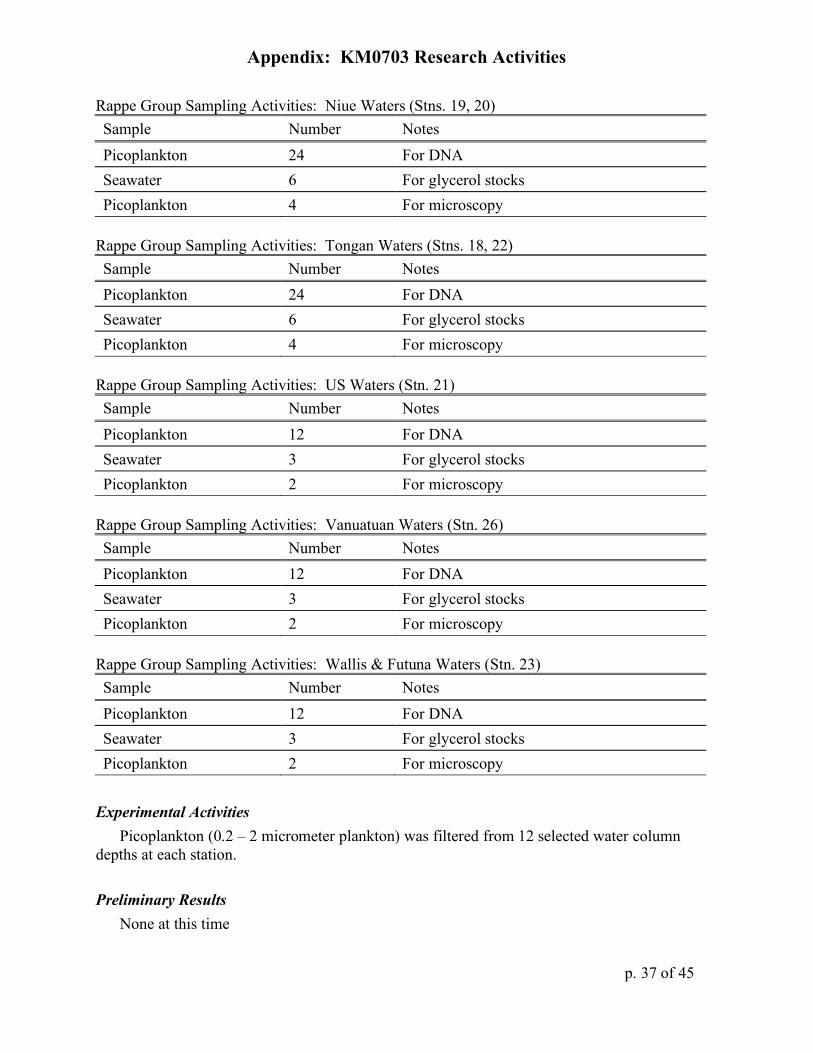
Rappe Lab (University of Hawaii) Support:
National Science Foundation: CMORE grant
Personnel Name Institution email address Darin Hayakawa University of Hawaii [email protected] Jamie Becker University of Hawaii [email protected]
Sampling Activities Rappe Group: Overall Sampling Effort Sample Number Notes Picoplankton 312 For DNA Seawater 78 For glycerol stocks Picoplankton 52 For microscopy
Rappe Group Sampling Activities: Australian Waters (Stns. 1-6, 8-11) Sample Number Notes Picoplankton 120 For DNA Seawater 30 For glycerol stocks Picoplankton 20 For microscopy
Rappe Group Sampling Activities: Fijian Waters (Stns. 15, 16, 17, 24, 25) Sample Number Notes Picoplankton 60 For DNA Seawater 15 For glycerol stocks Picoplankton 10 For microscopy
Rappe Group Sampling Activities: New Caledonian Waters (Stns. 7, 12, 13, 14) Sample Number Notes Picoplankton 48 For DNA Seawater 12 For glycerol stocks Picoplankton 8 For microscopy
Appendix: KM0703 Research Activities
p. 37 of 45
Rappe Group Sampling Activities: Niue Waters (Stns. 19, 20) Sample Number Notes Picoplankton 24 For DNA Seawater 6 For glycerol stocks Picoplankton 4 For microscopy
Rappe Group Sampling Activities: Tongan Waters (Stns. 18, 22) Sample Number Notes Picoplankton 24 For DNA Seawater 6 For glycerol stocks Picoplankton 4 For microscopy
Rappe Group Sampling Activities: US Waters (Stn. 21) Sample Number Notes Picoplankton 12 For DNA Seawater 3 For glycerol stocks Picoplankton 2 For microscopy
Rappe Group Sampling Activities: Vanuatuan Waters (Stn. 26) Sample Number Notes Picoplankton 12 For DNA Seawater 3 For glycerol stocks Picoplankton 2 For microscopy
Rappe Group Sampling Activities: Wallis & Futuna Waters (Stn. 23) Sample Number Notes Picoplankton 12 For DNA Seawater 3 For glycerol stocks Picoplankton 2 For microscopy
Experimental Activities Picoplankton (0.2 – 2 micrometer plankton) was filtered from 12 selected water column
depths at each station.
Preliminary Results None at this time

Appendix: KM0703 Research Activities
p. 38 of 45
Waite Group (University of Western Australia) Support: Australian Research Council Discovery Grant to A. Waite.
Personnel
Name Institution email address Cécile Rousseaux University of Western Australia
(UWA) [email protected]
Isabelle Biegala Institut de Recherche au Développement (IRD)
Sampling Activities Waite Group: Overall Sampling Effort Sample Number Notes Samples for grazing experiment
280 In total 14 grazing experiments have been conducted at seven different station.
Nutrients 126 9 nutrients samples (10 ml each) were taken per grazing experiment.
Microplankton abundances
28 2 samples (220 ml each) were taken per grazing experiment.
UV experiment 448 In total 4 UV experiments have been conducted at two different stations.

Appendix: KM0703 Research Activities
p. 39 of 45
Waite Group Sampling Activities: Australian Waters (Stns. 1-6, 8-11) Sample Number Notes Samples for grazing experiment
120 In total 6 grazing experiments have been conducted in these waters and three different station were sampled.
Nutrients 54 9 nutrients samples (10 ml each) were taken per grazing experiment.
Microplankton abundances
12 2 samples (220 ml each) were taken per grazing experiment.
Waite Group Sampling Activities: Fijian Waters (Stns. 15, 16, 17, 24, 25) Sample Number Notes Samples for grazing experiment
40 In total 2 grazing experiments have been conducted in these waters and one station was sampled.
Nutrients 18 9 nutrients samples (10 ml each) were taken per grazing experiment.
Microplankton abundances
4 2 samples (220 ml each) were taken per grazing experiment.
UV experiment 224 In total 2 UV experiments have been conducted in these waters and one station was sampled.
Waite Group Sampling Activities: New Caledonian Waters (Stns. 7, 12, 13, 14) Sample Number Notes Samples for grazing experiment
40 In total 2 grazing experiments have been conducted in these waters and one station was sampled.
Nutrients 18 9 nutrients samples (10 ml each) were taken per grazing experiment.
Microplankton abundances
4 2 samples (220 ml each) were taken per grazing experiment.
UV experiment 224 In total 2 UV experiments have been conducted in these waters and one station was sampled.
TSA-FISH analysis 6 Filters from three size fraction: > 10 µm, 3 µm and 0.2 µm.

Appendix: KM0703 Research Activities
p. 40 of 45
Waite Group Sampling Activities: Niue Waters (Stns. 19, 20) Sample Number Notes Samples for grazing experiment
40 In total 2 grazing experiments have been conducted in these waters and one station was sampled.
Nutrients 18 9 nutrients samples (10 ml each) were taken per grazing experiment
Microplankton abundances
4 2 samples (220 ml each) were taken per grazing experiment
TSA-FISH analysis 6 Filters from three size fraction: > 10 µm, 3 µm and 0.2 µm. Waite Group Sampling Activities: Tongan Waters (Stns. 18, 22) Sample Number Notes Samples for grazing experiment
40 In total 2 grazing experiments have been conducted in these waters and one station was sampled.
Nutrients 18 9 nutrients samples (10 ml each) were taken per grazing experiment
Microplankton abundances
4 2 samples (220 ml each) were taken per grazing experiment
TSA-FISH analysis 6 Filters from three size fraction: > 10 µm, 3 µm and 0.2 µm. Waite Group Sampling Activities: US Waters (Stn. 21) No samples collected Waite Group Sampling Activities: Vanuatuan Waters (Stn. 26) No samples collected Waite Group Sampling Activities: Wallis & Futuna Waters (Stn. 23) No samples collected.
Experimental Activities Overall analytical/experimental effort
The main objective of our project is to determine the importance of grazing rates by microzooplankton (organisms < 200 µm) in the South Pacific Ocean using the dilution technique of Landry and Hassett (1982). This technique is based on dilution of natural samples that are allowed to incubate for 24 hours. We use the pigment concentrations to make a linear regression and to determine a growth rate (k) and a grazing rate (g). During this cruise we used chlorophyll a as an indicator of the grazing on the total phytoplankton community. The chlorophyll a was quantified, after extraction in acetone 90:10, using a fluorometer. Samples of the incubation bottles were also taken for flow cytometry analysis. For each experiment, nutrients (phosphate

Appendix: KM0703 Research Activities
p. 41 of 45
and ammonium) were added to a set of bottles to account for possible nutrient depletion occurring during the incubation. Nutrients samples were taken at the beginning and at the end of the incubation. Microzooplankton samples were also taken at the beginning and at the end of the incubation to determine the type and the concentration of grazers present in our incubation bottles. For six grazing experiments (at three different stations), 2.3 l water samples were also incubated for future TSA-FISH analysis by Isabelle Biegala (IRD). This technique uses fluorescent probe to detect unicellular diazotrophs cyanobacteria. During this cruise, filters were obtained from three different size fraction: >10µm, 3 µm and 0.2 µm.
The second type of experiment we conducted during this cruise aimed at determining the impact of ultraviolet light on the viability of picoplanktonic cells. We used the technique of Agusti and Sanchez (2002) to evaluate the number of living cells versus dead cells in samples incubated at different light and UV intensities. Samples were taken every three hours during minimum nine hours. The samples are stored in liquid nitrogen until analysis using flow cytometry.
Waite Group Experimental Activities: Australian Waters (Stns. 1-6, 8-11)
In total, six grazing experiments have been conducted in these waters. Three stations were sampled (stns. 2, 4, 9) for both the surface and the deep chlorophyll maxima (DCM) depth. Nutrients were added to three bottles. Nine nutrients samples were taken during each grazing experiment to ensure that the nutrients were not depleted. Two microplankton samples (one at T0 and one at T24) were taken per grazing experiment for further analysis using an inverted microscope.
Waite Group Experimental Activities: Fijian Waters (Stns. 15, 16, 17, 24, 25)
In total, two grazing experiments have been conducted in these waters. One station was sampled (stns. 16) for both the surface and the deep chlorophyll maxima (DCM) depth. Nutrients were added to three bottles. Water was filtered on GF/F and chlorophyll a was extracted using acetone 90:10. The chlorophyll a concentration was determined using a fluorometer. Samples for flow cytometry analysis are stored in liquid nitrogen until analysis. Nine nutrients samples were taken during each grazing experiment to ensure that the nutrients were not depleted. Two microplankton samples (one at T0 and one at T24) were taken per grazing experiment for further analysis using an inverted microscope.
Two UV experiments were also conducted in the Fijian Waters. One station was sampled (stns. 25) at both the DCM and the surface waters. Water was incubated during nine hours at different UV intensities and a mesh was used to adapt the light intensity for the samples coming from the DCM. Samples were taken every three hours during nine hours. The samples are stored in liquid nitrogen until analysis.
Waite Group Experimental Activities: New Caledonian Waters (Stns. 7, 12, 13, 14)
In total, two grazing experiments have been conducted in these waters. One station was sampled (stns. 14) for both the surface and the deep chlorophyll maxima (DCM) depth. Nutrients were added to three bottles. Water was filtered on GF/F and chlorophyll a was extracted using acetone 90:10. The chlorophyll a concentration was determined using a fluorometer. Samples for flow cytometry analysis are stored in liquid nitrogen until analysis. Nine nutrients samples were taken during each grazing experiment to ensure that the nutrients were not depleted. Two

Appendix: KM0703 Research Activities
p. 42 of 45
microplankton samples (one at T0 and one at T24) were taken per grazing experiment for further analysis using an inverted microscope. Samples from the surface and the DCM were also incubated and filtered for future TSA-FISH analysis.
Two UV experiments were also conducted in the New Caledonian Waters. One station was sampled (stns. 7) at both the DCM and the surface waters. Water was incubated during nine hours at different UV intensities and a mesh was used to adapt the light intensity for the samples coming from the DCM. Samples were taken every three hours during nine hours. The samples are stored in liquid nitrogen until analysis. Waite Group Experimental Activities: Niue Waters (Stns. 19, 20)
In total, two grazing experiments have been conducted in these waters. One station was sampled (stns. 19) for both the surface and the deep chlorophyll maxima (DCM) depth. Nutrients were added to three bottles. Water was filtered on GF/F and chlorophyll a was extracted using acetone 90:10. The chlorophyll a concentration was determined using a fluorometer. Samples for flow cytometry analysis are stored in liquid nitrogen until analysis. Nine nutrients samples were taken during each grazing experiment to ensure that the nutrients were not depleted. Two microplankton samples (one at T0 and one at T24) were taken per grazing experiment for further analysis using an inverted microscope. Samples from the surface and the DCM were also incubated and filtered for future TSA-FISH analysis.
Waite Group Experimental Activities: Tongan Waters (Stns. 18, 22)
In total, two grazing experiments have been conducted in these waters. One station was sampled (stns. 22) for both the surface and the deep chlorophyll maxima (DCM) depth. Nutrients were added to three bottles. Water was filtered on GF/F and chlorophyll a was extracted using acetone 90:10. The chlorophyll a concentration was determined using a fluorometer. Samples for flow cytometry analysis are stored in liquid nitrogen until analysis. Nine nutrients samples were taken during each grazing experiment to ensure that the nutrients were not depleted. Two microplankton samples (one at T0 and one at T24) were taken per grazing experiment for further analysis using an inverted microscope. Samples from the surface and the DCM were also incubated and filtered for future TSA-FISH analysis.
Waite Group Experimental Activities: US Waters (Stn. 21)
No experiments were conducted in these waters.
Waite Group Experimental Activities: Vanuatuan Waters (Stn. 26) No experiments were conducted in these waters
Waite Group Experimental Activities: Wallis & Futuna Waters (Stn. 23) No experiments were conducted in these waters
Preliminary Results The results of chlorophyll concentration were obtained on board and therefore an estimate of
the grazing rates and growth rates can be given. The nutrient analysis will be done at the University of Western Australia in September 2007. All the samples that have been collected for
Appendix: KM0703 Research Activities
p. 43 of 45
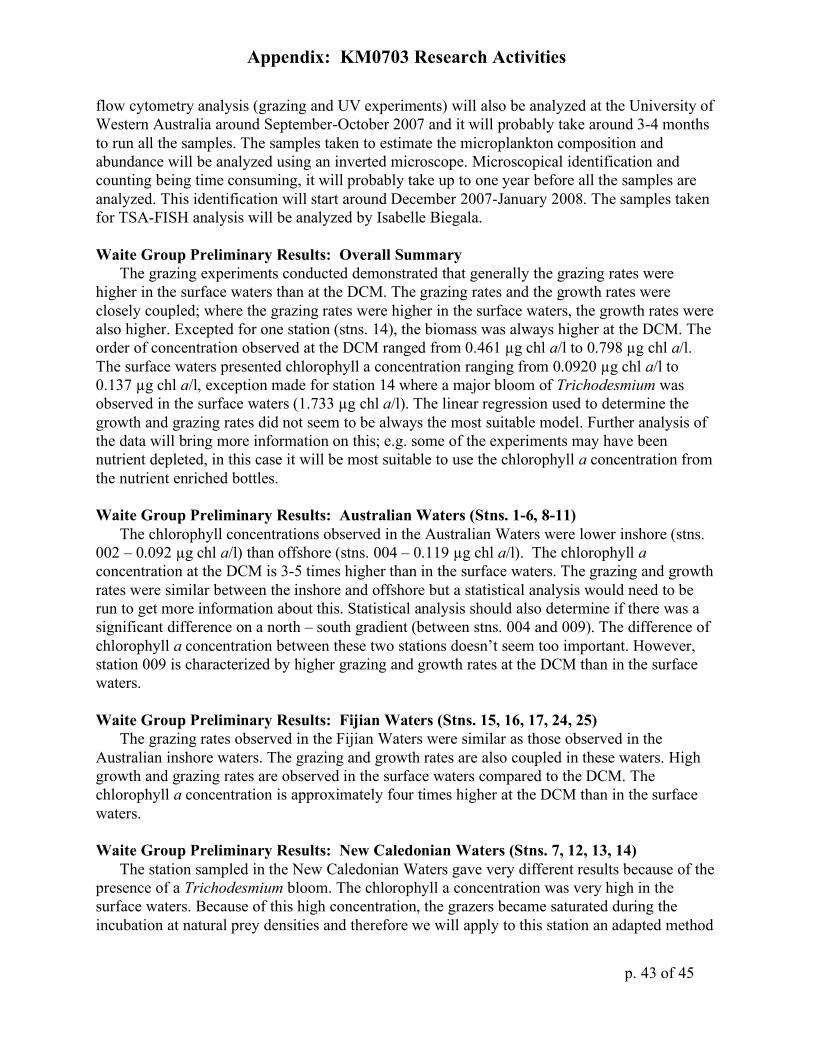
flow cytometry analysis (grazing and UV experiments) will also be analyzed at the University of Western Australia around September-October 2007 and it will probably take around 3-4 months to run all the samples. The samples taken to estimate the microplankton composition and abundance will be analyzed using an inverted microscope. Microscopical identification and counting being time consuming, it will probably take up to one year before all the samples are analyzed. This identification will start around December 2007-January 2008. The samples taken for TSA-FISH analysis will be analyzed by Isabelle Biegala.
Waite Group Preliminary Results: Overall Summary
The grazing experiments conducted demonstrated that generally the grazing rates were higher in the surface waters than at the DCM. The grazing rates and the growth rates were closely coupled; where the grazing rates were higher in the surface waters, the growth rates were also higher. Excepted for one station (stns. 14), the biomass was always higher at the DCM. The order of concentration observed at the DCM ranged from 0.461 µg chl a/l to 0.798 µg chl a/l. The surface waters presented chlorophyll a concentration ranging from 0.0920 µg chl a/l to 0.137 µg chl a/l, exception made for station 14 where a major bloom of Trichodesmium was observed in the surface waters (1.733 µg chl a/l). The linear regression used to determine the growth and grazing rates did not seem to be always the most suitable model. Further analysis of the data will bring more information on this; e.g. some of the experiments may have been nutrient depleted, in this case it will be most suitable to use the chlorophyll a concentration from the nutrient enriched bottles.
Waite Group Preliminary Results: Australian Waters (Stns. 1-6, 8-11)
The chlorophyll concentrations observed in the Australian Waters were lower inshore (stns. 002 – 0.092 µg chl a/l) than offshore (stns. 004 – 0.119 µg chl a/l). The chlorophyll a concentration at the DCM is 3-5 times higher than in the surface waters. The grazing and growth rates were similar between the inshore and offshore but a statistical analysis would need to be run to get more information about this. Statistical analysis should also determine if there was a significant difference on a north – south gradient (between stns. 004 and 009). The difference of chlorophyll a concentration between these two stations doesn’t seem too important. However, station 009 is characterized by higher grazing and growth rates at the DCM than in the surface waters.
Waite Group Preliminary Results: Fijian Waters (Stns. 15, 16, 17, 24, 25)
The grazing rates observed in the Fijian Waters were similar as those observed in the Australian inshore waters. The grazing and growth rates are also coupled in these waters. High growth and grazing rates are observed in the surface waters compared to the DCM. The chlorophyll a concentration is approximately four times higher at the DCM than in the surface waters.
Waite Group Preliminary Results: New Caledonian Waters (Stns. 7, 12, 13, 14)
The station sampled in the New Caledonian Waters gave very different results because of the presence of a Trichodesmium bloom. The chlorophyll a concentration was very high in the surface waters. Because of this high concentration, the grazers became saturated during the incubation at natural prey densities and therefore we will apply to this station an adapted method

Appendix: KM0703 Research Activities
p. 44 of 45
to account for this type of results. The grazing and growth rates observed for the DCM were slightly lower than those of the Fijian Waters. The grazing and growth rates are also coupled in these waters. The chlorophyll a concentration is approximately two times higher in the surface waters than at the DCM.
Waite Group Preliminary Results: Niue Waters (Stns. 19, 20)
The grazing rates observed in the Niue Waters were similar as those observed in the Fijian waters. The grazing and growth rates are also coupled in these waters. High growth and grazing rates are observed in the surface waters compared to the DCM. The chlorophyll a concentration observed in the surface waters is very low - ten times lower than the one observed at the DCM.
Waite Group Preliminary Results: Tongan Waters (Stns. 18, 22)
The results for this station have not been treated yet and should be treated within the next month.
Waite Group Preliminary Results: US Waters (Stn. 21)
No experiments were conducted in these waters.
Waite Group Preliminary Results: Vanuatuan Waters (Stn. 26) No experiments were conducted in these waters.
Waite Group Preliminary Results: Wallis & Futuna Waters (Stn. 23) No experiments were conducted in these waters.

Appendix: KM0703 Research Activities
p. 45 of 45
Worden Group (RSMAS, Leg 1) Support: Gordon and Betty Moore Young Investigator Award
Sampling activities Our goal was to study the diversity and dynamics of picoeukaryotic phytoplankton in
tropical/subtropical settings. We sampled at all stations for HPLC, DNA, FISH, and flow cytometry. Sample depths were based on water column characteristics, with attention to the depth of the deep chlorophyll maximum. We also cell sorted for RNA and Genomic DNA samples (picoeukaryotic only) – potentially for use in shotgun libraries and EST libraries.
John Waterbury (WHOI, Leg 1) Phytoplankton community sampling
John Waterbury collected phytoplankton in surface net tows, by gentle reverse filtration of surface water collected with the high volume pump system, and from selected depths in the upper water column sampled with the CTD/rosette system. Selected species were isolated for lab cultivation, and larger samples were filtered for microscopic characterization of the phytoplankton community.