biologically-inspired signal processor using lateral
TRANSCRIPT

BIOLOGICALLY-INSPIRED SIGNAL PROCESSOR
USING LATERAL INHIBITION AND INTEGRATIVE
FUNCTION MECHANISMS FOR HIGH INSTANTANEOUS
DYNAMIC RANGE
Kiran George
Department of Computer Engineering
California State University
Fullerton, CA 92831, USA
Chien-In Henry Chen
Department of Electrical Engineering
Wright State University
Dayton, Ohio 45435 [email protected]
Submitted: Oct. 11, 2011 Accepted: Nov. 2, 2011 Published: Dec. 1, 2011
INTERNATIONAL JOURNAL ON SMART SENSING AND INTELLIGENT SYSTEMS VOL. 4, NO. 4, DECEMBER 2011
547
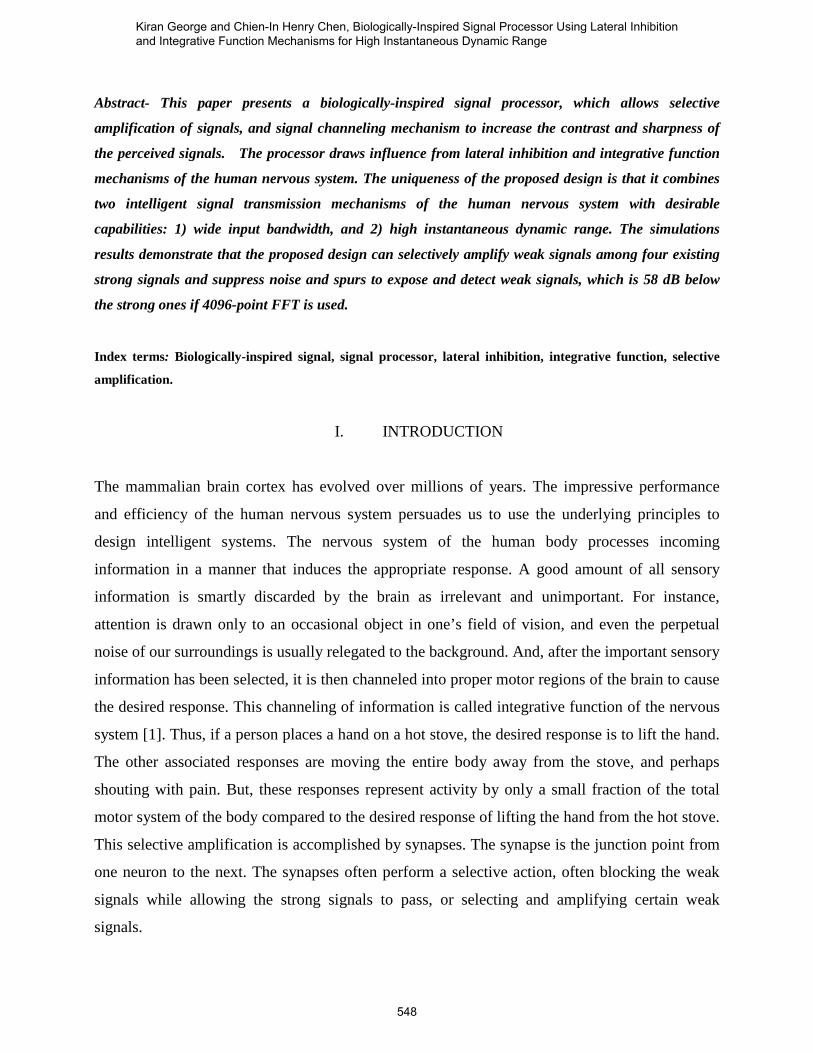
Abstract- This paper presents a biologically-inspired signal processor, which allows selective
amplification of signals, and signal channeling mechanism to increase the contrast and sharpness of
the perceived signals. The processor draws influence from lateral inhibition and integrative function
mechanisms of the human nervous system. The uniqueness of the proposed design is that it combines
two intelligent signal transmission mechanisms of the human nervous system with desirable
capabilities: 1) wide input bandwidth, and 2) high instantaneous dynamic range. The simulations
results demonstrate that the proposed design can selectively amplify weak signals among four existing
strong signals and suppress noise and spurs to expose and detect weak signals, which is 58 dB below
the strong ones if 4096-point FFT is used.
Index terms: Biologically-inspired signal, signal processor, lateral inhibition, integrative function, selective
amplification.
I. INTRODUCTION
The mammalian brain cortex has evolved over millions of years. The impressive performance
and efficiency of the human nervous system persuades us to use the underlying principles to
design intelligent systems. The nervous system of the human body processes incoming
information in a manner that induces the appropriate response. A good amount of all sensory
information is smartly discarded by the brain as irrelevant and unimportant. For instance,
attention is drawn only to an occasional object in one’s field of vision, and even the perpetual
noise of our surroundings is usually relegated to the background. And, after the important sensory
information has been selected, it is then channeled into proper motor regions of the brain to cause
the desired response. This channeling of information is called integrative function of the nervous
system [1]. Thus, if a person places a hand on a hot stove, the desired response is to lift the hand.
The other associated responses are moving the entire body away from the stove, and perhaps
shouting with pain. But, these responses represent activity by only a small fraction of the total
motor system of the body compared to the desired response of lifting the hand from the hot stove.
This selective amplification is accomplished by synapses. The synapse is the junction point from
one neuron to the next. The synapses often perform a selective action, often blocking the weak
signals while allowing the strong signals to pass, or selecting and amplifying certain weak
signals.
Kiran George and Chien-In Henry Chen, Biologically-Inspired Signal Processor Using Lateral Inhibition and Integrative Function Mechanisms for High Instantaneous Dynamic Range
548

Fig. 1 Transmission of signals to the cortex from two adjacent pinpoint stimuli
The signal transmission mechanism in the nervous system of the human body that blocks the
lateral spread of the excitatory signal, and therefore increasing the degree of contrast in the
sensory pattern perceived in the brain is called lateral inhibition [1]. Lateral inhibition can be
compared with increasing the contrast in images. This mechanism of the nervous system is
demonstrated using an example in Fig. 1, where two adjacent points on the skin (one strongly
stimulated and other weakly stimulated) as well as the area of the sensory cortex (part of the brain
that receives messages from sense organs or messages of touch and temperature from anywhere
in the body) that is excited by signals from two simultaneously stimulated points on the skin.
Two curves are shown: 1) the solid curve is the one without lateral inhibition, and 2) the curve in
dotted line is the one with lateral inhibition (also called surround inhibition).
Fig 2. Basic block diagram of the proposed signal processor
INTERNATIONAL JOURNAL ON SMART SENSING AND INTELLIGENT SYSTEMS VOL. 4, NO. 4, DECEMBER 2011
549

It can be observed that lateral inhibition accentuates the contrast between the areas of peak
stimulation and the surrounding areas, thus greatly increasing the contrast or sharpness of the
perceived spatial signal pattern. This function is performed with a combination of excitatory and
inhibitory synapses. The incoming signal excites the excitatory synapses while at the same time
stimulates the inhibitory synapses to prevent over activity.
One of the applications of integrative function or selective amplification is speaker-dependent
speech recognition, suitable for the voice activated systems in consumer electronics (voice-
activated car navigational system, voice activated wheel chair, etc.), office devices, military
applications, etc. The ability to selectively enhance audio signals of interest while suppressing
spurious ones is an essential prerequisite to widespread practical use of voice activated systems.
Such audio signal discrimination allows for selective amplification of a single source of speech
within a mixture of two or more signals, including noise and other speakers’ voices [2] [3].
Lateral inhibition has wide spread applications in systems that requires noise suppression like in
speech recognition systems [4][5], mobile telephone systems [6], hearing aids [7][8] etc, that
intelligently adapt in the presence of background noise thereby improving the system’s ability to
work under noisy conditions.
High instantaneous dynamic range (IDR) and high frequency resolution in a multiple signal
environment are highly desirable property of the proposed biologically inspired signal processors.
The IDR is the power ratio of the strongest and the weakest signals that can be properly detected
simultaneously. In other words, it is the processor’s ability to detect weak signals in presence of
very strong signals. The IDR is ultimately limited by the strong signal side-lobes and noise spurs,
which may cover the weak signal and make the receiver report a false alarm or miss the
detection, especially in a multiple signal environment.
In this paper we present a signal processor, which combines two smart signal transmission
mechanisms of the human nervous system to perform selective amplification and lateral
inhibition on the incoming signals, with a high multiple signal IDR and a high frequency
resolution. In Section II, we first introduce the signal processor and then the design flow of the
signal processor for implementation of “selective amplification” and “lateral inhibition”.
Kiran George and Chien-In Henry Chen, Biologically-Inspired Signal Processor Using Lateral Inhibition and Integrative Function Mechanisms for High Instantaneous Dynamic Range
550

Simulation results for the signal processor are discussed in Section 3. Conclusion remarks are
presented in Section 4.
II. BIOLOGICALLY-INSPIRED SIGNAL PROCESSOR
The signal processor design (Fig. 2) mainly includes: a 12-b ADC, a Kaiser window, a variable
length FFT, a super-resolution block, a signal frequency detection block, and a post frequency
detection processing block. The ADC samples the incoming signals at the rate of 10 KHz. The
sampled data is transferred into the PC memory through USB/PCI data bus. Once the PC
receives the data, the signal processing tasks are accomplished in software by following the data
path as depicted in Fig. 2. The FFT length (n) can be adjusted based on the frequency resolution
requirement of the application. The input and output data bus of other blocks in the design will
be updated accordingly. The Kaiser Window function multiplies the n data samples with Kaiser
coefficients in order to reduce the spectral leakage by eliminating the discontinuities at the time
window edge. The outputs of the Kaiser block are passed onto the FFT block where spectral
analysis is performed using the FFT operation. The outputs of the FFT block are then passed to
the super-resolution block where signal compensation is performed using a super-resolution
algorithm. After compensation, signal detection is performed to retrieve the frequency
information on the processed data. In the post frequency detection processing block, actions such
as further advanced processing or generation of control signals to invoke other systems are
invoked.
The compensation technique improves the instantaneous dynamic range (IDR) of the receiver by
subtracting the estimated peak (strong) signal frequency response and its spurs from the actual
received frequency response and thereby exposes the second weak signal. Before applying this
technique, pre-calculated FFT output responses of different peak signal frequencies were stored
in a look-up table (LUT). For every spectral response of the incoming signals, the strong (peak)
signal frequency is estimated and then the frequency response of the peak signal is retrieved from
the compensation LUT for subtraction from the spectral response. The pre-stored spectral
response is normalized to unity for efficient compensation. After compensation, the highest
amplitude among FFT output data is found. The signal frequency is then calculated using a
INTERNATIONAL JOURNAL ON SMART SENSING AND INTELLIGENT SYSTEMS VOL. 4, NO. 4, DECEMBER 2011
551

Fig. 3. Principle of Compensation method using Super-Resolution
START
10 kS/s 12-b ADC
12-b INPUT, Variable length FFT
USERINPUTFREQ.
RANGE
NS
SA
FUNCTIONSELECTORSelective
amplificationor lateralinhibition
USER INPUT:FREQUENCY
Freq.1
Yes
NORMALIZE
APPLY COMPENSATION ANDREMOVE HIGHEST SIGNAL
CALCULATEFREQUENCY
DECLARE THEFREQUENCY
Is Freq.1 in thefrequency range?”No
NORMALIZE
APPLY COMPENSATIONWITHOUT REMOVING THE
HIGHEST SIGNAL
END
No
Yes
All signalsprocessed?
END
Fig. 4. Design flow of the signal processor
Kiran George and Chien-In Henry Chen, Biologically-Inspired Signal Processor Using Lateral Inhibition and Integrative Function Mechanisms for High Instantaneous Dynamic Range
552

super-resolution algorithm, which compares peaks of its two neighboring frequency bins and
estimates the detected signal frequency with a higher frequency resolution. The output of the
frequency calculation block is 11-bit wide that locates the peak signal frequency bin among the
2048 frequency bins.
Fig. 3 illustrates the effectives of the compensation method by a simulation example that uses 2k
FFT. In the compensation method, the strong interfering signal in the received data [3(a)], is
approximated, reproduced with high resolution [3(b)] and is removed from the received data
whereby the weak signal is exposed [3(c)] that otherwise would have been covered up by the
strong signal or its side-lobes and spurs. The compensation method has been proven to be a very
effective technique to detect weak signals in presence of very strong signals in the same data.
A. Design flow of the biologically-inspired signal processor performing “selective
amplification” and “lateral inhibition” The design flow of the proposed signal processor is given in Fig. 4. The design reuses the
normalization, the frequency calculation, and the compensation blocks. In a real-time
environment the data coming to the signal processor may contain no signal (only noise), one
signal or multiple signals. A 12-bit ADC first digitizes the data. Then, a Fourier transformation
is performed on the digitized data after a Kaiser windowing is applied. The data is then passed on
to either the selective amplification flow or the lateral inhibition flow through a function selector
controlled by the user.
In the selective amplification flow, the data is first normalized. The normalization operation is a
necessary step for an efficient compensation of the strongest signal’s side-lobes and spurs, which
will be performed next. In the compensation operation, the signal with the highest amplitude and
its sidelobes and spurs are removed from the collected and normalized data. Next, the frequency
of the highest amplitude is compared with users defined “frequency of interest”. If the frequency
falls in the range of users defined “frequency of interest”, the frequency is declared detected. If
not, the same procedure is repeated where the highest signal is eliminated each time until users
“frequency of interest” is obtained.
INTERNATIONAL JOURNAL ON SMART SENSING AND INTELLIGENT SYSTEMS VOL. 4, NO. 4, DECEMBER 2011
553

The above described procedure for the selective amplification flow is influenced by the
integrative function of the nervous system of the human body described in Section 1. The
nervous system selectively amplifies a particular response from the available responses to a
particular incident (like a person placing his/her hand on a hot stove as described in section I).
The integrative function amplifies the response of “lifting the hand from the hot stove” among the
other associated responses like moving the entire body away from the stove and perhaps even
shouting with pain. Likewise in the proposed signal processor, a particular frequency among
possible frequency bin in the 5 KHz (1 KHz - 5 kHz) bandwidth is selectively amplified based on
the users input. In the lateral inhibition flow, the data is first normalized. In the next step,
compensation operation is performed on the data by removing its side-lobes and spurs associated
with the signal with highest amplitude while keeping the highest signal. It is then checked if all
the signals among the total pre-determined number of signals have been processed. If not, the
same procedure is repeated until all the signals are processed.
The lateral inhibition, the characteristic of the signal transmission in the nervous system of the
human body, greatly increases the contrast or sharpness among the perceived spatial signal
patterns. Likewise, in the proposed signal processor the sharpness of the received signals is
increased by reducing the signal spread using data windowing and compensation.
B. The super-resolution algorithm for accurately estimating signal frequency between
frequency bins of FFT
Fig. 5. Higher frequency resolution in dividing frequency bin by 128
In this section we will discuss how signal frequency is estimated with a higher resolution using
the super-resolution algorithm for an example of 256-point FFT. The output of the FFT has 128
frequency bins, each 39 Hz wide (5 KHz/128). But, in reality the signal frequency may not fall
exactly on one of the specified 128 frequency bins. It may fall anywhere between any two
Kiran George and Chien-In Henry Chen, Biologically-Inspired Signal Processor Using Lateral Inhibition and Integrative Function Mechanisms for High Instantaneous Dynamic Range
554

neighboring bins. In order to achieve a higher frequency resolution, the section between any two
neighboring bins is divided into k sub-sections, i.e., the frequency resolution is improved from 39
Hz to 39/k Hz (i.e., 0.31 Hz for k = 128, which is shown in Fig. 5). The super-resolution
algorithm (Fig. 6), comparing the peaks of its two neighboring frequency bins to estimates the
detected signal frequency with a frequency resolution of 5 KHz /(FFT_length * k) , is described
below where:
f(m) = the highest peak amplitude of FFT outputs whose frequency bin is m;
f(m+1) = the amplitude of FFT output at bin m +1;
f(m-1) = the amplitude of FFT output at bin m - 1;
START
YesNo
γ = 1/(1+f(m)/f(m+1)) + 0.5
END
γ = 1/(1+f(m)/f(m-1)) + 0.5
/* Estimate the row of the compensation table of signal f */
n = k*(m-1) - γ +1; /* where m is the peak signal's frequency bin */
f = n*[5000 / FFT_length]/k Hz
/* Actual frequency is assumed not to be at the center ofthe bin, so each bin is further divided into k to get a
higher frequency resolution */
.f(m-1) > f(m+1)
Fig. 6. Super-Resolution using k-subsections in frequency bin For the case of f(m-1) < f(m+1), 1/(1+ f(m)/f(m+1)) ≈ 0 when the signal is close to the mth
frequency bin; 1/(1+ f(m)/f(m+1)) ≈ 1 when the signal is close to the (m+1) th frequency bin.
The value of 1/(1+ f(m)/f(m+1)) is between 0 and 1. It specifies the higher resolution frequency
estimate of the signal, depending on the signal close to the mth frequency bin or the (m+1)th
INTERNATIONAL JOURNAL ON SMART SENSING AND INTELLIGENT SYSTEMS VOL. 4, NO. 4, DECEMBER 2011
555

frequency bin. Similarly, for the case of f(m-1) > f(m+1), 1/(1+ f(m)/f(m-1)) ≈ 0 when the signal
is close to the mth frequency bin; 1/(1+ f(m)/f(m-1)) ≈ 1 when the signal is close to the (m-1)th
frequency bin. The value of 1/(1+ f(m)/f(m-1)) is also between 0 and 1. It specifies the higher
resolution frequency estimate of the signal, depending on the signal close to the mth frequency bin
or the (m-1)th frequency bin.
.f(m)
.f(m-1)
Case 1: f(m+1) > f(m-1)FFT length: 128;
freq. bin size: 39 Hz;k = 8
39 Hz
39 Hz/8
Truefrequency
Case 2: : f(m-1) > f(m+1)FFT length: 512;
freq. bin size: 9.8 Hz;k = 8
9.8 Hz
9.8 Hz/8
Truefrequency
.f(m+1)
.f(m)
.f(m-1)
.f(m+1)
Fig. 7. Examples of K = 128 and 256 using Super-Resolution: Case 1: f(m+1) > f(m-1) and
Case 2: f(m-1) > f(m+1)
If a 256 pt FFT is used in the design (Fig. 7), the frequency range of 5000 Hz is divided into 128
bins (each bin is 39 Hz). We don’t assume that the frequency is at center of the bin so each bin is
further divided into k subsections to get a higher frequency resolution of 39/k Hz, i.e. 4.88 Hz for
k = 8; 2.44 Hz for k = 16; 1.22 Hz for k = 32; 0.61 Hz for k = 64 and 0.31 Hz for k = 128. Fig. 6
Kiran George and Chien-In Henry Chen, Biologically-Inspired Signal Processor Using Lateral Inhibition and Integrative Function Mechanisms for High Instantaneous Dynamic Range
556

gives examples of K = 128 and 256 using Super-Resolution where the case 1 is f(m+1) > f(m-1)
and the case 2 is f(m-1) > f(m+1).
III. DYNAMIC PERFORMANCE COMPARISON AND ANALYSIS
A. Instantaneous Dynamic Range, Frequency Resolution and Frequency Separation
In order to ensure the accurate and a realistic performance measurement, the worst-case signal
scenario is considered. For each of the 10,000 simulation runs, a total of five signals were used
with a bandwidth of 5 KHz, and one of the five input signals is selected as the strong signal. The
rest of the input signals are considered as weak signals. The maximum attainable dynamic range
of the design was ascertained using different lengths of FFT. The IDR, frequency resolution (i.e.,
the difference in the frequencies of two neighboring bins in FFT outputs) and frequency
separation (i.e., the minimum difference in the frequencies of two signals that the receiver can
correctly detect both signals) for each FFT length is shown in Table 1.
Table 1: IDR, frequency resolution and signal separation for different FFT lengths
FFT Length (point)
Frequency Separation
(Hz)
Frequency Resolution
(Hz)
Maximum IDR (dB)
256 117 40 24 512 58.6 19.5 37.5 1024 29 9.77 49 2048 14.6 4.9 53 4096 7.32 2.4 58
In Fig. 8, a simulation example demonstrating the selective amplification function of the signal
processor that uses 256 point FFT is given. Out of the five signals, the signal in the 100th bin is
amplified and the rest of the signals are removed. The lateral inhibition capacity of the signal
processor that uses 256 point FFT is demonstrated in Fig. 9. The side-lobes and spurs of the
strong signal (signal in 40th bin) and other weak signals are effectively removed, leaving back
the actual clean weak signals.
INTERNATIONAL JOURNAL ON SMART SENSING AND INTELLIGENT SYSTEMS VOL. 4, NO. 4, DECEMBER 2011
557

Fig. 8. Selective amplification
Fig. 9. Lateral inhibition
Kiran George and Chien-In Henry Chen, Biologically-Inspired Signal Processor Using Lateral Inhibition and Integrative Function Mechanisms for High Instantaneous Dynamic Range
558
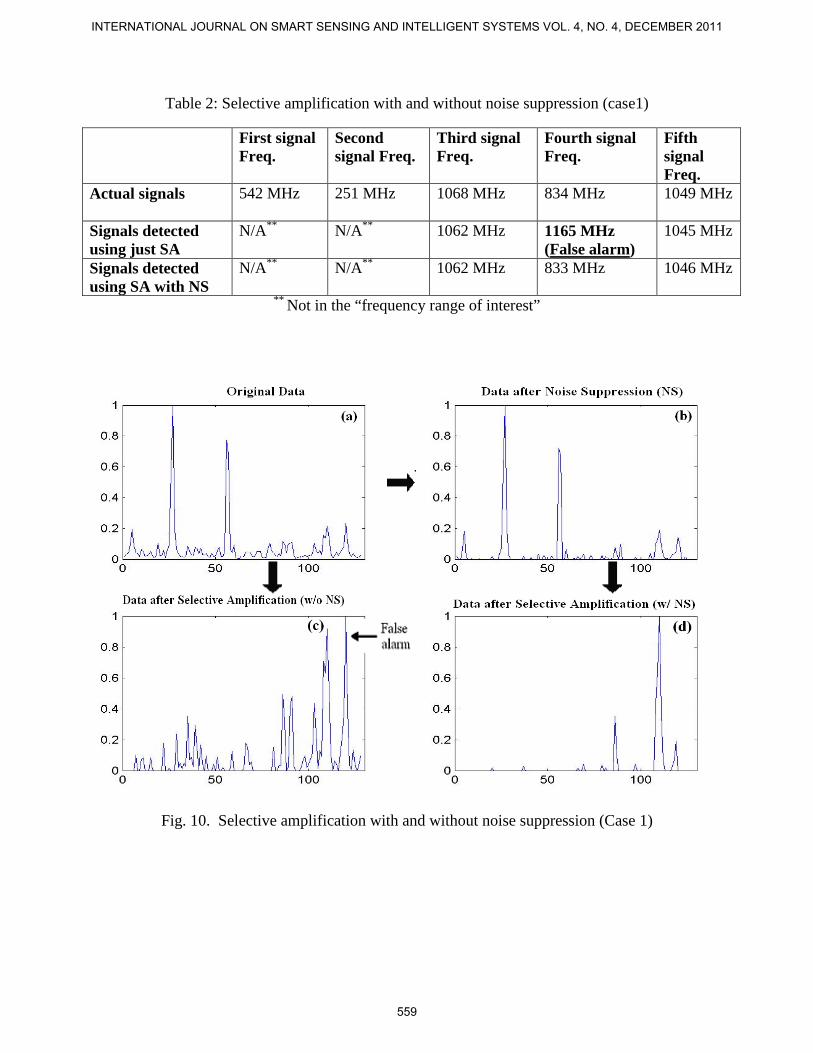
Table 2: Selective amplification with and without noise suppression (case1)
First signal Freq.
Second signal Freq.
Third signal Freq.
Fourth signal Freq.
Fifth signal Freq.
Actual signals 542 MHz 251 MHz 1068 MHz 834 MHz 1049 MHz
Signals detected using just SA
N/A** N/A** 1062 MHz 1165 MHz (False alarm)
1045 MHz
Signals detected using SA with NS
N/A** N/A** 1062 MHz 833 MHz 1046 MHz
** Not in the “frequency range of interest”
Fig. 10. Selective amplification with and without noise suppression (Case 1)
INTERNATIONAL JOURNAL ON SMART SENSING AND INTELLIGENT SYSTEMS VOL. 4, NO. 4, DECEMBER 2011
559

Table 3: Selective amplification with and without noise suppression (case2)
First signal Freq.
Second signal Freq.
Third signal Freq.
Fourth signal Freq.
Fifth signal Freq.
Actual signals 495 MHz 193 MHz 952 MHz 975 MHz 841 MHz
Signals detected using just SA
N/A** N/A** 883 MHz (False alarm)
974 MHz
843 MHz
Signals detected using SA with NS
N/A** N/A** 953 MHz 977 MHz 844 MHz
** Not in the “frequency range of interest”
Fig. 11. Selective amplification with and without noise suppression (Case 2)
Kiran George and Chien-In Henry Chen, Biologically-Inspired Signal Processor Using Lateral Inhibition and Integrative Function Mechanisms for High Instantaneous Dynamic Range
560

Table 4: Selective amplification with and without noise suppression (case3)
First signal Freq.
Second signal Freq.
Third signal Freq.
Fourth signal Freq.
Fifth signal Freq.
Actual signals 161 MHz 295 MHz 1067 MHz 830 MHz 1116 MHz
Signals detected using just SA
N/A** N/A** 1069 MHz
620 MHz (False alarm)
1118 MHz
Signals detected using SA with NS
N/A** N/A** 1070 MHz 830 MHz 1118 MHz
** Not in the “frequency range of interest”
Fig. 12. Selective amplification with and without noise suppression (Case 3)
INTERNATIONAL JOURNAL ON SMART SENSING AND INTELLIGENT SYSTEMS VOL. 4, NO. 4, DECEMBER 2011
561

B. Selective Amplification vs. Selective Amplification with Noise Suppression Three cases as shown in Figures 10, 11, and 12 illustrate the effect of noise suppression on
selective amplification. In these examples, five signal frequencies were randomly generated
whereby the 1st and 2nd signal frequencies were outside of the “frequency range of interest”, the
frequency bins from 80 to 120 (from 781.25 MHz to 1171.875 MHz). The flow for selective
amplification without noise suppression is shown in Fig. 10(a) and (c), Fig. 11(a) and (c), and
Fig. 12(a) and (c). The flow for selective amplification with noise suppression is shown in Fig.
10(a), (b), and (d), Fig.11(a), (b), and (d), and Fig. 12(a), (b), and (d). The noise suppression
was able to remove the sidelobes and spurs of the strong signal in the “frequency range of
interest” (bins 80 to 120), as shown in Fig. 10(b), 11(b), and 12(b). The selective amplification
performed thereafter amplified the weak signal spectrum in the “frequency range of interest” for
signal detection, as shown in Fig. 10(d), 11(d), and 12(d). On the contrary, if the selective
amplification was performed alone without application of the noise suppression, the sidelobes
and spurs of the strong signal together with the weak signal in the “frequency range of interest”
were all amplified, which resulted in a false alarm, as shown in Figures 10(c), 11(c), and 12(c).
Tables 2, 3, and 4 report the signals’ frequencies in the frequency range of interest (frequency
bins from 80 to 120) for all three cases, as shown in Fig. 10(d), 11(d), and 12(d).
IV. AUDIO SIGNAL ACQUISITION, ANALYSIS AND MEASUREMENT
A. Test Setup This section presents a test setup and experimental results for the audio signal acquisition,
analysis and measurement in the biologically-inspired signal processor where the audiorecorder
feature of Matlab is used to acquire the audio sample in .wave format (Fig. 13). The analysis is
performed by hardware and software set, which allows the audio system properties to be tracked
on-line. The paper also goes on to discuss the performance of an instrument prototype, both in
terms of accuracy and speed of measurement.
The following attributes for the sampling process was set using the feature:
a) Fs (Hz): Rate at which data is sampled. Typical values supported by most sound cards are
8000, 10000, 22050, 44100, 48000, and 96000 Hz. In this test setup 10000 Hz was used as the
sampling rate.
Kiran George and Chien-In Henry Chen, Biologically-Inspired Signal Processor Using Lateral Inhibition and Integrative Function Mechanisms for High Instantaneous Dynamic Range
562

b) nBits: Number of bits used to represent the sampled data. Valid values depend on the audio
hardware installed: 8, 16, or 24. Resolution of 16 bits was used.
c) nChannels: Number of channels recorded: 1 (mono) or 2 (stereo). Single channel was used for
the data acquisition.
The audiorecorder feature of Matlab internally digitizes the analog signal from the microphone
attached to the PC. Once the data is acquired, the .wave file can be read into the Matlab
environment for data analysis and frequency measurement.
The above analysis (Figures 13, 14 and 15) has shown that the detected frequencies fell within
the typical male and female voice frequency ranges, 85 to 180 Hz and 165 to 255 Hz where the
detected male voice frequency is 123 Hz and the detected female voice frequency is 184 Hz.
Fig. 13. Hardware and software set for audio signal acquisition, analysis and measurement.
Freq. 1 (126 Hz)
Freq. 2 (184 Hz)
INTERNATIONAL JOURNAL ON SMART SENSING AND INTELLIGENT SYSTEMS VOL. 4, NO. 4, DECEMBER 2011
563

(a) (b)
Fig. 14. Voice signal processing adult male: (a) acquired audio signal and (b) processed audio signal in frequency domain
(a) (b)
Fig. 15. Voice signal processing adult female: (a) acquired audio signal and (b) processed audio signal in frequency domain
Detected freq. of adult male (123 Hz)
Detected freq. of adult female (186 Hz)
Kiran George and Chien-In Henry Chen, Biologically-Inspired Signal Processor Using Lateral Inhibition and Integrative Function Mechanisms for High Instantaneous Dynamic Range
564

(a) Freq. 1 detected (128 Hz) and removed for next voice signal analysis
(b) Freq. 2 detected (166 Hz) and removed for next voice signal analysis
(c) Freq. 3 detected (188 Hz) and removed for next voice signal analysis
Fig. 16. Multiple voice signal detection using the proposed receiver
Detected freq. (128 Hz)
Detected freq. (166 Hz)
Detected freq. (188 Hz)
INTERNATIONAL JOURNAL ON SMART SENSING AND INTELLIGENT SYSTEMS VOL. 4, NO. 4, DECEMBER 2011
565

In the next experiment, three adults (two males and one female) voice signals were analyzed as a
group. This experiment was conducted to estimate the receiver’s ability to detect multiple voice
signals (Fig. 16). The three individual voice signals were detected and their signal frequencies
were measured. Upon individual voice signal analysis, it is shown that the 128 Hz and 166 Hz
were of two males and 188 Hz was of a female.
V. CONCLUSIONS
This paper presented a biologically-inspired signal processor, which draws influence from lateral
inhibition and integrative function mechanisms of the human nervous system. The proposed
signal processor has a novel combination of two smart signal transmission mechanisms and
achieves high instantaneous dynamic range and frequency resolution. The design mainly
comprises of a 12-b ADC, a Kaiser window, a FFT, and a super-resolution block. Using a
function selector, either the selective amplification or the lateral inhibition capability of the signal
processor is selected to allow the signal properties to be tracked on-line. The simulations
conducted present promising results. The design can selectively amplify weak signals from a data
set among four strong signals and suppress side-lobes and spurs to expose weak signals with
amplitudes of 58 dB below the strong signal, when 4K FFT is utilized.
REFERENCES
[1] A. C. Guyton and J. E. Hall, Textbook of Medical Physiology. Philadelphia, PA: Saunders
Book Company, 1996. [2] A. Greenhall and L. Atlas, “Cepstral mean based speech source discrimination,” Proc. IEEE
Int. Conf. [3]
Acoustics, Speech, and Signal Processing, pp. 4490-4493, March 2010. M. Navratil, P. Dostalek and V. Kresalek, “Classification of audio sources using neural network applicable in security or military industry,” Proc. IEEE Int. Carnahan Conf. Secu. Tech.
[4] , pp. 369 - 371, Oct. 2010.
M. Lehr and I. Shafran, “Learning a Discriminative Weighted Finite-State Transducer for Speech Recognition,”
[5] Y. Romanyshyn and V. Tkachenko, “Noise reducing in speech signals using wavelet technology,” Proc. Int. CAD Systems in Microelectronics, pp. 446 -450, Feb. 2011.
IEEE Trans. Audio, Speech, and Language Pro., Vol. 99, pp. 1-16, Dec. 2010.
[6] C. Rui, K. Shaoli and M.R. Alsharif, “Echo and Background Music Canceler by Using Smart Acoustic Room System for Car Hand-Free Telephone,” Proc. IEEE Int. Conf. Info. Sci. Engg., pp. 546 - 549, Dec. 2009.
Kiran George and Chien-In Henry Chen, Biologically-Inspired Signal Processor Using Lateral Inhibition and Integrative Function Mechanisms for High Instantaneous Dynamic Range
566

[7] Y. Suhail and K.G. Oweiss, “Augmenting information channels in hearing aids and cochlear implants under adverse conditions”, IEEE Int. Conf. Acoustics, Speech, and Signal Processing, Vol. 5, pp.
[8] D. Daoud, F. Kallel, M. Ghorbel, A. Ben Hamida, “Spatial filtering based speech enhancement for binaural hearing aid,” Proc. Int. Conf. Systems, Signals and Devices, pp. 1-6, March 2009.
V-889-92, May 2005.
[9] Wikipedia. (2011, June 07). [Online]. Fundamental frequency. Availabe: http://en.wikipedia.org/wiki/Voice_frequency
INTERNATIONAL JOURNAL ON SMART SENSING AND INTELLIGENT SYSTEMS VOL. 4, NO. 4, DECEMBER 2011
567