biology icrp foundat doc for web cons · 249 (publication 60, icrp 1991), icrp committee 1 has...
TRANSCRIPT
11/109/05
INTERNATIONAL COMMISSION ON RADIOLOGICAL PROTECTION 1 2 Committee 1 Task Group Report: C1 Foundation Document 3 (FD-C-1) 4 5 6 Biological and Epidemiological Information on Health Risks 7 Attributable to Ionising Radiation: A Summary of 8 Judgements for the Purposes of Radiological Protection of 9 Humans 10 11 12 Task Group Members 13 R Cox, J Hendry, A Kellerer, C Land, C Muirhead, D Preston, J Preston, 14 E Ron, K Sankaranarayanan, R Shore and R Ullrich 15 16 17 Corresponding Members 18 A Akleyev, M Blettner, R Clarke, J Harrison, J Little, H Menzel, O Niwa, A 19 Phipps, J Stather, F Stewart, C Streffer, M Timarche and P Zhou 20 21 22 23 24 25 26 27 28 29 30 31 32 33 34 35 36 37 38 39 40 41 42 21 April 2005 43

2
Contents Page 44 45 Principal Conclusions and Proposals of the Task Group 5 46 1. Introduction 7 47 2. Interactions of Radiation with Cells and Tissues 9 48 2.1 Biophysical aspects of radiation action on cells 9 49 2.2 Chromosomal DNA as the principal target for radiation 10 50 2.3 DNA damage response and repair 11 51
2.3.1 DNA repair, apoptosis and cellular signalling 11 52 2.4 The induction of gene and chromosomal mutations 12 53 2.5 Epigenetic responses to radiation 13 54 2.5.1 Radiation induced genomic instability 14 55 2.5.2 Post-irradiation bystander signalling 15 56 2.6 Tissue reactions 15 57 2.7 Mechanisms of radiation tumorigenesis 16 58 2.7.1 Animal models of radiation tumorigenesis 17 59 2.7.2 Radiation-associated human tumours 18 60 2.7.3 Genetic susceptibility to cancer 18 61 2.8 Heritable diseases 19 62 3. Risks of Tissue Injury 21 63 3.1 Revision of judgements given in Publication 60 21 64 3.1.1 Definition of stochastic effects and tissue reactions 21 65 3.1.2 Tissue and organ reactions 21 66 3.1.3 Cell survival curves 22 67 3.1.4 Early and late reactions in tissues and organs 23 68 3.1.5 Mortality after whole body exposure 25 69 3.1.6 Summary of projected estimates of dose-thresholds 70
for morbidity and mortality 27 71 3.1.7 Dose limits for specific tissues 27 72 3.2 Effects in the embryo and fetus 28 73 4. Risks of Radiation Induced Cancer 36 74 4.1 Fundamental data on radiation response 36 75 4.1.1 Dose response relationships for gene and 76
chromosomal mutations 37 77 4.1.2 DNA damage-response in cells 37 78 4.1.3 Epigenetic responses to radiation 38 79 4.2 Animal data on tumour induction and life shortening 39 80 4.3 Relative biological effectiveness (RBE) and radiation 81
weighting (wR) 39 82 4.4 Estimation of cancer risk from epidemiological data 40 83
4.4.1 Nominal risk coefficients, radiation detriment 84 and tissue weighting factors 40 85
4.4.1.1 Risk modelling 41 86 4.4.1.2 Methodological aspects 45 87 4.4.1.3 Principal features of new estimates 88
of cancer risk 50 89

3
4.4.1.4 The use of relative detriment for a 90 tissue weighting system 55 91
4.4.2 Nominal probability coefficients for cancer and 92 hereditary effects 56 93
4.4.3 Cancer risk following prenatal (in-utero) irradiation 57 94 4.4.4 Genetic susceptibility to radiation-induced cancer 58 95
4.4.5 Allowing for the possibility of a low dose threshold 96 for cancer risk 58 97
5. Non-cancer diseases after radiation exposure 75 98 6. Risks of heritable diseases 76 99 6.1 Introduction 76 100 6.2 Background information 76101 6.2.1 Naturally-occurring genetic diseases 76102 6.2.2 The double dose method 77 103 6.3 Recent advances in understanding 79 104 6.3.1 Baseline frequencies of genetic diseases 79 105 6.3.2 The doubling dose 80 106 6.3.3 Mutation component 82 107 6.3.4 The concept of potential recoverability correction 108
factor 87 109 6.3.5 The concept that multi-system developmental 110
abnormalities are likely to be the major manifestations 111 of radiation-induced genetic damage in humans 90 112
6.4 The 2001 UNSCEAR Risk Estimates 92 113 6.4.1 Estimates of genetic risk for a population sustaining 114
radiation exposure generation after generation 92 115 6.4.2 Estimates of genetic risks for a population that 116
sustains radiation exposure in one generation only 93 117 6.4.3 Strengths and limitations of the risk estimates 94 118 6.5 ICRP’s earlier and present assessments of risk estimates 119
for deriving risk coefficients for genetic effects 96 120 6.5.1 ICRP Publication 60 96 121 6.5.2 Current assessments 97 122 6.5.3 Justifications for using risk estimates up to generation 123
two versus the first post-radiation generation for 124 calculating risk coefficients 97 125
7. Summary of principal conclusions and recommendations 101 126 8. References 104 127 128 Appendices 129 Appendix 1 to Section 4 130 Further details of the detriment calculations Tables A1-A13 61-73 131 Appendix 2 to Section 4 132 Estimates of selected gender-specific population detriments 74 133 134 135 136 137

4
Tables 138 Table 3.1 Estimates of the thresholds for deterministic effects 139
in the adult human testes, ovaries, lens and bone marrow 140 (from ICRP, 1984) 30 141
Table 3.2 Dose-modifying factors (DMF) reported in mice or other 142 species where stated. 31 143
Table 3.3 Range of doses associated with specific radiation induced 144 syndromes and death in human beings exposed to acute 145 low LET uniform whole body radiation 32 146
Table 3.4 Projected threshold estimates of the acute absorbed doses 147 for 1% incidences of morbidity and mortality involving adult 148 human organs and tissues after whole body gamma ray 149 exposures 32 150
Table 4.1 Summary of Gender-Averaged Nominal Risks and Detriment 52 151 Table 4.2 Comparison of Gender-Averaged Nominal Risks and Detriment 152 in Whole Population based on Different Methods of Calculation 53 153 Table 4.3 Proposed tissue weighting factors 56 154 Table 4.4 Detriment adjusted nominal probability coefficients for cancer 155
and hereditary effects (10-2 Sv-1) 56 156 Table 6.1 Baseline frequencies of genetic diseases in human population 80 157 Table 6.2 Summary of assessments of potential recoverability of 158
radiation-induced mutations in autosomal and X-linked genes 89 159 Table 6.3 Current estimates of genetic risks from continuing exposure 160
to low LET, low dose or chronic irradiation (UNSCEAR 2001) 161 with assumed doubling dose of 1 Gy 93 162
Table 6.4 Current estimates of genetic risks from one-generation 163 exposure to low LET, low-dose or chronic irradiation 164 (UNSCEAR 2001) with assumed doubling dose of 1 Gy 94 165
Table 6.5 Estimates of risk coefficients in ICRP Publication 60 96 166 Table 6.6 Risk coefficients for the reproductive and the total 167
population obtained with method 1 98 168 Table 6.7 Risk coefficients for the reproductive population and the 169
total population for the first post-irradiation generation 99 170 Table 7.1 Summary of principal conclusions and proposals 171
significantly intended for radiological protection purposes 102 172 173 Figures 174 Figure 3.1 Dose-response for cell survival (S) on a semi-log plot 175
described by the linear quadratic equation 176 S = exp - (αD + βD2) 33 177
Figure 3.2 Relationship between mortality and dose 34 178 Figure 3.3 Relationship between dose and the frequency and 179
severity of tissue reactions 35 180 181

5
Principal Conclusions and Proposals of the Task Group 182 183 The following summary statements relate largely to the health effects of 184 radiation in the dose range up to a few tens of mSv for the purposes of 185 radiological protection. 186 187 • For cancer and hereditary disease at low doses/dose rates the use of 188
a simple proportionate relationship between increments of dose and 189 increased risk is a scientifically plausible assumption. 190
191 • A dose and dose-rate effectiveness factor (DDREF) of 2 recommended 192
in Publication 60 should be retained for radiological protection 193 purposes; the effect of introducing the uncertain possibility of a low 194 dose threshold for cancer risk is judged to be equivalent to that of an 195 uncertain increase in the value of DDREF. 196
197 • Proposed changes in radiation weighting factors for protons and 198
neutrons are noted; these judgements are fully developed in the ICRP 199 Committee 2 Foundation Document. “Basis for dosimetric quantities 200 used in radiological protection”(FD-C-2). 201
202 • New radiation detriment values and tissue weighting factors have 203
been proposed; the most significant changes from ICRP 60 relate to 204 breast, gonads and treatment of remainder tissues. 205
206 • Detriment adjusted nominal probability coefficients for cancer are 207
5.9 10-2 Sv-1 for the whole population and 4.6 10-2 Sv-1 for adult 208 workers; the respective ICRP60 values are 6.0-10-2 Sv-1 and 4.8 10-209 2 Sv-1. 210
211 • Detriment adjusted probability coefficients for hereditary disease up 212
to the second generation are 0.2 10-2 Sv-1 for the whole population 213 and 0.1 10-2 Sv-1 for adult workers; the respective ICRP60 values are 214 1.3 10-2 Sv-1 and 0.8 10-2 Sv-1 but these relate to risks at a theoretical 215 equilibrium and no longer seem justified 216
217 • Cancer risk following in-utero exposure is judged to be no greater 218
than that following exposure in early childhood. 219 220 • Knowledge of the roles of induced genomic instability, bystander cell 221
signalling and adaptive response in the genesis of radiation–induced 222 health effects is insufficiently well developed for radiological 223 protection purposes; in many circumstances these cellular processes 224 will be incorporated in epidemiological measures of risk. 225
226 • Genetic susceptibility to radiation-induced cancer involving strongly 227
expressed genes is judged to be too rare to appreciably distort 228

6
estimates of population risk; the potential impact of common but 229 weakly expressing genes remains uncertain. 230
231 • Dose responses for radiation-induced tissue reactions (deterministic 232
effects) in adults and children are, in general, judged to have true 233 dose thresholds which result in the absence of risk at low doses; a 234 reduction in the dose threshold for cataract induction (visual 235 impairment) is proposed. 236
237 • Dose responses for in-utero radiation-induced tissue reactions, 238
malformations and neurological effects are also judged to show dose 239 thresholds above a few tens of mGy; uncertainty remains on the 240 induction of IQ deficits but at low doses the risk is judged to be 241 insignificant. 242
243 • Risks of non-cancer disease at low doses remain uncertain and no 244
specific judgement is possible. 245

7
1. Introduction 246 247 Since the publication of the 1990 Recommendations of the ICRP 248
(Publication 60, ICRP 1991), ICRP Committee 1 has continued to maintain 249 broad surveillance on scientific developments regarding the quantification 250 of health effects attributable to radiation exposure and the biological 251 mechanisms that underlie these effects. Much of the output of Committee 252 1 is represented in ICRP Task Groups reports and Committee 1 working 253 parties have reviewed data in other relevant areas. 254
255 The purpose of the present Task Group report is to summarise all post-256
1990 Committee 1 judgements relating to the health effects of radiation in 257 order to support the development by the Commission of its new 258 Recommendations. In many of the areas considered in the present report, 259 Committee 1 had already provided specific judgements, eg on the risk of 260 multifactorial diseases (Publication 83) and on radiation weighting factors 261 (Publication 92). However, the revision of a) judgements on the induction 262 of tissue reactions; b) nominal risk coefficients for risks of cancer and 263 heritable disease; c) the transport of cancer risk between different 264 populations; and d) the choice of tissue weighting factors required much 265 additional work from the Task Group. For this reason the above topics are 266 covered in detail in this report. 267
268 An additional feature of the present report is the extent to which the 269
accumulation of epidemiological and biological knowledge since 1990 has 270 served to strengthen some of the judgements made in Publication 60 or, in 271 some cases, has led to a revision in procedures for risk estimation. In 272 spite of the detailed nature of these gains in knowledge, the principal 273 objective of this report is the provision of broad judgements for practical 274 purposes of radiological protection. Accordingly, much of the work of the 275 Task Group centres on the continuing use of effective dose as a 276 radiological protection quantity for prospectively estimating risks in the 277 population and to demonstrate compliance with dose limits. The 278 application of the concept of effective dose is discussed in the Committee 279 2 Foundation Document (FD-C-2). 280
281 The report is structured in the following way. Section 2 provides a brief 282
summary of the gains in knowledge since 1990 on the biological processes 283 that underlie the health effects of radiation exposure. Section 3 provides 284 updated judgements on the mechanisms and risks of radiation-induced 285 tissue reactions. Section 4 considers the mechanisms and genetics of 286 cancer induction, summarises previous judgements on radiation weighting 287 factors and details new epidemiologically-based judgements on nominal 288 risk coefficients, transport of risk, radiation detriment and tissue weighting 289 factors; Section 4 also summarises an earlier judgement on cancer risk in-290 utero. Section 5 briefly considers non-cancer diseases after radiation. In 291 Section 6, the Task Group details a newly developed approach to the 292

8
estimation of risks of heritable disease and provides a revised estimate of 293 this risk. Finally, in Section 7, a simple tabular format is used to 294 summarise the principal recommendations from the Task Group and to 295 map these judgements to the appropriate sections of the report. 296

9
2. Interactions of Radiation with Cells and Tissues 297 298
The purpose of this section is to summarise knowledge on the interactions 299 of radiation with cells and tissues in the body with emphasis on the 300 information and concepts that have developed since 1990. The intention 301 is to provide a biological framework for the judgements to be developed in 302 subsequent sections of the report. Although some of these biological data 303 and concepts are complex, much of this report is intended for the non-304 specialist reader. Consequently the report will not enter into the detail of 305 many of the biological and biophysical debates but rather seeks clarity and 306 simplicity on the judgements made. Details of these debates may be 307 found in earlier ICRP publications and other reviews. 308
309 2.1 Biophysical aspects of radiation action on cells 310 311
ICRP has not specifically reviewed the broad topics of radiation biophysics 312 and microdosimetry since 1990 but important advances and judgements 313 are given in Publication 92 (ICRP 2003) and in a new ICRP Task Group 314 report on Low Dose Risks (Publication LDR-C-1). The understanding of the 315 early post-irradiation biophysical processes in cells and tissues has 316 advanced substantially and the following paragraphs briefly highlight some 317 major points of development. Further information is available in 318 Publication 92, Publication LDR-C-1 and Goodhead et al 1996. 319 320 Knowledge of the fine structure of energy deposition from radiation tracks 321 in DNA dimensions has grown, largely through the further development of 322 Monte-Carlo track structure codes. Coupled with radiobiological 323 information, track structure data have impacted greatly on thinking in 324 respect of the nature of biologically critical damage to DNA. 325 326 In particular, it has been recognised that a high proportion of radiation 327 induced damage in DNA is represented in complex clusters of chemical 328 alterations. Such clustered damage can arise via a combination of 329 damages induced by the main tracks, secondary electrons and secondary 330 reactive radical species. Double and single strand breaks in the DNA 331 sugar-phosphate backbone (DSB and SSB) plus a variety of damaged DNA 332 bases can combine together in clusters with a substantial fraction of total 333 damage being closely spaced. There is also evidence that both the 334 frequency and complexity of complex clustered damage depends upon the 335 linear energy transfer (LET) of the radiation. 336 337 When DSB, SSB and base damages are considered together, complex 338 clustered damage may constitute as much as 60% and 90% of total DNA 339 damage after low and high LET radiations respectively. These data 340 highlight a major difference between DNA lesions induced by radiation and 341 those arising spontaneously via oxidative attack by reactive chemical 342 radicals. Whereas the former are predominantly complex and clustered 343

10
the latter are randomly distributed and simple in their chemical structure. 344 As described in Publication LDR-C-1 and noted in 4.1.2, the different repair 345 characteristics of simple and complex DNA lesions is an important factor in 346 the development of judgements on health effects after low doses of 347 radiation. 348 349 In addition to improvements in our understanding of the induction of 350 complex DNA damage by radiation there have been other advances in 351 radiation biophysics. For example radiation induced damage has been 352 investigated at the level of chromosome structure and this work has been 353 paralleled by the biophysical modelling of the induction of 354 gene/chromosomal mutations. There has also been valuable technical 355 innovation including the development of single particle irradiation systems 356 (microbeams) and of imaging methods for the cellular vizualization of 357 DNA-protein interactions during DNA damage-response (see Publication 358 LDR-C-1; Churubini et al 2001). 359
360 2.2 Chromosomal DNA as the principal target for radiation 361 362
In addition to the biophysical information outlined in Section 2.1, there is 363 more direct evidence that implicates chromosomal DNA as the principal 364 cellular target for biological effects. Much of the early evidence on this 365 issue concerned the greater radiobiological effectiveness of radionuclides 366 incorporated into DNA in the cell nucleus as compared with cellular 367 proteins in general (UNSCEAR 1993). More recently the use of microbeam 368 irradiation facilities capable of delivering a defined dose to different parts 369 of the cell has fully confirmed the radiosensitivity of the cell nucleus. 370 However as noted in Section 2.5 these microbeam techniques have also 371 provided evidence of the potential complexity of cellular radiation 372 response. 373 374 In addition, since 1990 the critical importance of DNA damage for 375 radiobiological effects, including cancer induction, has been emphasised by 376 a large number of studies with cells and animals that are genetically 377 deficient in DNA damage response – many of these specific genetic 378 deficiencies increase the frequency of radiobiological effects (UNSCEAR 379 1993, 2000; Publication 79, ICRP 1998). Finally the rapidly developing 380 concordance noted in 2.1 between biophysical predictions on radiation 381 action, the biological importance of complex DNA damage and the 382 characteristics of radiation induced gene and chromosomal mutations add 383 weight to the conclusion that certain forms of DNA damage are critically 384 important to radiobiological effects. 385 386

11
2.3 DNA Damage response and repair 387 388 2.3.1 DNA repair, apoptosis and cellular signalling 389 390
Advances in knowledge of the mechanisms and consequences of post-391 irradiation processes in cells arguably represent the most profound change 392 in our understanding of radiobiology. Much of this advance can be 393 ascribed to the greatly improved technology and knowledge base that is 394 now characteristic of modern cell/molecular biology and genetics. The 395 UNSCEAR 2000, NCRP 2001 and Publication LDR-C-1 reports deal with 396 these issues in detail and only a few key conclusions are given here. 397 398
• The isolation and characterisation of critical DNA damage response 399 genes, eg for ATM, NBS and DNA PKcs proteins, have provided 400 insights into the structure and function of the most important 401 biochemical pathways that operate to recognise and signal the 402 presence of DNA damage. 403
• There is now good understanding of many of these pathways and 404 this leads to the view that error-prone repair of chemically complex 405 DNA double strand lesions best explains the cellular radiobiological 406 responses known for many years ie. the induction of chromosome 407 aberrations, gene mutation and cell killing. 408
• The potential for error-free, recombinational repair of DNA double 409 strand lesions is recognised but, since it is thought to be restricted 410 to the later phases of the cell cycle, its impact overall is not likely 411 to be great. 412
• Coupled with earlier cellular studies, molecular and biochemical 413 data add weight to the view that the activity of DNA damage 414 response and repair processes are major determinants of 415 dose/dose rate and radiation quality effects in cells. 416
• Post-irradiation programmed cell death (apoptosis) and delaying 417 effects on the passage of cells through their reproductive cycles are 418 now much better understood at the molecular and biochemical 419 levels. 420
• In terms of protective effects, apoptotic elimination of radiation 421 damaged cells may be viewed as an alternative to repair ie 422 apoptotic death reduces the frequency of viable cells carrying 423 mutations. 424
• The imposition of cell cycle checkpoints in irradiated cells has been 425 biochemically linked with the complex network of DNA damage 426 signalling and may serve to maximise opportunities for repair or as 427 points where the cell decides its fate (life or death) on the basis of 428 biochemical balance. 429
• New highly sensitive techniques for studying the induction of DNA 430 double strand breaks in single cells and post-irradiated cellular 431 signalling show great promise for gaining knowledge of DNA 432 damage response at low doses. 433
434

12
A critical element in the advances that underpin the above judgements is 435 the now compelling evidence that perturbation of DNA damage 436 response/repair and apoptotic/cell cycle control are often closely 437 associated with tumorigenic development. This concept gives increased 438 confidence that these cellular activities are integral to the cellular defences 439 mounted against post-irradiation tumour development. This in turn means 440 that the characteristics of these cellular processes are important elements 441 in the development of judgements in radiological protection. 442
443 2.3.2 Adaptive responses 444 445
The relatively high level of knowledge gained on post-irradiation DNA 446 repair, apoptosis and cellular signalling may be contrasted with the 447 continuing uncertainty on the mechanisms and significance of so called 448 adaptive responses. Typically, in some experimental systems, adaptive 449 responses are seen in cells conditioned by a priming dose of radiation. In 450 some way this conditioning dose allows cells to develop increased 451 resistance to a second radiation challenge. 452 453 Data relating to adaptive responses of various types have been reviewed 454 extensively (UNSCEAR 1994, 2000; NCRP 2001; Publication LDR-C-1). 455 The principal conclusions from these reviews may be summarised as 456 follows: 457 458 • There is evidence that adaptive responses are not a universal feature 459
of cells in vitro nor in vivo. 460 • Even in the most well studied cellular system (cytogenetic response in 461
human lymphocytes) there is a) no evidence that adaptive responses 462 may be triggered by doses of a few tens of milligray and b) there is 463 considerable donor variation in the expression of the response. 464
• Although some studies support an association with more general stress 465 response mechanisms, chemical radical scavenging and/or more 466 efficient DNA repair, mechanistic knowledge of adaptive responses 467 remains fragmentary. 468
• Although there are some positive results, animal studies on tumour 469 induction (and immune response) do not provide consistent evidence 470 of adaptive responses that reduce health effects. 471
472 2.4 The induction of gene and chromosomal mutations 473 474
As noted earlier there are now strong links between the biophysical 475 processes that determine the induction of complex DNA double-strand 476 lesions, error-prone DNA damage response/repair processes and the forms 477 of gene and chromosomal mutations (DNA sequence loss or 478 rearrangement) characteristic of ionising radiation exposure. Much of the 479 available quantitative dose-response data for cells pre-date Publication 60 480 and the specific forms of mutational dose-response recorded depend upon 481

13
the biological system, the mutational endpoint, radiation quality (LET) and 482 dose-rate (Thacker 1992; UNSCEAR 1993, 2000). 483 484 In general, however, mutational dose-responses are linear-quadratic for 485 low LET and tend towards linearity as LET increases. For low LET 486 radiations, reduction in dose-rate usually reduces the frequency of induced 487 gene/chromosomal mutations in mammalian somatic and germ cells. The 488 maximum dose-rate reduction factor is usually 3-4 but it can be somewhat 489 higher for chromosome aberration induction in human lymphocytes. A 490 reasonably consistent relationship between RBE and LET for mutation 491 induction has also been recorded with maximum values for RBE of around 492 10-20 usually being seen in the LET range 70-200 keV µm-1. 493 494 A novel feature of recent studies involving ‘chromosome painting’ 495 techniques is that complex chromosome exchanges involving the 496 interaction of >2 breakpoints are infrequent at low doses of low LET 497 radiation but can be a significant fraction of high LET induced events at all 498 doses. Advances in the understanding of radiation action on cellular DNA 499 has included modelling of the formation of chromosomal exchanges but 500 contention remains on whether these exchanges demand the interaction of 501 two damaged sites or whether a significant fraction derives from the 502 interaction of damaged and undamaged sites (UNSCEAR 2000). Since 503 1990 considerable effort has been made to investigate the induction of 504 gene and chromosomal mutations at low doses. There are many technical 505 factors that limit the resolution of such low dose effects but two studies 506 are notable. 507 508 First, a large scale investigation of chromosome aberration induction by x-509 rays in human lymphocytes provided evidence of a linear dose-response at 510 low doses with a limit of resolution of around 20 mGy. Second, the use of 511 a highly sensitive in vivo mutation system relating to pigment-producing 512 cells in mouse skin showed linearity of mutational dose response down to 513 the lowest x-ray doses of around 50 mGy (see UNSCEAR 2000, 514 Publication LDR-C-1). 515 516 There have also been valuable developments in the use of chromosomal 517 aberration not only as biomarkers of radiation exposure but also for the 518 purposes of establishing relationships between in vivo cellular response, 519 dose/dose rate effects and potential health outcomes (Tucker et al 1997; 520 Tawn et al 2004). 521
522 2.5 Epigenetic responses to radiation 523 524
A major feature of radiobiological research since 1990 has been a range of 525 studies that provide evidence of post-irradiation cellular responses that 526 appear to result in genomic change and/or cellular effect without an 527 obvious requirement for directly induced DNA damage (see Churubini et 528 2001, Publication LDR-C-1). In a broad sense these processes may be 529

14
termed epigenetic and they contrast with the well established 530 radiobiological concept of direct DNA targeting by ionising radiation tracks 531 which has underpinned much of the post 1990 developments in biophysics 532 and DNA damage response. Although there are elements of overlap, these 533 epigenetic effects may be placed in two categories a) radiation induced 534 genomic instability; b) post-irradiation bystander signalling between cells. 535 536
2.5.1 Radiation induced genomic instability 537 538 Whereas conventional DNA damage response is known to result in the 539 expression of genomic damage within the first or second post-irradiation 540 cell cycles, the term induced genomic instability broadly describes a set of 541 phenomena whereby genomic damage and its cellular consequences are 542 expressed persistently over many post-irradiation cell cycles (Little 2003; 543 Morgan 2003). This instability, as expressed in cultured cells, can take the 544 form of increased frequencies of chromosome aberrations, gene mutations 545 and apoptosis/cell death; other manifestations have also been recorded. 546 Publication LDR-C-1 has reviewed the recent evidence concerning induced 547 genomic instability including the examples given below. 548 549 Much of the in vitro cellular work on induced genomic instability has been 550 performed using chromosomal endpoints. Although persistent 551 chromosomal instability has been reproducibly demonstrated in mass 552 cultures of established cell lines there have been fewer studies of clonal 553 cell populations and normal diploid cells. In this context a recent 554 cytogenetic study with human diploid fibroblasts using mass culture and 555 clonal techniques was particularly revealing in that it found no evidence of 556 instability phenomena. 557 558 This negative result raises the possibility that induced genomic instability 559 is preferentially expressed in abnormal or genetically altered cells and this 560 would be consistent with the difficulties experienced in clearly 561 demonstrating the phenomenon in vivo. After in vivo exposure of humans 562 and mice to high and low LET radiations cytogenetic results have been 563 negative or showed inconsistent evidence of persistent instability in 564 haemopoietic cells. Nevertheless there are positive results in certain 565 mouse strains and further work is called for. In addition, there are 566 indications that in mice the expression of induced genomic instability 567 varies with genetic background and, in some cases, it may associate with 568 deficiency in DNA damage response. 569
570 The biological basis of induced genomic instability in its various forms is 571 not well understood. Some biochemical data suggest the involvement of 572 cellular stress and oxidative processes; other cytogenetic studies implicate 573 potentially unstable DNA segments encoding DNA repeat sequences . 574 575

15
2.5.2 Post-irradiation bystander signalling 576 577 The so called bystander effect relates to the expression of cell 578 death/apoptosis, gene/chromosomal mutation, genomic instability and/or 579 changing patterns of protein abundance in cells not directly intersected by 580 radiation tracks (see Little 2003, Morgan 2003, Mothersill and Seymour 581 2001). These bystander cells are believed to be responding to signals 582 from their irradiated neighbours via intercellular communication mediated 583 by molecules passing through gap junctions in adjoining cell membranes 584 or via diffusion of these signalling molecules through the cell culture 585 medium. Data relating to the bystander effects of radiation are reviewed 586 in Publication LDR-C-1 and only a few points are noted here. 587 588 Experimental studies on the bystander effect in cultured cells have been 589 greatly facilitated by the development of microbeam irradiation facilities 590 which allow the delivery of defined numbers of radiation tracks to cells or 591 their nuclei. In this way cellular effects arising in unirradiated cells may be 592 specifically determined. Alternatively cells may be irradiated in mass 593 culture with a fluence of particles that allow for only a fraction of cells/cell 594 nuclei to be intersected. The expression of bystander signalling is then 595 evidenced by a frequency of cellular effects that exceeds the number of 596 track intersections. 597 598 The majority of bystander studies relate to cellular irradiation with high 599 LET alpha particles and protons although some low LET studies, 600 particularly on signalling through the growth medium, are available. The 601 biological mechanisms involved in bystander signalling are probably 602 diverse and remain to be adequately elucidated. Some data point towards 603 induction of oxidative stress and modulation of DNA damage response 604 pathways. In the case of effects mediated through the culture medium, 605 there is some evidence for the release of chromosome-damaging 606 (clastogenic) factors from irradiated cells and the mobilisation of 607 intracellular calcium together with increased reactive oxygen species in 608 recipient cells. 609 610 Thus, the phenomena of induced genomic instability and bystander effects 611 when expressed in vitro may show some common stress-related 612 mechanisms. There are, however, few data and some controversies on 613 the relative contribution of bystander signalling to cellular effects overall 614 and the extent to which this is dose-dependent. Studies on bystander 615 effects in vivo are in their infancy although there are some positive data 616 relating to clastogenic factors. 617
618 2.6 Tissue Reactions 619 620 There have been no profound changes in scientific views on the 621
quantitative aspects of radiation-induced tissue reactions (deterministic 622 effects) since 1990. However, there have been some developments 623

16
concerning the mechanisms through which these reactions may be 624 modified (see also section 3). 625
626 An increasing number of studies on early tissue reactions has shown the 627
ability to modify these using various cytokines and growth factors, 628 primarily to stimulate regeneration of progenitor cells. Other biological 629 response modifiers can be used for late reactions, in particular vascular 630 modifying agents that delay the expression of organ damage induced in 631 experimental animal systems. This ability to modify the response of 632 tissues and organs has prompted consideration of a change in the term 633 ‘deterministic effects’ to tissue and organ reactions, because the effects 634 are not necessarily pre-determined in quantitative terms. 635
636 It has been recognised more since the 1990 recommendations that the 637
structure of tissues and organs plays a major role in their response to 638 irradiation. Paired organs, or organs where the functional subunits (FSU) 639 are arranged in parallel, rather than in series, can sustain inactivation of 640 many FSU without clinical signs of injury, because of a substantial reserve 641 capacity and compensation by the remainder of FSU. This is one of the 642 major reasons for the presence of a threshold dose for overt injury, and in 643 particular for a high tolerance to partial-body irradiation, where a critical 644 part of such organs may be spared. 645
646 Late tissue reactions not only have a long and dose-dependent latency 647 period before expression, but also they have a long progression period, 648 with the incidence in many cases still rising well past 10 years after 649 irradiation. Late reactions can be ‘generic’, which means arising in the 650 responsible target tissue, and other late reactions can be ‘consequential’, 651 meaning arising as a consequence of a severe early reaction affecting the 652 target tissue for late reactions to exacerbate the latter. 653
654 There has been a consolidation of the use of the linear-quadratic 655 formalism for describing the changes in iso-effective dose resulting from 656 changes in the pattern of dose delivery, i.e. acute single doses, 657 multifractionated doses, or continuous exposures. In general, the ratio of 658 the linear and quadratic constants is higher for early reactions and 659 consequential late reactions, and lower for generic late reactions. 660
661 2.7 Mechanisms of Radiation Tumorigenesis 662 663
The technical and academic developments in biology since 1990 have also 664 had a major impact on our understanding the complex process of 665 multistage tumorigenic development (eg. UNSCEAR 1993, 2000; NCRP 666 2001; Publication LDR-C-1). 667 668 In brief both lympho-haemopoietic and solid tumours are believed to 669 originate from single stem-like cells in their respective tissues. Certain 670 gene and chromosomal mutations which are often tissue-specific can 671

17
confer cellular properties which allow these target stem cells to partially 672 escape from their normal constraints of growth and development. In 673 some cases these cells acquire novel properties via gain of function 674 mutations in so called oncogenes; in others, it is loss of function of so 675 called tumour-suppressor genes that applies. On current hypotheses, the 676 full potential for malignancy in these tumour-initiated cell clones is then 677 developed in a step-wise fashion via the appearance of other gene/ 678 chromosomal mutations or in some cases the non-mutational silencing of 679 key genes. In this way, over time, tumours develop increasing malignant 680 potential by growth selection and the bypass of cell senescence. In some 681 cases the rate of tumour development may be increased following the 682 acquisition of mutations that result in the de-stabilisation of DNA and 683 chromosomes. This process of accelerated mutation rate can be a major 684 drive for tumorigenesis in some tissues but, given its clear mutational 685 basis, tumour-associated genomic instability is distinct from the 686 phenomenon of radiation induced genomic instability noted in Section 2.5. 687 688 Tumour development is however far more complex than the stepwise 689 accumulation of clonal mutations. There is good evidence that the micro 690 environmental interaction of tumorigenic and normal cells is a critical 691 element in cancer development and the recruitment of a blood supply to 692 an evolving solid tumour is one important example of this. 693 694 Since 1990 there has been good progress in understanding the 695 mechanistic basis of radiation tumorigenesis using animal models and by 696 undertaking genetic analysis of certain radiation-associated human 697 tumours (see UNSCEAR 1993, 2000; NCRP 2001; Publication LDR-C-1). 698 699
2.7.1 Animal models of radiation tumorigenesis 700 701 A combination of cellular, cytogenetic, molecular and histopathological 702 techniques has been employed to investigate experimentally multistage 703 radiation tumorigenesis. Much of the most informative work has been 704 undertaken in rodent models with some of these models having a genetic 705 basis which has been informed by studies with human counterpart 706 tumours. In brief for leukaemia and solid tumours of the skin, bone, 707 brain, lung, breast and gastro-intestinal tract there is evidence on the 708 process of multistage tumorigenesis after radiation and the identity of 709 some of the critical mutations involved. Many of these mutations are 710 present in the human counterpart tumours and also in the same rodent 711 tumours arising spontaneously or after exposure to other carcinogens. 712 Overall a key message from these studies is that radiation tumorigenesis 713 appears to proceed in an unremarkable multistage manner with no 714 obvious features that distinguish radiation as an unusual carcinogen. In 715 particular, although data remain sparse, there are as yet no indications 716 that the epigenetic process of induced genomic instability makes a 717 consistent and major contribution to radiation tumorigenesis. By contrast, 718 in those animal models where it has proved possible to associate radiation 719

18
exposure with a specific gene or chromosomal mutation, radiation appears 720 to be acting at a very early stage (initiation) in tumorigenesis via a gene 721 loss mechanisms that is consistent with the principal mechanism of in vitro 722 somatic cell mutagenesis noted in Section 2.4. 723 724 Data from quantitative animal studies on radiation tumorigenesis are 725 important for the development of some critical judgements in radiological 726 protection. The implications of such data for consideration of the effects of 727 dose, dose-rate and radiation quality effects are noted later in this report. 728 729
2.7.2 Radiation-associated human tumours 730 731 There are limited opportunities for mechanistic investigations with human 732 tumours which have a high probability of radiation causation. The 733 cytogenetic and molecular studies undertaken with radiation-associated 734 tumours of lung, liver, thyroid, skin and bone marrow have tended to 735 focus on particular gene or chromosomal mutations and the relationship 736 between these mutations and initial radiation damage remains unclear 737 (UNSCEAR 2000). However, in general accord with the results of animal 738 studies, the human data developed since 1990 do not suggest that 739 radiation tumorigenesis proceeds in an unusual fashion; evidence for the 740 presence of specific mutational signatures of radiation is currently lacking. 741 The involvement of induced genomic instability in radiation tumorigenesis 742 has been found to be lacking or is viewed as controversial (Nakanishi et al 743 2001; Cox and Edwards 2002; Lohrer 2001). 744 745
2.7.3 Genetic susceptibility to cancer 746 747 The issue of inter-individual genetic differences in susceptibility to 748 radiation-induced cancer was noted in Publication 60 and reviewed in 749 Publication 79 (ICRP 1998) and UNSCEAR (2000, 2001). Since 1990 there 750 has been a remarkable expansion in knowledge of the various single gene 751 human genetic disorders where excess spontaneous cancer is expressed in 752 a high proportion of gene carriers – the so called high penetrance genes. 753 There is also a growing recognition and some data on variant genes of 754 lower penetrance where gene-gene and gene-environment interactions 755 determine a far more variable expression of cancer. 756 757 Studies with cultured human cells and genetically altered laboratory 758 rodents have also contributed much to knowledge and, with more limited 759 epidemiological/clinical data, suggest that a high proportion of single gene, 760 cancer-prone disorders will show increased sensitivity to the tumorigenic 761 effects of radiation. 762 763 Recently, good progress has been made in demonstrating experimentally 764 the complex interactions that may underlie the expression of cancer-765 predisposing genes of lower penetrance; this work is however in its 766 infancy. 767

19
2.8 Heritable diseases 768 769
Views on the risks of induction of heritable diseases by radiation exposure 770 of the gonads were developed in Publication 60 by extrapolating 771 quantitative data on dose-response for germ cell mutations in 772 experimental animals (predominantly mice) to humans. Although 773 extended follow-ups of mortality and cancer incidence in the offspring of 774 the Japanese A-bomb survivors have been published (Izumi et al 2003a, 775 2003b) these data do not alter the conclusions of previous analyses. In 776 addition, few new quantitative data on mutation induction in mice have 777 become available. However, since 1990 there have been significant 778 developments in our understanding of the mutational process and new 779 concepts for genetic risk estimation in human populations (UNSCEAR 780 2001). 781 782 The application of molecular genetic techniques has provided detailed 783 knowledge of the molecular basis of naturally-occurring mutations that 784 cause heritable diseases in humans; also of radiation-induced gene 785 (specific locus) mutations in mouse germ cells. There is now strong 786 evidence that large multi-locus deletions of the genome constitute the 787 predominant class of radiation-induced mutation. It is judged that only a 788 proportion of such multi-gene loss events will be compatible with 789 embryonic/fetal developmental and live birth. These findings have led to 790 the concept that the principal adverse genetic effect in humans is likely to 791 take the form of multi-system developmental abnormalities rather than 792 single gene diseases. 793 794 Another conceptual change based upon new human genetic information is 795 the development of methods to assess the responsiveness of the 796 frequency of chronic multifactorial diseases (eg coronary heart disease and 797 diabetes) to an increase in mutation rate. This has allowed an improved 798 estimate to be made of the risks associated with this large and complex 799 class of disease where expression requires the interaction of genetic and 800 environmental factors. 801 802 These human genetic, experimental and conceptual advances have been 803 integrated to form a new and more robust framework for the estimation of 804 genetic risks (UNSCEAR 2001). 805 806 There have also been developments on the estimation of radiation-induced 807 mutation rates in mice and humans using expanded simple tandem DNA 808 repeat (ESTR) loci in mice and minisatellite loci in humans. These DNA 809 repeats are highly mutable with the mutations manifesting as changes in 810 the number of tandem repeats. This increased mutability is expressed 811 spontaneously and after radiation and attention has been given to the 812 mutational mechanisms involved, including the untargeted and 813 transgenerational effects of radiation (UNSCEAR 2000, 2001; CERRIE 814 2004). However, since on current knowledge mutations at these DNA 815

20
repeat sequences are only rarely associated with genetic disorders, the 816 Task Group judges that there is no good reason to include quantitative 817 mutational data for these loci in the estimates of genetic risk given in 818 Section 6 of this report. 819

21
3. Risks of Tissue Injury 820 821 3.1 Revision of judgements given in Publication 60 822 823 3.1.1 Definition of stochastic effects and tissue reactions 824 825
The deposition of energy by ionising radiation is a random process. Even 826 at very low doses it is possible that sufficient energy may be deposited 827 into a critical volume within a cell to result in cellular changes or cell 828 death. The killing of one or a small number of cells will, in most cases, 829 have no consequences in tissues, but modifications in single cells such as 830 genetic changes or transformations leading ultimately to malignancy, may 831 have serious consequences. These effects resulting from damage in a 832 single cell are termed stochastic effects. There is a finite probability of the 833 occurrence of such stochastic events even at very low doses, so there will 834 be no threshold dose unless all such events can be repaired up to some 835 level of dose. As the dose is increased the frequency of such events 836 increases, but in the absence of other modifying factors, the severity of 837 the resultant effects is not expected to increase, in contrast to the case for 838 tissue reactions (see below). 839
840 With larger doses there may be a substantial amount of cell killing, 841 sufficient to result in detectable tissue reactions. These reactions may 842 occur early or late after irradiation. The depletion of renewing 843 parenchymal cell populations, modified by stromal influences, plays a 844 crucial role in the pathogenesis of early tissue reactions. In order to reach 845 the level of detection, a given proportion of cells must be depleted. This 846 constitutes a threshold, which depends on the specified level of injury. 847
848 When the term stochastic was introduced, effects caused by injury in 849 populations of cells were called non-stochastic (Publication 41 (ICRP 850 1984)). This was later considered an unsuitable term, and in Publication 851 60 (ICRP 1991) it was replaced by the term deterministic, meaning 852 “causally determined by preceding events”. Now it is recognised that both 853 early and late tissue reactions are not necessarily predetermined, and they 854 can be modified after irradiation by the use of various biological response 855 modifiers. Hence it is considered preferable to refer to these effects as 856 early or late tissue or organ reactions. These reactions are distinct from 857 the stochastic effects in tissues, which are the induction of cancers from 858 irradiated somatic cells and genetic diseases in offspring following parental 859 germ cell irradiation. 860
861 3.1.2. Tissue and organ reactions 862 863
Early tissue reactions (hours to a few weeks) can be inflammatory-type 864 reactions as a result of cell permeability changes and histamine release 865

22
e.g. erythema, and subsequent reactions as a consequence of cell loss e.g. 866 mucositis, and epidermal desquamation. 867 868 Late tissue reactions (months to years) are called “generic” if they occur 869 as a result of injury directly in the target tissue e.g. vascular occlusions 870 leading to deep tissue necrosis after protracted irradiations, or 871 “consequential” if they occur as a result of early reactions, e.g. dermal 872 necrosis as a result of severe epidermal denudation and chronic infection, 873 and intestinal strictures caused by severe mucosal ulceration (Doerr and 874 Hendry, 2001). 875
876 3.1.3 Cell survival curves 877 878
Cell depletion plays a major role in the early desquamatory reactions in 879 tissues after irradiation. In a few cell types and tissues, rapid cell loss 880 after irradiation is mediated by apoptosis, as exemplified by lymphocytes 881 and salivary glands. In other tissues, cell death is caused by reproductive 882 failure of regenerative stem cells, which may undergo apoptosis before or 883 after attempted mitoses, or of proliferating transit (differentiating) cells. 884 The majority of nonproliferating mature cells do not die from irradiation, 885 but from natural senescence. For a given level of tissue damage, it has 886 been shown that dose modifying factors for different irradiation conditions 887 are the same for survival of tissue target cells and for a given level of 888 early tissue reactions, demonstrating the importance of target cell survival 889 for these types of reaction (Hendry and Thames, 1987). 890 891 The survival of cells as a function of dose (Figure 3.1) is commonly 892 described using the linear-quadratic equation: 893
894 S = exp-(αD+βD2) 895
896 The constant α describes the linear component of cell sensitivity to killing 897 on a semi-log plot of survival (log) versus dose (linear), and β describes 898 the increasing sensitivity of cells to higher radiation doses. The ratio α/β 899 is the dose at which the linear and quadratic components of cell killing are 900 equal. This ratio is a measure of the curvature of the survival curve. The 901 α/β ratio is lower and the curve on a semi-log plot is more pronounced for 902 homogeneous, slowly proliferating cell populations, such as in slow-903 renewing organ systems like kidney and spinal cord. The α/β ratio is 904 higher and the survival curve is straighter for heterogeneous, rapidly 905 proliferating cell populations, such as the regenerative target cell 906 populations in oral mucosa and intestine. One possible contributor to this 907 straightening is the presence of subpopulations with different sensitivities 908 as a function of cell-cycle phase. The α/β ratio is generally in the range 909 7-20 Gy for early reactions in tissues (10 Gy is commonly used) and 910 0.5-6 Gy for late reactions (3 Gy is commonly used). 911 912

23
When dose rates are lower than around 0.1 Gy/hour there is repair of 913 cellular radiation injury during the irradiation. This causes the β 914 component to decrease and to reach zero at very low dose rates. The α 915 component is not modifiable by changing dose rate. A special feature for 916 some cell types is hypersensitivity to doses less than 0.5 Gy, typically at 917 0.2-0.3 Gy (Joiner et al 2001), but not at higher doses. This causes a 918 deviation from the smooth linear-quadratic cell survival curve. It is 919 considered by some to be due to stimulation of repair processes at doses 920 above 0.2-0.3 Gy. The deviation has been detected for early skin 921 reactions in humans, and for skin reactions and kidney injury in 922 experimental animal systems. 923 924 With high LET irradiations, there is less repairable injury and hence the β 925 component and dose rate effects are small or absent. There is also no 926 hypersensitivity component to the survival curve. 927
928 3.1.4 Early and late reactions in tissues and organs 929 930
Early desquamatory reactions in epithelia, and depression of the 931 haemopoietic system, are caused by the sterilisation of stem and 932 progenitor cells in the tissues, resulting in a transitory or permanent lack 933 of mature cells depending on the level of dose. Such reactions are 934 characteristic of the radiation response of renewing cell lineages, such as 935 epidermis, mucosa, haemopoiesis and spermatogenesis. The time course 936 of expression and restoration of tissue components generally depends on 937 their normal rate of renewal, and is dose-dependent at low doses but not 938 at high doses. Complete denudation of such tissues after high doses 939 occurs at a time equivalent to the lifetime of new mature cells plus those 940 produced by any radioresistant progenitor cells. The stroma produces a 941 variety of growth factors that induce the repopulation and differentiation 942 needed to restore particular tissue components. The time course can be 943 advanced and the restoration made more complete by the application of 944 exogenous growth factors that further stimulate the reparative processes. 945 946 Late reactions in tissues are due in part to the slow rate of renewal and 947 death of component cell populations, where the cells are functional as well 948 as capable of division (Michalowski, 1981; Wheldon et al. 1982). Late 949 reactions are also due to dysfunction of a complex system of inter-cellular 950 signalling pathways which normally regulate the various tissue and organ 951 functions (Rubin et al 1998). In some tissues it has been shown that 952 different types of damage appear after different latency periods. For 953 example, in spinal cord, there is an early demyelination effect within a few 954 months, then a second phase of demyelination and necrosis of the white 955 matter after 6-18 months, and a later phase after 1-4 years that is mostly 956 a vasculopathy (van der Kogel 2002). 957 958 In most tissues, responses are greater when irradiated volumes are larger. 959 With early skin reactions, the volume effect is due largely to the 960

24
decreasing ability to heal large areas mainly because of limited cell 961 migration from the margins. With late reactions the volume effect relates 962 to organ architecture. In spinal cord the critical elements are arranged in 963 series, so that when more elements are irradiated there is a greater 964 chance of inactivating one of them to cause paralysis. There is also less 965 benefit from cellular migration from the edges of the radiation field when 966 irradiated volumes are larger. By contrast, in for example kidney and 967 lung, the tissue functional subunits (FSU, respectively nephrons and 968 alveoli) are arranged in parallel (Withers et al 1988). In these cases, 969 there can be inactivation of some FSU without causing a decrease in organ 970 function, until a critical number of FSU is reached. Late tissue injury is 971 progressive and strongly dose dependent, and it has been shown that the 972 incidence of late morbidity after radiotherapy in humans continues to 973 increase gradually to 10 years and beyond (Jung et al 2001). There are 974 various procedures that have been shown in experimental animal systems 975 to delay the onset and development of late radiation morbidity (see 976 below). 977 978 Tissues vary not only in their temporal responsiveness, but also in their 979 radiosensitivity. Among the most radiosensitive tissues are the ovary and 980 testes, bone marrow, and the lens of the eye. In general, the dose-981 incidence relationship for these tissues will be sigmoid in shape when 982 plotted on linear axes, the effect becoming more frequent as the dose 983 increases (Figure 3.2a). Tissue and organ reactions vary with the dose, in 984 severity as well as in incidence. The upper panel in Figure 3-3 illustrates 985 how the incidence of a particular reaction, defined as a clinically 986 recognisable pathological condition, increases as a function of dose in a 987 population of individuals of varying sensitivities. The lower panel in Figure 988 3.3 represents the dose-severity relationship for a population of individuals 989 with various sensitivities. The severity of the pathological condition 990 increases most markedly in those individuals in a subgroup who are most 991 sensitive (curve a), reaching the threshold of detectability at a lower dose 992 than in the less sensitive groups (curves b and c). The range of dose over 993 which the different subgroups cross the same threshold of severity is 994 reflected in the upper panel of Figure 3.3, which shows the frequency of 995 the pathological condition in the total population, and which reaches 100% 996 only at that dose which is sufficient to exceed the defined threshold of 997 severity in all members of the population. 998 999 In reality, substantially less than 1% of an average population is very 1000 radiosensitive because of inherited mutations in important damage-1001 sensing or repair genes. The remainder has a spectrum of sensitivities, 1002 and this has a flattening influence on the slope of the dose-incidence 1003 curve. This modification of the slope is in addition to primary contributions 1004 from inherent target-cell sensitivity and from features of tissue 1005 architecture discussed above. It is not yet possible to determine 1006 accurately the sensitivity of individuals within this spectrum of 1007 radiosensitivities, using cellular or molecular tests. 1008

25
1009 Threshold doses for some tissue and organ reactions in the more 1010 radiosensitive tissues in the body are shown in Table 3.1. These have 1011 been deduced from various radiotherapeutic experiences and accidental 1012 exposure incidents. In general, fractionated doses or protracted doses at 1013 low dose rate, are less damaging than are acute doses. 1014
1015 3.1.5 Mortality after whole body exposure 1016 1017
Mortality after irradiation is generally the result of severe cell depletion in 1018 tissues of, or other major dysfunction of, one or more vital organs of the 1019 body. After partial body irradiation, or inhomogeneous whole body 1020 irradiation, the probability of death will depend on the particular organs 1021 exposed, the volume irradiated, and the dosage level. After whole body 1022 irradiation which is fairly homogeneous, for example with penetrating 1023 photon beams above about 1 MeV energy, death may occur from one of 1024 several distinct syndromes which are characteristic of particular dose 1025 ranges, and which are due to injury in specific organ systems. 1026 1027 For a specific syndrome potentially leading to death, the relationship 1028 between the percentage of survivors and the dose is sigmoid in shape on a 1029 linear plot, whereas for a transformed probability-linear plot the shape is 1030 approximately linear (Figure 3.2b). The survival-dose relationship is often 1031 described by its midpoint, the LD50 i.e. the dose that is lethal for half of 1032 the individuals, and the slope of the curve. The slope can be characterised 1033 by the probit width, which is the standard deviation of the distribution, or 1034 by other parameters in other transformations of the data. Values of LD5-10 1035 and LD90-95 are helpful in assessments of the dose that will result in the 1036 death of only a few or of many. 1037 1038 For a normal healthy adult human, the LD50/60 i.e. within 60 days, is 1039 around 4 Gy midline dose, but there are estimates in the literature ranging 1040 from 3 to 5 Gy. Estimates of LD10 are around 1-2 Gy, and around 5-7 Gy 1041 for LD90 (UNSCEAR, 1988 Annex G; NUREG, 1997). The cause of death is 1042 haemopoietic failure, resulting primarily from a lack of progenitor cells that 1043 produce functional short-lived granulocytes, as well as from haemorrhages 1044 without the replacement of radioresistant red cells. It is possible to 1045 improve the chances of survival of individuals exposed to doses around or 1046 even above the LD50/60 by appropriate medical care such as fluid 1047 replacement, antibiotics, antifungal drugs, and barrier nursing (UNSCEAR, 1048 1988 Annex G), by infusing platelets and concentrates of isologous blood 1049 stem cells, and by injecting growth factors such as granulocyte-1050 macrophage colony-stimulating factor. Some experts have considered 1051 that supportive medical treatment may increase the LD50/60 to around 5 1052 Gy, and possibly to around 6 Gy if growth factors are also employed 1053 (NUREG, 1997). In experimental animal systems these procedures have 1054 been shown to significantly increase the LD50 values (Table 3.2). Growth 1055

26
factors have been used for many years in the treatment of humans 1056 following whole body irradiation for haematological diseases. However, in 1057 the few cases of accidental radiation exposures where they have been 1058 used, they did not save the individuals who were considered at risk of 1059 death, possibly because of the delay in starting the growth factor 1060 treatment. However, the growth factors were reconsidered to be of some 1061 benefit. 1062 1063 At doses in excess of about 5 Gy, additional effects occur, including severe 1064 gastrointestinal (stem cell and endothelial capillary cell) damage which, 1065 when combined with haemopoietic damage, causes death in 1-2 weeks. 1066 There are few human data to assess accurately the LD50 for this syndrome, 1067 but it may be approaching 10 Gy acute dose (UNSCEAR, 1988 Annex G; 1068 NUREG, 1997), and supportive medical treatment and growth factors are 1069 expected to increase this approximate value. If some marrow and most of 1070 the gut have been spared because of inhomogeneous irradiation, then at 1071 acute doses above 10 Gy to the lungs, acute inflammation (pneumonitis) 1072 may occur leading to death. Renal damage also occurs in the same dose 1073 range, if the kidneys have been irradiated. All these effects potentially can 1074 be alleviated to some extent, as evidenced by the success of growth 1075 factors and other molecules in reducing tissue and organ injury in animal 1076 systems after irradiation (Table 3.2). At even higher doses towards 50 Gy 1077 and above, there is acute damage in the nervous and cardiovascular 1078 systems and the individual dies of shock after a few days (NCRP, 1974). 1079 Approximate doses for death at different times are given in Table 3.3. 1080 These are for high dose, low LET radiation given over a few minutes. 1081 1082 If the dose is given over a period of hours or more it requires a greater 1083 whole body dose for these effects to occur. For example, if the dose-rate 1084 is about 0.2 Gy per hour, LD50 values may be increased by around 50% 1085 (NUREG, 1997). If the dose is delivered over a month, the LD50/60 may be 1086 doubled (UNSCEAR, 1988 Annex G). At low (chronic) radiation dose rates, 1087 there is evidence of a chronic radiation syndrome affecting in particular 1088 the haemopoietic, immune and neural systems (Guskova et al 2002; 1089 AFRRI, 1994,1998; Akleyev et al 2002). The threshold doses for 1090 depression of the immune system is about 0.3-0.5 Gy per year (Akleyev et 1091 al, 1999), and estimated threshold doses for effects in other organs are 1092 given in Table 3.1. Severe reactions do not occur in most body tissues of 1093 adults or children after annual doses below 0.1 Gy over many years. Red 1094 bone marrow, reproductive cells, and the lens of the eye, show the 1095 greatest sensitivity. 1096 1097 Tissue and organ reactions resulting from exposure to high LET irradiation 1098 are similar to those from low LET exposure, but their frequency and 1099 severity are greater per unit absorbed dose of high LET irradiation. These 1100 differences are expressed in terms of the relative biological effectiveness 1101 (RBE) for the effect under consideration. The RBE of high versus low LET 1102

27
radiation is defined as the ratio of the absorbed dose of the reference low 1103 LET radiation to cause the same level of the same biological effect as that 1104 of a dose of high LET radiation. 1105 1106 RBE values for tissue and organ reactions are higher at lower doses and 1107 when low doses per fraction are given repeatedly to accumulate the total 1108 dose (Publication 58, ICRP 1989). RBE values tend to be smaller for early 1109 effects in haemopoietic and reproductive tissue, larger for gastrointestinal 1110 tract and skin, and even larger for late reactions in for example lung and 1111 kidney. 1112 1113 The effective maximum RBE will be that value which applies at the 1114 threshold dose for the particular effect under consideration. This will be 1115 less than the value RBEm, which is defined as the ratio of such doses at 1116 very low doses. This is the ratio of the linear components of the linear-1117 quadratic fittings to data at higher doses. Hence it represents an 1118 extrapolation to dose levels below the threshold dose, which is of 1119 theoretical but not of practical interest. It also ignores the possibility of 1120 occult hypersensitivity at very low doses. RBEm values for neutrons are 2-1121 5 times lower, and effective maximum RBE values are even lower, than 1122 values of RBEM values for stochastic effects in corresponding tissues. Thus 1123 the use of Q or wR values in cases where tissue effects are over-riding, 1124 would result in an overestimate of the contribution to the risk from high 1125 LET radiation. 1126
1127 3.1.6 Summary of projected estimates of dose-thresholds for morbidity and 1128
mortality 1129 1130
For the purposes of developing judgements for the forthcoming ICRP 1131 Publication PPRA-MC, the Commission requested the Task Group to update 1132 and summarise threshold estimates of the acute absorbed doses for 1% 1133 incidences of morbidity and mortality involving adult human organs and 1134 tissues after whole body gamma ray exposures. These 1% incidence 1135 estimates, derived by the Task Group from publications which utilise 1136 mathematical projections of dose-response data, are given in Table 3.4 1137 together with estimates of development times for the effects in question. 1138
1139 3.1.7 Dose limits for specific tissues 1140 1141
Publication 60 (ICRP 1991; paragraph 194 and Table 6) describes the need 1142 to provide dose limits for exposure of the eye and localised areas of the 1143 skin because these tissues are not necessarily protected against radiation-1144 induced reaction/injury by the limit on effective dose which, in these 1145 circumstances, protects against cancer development. 1146 1147 Information available since 1990 has not provided evidence necessitating 1148 a change of view in the tumorigenic radiosensitivity of the skin or relevant 1149 sub-cutaneous tissues. It is judged therefore that the occupational and 1150

28
public dose limits for the skin and hands/feet given in Table 6 of 1151 Publication 60 remain applicable. However, recent studies have suggested 1152 that the lens of the eye may be more radiosensitive than previously 1153 considered. In particular, among both A-bomb survivors (Minamoto et al 1154 2004) and a group of children treated for skin haemangioma (Hall et al 1155 1999), there is evidence of excesses of both cortical and posterior 1156 subcapsular cataract at doses somewhat lower than expected. In the 1157 assignment of a dose threshold for cataract, uncertainties are recognised 1158 on the mechanisms of cataract development; also, on the relationship 1159 between the detection of lens opacity and the expression of visual 1160 impairment. Nevertheless the recent data noted above led the Task Group 1161 to judge that the dose threshold for cataract (visual impairment) induction 1162 by acute dose, low LET radiation should be lowered to ~1.5 Gy (see Table 1163 3.4). The Task Group is also aware of unpublished data that also tend to 1164 support a lowering of this threshold dose. Until these new data are 1165 available for review it is recommended that the dose limit for the lens of 1166 the eye (annual equivalent dose) given in Publication 60 (Table 6) is 1167 retained, ie 150 mSv for occupational exposure and 15 mSv for the public. 1168 1169 A secondary issue that emerges is whether equivalent dose (Sv) or 1170 radiation weighted dose (Gy) should be used to express dose limits for 1171 these specific tissues. Given that these dose limits are required for 1172 operation of the general system of protection they may be regarded as a 1173 special case. On this basis it is recommended that in this special case the 1174 use of equivalent dose is retained for use by ICRP. 1175 1176
3.2 Effects in the embryo and fetus 1177 1178 The risks of tissue injury and developmental changes (including 1179 malformations) in the irradiated embryo and fetus have been reviewed 1180 recently in ICRP Publication 90 (2003). In the main, this review reinforced 1181 the judgements on in utero risks given in Publication 60 although, on some 1182 issues, new data allow for clarification of views. On the basis of 1183 Publication 90, the following conclusions can be summarised on the in- 1184 utero risks of tissue injury and malformation at doses up to a few tens of 1185 mGy low LET. 1186 1187 The new data from animal studies confirm embryonic sensitivity to the 1188 lethal effects of irradiation in the pre-implantation period of embryonic 1189 developments. At doses of a few tens of mGy such lethal effects will be 1190 very infrequent and the data reviewed provide no reason to believe that 1191 there will be significant risks to health expressed after birth. 1192 1193 In respect of the induction of malformations, the animal data strengthen 1194 the view that there are gestation age-dependent patterns of in-utero 1195 radiosensitivity with maximum sensitivity being expressed during the 1196 period of major organogenesis. On the basis of these animal data it is 1197 judged that there is a dose-threshold of around 100 mGy for the induction 1198

29
of malformations; therefore, for practical purposes, risks of malformation 1199 after low dose in-utero exposure may be discounted. ICRP Publication 90 1200 reviews the experimental data on neurodevelopment following in utero 1201 irradiation for which dose thresholds generally apply; it also considers 1202 human epidemiological data as summarised below. 1203 1204 The review of human A-bomb data on the induction of severe mental 1205 retardation after irradiation in the most sensitive pre-natal period (8-15 1206 weeks post-conception) now more clearly supports a dose-threshold of at 1207 least 300 mGy for this effect and therefore the absence of risk at low 1208 doses. The associated data on IQ losses estimated at around 25 points 1209 per Gy are more difficult to interpret and a non-threshold dose response, 1210 cannot be excluded. However, even in the absence of a true dose-1211 threshold, any effects on IQ following in-utero doses of a few tens of mGy 1212 would be undetectable and therefore of no practical significance. This 1213 judgement accords with that developed in Publication 60. 1214

30
Table 3.1: Estimates of the thresholds for deterministic effects in the 1215 adult human testes, ovaries, lens and bone marrow (from ICRP, 19841) 1216 1217
Threshold
Tissue and effect
Total dose received in a single brief
exposure (Gy)
Total dose received in highly fractionated
or protracted exposures (Gy)
Annual dose rate if received yearly in highly fractionated
or protracted exposures for many
years (Gy y-1)
Testes Temporary sterility 0.15 NA2 0.4 Permanent sterility 3.5-6.03 NA 2.0 Ovaries Sterility 2.5-6.0 6.0 >0.2 Lens Detectable opacities 0.5-2.04 5 >0.1 Visual impairment (Cataract)5 5.05 >8 >0.15 Bone marrow Depression of hematopoiesis 0.5 NA >0.46
1218 1 For further details consult Publication 41 (ICRP, 1984) 1219 2 NA denotes Not Applicable, since the threshold is dependent on dose rate rather than on total dose. 1220 3 See UNSCEAR, 1988. 1221 4 See also Otake and Schull, 1990 1222 5 Given as 2-10 Sv (NCRP, 1989) for acute dose threshold. 1223 See Table 3.4 and Section 3.1.7 for revised judgements by the Task Group. 1224 6 Possible reduction to 0.3 Gy y-1, on the basis of the Mayak and Techa River populations developing 1225 chronic radiation syndrome; judgement contingent on the bone marrow criterion used. 1226 1227
31
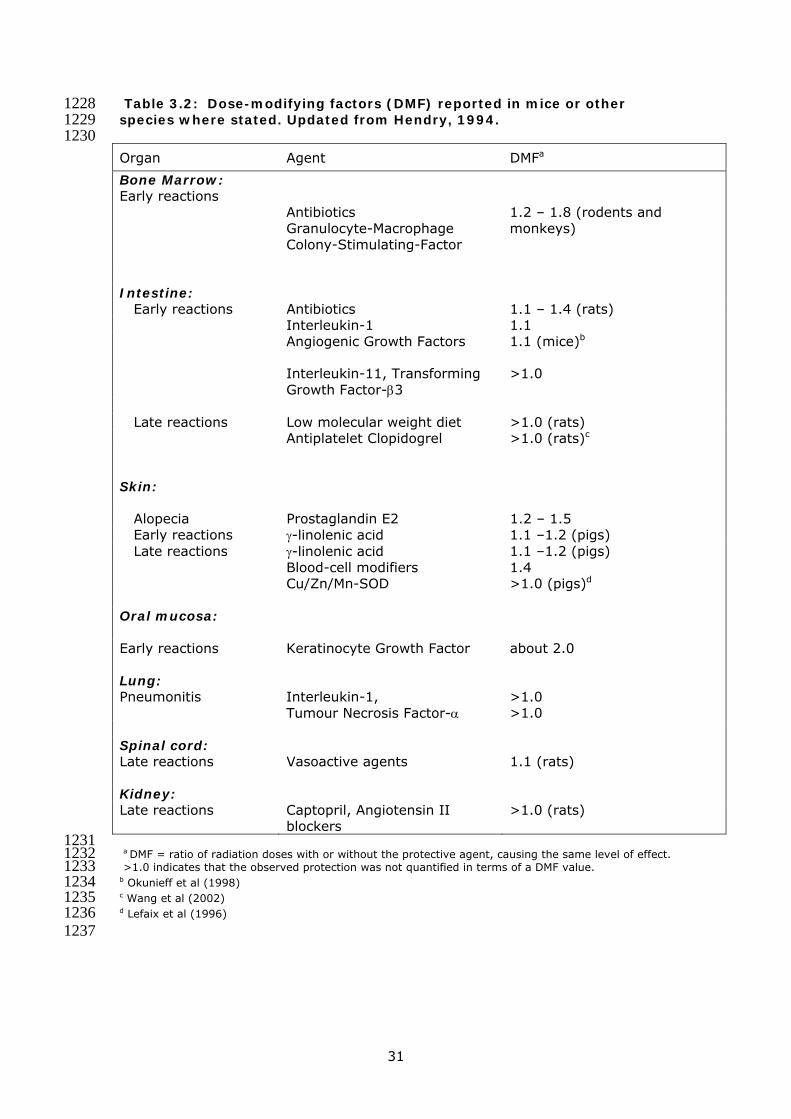
Table 3.2: Dose-modifying factors (DMF) reported in mice or other 1228 species where stated. Updated from Hendry, 1994. 1229 1230 Organ Agent DMFa
Bone Marrow: Early reactions
Antibiotics Granulocyte-Macrophage Colony-Stimulating-Factor
1.2 – 1.8 (rodents and monkeys)
Intestine: Early reactions Antibiotics 1.1 – 1.4 (rats) Interleukin-1 1.1 Angiogenic Growth Factors 1.1 (mice)b
Interleukin-11, Transforming Growth Factor-β3
>1.0
Late reactions Low molecular weight diet >1.0 (rats) Antiplatelet Clopidogrel >1.0 (rats)c
Skin:
Alopecia Prostaglandin E2 1.2 – 1.5 Early reactions γ-linolenic acid 1.1 –1.2 (pigs) Late reactions γ-linolenic acid 1.1 –1.2 (pigs) Blood-cell modifiers 1.4 Cu/Zn/Mn-SOD >1.0 (pigs)d Oral mucosa:
Early reactions Keratinocyte Growth Factor about 2.0 Lung: Pneumonitis Interleukin-1,
Tumour Necrosis Factor-α >1.0 >1.0
Spinal cord: Late reactions Vasoactive agents 1.1 (rats) Kidney: Late reactions Captopril, Angiotensin II
blockers >1.0 (rats)
1231 a DMF = ratio of radiation doses with or without the protective agent, causing the same level of effect. 1232 >1.0 indicates that the observed protection was not quantified in terms of a DMF value. 1233 b Okunieff et al (1998) 1234 c Wang et al (2002) 1235 d Lefaix et al (1996) 1236 1237
32
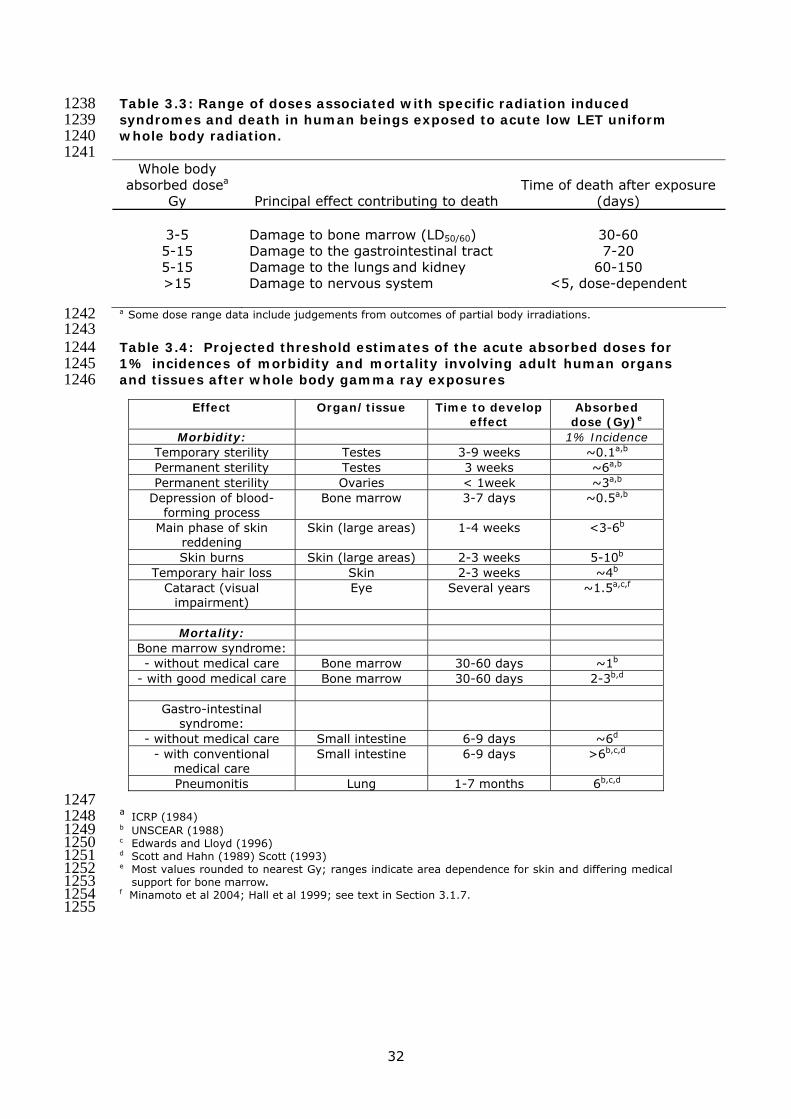
Table 3.3: Range of doses associated with specific radiation induced 1238 syndromes and death in human beings exposed to acute low LET uniform 1239 whole body radiation. 1240 1241
Whole body absorbed dosea
Gy Principal effect contributing to death Time of death after exposure
(days)
3-5 Damage to bone marrow (LD50/60) 30-60 5-15 Damage to the gastrointestinal tract 7-20 5-15 Damage to the lungs and kidney 60-150 >15 Damage to nervous system <5, dose-dependent
a Some dose range data include judgements from outcomes of partial body irradiations. 1242 1243 Table 3.4: Projected threshold estimates of the acute absorbed doses for 1244 1% incidences of morbidity and mortality involving adult human organs 1245 and tissues after whole body gamma ray exposures 1246
1247 a ICRP (1984) 1248 b UNSCEAR (1988) 1249 c Edwards and Lloyd (1996) 1250 d Scott and Hahn (1989) Scott (1993) 1251 e Most values rounded to nearest Gy; ranges indicate area dependence for skin and differing medical 1252
support for bone marrow. 1253 f Minamoto et al 2004; Hall et al 1999; see text in Section 3.1.7. 1254 1255
Effect Organ/tissue Time to develop effect
Absorbed dose (Gy)e
Morbidity: 1% Incidence Temporary sterility Testes 3-9 weeks ~0.1a,b Permanent sterility Testes 3 weeks ~6a,b
Permanent sterility Ovaries < 1week ~3a,b
Depression of blood-forming process
Bone marrow 3-7 days ~0.5a,b
Main phase of skin reddening
Skin (large areas) 1-4 weeks <3-6b
Skin burns Skin (large areas) 2-3 weeks 5-10b
Temporary hair loss Skin 2-3 weeks ~4b
Cataract (visual impairment)
Eye Several years ~1.5a,c,f
Mortality:
Bone marrow syndrome: - without medical care Bone marrow 30-60 days ~1b
- with good medical care Bone marrow 30-60 days 2-3b,d
Gastro-intestinal syndrome:
- without medical care Small intestine 6-9 days ~6d
- with conventional medical care
Small intestine 6-9 days >6b,c,d
Pneumonitis Lung 1-7 months 6b,c,d

33
1256
Figure 3.1: Dose-response for cell survival (S) on a semi-log plot described by the linear quadratic equation S = exp - (αD + βD2). From ICRP (1991).
Log cell survival

34
1257
Figure 3.2: Relationship between mortality and dose a) sigmoid relationship on a linear-linear plot b) linear relationship on a transformed
probability – linear plot. From ICRP (1991).

35
1258
Figure 3.3: Relationships between dose and the frequency and severity of tissue reactions. Upper panel - expected sigmoidal increase in frequency in a population of individuals with varying sensitivities. Lower panel – expected dose-severity relationships for three individuals with different sensitivities. From ICRP (1991).

36
4. Risks of Radiation Induced Cancer 1259
1260 In the development of judgements on the risk of radiation induced cancer 1261 in the dose range between a few mSv and a few tens of mSv, the Task 1262 Group have given attention to a:) the implications of fundamental data on 1263 radiation response; b) quantitative aspects of animal tumorigenesis; and 1264 c) direct epidemiological observation of cancer risk in humans, albeit at 1265 doses generally greater than a few tens of mSv. The conclusions reached 1266 by the Task Group on the implications of fundamental and animal data are 1267 used to guide the projection of higher dose epidemiological data for the 1268 purposes of estimating cancer risk in the low dose region of interest. Also, 1269 to consider the application of a dose and dose rate effectiveness factor 1270 (DDREF) that would apply to human exposures at low doses and low dose 1271 rates. Judgements developed in Section 6 on heritable effects are brought 1272 forward in order to provide new estimates of detriment and the nominal 1273 probability coefficients for risk in a single section of the report. 1274
1275 4.1 Fundamental data on radiation response 1276
1277 In formulating recommendations for protecting humans against the 1278 carcinogenic effects of radiation ICRP are required to consider a very broad 1279 span of biological data and concepts; many of these are subject to ongoing 1280 debate and, in some cases, contention. There is, however, general 1281 agreement that epidemiological methods used for the estimation of cancer 1282 risk do not have the power to directly reveal cancer risks in the dose range 1283 between a few mSv and a few tens of mSv. Accordingly there is a growing 1284 role for biological data in the development of ICRP recommendations and 1285 where there is uncertainty and/or contention there is a need to arrive at a 1286 scientifically balanced judgement based upon peer reviewed data. 1287 The principal criteria used by the Task Group in seeking a balanced view of 1288 biological data are captured in the questions given below. 1289 1290 • How relevant to in vivo human tumorigenesis are the radiobiological 1291
end points in question? 1292 • Is the design, methodology and statistical strength of a given study 1293
sufficient to support the published conclusions? 1294 • Do these published conclusions accord with those of similar studies and 1295
take adequate account of other relevant experimental data? 1296 1297 Where there are conflicting data and concepts: 1298 1299 • Which of the conflicting elements show greatest coherence with 1300
fundamental knowledge of the cancer process in general and, where 1301 possible, with epidemiological data? 1302
• How critical is the issue for the broad purposes of radiological 1303 protection? 1304
1305

37
These questions have been applied to a large set of published cancer-1306 related fundamental data considered by ICRP Committee 1 and by other 1307 committees with interests in radiation cancer risk (eg. UNSCEAR 2000; 1308 NCRP 2001; Publication LDR-C-1). From this evaluation the following 1309 judgements have been developed by the Task Group. 1310
1311 4.1.1 Dose response relationships for gene and chromosomal mutations 1312 1313
On the basis that the induction, by radiation, of gene and chromosomal 1314 mutations is of direct importance to the cancer process, the majority of 1315 relevant data from cellular studies is compatible with a simple relationship 1316 between dose and effect. A linear-quadratic form generally describes the 1317 full dose-response for low LET radiations. The most informative data, 1318 although sparse, suggest linearity down to doses of a few tens of mGy and 1319 there is no good reason to suggest a departure from this simple 1320 proportionality in the dose range down to a few mGy. At low LET radiation 1321 doses of a few mGy and below, linearity of response for targeted events in 1322 cells is expected because the fluence of tracks becomes equal to or less 1323 than the number of cells in the radiation field (see Section 2.1). If, 1324 however, bystander effects were to be shown to contribute substantially to 1325 low dose cellular effects in general then this expectation might not be met. 1326 1327
4.1.2 DNA damage-response in cells 1328 1329 There is much data to support the view that the activity of DNA damage 1330 response processes in cells is closely coupled with both cellular 1331 radiobiological effects and cancer development. On this basis the fidelity 1332 of post-irradiation DNA repair is expected to be a critical determinant of 1333 low dose response. Current data point towards the predominance of an 1334 inherently error-prone repair process for the chemically complex DNA 1335 double-strand lesions that are characteristic of radiation action. Error 1336 prone DNA repair at doses down to a few tens of mGy is consistent with 1337 the approximate linearity of cellular dose-response for gene/chromosomal 1338 mutations and implies a simple proportionality between dose and the 1339 cancer risk associated with such mutations. The possibility of biochemical 1340 changes in DNA repair fidelity at doses below a few tens of mGy cannot be 1341 excluded but there are no specific reasons to predict such changes. 1342 1343 A challenge to this conventional scientific view has come from proposals 1344 based upon the capacity of cells to sustain and repair a relatively high flux 1345 of spontaneously arising oxidative damage to DNA (see UNSCEAR 2000; 1346 Publication LDR-C-1). The question posed is that if cells can deal 1347 adequately with this relatively high level of spontaneous DNA damage then 1348 a small number of additional DNA lesions resulting from exposure to a few 1349 tens of mGy (~ 2 DNA double strand lesions or ~1 complex cluster per cell 1350 at ~50 mGy low LET) would be of little or no consequence for cancer risk. 1351 1352 1353

38
This challenge might have some strength if spontaneously arising and 1354 radiation-induced DNA lesions were to be of the same type. However, as 1355 noted in 2.1 and 2.3 there is good reason to believe that the clustered and 1356 chemically complex DNA lesions characteristic of radiation action arise 1357 very infrequently from spontaneous oxidative processes in cells; these 1358 oxidative processes tend to result in simple and readily repairable damage 1359 to the single strands of DNA. Since complex DNA lesions are inherently 1360 difficult to repair correctly, the challenging argument loses, therefore, 1361 much of its scientific strength. 1362 1363 These issues have been addressed in detail by UNSCEAR (2000) and ICRP 1364 Publication LDR-C-1 and for the reasons summarised above the Task 1365 Group concludes that the balance of evidence weighs against challenges to 1366 simple proportionality in low dose response that is based upon the relative 1367 abundances of spontaneous and radiation-induced DNA damage. 1368 1369 It has also been proposed that simple proportionality between dose and 1370 radiobiological effect may not apply in all circumstances because of the 1371 activity of the adaptive DNA damage response processes noted under 2.3. 1372 The Task Group recognises that the data on adaptive responses in human 1373 lymphocytes is reasonably reproducible but even these data show that this 1374 form of response is not consistently expressed in cell strains and has a 1375 poorly understood mechanistic basis. Other forms of adaptive response, 1376 eg. immunological stimulation, considered by UNSCEAR (1994, 2000) and 1377 that seen in some recent animal studies on tumorigenesis (Mitchel et al 1378 1999, 2003) are also judged to have most uncertain biological bases. 1379 1380 Overall, the Task Group concludes that the concept of adaptive responses 1381 to radiation lacks adequate biological support and the available data fail to 1382 provide good evidence of robust protective effects for cancer. The 1383 integration of the concept of adaptive response into a biological framework 1384 for radiological protection is therefore judged to be unjustified at this time. 1385
1386 4.1.3 Epigenetic responses to radiation 1387 1388
Although the Task Group is well aware that research is proceeding at a 1389 good pace the available data do not provide good evidence of a robust 1390 causal association between cancer risk and the epigenetic phenomena of 1391 induced genomic instability and bystander signalling. It seems likely that 1392 diverse stress-related cellular processes underlie the expression of both 1393 types of response but there is much uncertainty on dose-response 1394 characteristics, the extent to which in vivo expression occurs and how this 1395 might influence cancer risk. On this basis the Task Group suggest that, at 1396 present, it is not possible to meaningfully integrate data on these 1397 processes into the low dose judgements necessary for radiological 1398 protection. Indeed, since direct human epidemiological data at low LET 1399 doses of above around 100 mGy provide the principal means for 1400 estimating nominal cancer risk coefficients, at these doses cancer risk 1401

39
estimates will incorporate all relevant biological processes including the 1402 epigenetic factors noted in this report. The critical issue of uncertainty is 1403 therefore not simply whether such epigenetic factors influence cancer risk 1404 per se but rather whether the in vivo dose response characteristics might 1405 provide for differential contributions to risk at say 200 mSv compared with 1406 say 10 mSv. Similar conclusions on these epigenetic responses were 1407 drawn by the majority of members in the recently published report of the 1408 CERRIE Committee (CERRIE 2004). 1409
1410 4.2 Animal Data on Tumour Induction and Life Shortening 1411
1412 Animal data, largely from rodent studies, were included in consideration of 1413 relative biological effectiveness (RBE) in ICRP Publication 92 and have 1414 been reviewed in Publication LDR-C-1 in respect of dose-response and 1415 judgements on the dose and dose-rate effectiveness factor (DDREF). The 1416 relationship between RBE and radiation weighting (wR) is adequately 1417 summarised in Publication 92 and further developed in Publication FD-C-2. 1418 1419 In respect of dose response, the most reliable animal data are generally 1420 compatible with a simple proportionate relationship between dose and risk 1421 but there are examples of highly curvilinear threshold-like responses for 1422 the induction of thymic lymphoma and ovarian cancer in mice. The 1423 processes that underlie the induction of these tumour types have a high 1424 degree of dependence upon cell killing and for this reason these responses 1425 are judged by the Task Group to be atypical (see Publication LDR-C-1). 1426 1427 When mouse data for thymic lymphoma and ovarian cancers are excluded 1428 from analyses the values for DDREF from animal studies are generally 1429 compatible and at doses at or below around 2 Gy a DDREF value of 2 or 1430 less is implied. 1431
1432 4.3 Relative Biological Effectiveness (RBE) and Radiation Weighting 1433
(wR) 1434 1435 The relationships between RBE and wR were reviewed in Publication 92. 1436
The outcome of this review, which involved input from Committees 1 and 1437 2, was a recommendation that although the wR values for protons and 1438 neutrons required revision. wR values for other radiations given in 1439 Publication 60 remained appropriate. 1440
1441 For protons of energy >2 MeV it was judged in Publication 92 that the wR 1442
value of 5 given in Publication 60 is a significant overestimate of their 1443 biological effectiveness and for incident protons of practical importance 1444 (> 10 MeV) a wR of 2 was proposed. For neutrons, Publication 92 1445 proposed that ICRP continues the use of wR values that depend upon the 1446 energy of the incident neutrons. However, a continuous function as given 1447 in Publication 92 (Figure 1 of page 3) was recommended rather than the 1448 step function given in Publication 60. Publication 92 noted that for 1449

40
practical purposes this procedure will reduce problems of computation of 1450 effective dose but should not be taken to imply precise knowledge of the 1451 underlying biological effectiveness. The issues of wR for neutrons and 1452 photons/electrons have been considered further by Committee 2 and 1453 detailed judgements are given in Publication FD-C-2. 1454
1455 Those Auger emitting radionuclides and compounds, which have the 1456
potential to localise to the cell nucleus and bind to DNA, were recognised 1457 in Publication 60 as a special case for low LET radiation. The Task Group 1458 support the view given in Publication 92 that Auger emitters will continue 1459 to need special attention in radiological protection and that specific 1460 physiological and biophysical data would be needed in order to consider 1461 Auger emitting compounds on a case by case basis. 1462
1463 4.4 Estimation of Cancer Risk from Epidemiological Data 1464 1465
The Task Group was specifically charged by the Commission with 1466 developing nominal risk coefficients for cancer risk and providing 1467 recommendations on the transport of risk, radiation detriment and tissue 1468 weighting factors. This was a major new element of work for Committee 1 1469 and required input from Committee 2 and the Commission. The outcome 1470 of this work is summarised below. 1471 1472
4.4.1 Nominal risk coefficients, radiation detriment and tissue weighting factors 1473 1474
Nominal risk coefficients are derived by averaging gender and age at 1475 exposure-specific lifetime risk estimates in representative populations. 1476 The lifetime risk estimates are computed using risk models specific to 1477 various cancer sites. Because of the uncertainty in applying risk models 1478 generated from one population to another population with different cancer 1479 patterns, population-specific nominal risks are averages of risk estimates 1480 from alternative models. These nominal risks are computed for each site 1481 of interest and summed to give the population total nominal risk. The 1482 overall site-specific and total nominal risks are computed by averaging the 1483 population-specific average risks. 1484 1485 Radiation detriment is a concept used to quantify the harmful effects of 1486 radiation exposure in different parts of the body. It is determined from 1487 nominal risk coefficients, taking into account severity of the disease in 1488 terms of lethality and years of life lost. Total detriment is the sum of the 1489 detriment for each part of the body (generally tissues or organs). 1490 1491 The concept of "effective dose" associated with a given exposure involves 1492 weighting individual tissues of interest, in some useful partition of the 1493 human body, by the relative detriments for these parts of the body. In 1494 such a system, the weighted sum of the tissue-specific dose equivalents, 1495 called the effective dose, should be proportional to the total estimated 1496 detriment from the exposure, whatever the distribution of equivalent dose 1497

41
within the body. The components of detriment are essentially the same 1498 for cancer and hereditary disease and, if desired, these detriments may be 1499 combined. 1500 1501 For generality, the estimates summarised here are derived as averages 1502 across Asian and Euro-American populations. An attempt was made to 1503 choose an appropriate model to use for transferring risks across various 1504 populations whenever there is sufficient evidence to favour one model over 1505 another. The risk modelling was conducted principally with the data from 1506 the Japanese Life Span Study of A-bomb survivors (LSS), but the broader 1507 radiation epidemiology literature was examined for compatibility with the 1508 LSS-derived estimates. For several tissues it was possible to use a group 1509 of data sets to estimate cancer risk. 1510 1511 The following text briefly outlines the general models of risk and the 1512 sources of data used; methodological aspects of the risk estimates; and 1513 the detriments associated with a range of tissues. Estimated numerical 1514 values and recommendations that derive from this work are summarised 1515 in Tables 4.1, 4.3 and 4.4. 1516 1517
4.4.1.1 Risk modelling 1518 1519
Within a given exposed population, comparable descriptions of the 1520 radiation-associated risk can be made using either excess relative risk 1521 (ERR) or excess absolute risk (EAR) models, so long as the models allow 1522 for variation in the excess risk with factors such as gender, attained age, 1523 and age-at-exposure. While suitably data-rich multiplicative (ERR) or 1524 additive (EAR) models lead to virtually identical descriptions of the excess 1525 risk in the population used to develop the risk estimates, they can lead to 1526 markedly different excess risk estimates when applied to populations with 1527 different baseline rates. 1528 1529 Both ERR and EAR models were developed for oesophagus, stomach, 1530 colon, liver, lung, breast, ovary, bladder, thyroid and leukaemia (bone 1531 marrow). As noted below, ICRP 60 nominal risks were used for bone 1532 surface and skin cancers (ICRP, 1991). Because the data for other human 1533 tissues and organs are insufficient to individually judge the magnitude of 1534 their radiation risk, they were consigned to a “remainder” category (called 1535 other solid). ERR and EAR models also were developed for this group. 1536 1537 In general, the parameters in these risk models were estimated using 1538 incidence data from the studies of the Japanese atomic bomb survivors 1539 with follow-up from 1958 through 1998 for solid cancers (Preston et al, in 1540 preparation). For solid cancers these models involved a linear dose 1541 response allowing for modifying effects of gender, exposure age, and 1542 attained age. These effects were constrained to equal the value seen for 1543 all solid cancers as a group unless there were indications that these 1544

42
constraints resulted in a marked reduction in the goodness of fit. 1545 Leukaemia risk estimates were based on an EAR model with a linear-1546 quadratic dose-response that allows for effect modification by gender, 1547 exposure age, and time following exposure (Preston et al, 1994). Model 1548 parameters are given in Appendix 1. 1549 1550 While the LSS studies do provide some information on skin cancer risks 1551 (Ron et al, 1998), it was judged that they may not be adequate for a 1552 general population because of differences in risk related to skin 1553 pigmentation. Therefore, the Task Group used the nominal skin cancer 1554 risk estimate of 0.1 per Gy from ICRP Publication 59 (ICRP, 1992). This 1555 estimate was also used in ICRP Publication 60 (ICRP, 1991). The nominal 1556 risk estimate for bone surface also was taken from ICRP 60 because the 1557 LSS atomic bomb studies provide no data and other data sources were 1558 extremely limited. The low-LET estimate used in ICRP 60 was 0.00065 per 1559 Gy. 1560 1561 The risk models described above were used to compute gender-specific 1562 lifetime risk estimates for a range of ages at exposure (0 to 85 years in 5 1563 year intervals) in the Asian and Euro-American composite populations (see 1564 Appendix 1). Lifetime risks for exposure ages were then averaged using 1565 weights reflecting the age distribution of the full population or for a 1566 working age (18-64 year old) population. 1567 1568 In ICRP Publication 60, nominal cancer risks were computed based on 1569 mortality data; however, in the current report, risk estimates are based 1570 principally on incidence data. The reason for the change is that incidence 1571 data provide a more complete description of the cancer burden than do 1572 mortality data, particularly for cancers that have a high survival rate. In 1573 addition, cancer registry (incidence) diagnoses are more accurate and the 1574 time of diagnosis is more precise. It is recognised, however, that 1575 incomplete coverage of the A-bomb population because of migration from 1576 Hiroshima or Nagasaki introduces a factor of uncertainty on risk estimates 1577 based on these cancer incidence data. At the time of ICRP Publication 60, 1578 comprehensive incidence data were not available. Since then, a thorough 1579 evaluation of cancer incidence in the Life Span Study (LSS) of Japanese 1580 atomic bomb survivors has been published (Thompson et al 1994; Preston 1581 et al, 1994), and new analyses regarding the latest A-bomb cancer 1582 incidence data are expected soon (Preston et al, in preparation). Site-1583 specific risk estimates were taken from the most recent solid cancer 1584 incidence analyses of the atomic bomb survivor LSS, with follow-up from 1585 1958 through 1998, and adjusted to reduce bias in risk estimates due to 1586 uncertainty in individual dose estimates (Pierce et al, 1990). The newly 1587 implemented atomic bomb dosimetry system, DS02, is a considerable 1588 improvement over DS86. On average, the DS02 dose estimates are 1589 slightly greater than the DS86 estimates. Risk estimates using the two 1590 systems differ by less than 10% (Preston et al, 2004). 1591 1592

43
Although the primary estimates are based on models derived from the LSS 1593 data, information from other radiation-exposed populations was also 1594 considered. Such information is available from studies of: 1595
Patients with therapeutic or diagnostic exposures to radiation; 1596
Workers exposed to radiation in course of their job, eg. uranium 1597 miners; 1598
Persons with environmental exposures, eg. from fallout or from natural 1599 radiation. 1600
These studies have been reviewed in detail by UNSCEAR (2000) and the 1601 International Agency for Research on Cancer (IARC, 2001, 2002). Some of 1602 these studies are more informative than others about radiation risks. The 1603 LSS is particularly valuable in estimating radiation risks for a general 1604 population, because of the very long, mainly prospective follow-up, the 1605 large size of the cohort, and the inclusion of persons of all ages and both 1606 genders who received a wide range of doses. Other studies, however, can 1607 provide information on the effects of exposure received under different 1608 circumstances, such as exposure to high-LET rather than low-LET 1609 radiation, exposures received in a chronic or fractionated manner rather 1610 than acutely, or risks in countries other than Japan. For example, for 1611 thyroid cancer, data from four populations exposed to radiation for medical 1612 reasons in various countries were considered in addition to the LSS (Ron 1613 et al., 1995). As mentioned earlier, the nominal risk estimates for bone 1614 surface and skin are those used in ICRP Publication 60 (ICRP, 1991). 1615 These estimates are largely based on studies of groups with medical 1616 exposures (eg. intakes of radium-224 in the case of bone surface). 1617 1618 For cancers at some sites there is reasonable compatibility between the 1619 data from the LSS and those from other sources. However, it is 1620 recognised by the Task Group that there are significant differences in 1621 radiation risks for a number of sites, e.g., lung when compared with 1622 radon-exposed miners (UNSCEAR 2000). In general, when the LSS cancer 1623 incidence risks were compared to those from medically or occupationally-1624 irradiated populations exposed to low-LET external radiation, the risk 1625 estimates were broadly compatible. In ICRP 60, the liver cancer risk 1626 estimate was based on estimates derived from studies of patients injected 1627 with the radioactive contrast medium Thorotrast, for which generalisations 1628 to low-LET radiation exposures are problematic, although this estimate is 1629 highly relevant when estimating risks for high-LET exposures. In the 1630 current report, the LSS liver cancer risk estimate was preferred. This 1631 estimate, however, was substantially higher than that of other groups 1632 exposed to x- or gamma-radiation (UNSCEAR 2000), probably because of 1633 a reported strong interaction between hepatitis virus and radiation in the 1634 LSS (Sharp et al, 2003), which would not be expected to occur in 1635 populations with lower rates of hepatitis virus infection. Accordingly a 1636

44
nominal 50% reduction was applied in the transfer of liver cancer risk from 1637 the LSS. 1638 1639 Cancer Risk in Different Tissues 1640 Nominal cancer risks and tissue weights were developed for 12 tissues and 1641 organs (oesophagus, stomach, colon, liver, lung, bone surface, skin, 1642 breast, ovary, bladder, thyroid, bone marrow) with the remaining tissues 1643 and organs grouped into one “remainder” category. These individual 1644 tissues and organs were selected because it was deemed that there was 1645 sufficient epidemiological information on the tumorigenic effects of 1646 radiation to make the judgements necessary for estimating cancer risks. 1647 Leukaemia, excluding chronic lymphocytic leukaemia (CLL) and multiple 1648 myeloma were included in the bone marrow category. The remainder 1649 category also includes all other tissues not explicitly evaluated as 1650 individual cancer sites. 1651
Composite Populations 1652 Composite baseline rates were computed using incidence rates averaged 1653 across six populations for cancers of the oesophagus, stomach, colon, 1654 liver, lung, female breast, ovary, bladder, thyroid, leukaemia (excluding 1655 CLL) and solid cancers combined. Population-based cancer incidence rates 1656 were obtained from the 8th edition of Cancer Incidence In Five Continents 1657 (Parkin et al, 2003) and population size data were obtained from the WHO 1658 international mortality statistics database. The cancer rates used are for 1659 selected Asian (Shanghai, Osaka, Hiroshima and Nagasaki) and Euro-1660 American (Sweden, United Kingdom, U.S SEER) populations and then an 1661 unweighted average was calculated to form a composite population. 1662 1663 Gender-specific, all-stage relative survival statistics from the U.S. SEER 1664 program for 1994-1999 (5-year survival) and 1979-1999 (20-year 1665 survival) were averaged to compute overall relative survival rates for 1666 different cancer sites. Although the SEER relative survival rates are higher 1667 than those found for many other European and Asian countries, reducing 1668 the survival rates did not change estimates of relative detriment 1669 appreciably. 1670 1671 Hereditary risks 1672 The estimate of genetic (hereditary) risk from radiation has been 1673 substantially revised since the ICRP 60 report as a result of new 1674 information that has become available and the work of ICRP during the 1675 interim. These revised estimates and their derivation are given in Section 1676 6. Several factors have led to this revision of genetic risk estimates, in 1677 brief: 1678
• Most radiation-induced mutations are large multi-gene deletions, which 1679 are more likely to cause multi-system developmental abnormalities 1680 rather than single gene (i.e., Mendelian) diseases. Importantly, only a 1681 fraction of these are likely to be compatible with live births. 1682

45
• Nearly all chronic diseases have a genetic component, but because 1683 most of these are multi-genic and multi-factorial, the mutation 1684 component (i.e., the responsiveness of these diseases to an alteration 1685 in mutation rate) is small, so that chronic diseases respond only 1686 minimally to a radiation-induced increase in mutation rate. 1687
• The ICRP 60 report made the implicit assumption that all genetic 1688 diseases should be treated as lethal. In view of the range of severity 1689 and lethality for the various types of genetic disease, the lethality 1690 fraction for genetic diseases now has been explicitly designated as 1691 80%. 1692
• New genetic risk coefficients recommended by ICRP consider exposure 1693 and genetic risk for two generations only – the equilibrium value used 1694 in ICRP 60 is judged to be of limited scientific validity because of the 1695 unsupported assumptions necessary on selection coefficients, mutation 1696 component and population changes over hundreds of years. 1697
As a result, the risk of heritable effects in the whole population associated 1698 with gonadal dose is now estimated to be around 20 cases per 10,000 1699 people/Sv, rather than around 100 cases per 10,000/Sv in ICRP 60 (see 1700 Section 6, Table 6.6). The corresponding relative contribution of the 1701 gonadal dose to the total detriment is now estimated as 3-4%, versus the 1702 former ~18%. 1703 1704
4.4.1.2 Methodological Aspects 1705 1706
Uncertainty and sensitivity analyses 1707 The estimated risk of radiation-related cancer is uncertain, and the 1708 sources of this uncertainty are many. The most familiar is statistical 1709 uncertainty, represented by confidence limits or statistical likelihood 1710 distributions. For a chronic or low-dose exposure, the estimate and its 1711 statistical uncertainty are divided by an uncertain dose and dose-rate 1712 effectiveness factor (DDREF), a process that both reduces the estimate 1713 and further increases its uncertainty (see below). 1714 1715 When an estimate based on a particular exposed population is applied to 1716 other populations or to other radiation sources, further uncertainty is 1717 introduced. Differences between radiation sources can produce 1718 uncertainty due to random or systematic error in dose estimates in either 1719 the original or secondary population. 1720 1721 Risk-based radiological protection depends heavily on the assumption that 1722 estimates based on studies of informative exposed populations, such as 1723 the Life Span Study cohort of atomic bomb survivors, can be applied to 1724 other exposed populations. Combined analyses of dose-response data 1725 from different populations (e.g., Preston et al, 2002) provide valuable 1726 information relevant to that assumption. Unfortunately, such information 1727 is available for very few site-specific cancers. Transfers of risk estimates 1728

46
between populations pose a particularly difficult problem for cancer sites 1729 for which baseline rates differ widely between the two populations. This 1730 problem is discussed in more detail below. 1731 1732 Other major sources of uncertainty include possible interaction of radiation 1733 exposure with other cancer risk factors, notably including smoking history 1734 in the case of lung cancer, and reproductive history in the case of female 1735 breast cancer. This problem is similar to that of transfer of risk estimates 1736 between populations, in that the interaction can be represented as an 1737 uncertain linear combination of an additive and a multiplicative model. 1738 However, there is epidemiological evidence favouring an additive or sub-1739 multiplicative interaction in the case of lung cancer and smoking (Pierce et 1740 al, 2003; Travis et al, 2002; Lubin et al, 1995), and a multiplicative 1741 interaction in the case of breast cancer and reproductive history (Land et 1742 al, 1994). 1743 1744 Another uncertain factor is the relative biological effectiveness, relative to 1745 high-energy photons, of radiations of different qualities including medical 1746 x-rays in the 30-200 keV range, electrons, neutrons, protons, and alpha 1747 particles. Quantification of such uncertainties has been discussed in detail 1748 elsewhere eg NCI/CDC (2003). The use of central values is preferred by 1749 ICRP for radiological protection purposes, but it should be kept in mind 1750 that RBE values for specific radiations are intrinsically uncertain. Other 1751 aspects of uncertainty associated with the possible existence of a low dose 1752 threshold for cancer risk are summarised in Section 4.4.5. Uncertainties 1753 associated with dose estimates for internal radionuclides (eg CERRIE 1754 2004) are noted in Publication FD-C-2. 1755 1756 Dose and dose-rate effectiveness factor 1757 For reasons related to statistical power, the dose-specific statistical 1758 estimates of radiation-related risk upon which this report is based reflect 1759 observed cancer excesses at equivalent doses greater than about 200 1760 mSv, mainly delivered acutely. However, many of the more contentious 1761 issues in radiation protection involve risks from continuous exposures, or 1762 fractionated exposures with acute fractions of a few mSv or less. 1763 Experimental investigations tend to show that fractionation or protraction 1764 of dose is associated with reduced dose-specific risk, suggesting that dose-1765 specific estimates based on high-dose, acute exposure data should be 1766 divided by a dose and dose-rate effectiveness factor (DDREF) for 1767 applications to low-dose, continuous, or fractionated exposures. The 1768 magnitude of DDREF is uncertain, and has been treated as such in a 1769 number of recent reports based on quantitative uncertainty analysis (eg 1770 NCRP (1997) EPA (1999), NCI/CDC (2003). However, the mean of the 1771 probabilistic uncertainty distribution for DDREF employed in those analyses 1772 differs little from the value of 2 recommended by the ICRP (1991) and 1773 UNSCEAR (1993). A DDREF of 2 is also generally compatible with the 1774 animal data noted in 4.2. For these reasons the Task Group recommends 1775 that a DDREF of 2 continues to be used by ICRP. 1776
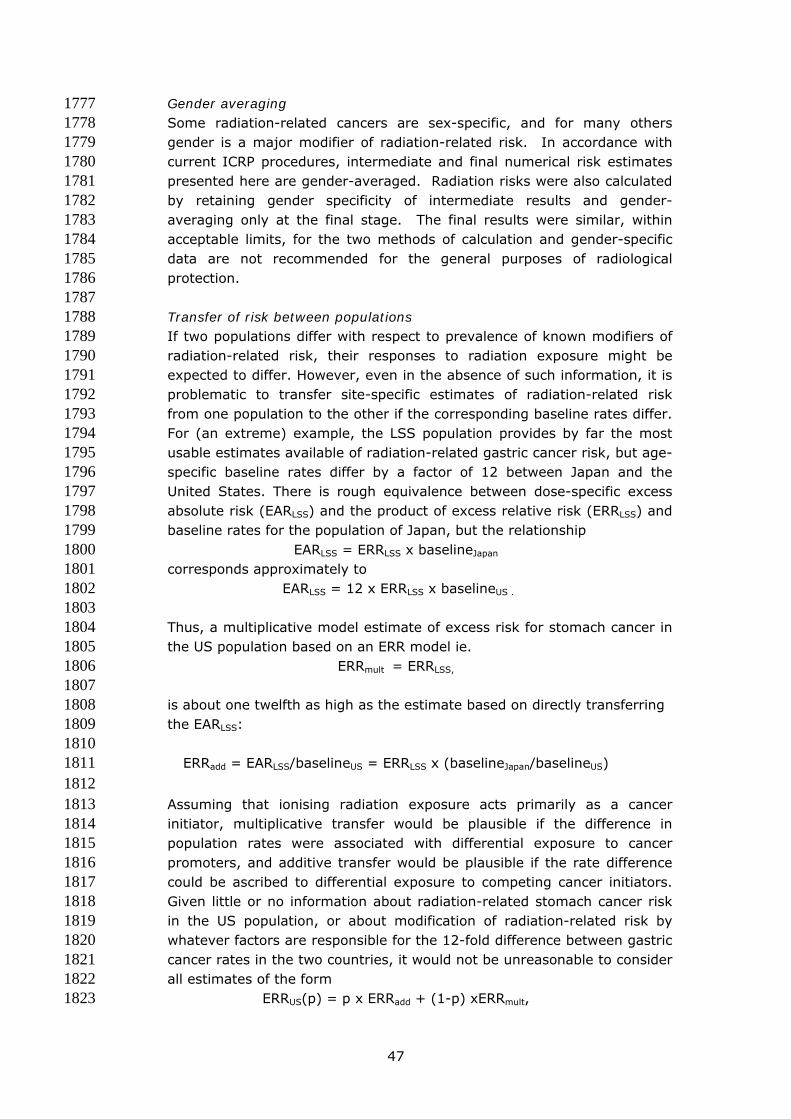
47
Gender averaging 1777 Some radiation-related cancers are sex-specific, and for many others 1778 gender is a major modifier of radiation-related risk. In accordance with 1779 current ICRP procedures, intermediate and final numerical risk estimates 1780 presented here are gender-averaged. Radiation risks were also calculated 1781 by retaining gender specificity of intermediate results and gender-1782 averaging only at the final stage. The final results were similar, within 1783 acceptable limits, for the two methods of calculation and gender-specific 1784 data are not recommended for the general purposes of radiological 1785 protection. 1786 1787 Transfer of risk between populations 1788 If two populations differ with respect to prevalence of known modifiers of 1789 radiation-related risk, their responses to radiation exposure might be 1790 expected to differ. However, even in the absence of such information, it is 1791 problematic to transfer site-specific estimates of radiation-related risk 1792 from one population to the other if the corresponding baseline rates differ. 1793 For (an extreme) example, the LSS population provides by far the most 1794 usable estimates available of radiation-related gastric cancer risk, but age-1795 specific baseline rates differ by a factor of 12 between Japan and the 1796 United States. There is rough equivalence between dose-specific excess 1797 absolute risk (EARLSS) and the product of excess relative risk (ERRLSS) and 1798 baseline rates for the population of Japan, but the relationship 1799
EARLSS = ERRLSS x baselineJapan 1800 corresponds approximately to 1801
EARLSS = 12 x ERRLSS x baselineUS . 1802 1803
Thus, a multiplicative model estimate of excess risk for stomach cancer in 1804 the US population based on an ERR model ie. 1805
ERRmult = ERRLSS, 1806 1807
is about one twelfth as high as the estimate based on directly transferring 1808 the EARLSS: 1809
1810 ERRadd = EARLSS/baselineUS = ERRLSS x (baselineJapan/baselineUS) 1811
1812 Assuming that ionising radiation exposure acts primarily as a cancer 1813 initiator, multiplicative transfer would be plausible if the difference in 1814 population rates were associated with differential exposure to cancer 1815 promoters, and additive transfer would be plausible if the rate difference 1816 could be ascribed to differential exposure to competing cancer initiators. 1817 Given little or no information about radiation-related stomach cancer risk 1818 in the US population, or about modification of radiation-related risk by 1819 whatever factors are responsible for the 12-fold difference between gastric 1820 cancer rates in the two countries, it would not be unreasonable to consider 1821 all estimates of the form 1822
ERRUS(p) = p x ERRadd + (1-p) xERRmult, 1823

48
for 0 ≤ p ≤ 1, as being equally likely. With this approach, the overall 1824 uncertainty is high, and the mean value, ERRUS(1/2), does not really 1825 represent the range of (presumably) equally likely transfer estimates. 1826 1827 For most sites, the difference between Japanese and US rates is 1828 considerably less than 12-fold, which means that inability to discriminate 1829 between the additive and multiplicative transfer models is less 1830 consequential. However, among the sites considered for the present 1831 report, only for lung, breast, and thyroid was it considered that there was 1832 sufficient information to justify a representative value other than 1833 ERRUS(1/2). 1834 1835 Because a recent pooled analysis of radiation effects on breast cancer risk 1836 (Preston et al, 2002) provides strong evidence against the use of common 1837 ERR models, breast cancer risks were based solely on an EAR model, 1838 namely that based on the A-bomb data. The use of EAR models for 1839 predicting thyroid cancer risks is problematic because variation in 1840 screening intensity will have a marked effect on the rate of radiation-1841 associated thyroid cancers. Therefore, thyroid cancer risks were based 1842 solely on the ERR model developed from the pooled analysis of radiation-1843 associated thyroid cancer risks (Ron et al, 1995). 1844
Therefore, the population risks were defined as weighted averages of the 1845 additive (absolute) and multiplicative excess risk estimates with weights 1846 based on judgements concerning the relative applicability of the two risk 1847 estimates. Weights of 0.5 were used for all tissues except breast and bone 1848 marrow in which only an EAR model was used, thyroid and skin for which 1849 only an ERR model was used, and lung for which the ERR model was given 1850 a weight of 0.3 because of suggestions in the atomic bomb survivor data 1851 that the radiation-associated excess rate is more comparable across sexes 1852 than the ERR and also that radiation dose and smoking history interact 1853 additively as lung cancer risk factors. 1854
Computation of radiation detriment 1855 As in ICRP Publication 60, the detriment for a tissue, T, is defined as 1856
DT = (RF,T + qT RNF,T) lT 1857
where RF is the nominal risk of fatal disease, RNF is the nominal risk of non-1858 fatal disease, q is a non-fatal weight (between 0 and 1) reflecting the 1859 reduced quality of life associated with living with a serious illness, and l is 1860 the average life lost due to the disease relative to normal life expectancy, 1861 expressed relative to the average over all cancers. As discussed below, 1862 the quality of life factor is a function of the lethality (k) of the disease and 1863 a subjective judgement accounting for pain, suffering, and adverse effects 1864 of treatment. 1865 1866

49
Since incidence data are being used here, the nominal risk coefficients are 1867 RI (= RF + RNF) and the detriment is computed as 1868
(kT RI,T + q (1-kT) RI,T) lT = RI,T (kT + q (1-kT)) lT 1869
The computations in ICRP 60 were based on nominal mortality risk 1870 coefficients, RF, and q was taken to be equal to the lethality fraction k. 1871 Thus, the ICRP 60 cause-specific detriment is (RF + k (1-k) RF / k) l which 1872 is equal to RF (2-k) l (cf pages 134-136 and Table B20 in ICRP 60), where 1873 RNF = (1-k) RF / k. 1874 1875
Quality of life detriment: 1876 Since there are quality-of-life detriments resulting from cancer in addition 1877 to lethality detriments, the Task Group judges that cancers should be 1878 weighted by both lethality and a smaller added component to account for 1879 pain, suffering and any adverse effects of cancer treatment. To achieve 1880 this, a factor termed qmin is applied to the non-lethal fractions of cancers to 1881 produce an adjusted lethality fraction termed qT. The formula used to 1882 calculate qT with an adjustment for non-lethal detriment is: 1883
qT = qmin + kT (1 - qmin) 1884
1885 where kT is the lethality fraction and qmin is the minimum weight for non-1886 lethal cancers. 1887 1888 The value of qmin was set equal to 0.1 (in most instances the result is not 1889 highly sensitive to the value chosen). In effect, the qmin adjustment has 1890 an impact upon detriment calculations in proportion to the fraction of 1891 cancers that are non-lethal. Accordingly, highly lethal cancers such as 1892 lung and stomach cancer are little affected by qmin whereas relatively non-1893 lethal cancers such as breast or thyroid are. For example, if the lethality 1894 of a cancer type was 0.30, the adjusted qT would be 0.37. However, the 1895 qmin adjustment was not used for skin cancer because radiogenic skin 1896 cancer is almost exclusively of the basal cell type which is usually 1897 associated with very little pain, suffering or treatment sequelae. 1898 1899 Relative life lost: 1900 Relative life lost is an important component of the detriment computation. 1901 Average life lost for a given cause was computed for each gender in each 1902 composite population as the average over ages at exposure and 1903 subsequent attained ages of the residual lifetime. The weights were equal 1904 to the number of deaths from the cause of interest in each age group. 1905 These were converted to relative values by division by the average life lost 1906 for all cancers. 1907 1908

50
Table A1 in Appendix 1 presents the lethality factors, non-fatal case 1909 weights, and relative life lost values used in the current computations. 1910 ICRP 60 values are shown for comparison. 1911 1912
4.4.1.3 Principal features of new estimates of cancer risk 1913 1914
In ICRP 60 the ERR and EAR models were given equal weights for various 1915 tissues, except for bone marrow. In the present assessment, the relative 1916 weights assigned to the ERR and EAR models were allowed to depart from 1917 50:50 when warranted by the available data. This made a more realistic 1918 model for the inter-country transfer of radiogenic breast cancer risks and 1919 largely prevented the potential problem of thyroid cancer or skin cancer 1920 risk estimates being affected by differing degrees of cancer screening. 1921 1922 The present relative detriments (Table 4.1) are similar to the values 1923 calculated in ICRP 60 except for four tissue groups: breast, bone marrow, 1924 remainder tissues and gonads. There appear to be several reasons why 1925 the relative detriment for breast cancer has increased from 0.05 to 0.081. 1926 Those exposed as juveniles in the LSS cohort now make a larger 1927 contribution to the overall breast cancer risk, whereas the mortality data 1928 used for the ICRP 60 analysis only partially reflected this contribution. 1929 Furthermore, in the current incidence analyses (Preston et al, in 1930 preparation), the ERR estimates for women exposed over age 40 years are 1931 higher than those used in ICRP 60. In the 1958-1987 LSS Tumour 1932 Registry report on radiation and solid cancer incidence (Thompson et al, 1933 1994), breast cancers contributed about 11% of the total excess solid 1934 cancers as averaged over males and females. In the current analyses, 1935 breast cancers account for about 18% of the radiation-associated solid 1936 cancers. Studies of other exposed populations have confirmed the 1937 substantial breast cancer risk from radiation (Preston et al, 2002). On the 1938 other hand, the lethality fraction for breast cancer has decreased in the 1939 past 15 years, probably reflecting increased early detection and improved 1940 treatments, but this appears to have little impact on the relative detriment 1941 estimates. 1942 1943 Improved description of the temporal diminution of leukaemia risk has 1944 contributed to a reduction in the relative detriment for bone marrow from 1945 0.143 to 0.101. The reduction of gonadal risk has already been explained 1946 above and pertains to new information and a revised approach for 1947 assessing risks of hereditary disease. 1948
1949 The further accumulation of LSS data in the period following ICRP 60 has 1950 significantly influenced the "remainder tissues" category. There is now 1951 evidence for excess radiation risk, in the aggregate, among a variety of 1952 other tissues, although the degree of risk for any single tissue is unclear. 1953 Since the risk in the remainder category is spread over a large number of 1954 tissues and organs, the judgement of the Task Group is that any given 1955 tissue should receive a small weight. This judgement is consistent with 1956

51
LSS and/or other evidence suggesting the risk is probably very small or 1957 that evidence is lacking. 1958 1959 In order to provide additional supporting information on factors that 1960 influence detriment estimates, the Task Group computed site-specific, 1961 lethality adjusted nominal risks and detriment values using various 1962 methods. The methods used were: 1) the current incidence-based 1963 estimates; 2) mortality-based computations using risk models based on 1964 the most recent LSS mortality data (Preston et al, 2003) applied to the 1965 current composite populations together with the current lethality and life 1966 lost factors (ie. the same as (1), but using risk models derived from 1967 current mortality rather than incidence data); 3) mortality-based 1968 computations using ICRP 60 ERR models (Table 1, Land and Sinclair, 1969 1991) applied to the current composite populations together with the 1970 current lethality and life lost factors (ie. the same as (1), but using the 1971 ICRP 60 relative risk models for mortality in place of the models based on 1972 current incidence data) and 4) the actual ICRP 60 values. Results of these 1973 computations are shown in Table 4.2. Parameter estimates for the risk 1974 models used in method 2 are given in Appendix 1. It can be seen that the 1975 values of relative detriment using incidence- and mortality-based risk 1976 models (i.e. approaches (1) and (2) above) are generally similar. There 1977 are, however, greater differences for some tissues in respect of the 1978 application of ICRP60 methodology to current data (Current ICRP60) and 1979 the specific published ICRP60 values. (ICRP-60 actual). 1980 1981 During the computation of gender-averaged values for detriment based on 1982 cancer incidence and mortality data the Task Group was required to 1983 compute male-and female specific data. These data (not shown) do not 1984 contribute specifically to the formulation of the ICRP tissue weighting 1985 scheme, but can act to inform related judgements by ICRP Committee 2 1986 and the Commission. 1987 1988 For the purposes of judgements developed by ICRP Committee 2 (FD-C-2) 1989 the gender-specific relative detriments computed for breast, ovary, thyroid 1990 and gonads (heritable effects only) are given in the table of Appendix 2. 1991

52
Table 4.1: Summary of Gender-Averaged Nominal Risks and Detrimenta 1992 a) Whole population 1993 1994
Tissue Nominal Risk Coefficient (cases per
10,000 persons per Sv)
Lethalityfraction
Lethality-adjusted nominal
risk* (relating to column 1)
Relative cancer free life
lost
Detriment
(relating to column 1)
Relative detriment+
Oesophagus 17 0.93 17 0.87 15.0 0.025 Stomach 90 0.83 88 0.88 77.5 0.127 Colon 121 0.48 92 0.97 88.8 0.146 Liver 19 0.95 19 0.88 16.7 0.027 Lung 101 0.89 100 0.8 80.1 0.131 Bone surface 7 0.45 5 1 5.1 0.008 Skin 1000 0.002 4 1 4.0 0.007 Breast 69 0.29 38 1.29 49.1 0.081 Ovary 13 0.57 11 1.12 11.7 0.019 Bladder 43 0.29 23 0.71 16.4 0.027 Thyroid 24 0.07 7 1.29 9.2 0.015 Bone Marrow 42 0.67 38 1.63 61.5 0.101 Other Solid 189 0.49 145 1.03 148.9 0.244 Gonads (Hereditary) 20 0.80 19 1.32 25.4 0.042 Total 1755 605 609.5 1.000 1995 1996 b) Working age population (18-64 y) 1997 1998
Tissue Nominal Risk Coefficient (cases per
10,000 persons per Sv)
Lethalityfraction
Lethality-adjusted nominal
risk* (relating to column 1)
Relative cancer free life
lost
Detriment
(relating to column 1)
Relative detriment+
Oesophagus 13 0.93 13 0.91 12.0 0.025 Stomach 88 0.83 85 0.89 76.1 0.162 Colon 62 0.48 47 1.13 53.2 0.113 Liver 15 0.95 15 0.93 14.1 0.030 Lung 109 0.89 108 0.96 103.7 0.220 Bone surface 7 0.45 5 1 5.1 0.011 Skin 1000 0.002 4 1 4.0 0.008 Breast 59 0.29 33 1.20 39.4 0.084 Ovary 9 0.57 7 1.16 8.4 0.018 Bladder 40 0.29 21 0.85 18.1 0.039 Thyroid 5 0.07 1 1.19 1.7 0.004 Bone Marrow 46 0.67 41 1.17 48.1 0.102 Other Solid 97 0.49 74 0.97 71.9 0.153 Gonads (Hereditary) 12 0.80 12 1.32 15.3 0.032 Total 1562 468 471 1.000 1999 * Defined as R*q + R*(1-q)* ((1 – qmin) q + qmin), where R is the nominal risk coefficient, q is the 2000
lethality, and (1 - qmin) q + qmin is the weight given to non-fatal cancers. Here qmin is the minimum 2001 weight for nonfatal cancers. The qmin correction was not applied to skin cancer (see text). 2002
2003 + The values given should not be taken to imply undue precision but are presented to 3 significant 2004
figures to facilitate the tracibility of the calculations made. 2005 2006 a The values in the Table differ from these in the corresponding table in Annex A of the draft 2005 2007
Recommendations as a consequence of an internal ICRP review of the calculations initially made. 2008

53
Table 4.2: Comparison of Gender-Averaged Nominal Risks and Detriment 2009 in Whole Population based on Different Methods of Calculation 2010
Nominal risk (cases per 10,000 persons per Sv)
Tissue Method of calculation
Total Fatal Non-fatal
Lethality adjusted nominal
risk*
Detriment Relative detriment+
Oesophagus Current Incidence 17.3 16.1 1.3 17.2 15.0 0.025 Current Mortality 29.1 27.0 2.1 29.0 25.2 0.039 Current ICRP-60 26.7 25 1.9 26.6 23.2 0.032 ICRP-60 actual 31.6 30 1.6 31.5 24.3 0.033
Stomach Current Incidence 90.4 75.0 15.5 88.1 77.5 0.127 Current Mortality 72.0 59.7 12.3 70.1 61.7 0.095 Current ICRP-60 56.2 47 9.6 54.7 48.1 0.067 ICRP-60 actual 122.2 110 12.2 121.0 100.8 0.139
Colon Current Incidence 121.3 58.0 63.4 91.5 88.8 0.146 Current Mortality 71.8 34.3 37.5 54.2 52.6 0.081 Current ICRP-60 245.3 117 128.1 185.1 179.5 0.249 ICRP-60 actual 154.5 85 69.5 123.3 102.7 0.142
Liver Current Incidence 19.0 18.2 0.9 19.0 16.7 0.027 Current Mortality 37.7 36.0 1.7 37.2 32.8 0.050 Current ICRP-60 15.8 15 0.8 15.7 13.8 0.019 ICRP-60 actual 15.8 15 0.8 15.8 15.8 0.022
Lung Current Incidence 101.3 90.1 11.2 100.2 80.1 0.131 Current Mortality 110.8 98.6 12.2 109.6 87.7 0.135 Current ICRP-60 70.3 63 7.8 69.5 55.6 0.077 ICRP-60 actual 89.5 85 4.5 89.3 80.3 0.111
Bone Surface Current Incidence 7.0 3.2 3.9 5.1 5.1 0.008 Current Mortality 7.0 3.2 3.9 5.1 5.1 0.008 Current ICRP-60 7.0 3 3.9 5.1 5.1 0.007 ICRP-60 actual 6.9 5 1.9 6.4 6.4 0.009
Skin Current Incidence 1000.0 2.0 998.0 4.0 4.0 0.007 Current Mortality 1000.0 2.0 998.0 4.0 4.0 0.006 Current ICRP-60 1000.0 2.0 998.0 4.0 4.0 0.006 ICRP-60 actual 1000.0 2.0 998.0 4.0 4.0 0.006
Breast Current Incidence 69.0 20.3 48.7 38.1 49.1 0.081 Current Mortality 56.5 16.6 39.8 31.2 40.2 0.062 Current ICRP-60 47.5 14 33.5 26.2 33.9 0.047 ICRP-60 actual 40.0 20 20.0 30.0 36.3 0.050
Ovary Current Incidence 12.6 7.1 5.5 10.5 11.7 0.019 Current Mortality 21.2 12.0 9.2 17.6 19.7 0.030 Current ICRP-60 23.4 13 10.2 19.4 21.8 0.030 ICRP-60 actual 14.3 10 4.3 13.0 14.6 0.020
Bladder Current Incidence 42.7 12.2 30.5 23.0 16.4 0.027 Current Mortality 71.7 20.4 51.3 38.7 27.5 0.042 Current ICRP-60 100.4 29 71.8 54.2 38.5 0.053 ICRP-60 actual 60.0 30 30.0 45.0 29.3 0.040
Thyroid Current Incidence 23.5 1.6 22.0 7.1 9.2 0.015 Current Mortality 23.3 1.6 21.8 7.1 9.1 0.014 Current ICRP-60 120.3 8 112.3 36.4 47.0 0.065 ICRP-60 actual 80.0 8 72.0 15.2 15.2 0.021
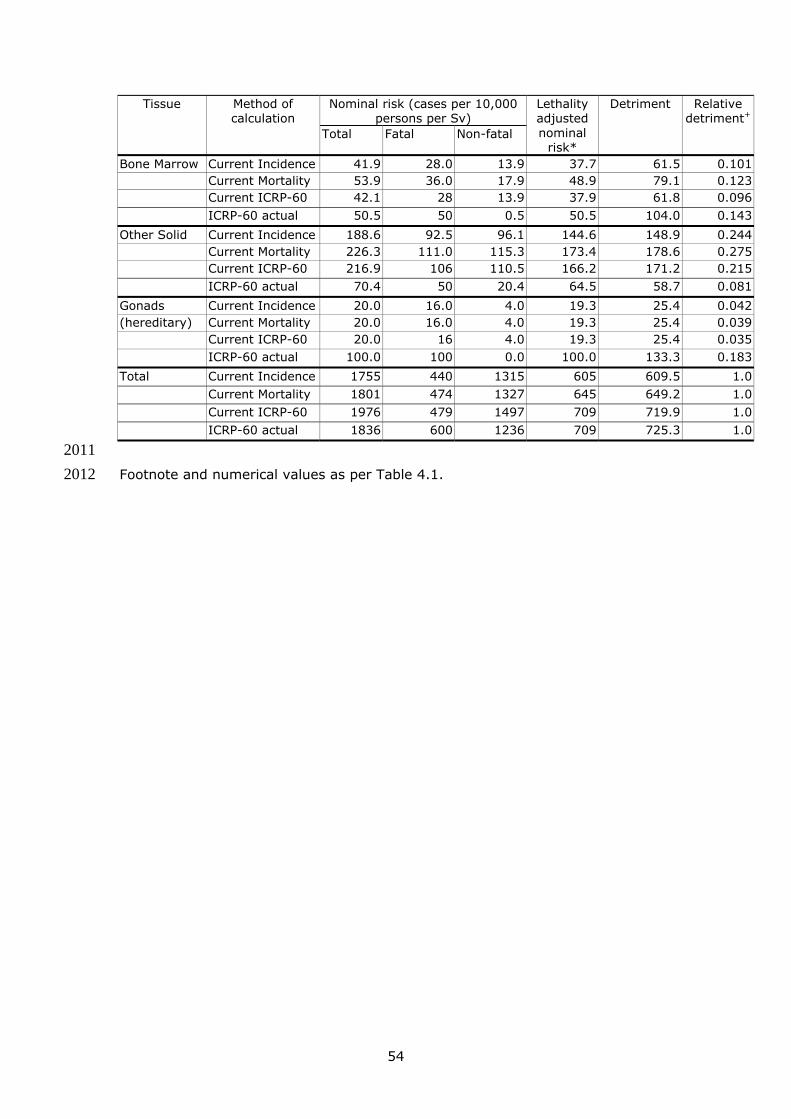
54
Nominal risk (cases per 10,000 persons per Sv)
Tissue Method of calculation
Total Fatal Non-fatal
Lethality adjusted nominal
risk*
Detriment Relative detriment+
Bone Marrow Current Incidence 41.9 28.0 13.9 37.7 61.5 0.101 Current Mortality 53.9 36.0 17.9 48.9 79.1 0.123 Current ICRP-60 42.1 28 13.9 37.9 61.8 0.096 ICRP-60 actual 50.5 50 0.5 50.5 104.0 0.143
Other Solid Current Incidence 188.6 92.5 96.1 144.6 148.9 0.244 Current Mortality 226.3 111.0 115.3 173.4 178.6 0.275 Current ICRP-60 216.9 106 110.5 166.2 171.2 0.215 ICRP-60 actual 70.4 50 20.4 64.5 58.7 0.081
Gonads Current Incidence 20.0 16.0 4.0 19.3 25.4 0.042(hereditary) Current Mortality 20.0 16.0 4.0 19.3 25.4 0.039
Current ICRP-60 20.0 16 4.0 19.3 25.4 0.035 ICRP-60 actual 100.0 100 0.0 100.0 133.3 0.183
Total Current Incidence 1755 440 1315 605 609.5 1.0 Current Mortality 1801 474 1327 645 649.2 1.0 Current ICRP-60 1976 479 1497 709 719.9 1.0 ICRP-60 actual 1836 600 1236 709 725.3 1.0
2011 Footnote and numerical values as per Table 4.1.2012
55
4.4.1.4 The use of relative detriment from incidence data for a tissue weighting 2013 system 2014 2015
The Commission has made a policy decision that there should only be a 2016 single set of wT values that are averaged over both genders and all ages. 2017
A set of wT values could be proposed that closely follows the respective 2018 values of relative detriment based on incidence data given in Table 4.1 2019 together with the supporting comparative data of Table 4.2. However, the 2020 Task Group feels that additional judgements need to be exercised to 2021 include subjective factors, not reflected in the mathematical formulation of 2022 detriment. In particular, the following judgements were applied. 2023
2024 • The detriments for heritable effects and cancer following gonadal 2025
irradiation were aggregated to give a wT of 0.08. 2026 • The detriment of thyroid cancer was increased to 0.05 to take account 2027
of the concentration of cancer risk in childhood, i.e. young children are 2028 considered to be a particularly sensitive sub-group. 2029
• Cancer risk in salivary glands and brain, whilst not specifically 2030 quantifiable, is judged to be greater than that of other tissues in the 2031 remainder fraction and for this reason each is ascribed a wT of 0.01. 2032
2033 Re-ordering of wT values using the above judgements was made ensuring 2034 that these values did not diverge from the relative detriments of Table 4.1 2035 by more than around two-fold. This reassignment gives a wT value for the 2036 remainder tissues of 0.12. The Task Group presents a new proposal on 2037 the way in which the weighting of remainder tissues is treated. 2038 2039 According to this proposal the wT for remainder tissues (0.12) is divided 2040 equally between the 15 tissues given in the footnote to Table 4.3, 0.008 2041 each, which is lower than the wT for the lowest of the named tissues 2042 (0.01). The number of tissues included in remainder could be increased if 2043 necessary. The system preserves additivity in effective doses. This is 2044 judged to be an appropriate simplification on the scheme of Publication 60 2045 in which the wT for the remainder is divided among the five remainder 2046 tissues which receive the highest does ie a non-additive system. Mass 2047 weighting of tissues in the remainder fraction was explored but rejected. 2048 The principal reason for this rejection was that the very large disparities in 2049 tissue masses caused unacceptable distortions of effective dose for certain 2050 radionuclides. A notable feature of detriment in Table 4.1 is that the 2051 heritable detriment from gonadal irradiation is distinguished from that of 2052 cancer risk (i.e. in ovary and testes). For the purposes of the new 2053 Recommendations, these wT values need to be aggregated. 2054
2055 On the basis of the detriment data of Tables 4.1 and 4.2 plus the 2056 judgements summarised above, the Task Group proposes the tissue 2057 weighting scheme given in Table 4.3. 2058
2059

56
Table 4.3 Proposed tissue weighting factors 2060 2061
Tissue wT ∑ wT
Bone-marrow, Colon, Lung, Stomach, Remainder Tissues* (Nominal wT applied to the average dose to 15 tissues)
0.12 0.60
Breast, Gonads 0.08 0.16 Bladder, Oesophagus, Liver, Thyroid 0.05 0.20
Bone surface, Brain, Salivary glands, Skin 0.01 0.04
2062 *Remainder Tissues (15 in total)
Adipose tissue, Adrenals, Connective tissue, Extrathoracic (ET) regiona, Gall bladder, Heart wall, Kidneys, Lymphatic nodes, Muscle, Pancreas, Prostate, Small intestine (SI) Wall, Spleen, Thymus, Uterus/cervix.
a As defined in ICRP Publication 66, includes anterior (ET1) and posterior nasal passages, 2063 larynx, pharynx and mouth (ET2). ICRP will be giving consideration to specifically 2064 including oral mucosa in remainder tissues. 2065
2066 2067
It should be noted that the wT for gonads is applied to the mass-weighted 2068 mean of the doses to testes and ovaries (i.e. the average dose in gonadal 2069 tissue), and that the dose to the colon is taken to be the mass-weighted 2070 mean of ULI and LLI doses, as in the Publication 60 formulation. 2071
2072 4.4.2 Nominal probability coefficients for cancer and hereditary effects 2073 2074 New data on the risks of radiation-induced cancer and hereditary effects 2075
have been used by the Task Group in risk modelling and disease detriment 2076 calculations in order to estimate nominal probability coefficients for 2077 consideration by the Commission. 2078
On the basis of these calculations (Table 4.1) the Task Group proposes 2079 nominal probability coefficients for lethality adjusted cancer risk as 5.9 10-2080 2 Sv-1 for the whole population and 4.6 10-2 Sv-1 for adult workers aged 2081 18-64. For hereditary effects, the lethality adjusted nominal risk in the 2082 whole population is estimated as 0.2 10-2 Sv-1 and in adult workers as 0.1 2083 10-2 Sv-1. These estimates are shown in Table 4.4, where they are 2084 compared with the estimates of detriment used in the 1990 2085 Recommendations. 2086
Table 4.4: Detriment adjusted nominal probability coefficients for cancer 2087 and hereditary effects (10-2 Sv-1)1 2088 2089
Cancer Heritable effects Total Exposed population Present ICRP60 Present ICRP60 Present ICRP 60 Whole 5.9 6.0 0.2 1.3 6.1 7.3 Adult 4.6 4.8 0.1 0.8 4.7 5.6 2090 1Values from Tables 4.1a, 4.1b and ICRP Publication 60. 2091

57
In respect of Table 4.4 it is important to note that the detriment adjusted 2092 nominal probability coefficient for cancer estimated here has been 2093 computed in a different manner from that of Publication 60. The present 2094 estimate is based upon lethality/life impairment weighted data on cancer 2095 incidence with adjustment for relative life lost whereas in Publication 60 2096 detriment was based upon fatal cancer risk weighted for non-fatal cancer, 2097 relative life lost for fatal cancers and life impairment for non-fatal cancer. 2098 In this respect it is also notable that the detriment unadjusted nominal 2099 probability coefficient for fatal cancer in the whole population that may be 2100 projected from the cancer incidence-based data of Table 4.2a is around 2101 4% per Sv (computed value of 4.2%) as compared with the Publication 60 2102 value of 5% per Sv. The corresponding value using cancer mortality-2103 based models is essentially unchanged at around 5% (computed value of 2104 4.6% per Sv). 2105 2106 An additional point relating to the present detriment adjusted cancer 2107 coefficients of Table 4.4 is that during the period that new ICRP 2108 recommendations are likely to apply, the survival rates for many cancers 2109 are expected to rise. In this respect the nominal risk coefficient proposed 2110 here will tend to be an over-estimate of risks in the future. 2111 2112 The differences in the estimates of detriment adjusted heritable effects 2113 between the present report and Publication 60 are explained and discussed 2114 under 6.5. 2115
2116 4.4.3 Cancer risk following prenatal (in-utero) irradiation 2117 2118
Studies on cancer risk following irradiation of the unborn child were 2119 reviewed in Publication 90. 2120 2121 The largest case-control study of cancer after in-utero irradiation, the 2122 Oxford Study of Childhood Cancers (OSCC), found that radiation increased 2123 all types of childhood cancer by approximately the same degree. The 2124 second largest study showed a larger relative risk of leukaemia than for 2125 solid tumours, while several cohorts studies of in-utero radiation found no 2126 clear evidence of radiation-induced childhood cancer. The data from the 2127 atomic bomb survivors suggest that the lifetime cancer risk from in-utero 2128 exposure may be similar to that from exposure in early childhood. 2129 2130 The OSCC data suggest that cancer induction is at least as likely following 2131 exposure in the first trimester as in later trimesters. From the data 2132 published to date, it is not possible to determine tissue-weighting factors in 2133 order to define cancer risk in different tissues and organs. Adequate 2134 human in-utero exposure data are not available to define the dose and 2135 dose-rate effectiveness factor (DDREF) for low-LET radiation or the RBE 2136 values for neutron or other high-LET radiations. 2137 2138
58
Given the limitations of the available data the Task Group have not 2139 attempted to derive a specific value for the nominal coefficient for life-time 2140 cancer risk after prenatal exposure and support the Publication 92 2141 judgement that it is reasonable to assume that this risk is, at most, a few 2142 times that of the population as a whole. 2143
2144 4.4.4 Genetic susceptibility to radiation-induced cancer 2145 2146
On the basis of the data analyses and judgements developed in Publication 2147 79 and further information reviewed in the UNSCEAR 2000 and 2001 2148 reports, the Task Group believes that strongly expressing, high 2149 penetrance, cancer genes are too rare to cause significant distortion of the 2150 population-based estimates of low dose radiation cancer risk made in this 2151 Section of the report. However, as noted in Publication 79, there are likely 2152 to be implications for individual cancer risks, particularly for second 2153 cancers in gene carriers receiving radiotherapy for a first neoplasm. 2154 Although the Task Group recognises that weakly expressing variant cancer 2155 genes may, in principle, be sufficiently common to impact upon population 2156 based estimates of radiation cancer risk, the information available is not 2157 sufficient to provide a meaningful quantitative judgement on this issue. 2158
2159 4.4.5 Allowing for the possibility of a low dose threshold for cancer risk 2160 2161
In the preceding discussion and computations it has been assumed that, at 2162 low doses and at low dose rates, site-specific cancer risk from low-LET 2163 radiation is proportional to radiation dose, consistent with the so-called 2164 linear, no-threshold (LNT) hypothesis. Thus, the possibility that there 2165 might be a threshold dose, below which there would be no radiation-2166 related cancer risk, has been ignored. The LNT hypothesis is not 2167 universally accepted as biological truth, but rather, because we do not 2168 actually know what level of risk is associated with very low-dose exposure, 2169 it is considered to be a prudent judgement for public policy aimed at 2170 avoiding unnecessary risk from exposure. 2171 2172 As discussed at length in Publication LDR-C-1, the LNT hypothesis receives 2173 considerable, although not decisive, support from epidemiological studies 2174 of radiation-related cancer risk, in the sense that the risk of mortality and 2175 morbidity from all solid cancers combined is proportional to radiation dose 2176 down to about 100 mGy, below which statistical variation in baseline risk, 2177 as well as small and uncontrollable biases, increasingly tend to obscure 2178 evidence concerning radiation-related risk. This uncertainty is the main 2179 reason why it is generally impossible to determine, on epidemiological 2180 grounds alone, that there is, or is not, an increased risk of cancer 2181 associated with radiation exposures of the order of 10 mGy and below. 2182 Risk estimates for such exposures are obtained through the use of 2183 mathematical models that assume a simple relationship eg, linear, linear-2184 quadratic, or linear with a dose and dose rate effectiveness factor 2185 (DDREF)) between risk at higher doses, where epidemiological data tend 2186

59
to be informative, and at doses so low that direct epidemiological 2187 observation is uninformative. 2188 2189 In spite of the biological evidence supporting the LNT hypothesis with 2190 respect to the induction by ionising radiation of complex DNA damage, for 2191 which repair mechanisms in mammalian species tend to be error-prone, 2192 the possibility of a threshold for cancer induction at some unknown low 2193 dose cannot be ruled out (see 4.1). 2194 2195 At the molecular level, the generation of multiple DNA lesions within close 2196 spatial proximity, creating complex damage for which mammalian repair 2197 mechanisms tend to be error-prone, is believed to be the primary 2198 mechanism by which ionising radiation contributes to the induction of 2199 mutations and chromosome aberrations and hence to the pathogenesis of 2200 cancer. Such clustered damage in DNA, in principle, can be induced even 2201 by a single radiation track through a cell. Also, while many of the cells 2202 containing such radiation-induced damage may be eliminated by damage 2203 response pathways involving cell cycle checkpoint control and apoptotic 2204 cell death, it is clear from analysis of cytogenetic and mutation data that 2205 damaged or altered cells are capable of evading these protective measures 2206 and propagating. 2207 2208 Considered as a whole, the emerging results from cellular studies with 2209 regard to radiation-related adaptive response, genomic instability, and 2210 bystander effects suggest that the risk of low level exposure to ionising 2211 radiation is uncertain, and a simple extrapolation from high dose effects 2212 may not be wholly justified in all instances. However, a better 2213 understanding of the mechanisms for these phenomena, the extent to 2214 which they are active in vivo, and how they are interrelated is needed 2215 before they can be evaluated as factors to be included in the estimation of 2216 potential risk to the human population of exposure to low levels of ionising 2217 radiation. 2218 2219 Recent studies using newly developed animal models, cellular, cytogenetic 2220 and molecular data for acute myelogenous leukaemia (AML), intestinal 2221 tumours, and mammary tumors, and cytogenetic and molecular studies on 2222 the induction of AML and mammary cancer support the view that the 2223 essential radiation-associated events in the tumorigenic process are 2224 predominantly early events involving DNA losses targeting specific 2225 genomic regions harbouring critical genes. As such, the response for early 2226 initiating events is likely to correspond to that for the induction of 2227 cytogenetic and mutagenic damage. On this basis, mechanistic arguments 2228 support a linear response in the low dose region, i.e., the process should 2229 be independent of dose rate because interactions between different 2230 electron tracks should be rare. Quantitative analyses of dose responses for 2231 tumorigenesis and for life shortening in laboratory animals also support 2232 this prediction. 2233 2234

60
As discussed in Publication LDR-C-1, the statistical uncertainty highlighted 2235 earlier in this section is accompanied by other uncertainties, on the model 2236 assumptions needed to estimate the risk of radiation-related cancer at low 2237 radiation doses. These latter uncertainties are usually subject to only 2238 subjective quantification. Such uncertain assumptions include, among 2239 others, the DDREF to be applied at low doses and low dose rates, the 2240 relationship between excess and baseline cancer rates when transferring 2241 estimates from one population to another, and the relationship between 2242 estimated and true radiation dose in the exposed population from which 2243 the risk estimate was derived (See 4.4.1.2). All of these assumptions can 2244 profoundly affect the estimated risk and its probabilistic uncertainty limits. 2245 If one also allows for the uncertain possibility of a universal threshold dose 2246 at some known level or a threshold the value of which is highly uncertain, 2247 or which varies widely among members of the exposed population, this 2248 also affects the risk estimate and its uncertainty limits. In an exercise 2249 described in Publication LDR-C-1 it was found that, unless the existence of 2250 a threshold was assumed to be virtually certain, and its possible values 2251 restricted well beyond that which can be justified on current knowledge, 2252 the effect of introducing the uncertain possibility of a threshold was 2253 equivalent to that of an uncertain increase in the value of DDREF, i.e. 2254 merely a variation on the result obtained by ignoring the possibility of a 2255 threshold. 2256 2257 The existence of a low dose threshold for cancer induction in certain 2258 tissues is not implausible. Indeed, as noted in Publication LDR-C-1 there 2259 is no clear evidence for a radiation-associated excess of cancers for a 2260 number of tissues eg chronic lymphocytic leukaemia, testicular cancer, 2261 melanoma skin cancer. 2262 2263 Although the available data do not exclude the existence of a universal low 2264 dose threshold, the evidence as a whole, as summarised in this report, 2265 does not favour this proposition. It may be that the long standing 2266 question on the true validity of the linear-no threshold (LNT) hypothesis 2267 will provide to be beyond definitive scientific resolution and that ‘weight of 2268 evidence’ arguments and practical judgements will continue to apply in the 2269 foreseeable future. 2270 2271 In summary the Task Group judges that there is at present no good 2272 reason to include the possibility of a low dose threshold in cancer risk 2273 calculations for the purposes of radiological protection. On this basis it is 2274 recommended that the LNT hypothesis, combined with an uncertain 2275 judged value of DDREF for extrapolation from high doses, remains a 2276 prudent basis for the practical purposes of radiological protection at low 2277 doses and low dose rates. 2278 2279 2280
2281

61
Appendix 1 to Section 4 2282 2283
Further details of the detriment calculations 2284
2285 Table A1: Values for lethality factors, non-fatal case weights, and relative life lost 2286 values used in the current computations, together with the corresponding values 2287 in ICRP Publication 60 2288
Site Current ICRP 60 Lethality (k) Non-fatal case
weight (q) Relative life
lost Lethality (k =q)
Relative life lost
Oesophagus 0.93 0.935 0.87 0.95 0.65 Stomach 0.83 0.846 0.88 0.90 0.83 Colon 0.48 0.530 0.97 0.55 0.83 Liver 0.95 0.959 0.88 0.95 1.00 Lung 0.89 0.901 0.80 0.87 0.90 Bone Surface 0.45 0.505 1.00 0.72 1.00 Skin 0.002 0.002 1.00 -- 1.00 Breast 0.29 0.365 1.29 0.50 1.21 Ovary 0.57 0.609 1.12 0.70 1.12 Bladder 0.29 0.357 0.71 0.50 0.65 Thyroid 0.07 0.253 1.29 0.10 1.00 Bone Marrow 0.67 0.702 1.63 0.99 2.06 Other Solid 0.49 0.541 1.03 0.71 0.91 Gonads 0.80 0.820 1.32 -- 1.33
2289
k, q and the relative life lost are defined in section 4.4.1.2. In particular, q is 2290 taken as q_min + (1-q_min)*k in the current calculations, where q_min is 0 for 2291 skin, 0.2 for thyroid and 0.1 for all other sites. 2292

62
Table A2: Coefficients in the current cancer incidence-based ERR models 2293 2294
Site Gender ERR per Gy at age 70
for exposure at age 30
Age at exposure: % change in ERR per
decade increase
Power of Attained age by which the ERR
varies
F:M ratio PConsistency
All solid M 0.35
F 0.58 -18% -1.74 1.66
Oesophagus M 0.52
F 0.87 -18% -1.74 1.66 0.58
Stomach M 0.23
F 0.38 -18% -1.74 1.66 0.91
Colon M 0.49
F 0.34 5% -4.21 0.70 --
Liver M 0.21
F 0.35 -18% -1.74 1.66 0.91
Lung M 0.60
F 1.00 12% -1.74 1.66 0.09
Breast F 0.99 -5% -1.74 -- 0.21
Ovary F 0.44 -18% -1.74 -- 0.99
Bladder M 0.66
F 1.10 -18% -1.74 1.66 0.52
Thyroid M 0.44
F 0.44 -63% 0.00 1.00 0.36
Other M 0.26
F 0.23 -34% -1.74 0.90 0.50
2295

63
Table A3: Coefficients in the current cancer incidence-based EAR models 2296 2297
Site Gender
Excess deaths per 10000
persons per year per Gy at age 70
for exposure at age 30
Age at exposure:% change in EAR
per decade increase
Power of Attained age by which the EAR varies
F:M ratio PConsistency
All Solid M 43.69
F 62.19 -27% 2.39 1.42
Oesophagus M 1.86
F 0.12 -27% 2.39 0.06 0.17
Stomach M 10.92
F 10.92 0% 2.39 1.00 0.53
Colon M 9.13 6.96
F 3.84 -51%
2.19 -- --
Liver M 1.13
F 1.60 -27% 2.39 1.42 0.55
Lung M 9.49
F 9.49 0% 4.33 1.00 0.89
Breast F 9.04 -30% 3.27*
-2.02 0.002§
Ovary F 1.39 -27% 2.39 -- --
Bladder M 2.57
F 2.57 0% 5.24 1.00 0.24
Thyroid M 0.34
F 1.09 -43% 0.00 3.21 0.25
Other M 10.16
F 14.46 -27% 1.40 1.42 0.12
2298 § Test of hypothesis that spline in attained age is unnecessary. 2299 * Upper term is age effect before age 50 and lower term is effect for age greater than 50. 2300

64
Table A4: Coefficients in the current mortality-based ERR models 2301 2302
Site Gender
ERR per Gy at age 70 for exposure at age 30
Age at exposure:
% change in ERR per decade
increase
Power of Attained age by which the ERR varies
F:M ratio PConsistency
Solid M 0.35
F 0.58 -31% -0.74 1.68
Oesophagus M 0.76
F 1.27 -31% -0.74 1.68 0.47
Stomach M 0.26
F 0.43 -31% -0.74 1.68 0.48
Colon M 0.25
F 0.25 -31% -4.46 1.00 0.43
Liver M 0.21
F 0.34 -31% -0.74 1.68 0.94
Lung M 0.55
F 0.92 -4% -0.74 1.68 0.76
Breast F 0.96 -31% -0.74 0.70
Ovary F 0.67 -31% -0.74
0.67
Bladder M 0.74
F 1.24 12% -0.74 1.68 0.75
Other M 0.13
F 0.22 -56% -0.74 1.68 0.40
2303

65
Table A5: Coefficients in the current mortality-based EAR models 2304 2305
Site Gender
Excess deaths 10000 persons per year per Gy at age 70 for
exposure at age 30
Age at exposure:% change in EAR
per decade increase
Power of Attained age by
which the EAR varies
F:M ratio PConsistency
All Solid M 28.91
F 29.99 -24% 3.63 1.04
Oesophagus M 0.98
F 0.98 -24% 3.63 1.00 0.42
Stomach M 5.79
F 5.79 -24% 3.63 1.00 0.45
Colon M 2.24
F 2.24 -24% 3.63 1.00 0.66
Liver M 6.46
F 2.36 -24% 5.56 0.37 0.42
Lung M 6.72
F 6.72 -24% 6.56 1.00 0.70
Breast F 15.73 -44%
5.78 -2.83
0.01*
Ovary F 1.40 -24% 3.63 0.90
Bladder M 0.83
F 0.83 0% 8.04 1.00 0.23
Other M 3.68
F 3.68 -52% 3.63 1.00 0.29
2306 * Test of hypothesis that a spline in attained age is unnecessary. 2307

66
Table A6: Female Euro-American cancer incidence rates by age and site 2308 2309
Number of cases per 100,000 persons per year
Age All
Cancer All Solid Oesophagus Stomach Colon Liver Lung Breast Ovary Bladder Thyroid Leukaemia
Non-CLL Leukaemia
CLL
0-4 18.37 10.95 0.00 0.01 0.01 0.32 0.01 0.02 0.05 0.06 0.01 6.95 6.92 0.03
5-9 9.03 5.28 0.00 0.01 0.03 0.03 0.04 0.00 0.23 0.00 0.08 3.07 3.05 0.02
10-14 10.20 6.57 0.00 0.04 0.11 0.04 0.02 0.01 0.69 0.00 0.54 2.15 2.15 0.00
15-19 17.49 11.03 0.01 0.08 0.25 0.07 0.04 0.12 1.77 0.07 1.80 2.20 2.19 0.00
20-24 29.46 21.96 0.02 0.09 0.36 0.09 0.19 1.19 2.89 0.19 3.87 1.63 1.59 0.04
25-29 51.15 43.58 0.04 0.27 0.83 0.17 0.39 7.17 4.03 0.31 5.60 1.66 1.61 0.04
30-34 83.77 76.06 0.10 0.75 1.27 0.24 1.04 23.53 5.82 0.50 6.38 1.90 1.86 0.04
35-39 137.56 129.33 0.13 1.17 3.27 0.39 3.20 54.12 9.00 0.98 7.00 2.41 2.27 0.14
40-44 227.67 215.47 0.50 2.28 6.00 0.64 8.29 107.57 13.73 1.85 7.20 3.72 3.41 0.31
45-49 372.68 355.20 1.07 3.31 11.90 1.42 20.20 183.33 24.54 4.05 8.48 4.52 3.72 0.80
50-54 540.14 512.41 2.42 5.02 21.92 2.43 40.44 243.57 34.33 7.90 8.07 7.61 5.28 2.34
55-59 703.34 663.31 5.27 8.76 41.98 4.07 67.32 263.17 41.39 13.25 7.97 9.99 6.59 3.40
60-64 907.16 851.75 7.92 14.26 63.80 6.73 106.00 298.07 49.35 22.38 7.16 15.15 9.82 5.33
65-69 1127.22 1048.58 11.24 21.99 94.46 9.82 154.72 305.57 55.60 33.45 7.79 21.91 12.96 8.94
70-74 1385.31 1279.59 16.96 33.48 138.10 14.11 190.74 328.61 62.04 47.83 8.53 30.29 17.72 12.57
75-79 1557.27 1427.72 21.52 47.53 177.76 17.32 191.05 339.09 61.42 56.59 8.13 37.99 21.96 16.03
80-84 1707.07 1565.32 26.77 65.22 234.14 22.02 166.82 365.99 56.31 68.67 8.73 43.94 26.88 17.05
85-89 1660.82 1667.88 34.82 76.14 241.25 21.66 127.96 335.97 49.39 83.68 8.73 43.98 26.91 17.07
90+ 1720.81 1706.61 23.34 73.73 266.50 16.94 76.51 382.23 38.63 54.69 8.73 73.39 44.90 28.48 2310

67
Table A7: Male Euro-American cancer incidence rates by age and site 2311 2312
Number of cases per 100,000 persons per year
Age All
Cancer All Solid Oesophagus Stomach Colon Liver Lung Breast Ovary Bladder Thyroid Leukaemia
Non-CLL Leukaemia
CLL
0-4 21.64 12.70 0.00 0.01 0.00 0.62 0.01 0.12 0.00 7.78 7.77 0.01
5-9 11.66 6.18 0.00 0.00 0.00 0.10 0.00 0.01 0.05 3.80 3.80 0.00
10-14 12.26 6.18 0.00 0.00 0.06 0.05 0.03 0.02 0.13 3.07 3.07 0.00
15-19 18.72 11.10 0.00 0.06 0.13 0.10 0.11 0.10 0.43 2.73 2.73 0.00
20-24 29.00 20.81 0.02 0.10 0.33 0.15 0.19 0.39 0.77 1.98 1.98 0.00
25-29 43.12 32.54 0.09 0.27 0.92 0.22 0.36 0.60 1.54 2.36 2.33 0.03
30-34 58.48 45.37 0.21 0.82 1.75 0.32 0.99 1.27 1.47 2.87 2.80 0.07
35-39 77.82 61.65 0.64 1.45 3.15 0.72 3.19 2.52 1.78 3.61 3.20 0.41
40-44 115.96 95.95 1.94 3.27 6.71 2.06 9.41 5.70 2.15 4.65 3.81 0.84
45-49 198.61 170.47 4.26 6.02 12.42 3.12 23.28 12.63 2.83 6.67 4.85 1.82
50-54 380.05 337.58 9.47 11.72 25.26 5.53 56.22 25.29 3.34 11.59 7.20 4.38
55-59 676.04 617.96 15.68 21.64 47.90 9.60 108.53 46.07 3.81 16.47 9.56 6.91
60-64 1136.55 1053.31 24.79 36.02 84.67 15.00 189.00 79.67 4.16 25.34 14.06 11.28
65-69 1767.07 1651.87 33.72 58.28 129.65 22.80 304.06 132.28 5.24 37.75 20.92 16.83
70-74 2415.76 2255.06 46.59 87.72 185.35 30.88 400.78 184.53 5.69 56.29 30.97 25.33
75-79 2882.34 2680.83 49.57 114.49 248.89 36.70 456.24 229.94 5.98 68.43 39.48 28.95
80-84 3225.05 2983.09 55.88 145.00 310.36 36.96 459.96 275.56 6.26 86.36 50.15 36.21
85-89 3033.46 3166.00 59.36 165.76 316.71 37.73 404.07 266.44 6.26 91.89 38.53 53.36
90+ 3676.73 3290.99 49.36 137.84 335.18 39.21 337.79 376.32 6.26 102.86 43.13 59.73
2313

68
Table A8: Female Euro-American cancer mortality rates by age and site 2314 2315
Number of deaths per 100,000 persons per year
Age All Cause All Cancer All Solid Oesophagus Stomach Colon Liver Lung Breast Ovary Bladder LeukaemiaNon-CLL
Leukaemia CLL
0-4 114.61 2.22 1.46 0.00 0.00 0.00 0.06 0.02 0.00 0.01 0.00 0.76 0.76 0.00
5-9 11.35 2.01 1.42 0.00 0.00 0.00 0.02 0.01 0.00 0.01 0.01 0.59 0.59 0.00
10-14 13.28 2.05 1.34 0.00 0.02 0.01 0.02 0.01 0.00 0.03 0.00 0.71 0.71 0.00
15-19 28.51 2.76 1.74 0.00 0.03 0.04 0.05 0.02 0.00 0.10 0.00 1.02 1.02 0.00
20-24 33.03 3.40 2.46 0.01 0.05 0.06 0.10 0.04 0.09 0.21 0.00 0.94 0.94 0.00
25-29 40.17 5.97 5.10 0.02 0.14 0.21 0.11 0.10 0.96 0.31 0.01 0.87 0.87 0.00
30-34 55.43 12.77 11.86 0.04 0.41 0.35 0.15 0.53 3.85 0.74 0.06 0.91 0.91 0.00
35-39 81.36 26.07 24.79 0.10 0.69 1.11 0.28 1.90 9.49 1.41 0.09 1.27 1.27 0.00
40-44 122.96 48.98 47.14 0.30 1.23 2.02 0.58 5.45 18.24 3.34 0.19 1.84 1.84 0.00
45-49 193.21 88.79 86.48 0.87 1.76 4.59 1.07 13.34 31.03 7.13 0.49 2.31 2.31 0.00
50-54 309.20 150.52 147.17 1.87 2.98 8.82 1.82 28.25 45.67 13.39 1.00 3.34 3.34 0.00
55-59 489.59 232.48 227.46 3.93 5.16 16.19 3.28 48.94 57.28 21.10 1.82 5.15 5.02 0.13
60-64 801.25 343.06 335.47 6.24 8.47 25.88 5.31 81.35 68.26 27.83 3.70 7.59 7.59 0.00
65-69 1283.49 487.75 476.42 9.10 14.54 39.32 8.87 123.13 82.37 34.97 6.63 12.06 11.33 0.73
70-74 2098.33 654.11 636.96 13.79 21.54 58.94 12.40 158.51 97.91 42.39 11.95 17.97 17.15 0.83
75-79 3406.46 801.53 778.31 20.07 32.16 81.11 16.83 167.46 117.85 45.48 17.98 25.36 23.22 2.15
80-84 5934.90 988.90 956.69 26.37 47.48 118.84 21.81 159.62 146.37 47.35 29.09 35.14 32.21 2.94
85-89 9876.82 1178.13 1146.03 35.87 64.84 165.46 26.79 137.93 188.77 46.61 48.53 38.97 35.71 3.25
90+ 19441.90 1220.69 1172.64 24.05 62.78 182.78 20.95 82.47 214.76 36.46 31.72 65.02 59.59 5.43 2316

69
Table A9: Male Euro-American cancer mortality rates by age and site 2317 2318
Number of deaths per 100,000 persons per year
Age All Cause All Cancer All Solid Oesophagus Stomach Colon Liver Lung Breast Ovary Bladder LeukaemiaNon-CLL
Leukaemia CLL
0-4 143.02 2.75 1.97 0.00 0.00 0.00 0.11 0.00 0.00 0.78 0.78 0.00
5-9 15.39 2.74 1.70 0.00 0.00 0.00 0.05 0.01 0.01 1.04 1.04 0.00
10-14 19.43 2.52 1.39 0.00 0.00 0.01 0.02 0.01 0.01 1.12 1.12 0.00
15-19 66.78 3.50 2.10 0.00 0.01 0.04 0.05 0.02 0.00 1.41 1.41 0.00
20-24 94.71 4.50 3.27 0.02 0.06 0.13 0.09 0.12 0.01 1.23 1.23 0.00
25-29 99.79 5.87 4.56 0.05 0.14 0.28 0.12 0.20 0.01 1.31 1.31 0.00
30-34 124.33 9.09 7.75 0.18 0.36 0.55 0.21 0.64 0.05 1.34 1.34 0.00
35-39 160.80 16.28 14.65 0.48 0.83 1.12 0.50 2.23 0.14 1.63 1.63 0.00
40-44 224.83 34.98 32.89 1.66 1.78 2.46 1.33 7.19 0.46 2.08 2.08 0.00
45-49 321.50 69.83 67.16 3.62 3.33 5.22 2.38 18.84 1.00 3.09 2.67 0.42
50-54 505.70 143.81 139.31 7.94 6.11 10.74 3.90 45.14 2.87 4.79 4.50 0.30
55-59 821.44 262.09 254.99 13.88 11.61 20.26 7.03 89.61 6.09 7.64 7.11 0.54
60-64 1378.11 457.53 446.19 21.98 21.78 35.75 11.69 162.02 12.33 12.85 11.34 1.51
65-69 2241.12 734.15 714.15 30.93 34.77 56.32 17.62 260.63 23.18 20.56 20.00 0.56
70-74 3590.14 1065.72 1036.77 41.20 53.11 85.62 24.51 354.10 39.44 32.65 28.94 3.70
75-79 5634.15 1427.76 1387.32 49.19 75.51 116.26 31.46 421.65 61.53 45.15 40.44 4.71
80-84 9122.79 1880.96 1826.90 55.21 103.50 165.63 36.27 464.57 96.92 64.25 54.06 10.19
85-89 13879.10 2208.86 2287.11 63.41 132.47 221.43 37.50 445.09 135.96 82.03 69.02 13.01
90+ 24029.19 2677.26 2377.40 52.73 110.15 234.35 38.98 372.08 192.04 91.82 77.26 14.57 2319

70
Table A10: Female Asian cancer incidence rates by age and site 2320 2321
Number of cases per 100,000 persons per year
Age All
Cancer All Solid Oesophagus Stomach Colon Liver Lung Breast Ovary Bladder Thyroid Leukaemia
Non-CLL Leukaemia
CLL
0-4 16.18 10.16 0.00 0.00 0.00 0.41 0.00 0.00 0.017 0.23 0.00 4.63 4.63 0.00
5-9 7.47 4.04 0.00 0.00 0.00 0.15 0.00 0.00 0.248 0.00 0.18 2.44 2.44 0.00
10-14 10.32 6.13 0.00 0.00 0.00 0.15 0.05 0.00 1.170 0.00 0.55 3.25 3.25 0.00
15-19 9.62 7.27 0.00 0.20 0.30 0.11 0.12 0.00 1.485 0.00 1.54 1.62 1.62 0.00
20-24 16.76 13.77 0.00 0.95 0.26 0.22 0.14 0.51 2.075 0.06 3.26 1.58 1.58 0.00
25-29 29.87 26.73 0.11 2.41 1.52 0.32 0.86 3.62 2.492 0.15 3.84 1.76 1.76 0.00
30-34 61.04 56.94 0.05 8.54 2.40 0.92 1.26 14.77 3.452 0.13 5.74 2.02 2.02 0.00
35-39 113.76 107.71 0.20 15.25 5.53 2.25 2.97 38.85 5.848 0.43 6.78 3.29 3.27 0.01
40-44 184.71 177.61 0.65 24.58 9.34 3.69 7.70 67.94 9.592 0.75 10.45 3.93 3.92 0.01
45-49 242.53 233.01 1.15 27.18 16.76 5.89 12.55 86.55 13.050 0.94 13.31 4.26 4.18 0.08
50-54 302.19 290.49 2.17 34.98 28.27 11.12 19.96 81.36 15.142 2.80 12.54 6.02 5.89 0.13
55-59 401.39 386.17 6.38 52.62 44.43 21.21 34.36 76.81 16.122 4.62 11.59 5.96 5.60 0.36
60-64 592.40 565.68 12.35 75.78 71.50 46.70 63.49 88.33 19.615 7.49 12.86 9.70 9.19 0.51
65-69 776.54 744.60 17.66 113.21 89.08 75.39 89.27 86.57 19.888 10.82 12.59 11.11 10.75 0.36
70-74 1017.79 974.89 28.42 159.53 126.39 84.23 145.22 84.42 20.507 18.15 13.96 15.34 14.84 0.49
75-79 1177.00 1127.05 34.69 195.44 138.59 96.89 171.64 82.73 20.268 25.43 13.00 14.35 13.56 0.79
80-84 1338.05 1279.76 38.69 260.54 152.09 111.69 176.17 82.34 15.482 35.23 11.16 19.49 18.58 0.92
85-89 1470.65 1400.73 28.65 284.69 174.60 114.47 184.59 52.17 21.20 50.41 11.16 21.61 19.69 1.91
90+ 1733.18 1653.38 27.96 354.64 244.83 113.01 193.15 65.36 23.17 34.96 11.16 22.70 20.69 2.01 2322

71
Table A11: Male Asian cancer incidence rates by age and site 2323 2324
Number of cases per 100,000 persons per year
Age All
Cancer All Solid Oesophagus Stomach Colon Liver Lung Breast Ovary Bladder Thyroid Leukaemia
Non-CLL Leukaemia
CLL
0-4 16.69 10.30 0.00 0.08 0.00 0.74 0.03 0.03 0.00 5.17 5.09 0.08
5-9 10.73 4.54 0.00 0.05 0.00 0.24 0.05 0.00 0.02 4.73 4.73 0.00
10-14 10.72 5.48 0.00 0.06 0.06 0.33 0.07 0.00 0.23 3.31 3.31 0.00
15-19 12.15 7.20 0.00 0.33 0.10 0.13 0.14 0.06 0.59 3.51 3.51 0.00
20-24 13.97 9.68 0.00 0.81 0.50 0.70 0.41 0.31 0.74 2.30 2.30 0.00
25-29 21.59 16.88 0.10 2.29 0.91 1.67 0.51 0.59 0.99 2.94 2.89 0.05
30-34 37.04 31.17 0.13 5.05 3.54 3.60 2.30 0.81 1.16 3.55 3.49 0.06
35-39 72.78 65.58 0.80 14.96 5.45 11.41 5.09 2.20 1.67 3.03 2.93 0.10
40-44 140.70 131.55 2.94 29.51 12.43 21.68 14.83 3.59 2.15 3.90 3.71 0.19
45-49 227.28 213.75 7.05 47.43 24.55 36.58 23.27 5.14 3.17 5.45 5.30 0.15
50-54 357.46 339.23 14.35 76.73 39.96 54.82 44.64 10.69 2.82 7.01 6.67 0.34
55-59 588.80 564.44 25.49 127.25 72.34 95.29 80.55 17.08 2.86 9.51 9.07 0.43
60-64 1059.95 1019.71 44.55 217.15 119.83 170.87 176.67 33.03 3.84 13.36 12.55 0.81
65-69 1523.88 1468.59 58.10 316.67 162.08 195.63 317.21 55.42 5.13 20.21 18.61 1.60
70-74 1948.97 1878.15 82.63 412.58 186.30 192.09 439.32 73.66 5.16 27.13 25.46 1.67
75-79 2267.27 2180.80 92.66 488.08 214.56 183.31 509.83 108.13 4.68 30.62 28.83 1.79
80-84 2470.31 2375.91 94.17 520.98 222.27 187.30 540.57 120.05 4.35 31.68 28.87 2.81
85-89 3372.14 3223.64 69.75 716.89 326.54 232.57 682.18 158.97 4.35 49.11 44.17 4.94
90+ 3907.81 3742.07 68.97 863.48 422.02 215.09 608.83 264.33 4.35 49.86 44.84 5.02 2325

72
Table A12: Female Asian cancer mortality rates by age and site 2326 2327
Number of deaths per 100,000 persons per year
Age All Cause All Cancer All Solid Oesophagus Stomach Colon Liver Lung Breast Ovary Bladder LeukaemiaNon-CLL
Leukaemia CLL
0-4 127.18 3.38 1.70 0.00 0.01 0.00 0.10 0.02 0.00 0.01 0.01 1.34 1.34 0.00
5-9 16.67 3.08 1.33 0.00 0.00 0.00 0.03 0.00 0.00 0.01 0.00 1.33 1.33 0.00
10-14 15.15 3.52 1.42 0.01 0.00 0.01 0.05 0.00 0.01 0.04 0.00 1.66 1.66 0.00
15-19 18.31 3.39 1.46 0.02 0.07 0.04 0.08 0.04 0.01 0.13 0.01 1.24 1.24 0.00
20-24 27.75 3.97 2.31 0.01 0.28 0.17 0.20 0.16 0.08 0.19 0.00 1.16 1.16 0.00
25-29 33.29 6.37 4.66 0.04 0.89 0.39 0.40 0.38 0.36 0.20 0.01 1.15 1.15 0.00
30-34 44.91 13.20 11.14 0.06 2.28 1.02 0.98 1.06 1.67 0.52 0.04 1.43 1.43 0.00
35-39 62.83 23.88 21.06 0.15 4.13 1.95 1.79 2.27 4.58 1.24 0.06 1.79 1.79 0.00
40-44 107.45 45.04 41.40 0.46 7.14 3.39 3.74 5.45 8.89 2.26 0.09 2.32 2.32 0.00
45-49 162.17 66.72 62.51 1.26 9.31 5.26 6.20 9.08 12.01 4.36 0.16 2.65 2.65 0.00
50-54 237.87 94.83 90.12 2.16 12.01 7.43 9.43 15.19 14.91 6.52 0.38 2.71 2.57 0.14
55-59 399.63 151.41 144.12 4.31 19.77 12.43 15.91 29.64 17.01 6.21 0.81 3.65 3.57 0.08
60-64 740.16 245.00 234.08 8.43 30.60 20.91 28.82 54.90 17.67 9.05 1.45 5.44 5.26 0.18
65-69 1239.84 357.21 342.78 15.26 47.37 30.14 41.39 83.63 18.97 9.55 3.27 6.05 5.32 0.72
70-74 2184.11 508.02 488.66 25.09 73.47 46.13 57.19 115.76 20.60 10.22 6.20 8.56 7.23 1.33
75-79 3682.84 653.04 630.76 34.41 101.60 64.40 67.38 138.34 24.32 11.85 10.27 8.60 7.58 1.02
80-84 6509.31 780.83 755.96 37.66 134.47 82.36 73.27 148.97 31.19 9.55 15.88 9.19 8.56 0.63
85-89 8923.98 712.91 693.30 39.96 126.81 75.93 63.03 119.29 29.99 8.63 21.78 6.95 6.71 0.23
90+ 17750.63 840.17 818.35 39.00 157.96 106.46 62.23 124.82 37.57 9.43 15.10 7.30 7.05 0.25 2328

73
Table A13: Male Asian cancer mortality rates by age and site 2329 2330
Number of deaths per 100,000 persons per year
Age All Cause All Cancer All Solid Oesophagus Stomach Colon Liver Lung Breast Ovary Bladder LeukaemiaNon-CLL
Leukaemia CLL
0-4 149.24 3.79 1.75 0.00 0.00 0.01 0.15 0.02 0.02 1.60 1.60 0.00
5-9 24.88 3.96 1.62 0.00 0.00 0.01 0.08 0.01 0.00 1.77 1.77 0.00
10-14 23.65 4.78 2.00 0.00 0.01 0.01 0.10 0.01 0.00 1.98 1.98 0.00
15-19 35.16 4.81 2.20 0.00 0.09 0.05 0.18 0.09 0.01 1.66 1.66 0.00
20-24 50.43 5.06 2.87 0.02 0.25 0.19 0.47 0.22 0.02 1.44 1.44 0.00
25-29 59.21 7.79 5.40 0.06 0.62 0.37 1.36 0.59 0.03 1.46 1.46 0.00
30-34 80.39 14.60 11.97 0.17 1.67 0.91 3.75 1.70 0.04 1.74 1.74 0.00
35-39 114.64 29.41 25.77 0.48 3.83 1.99 8.34 4.17 0.14 2.13 2.12 0.00
40-44 188.22 58.32 53.62 2.13 8.05 3.58 17.40 9.85 0.25 2.61 2.55 0.06
45-49 276.69 95.90 90.33 5.09 14.22 5.43 26.64 18.17 0.57 3.03 2.59 0.44
50-54 399.85 149.26 141.77 9.83 23.38 8.45 36.85 31.35 1.04 3.48 2.97 0.51
55-59 646.43 252.16 242.34 17.39 42.54 14.49 55.24 58.84 2.09 4.85 4.73 0.12
60-64 1257.04 482.58 466.03 34.20 80.47 28.65 95.25 130.56 5.07 6.98 6.33 0.65
65-69 2107.53 755.18 732.35 54.58 130.26 43.47 118.07 230.26 11.07 10.31 9.74 0.57
70-74 3550.26 1065.73 1035.03 82.96 194.71 65.39 131.80 335.02 19.49 13.49 12.52 0.97
75-79 5749.87 1365.66 1325.91 102.71 259.01 90.86 142.09 409.23 37.80 16.55 15.52 1.02
80-84 9661.98 1661.07 1614.41 121.87 328.69 122.29 155.29 446.43 62.69 18.78 16.66 2.12
85-89 12799.94 1586.63 1542.42 121.60 307.77 128.12 137.19 397.35 73.45 19.76 18.03 1.74
90+ 22367.18 1838.67 1790.47 120.24 370.70 165.59 126.88 354.63 122.13 20.06 18.30 1.76 2331

74
Appendix 2 to Section 4 2332 2333 2334 Estimates of Selected Gender-Specific Population Detriments 2335 Estimates based on cancer-incidence data 2336 2337
Relative Detriment Tissue Male Female
Breast - 0.150 Ovary - 0.036 Thyroid 0.008 0.021 Gonads (heritable effects) 0.045 0.039

75
5. Non-cancer Diseases after Radiation Exposure 2338 2339
Since 1990 evidence has accumulated that the frequency of non-cancer 2340 diseases is increased in irradiated populations. The strongest evidence for 2341 the induction of these non-cancer effects at doses of the order of 1 Sv 2342 derives from the A-bomb LSS and the most recent mortality analysis 2343 (Preston et al 2003) has strengthened the statistical evidence for an 2344 association with dose – particularly for heart disease, stroke, digestive 2345 disorders and respiratory disease. However, the Task Group notes current 2346 uncertainties on the shape of the dose-response at low doses and that the 2347 LSS data are consistent both with there being no dose threshold for risks 2348 of disease mortality and with a threshold of around 0.5 Sv. It is unclear 2349 what forms of cellular/tissue mechanisms might underlie such a diverse 2350 set of non-cancer disorders reported among the LSS data although some 2351 association with sub-clinical inflammation (e.g. Hayashi et al 2003) is 2352 possible. 2353 2354 Additional evidence of the non-cancer effects of radiation, albeit at high 2355 doses, comes from studies of cancer patients receiving radiotherapy. For 2356 example, Hancock et al (1993) studied 2232 patients treated for Hodgkin’s 2357 disease with a median follow-up time of 9.5 years and reported a three-2358 fold risk of death due to heart disease after 30 Gy based on 88 deaths. 2359 Similarly, a recent analysis of cause-specific mortality among 1261 2360 Hodgkin’s patients, with a median follow-up of 17.8 years, demonstrated a 2361 relative risk (RR) for cardiovascular mortality of 6.3 after mediastinal 2362 radiotherapy based on 45 deaths. For patients treated before age 21, the 2363 RR increased to 13.6 based on 6 deaths (Aleman et al 2003). Significant 2364 increases in risks for cardiovascular disease have also been demonstrated 2365 in some other groups of patients treated with radiotherapy for malignant 2366 disease, such as breast cancer (eg Early Breast Cancer Trialists 2367 Collaborative Group 2000). 2368 2369 Whilst recognising the potential importance of these observations on non-2370 cancer diseases, the Task Group judges that the data available do not 2371 allow for their inclusion in the estimation of detriment following radiation 2372 doses in the range up to a few tens of mSv. The Task Group notes that 2373 UNSCEAR is currently developing a view on these non-cancer effects and 2374 ICRP will follow these developments closely. 2375

76
6. Risks of Heritable Diseases 2376 2377 6.1 Introduction 2378 2379 The term ‘genetic risks’ as used in this document denotes the probability 2380
of harmful genetic effects manifest in the descendants of a population 2381 that has sustained radiation exposures. These effects are expressed as 2382 increases over the baseline frequencies of genetic diseases in the 2383 population per unit dose of low LET, low dose/chronic irradiation. 2384
2385 Since the publication of the 1990 recommendations of the ICRP (ICRP 2386 1991), the 1990 BEIR report (NRC 1990) and the UNSCEAR (1993) report, 2387 several important advances have been made in the prediction of genetic 2388 risks of exposure of human populations to ionising radiation. On the basis 2389 of these, UNSCEAR (2001) revised its earlier risk estimates. The aim of 2390 this section of the report is to provide a brief background on the available 2391 information and the methods that are used for risk estimation, summarize 2392 the recent advances, present the revised risk estimates and indicate how 2393 the new estimates can be used to derive a risk coefficient for genetic 2394 effects. 2395 2396
6.2 Background information 2397 2398 6.2.1 Naturally-occurring genetic diseases 2399 2400
The genetic diseases of interest in the present context are those due to 2401 mutations in single genes (Mendelian diseases) and those which are due to 2402 multiple genetic and environmental factors (multifactorial diseases). 2403 Historically, UNSCEAR, the BEIR Committees and ICRP had also considered 2404 an additional class of genetic diseases, namely, chromosomal diseases 2405 which are due to gross structural and numerical abnormalities of 2406 chromosomes. 2407 2408 Mendelian diseases are further subdivided into autosomal dominant, 2409 autosomal recessive and X-linked recessive categories depending on the 2410 chromosomal location (autosomes or the X-chromosome) of the mutant 2411 genes and their transmission patterns. In the case of an autosomal 2412 dominant disease, a single mutant gene inherited from either parent (i.e., 2413 in a heterozygous state) is sufficient to cause disease (e.g., 2414 achondroplasia, neurofibromatosis, Marfan syndrome etc.). The somewhat 2415 unusual genetics of dominantly inherited cancer predisposition are 2416 discussed in Publication 79. Autosomal recessive diseases, however, 2417 require two mutant genes, one from each parent, at the same locus (i.e., 2418 homozygosity) for disease manifestation (e.g., cystic fibrosis, 2419 haemochromatosis, Bloom syndrome, ataxia telangiectasia etc.). In the 2420 case of X-linked recessive diseases, since males have only one X-2421 chromosome, usually only males are affected (e.g., haemophilia, 2422

77
Duchenne muscular dystrophy, Fabry disease etc.). However, some X-2423 linked dominant diseases are also known (e.g., Rett syndrome), but for 2424 the purpose of the present document, they are included under X-linked 2425 recessive diseases. The important general point with respect to Mendelian 2426 diseases is that the relationship between mutation and disease is simple 2427 and predictable. 2428 2429 Multifactorial diseases are aetiologically complex and consequently the 2430 relationship between mutation and disease is also complex i.e., these do 2431 not show Mendelian patterns of inheritance. The two sub-groups that 2432 constitute multifactorial diseases are the common congenital abnormalities 2433 (e.g., neural tube defects, cleft lip with or without cleft palate, congenital 2434 heart defects etc.) and chronic diseases of adults (e.g., coronary heart 2435 disease, essential hypertension, diabetes mellitus etc.). Evidence for a 2436 genetic component in their aetiology comes from family and twin studies 2437 which show that the first-degree relatives of affected individuals have a 2438 higher risk of disease than matched controls. For most of them, knowledge 2439 of the genes involved, the types of mutational alterations and the nature 2440 of environmental factors still remain limited. Among the models used to 2441 explain the inheritance patterns of multifactorial diseases and estimate 2442 recurrence risks in relatives is the multifactorial threshold model (MTM) of 2443 disease liability. This is considered in a later section. 2444 2445 Chromosomal diseases arise as a result of gross numerical (e.g., Down 2446 syndrome due to trisomy for chromosome 21) or structural abnormalities 2447 of chromosomes (e.g., Cri du chat syndrome, due to deletion of part or 2448 whole short arm of chromosome 5) generally detectable in cytological 2449 preparations of cells. This is really not an aetiological category and further, 2450 deletions (microscopically detectable or not) are now known to contribute 2451 to a number of genetic diseases grouped under autosomal dominant, 2452 autosomal recessive and X-linked diseases. 2453 2454
6.2.2 The doubling dose method 2455 2456
In the absence of human data on radiation-induced genetic diseases, all 2457 the methods that have been developed and used since the mid-1950s up 2458 to the present are indirect; their aim is to make the best use of mutation 2459 data obtained in radiation studies with mice, data on baseline frequencies 2460 of genetic diseases in the population and population genetic theory, to 2461 predict the radiation risk of genetic diseases in humans. One such 2462 method that has been used from the early 1970s onwards until now (e.g., 2463 UNSCEAR 2001) is the doubling dose method. This method enables one to 2464 express the expected increase in the frequencies of genetic diseases in 2465 terms of their baseline frequencies using the following equation: 2466
2467 Risk per unit dose = P × [1/DD] × MC (1) 2468 2469

78
where P is the baseline frequency of the genetic disease class under study, 2470 DD is the doubling dose (and [1/DD] is the relative mutation risk per unit 2471 dose) and MC is the disease-class specific mutation component. 2472 2473 The genetic theory that underlies the use of the DD method for risk 2474 estimation is what is referred to as the equilibrium theory which population 2475 geneticists use to explain the dynamics of mutant genes in populations. 2476 The theory postulates that the stability of mutant gene frequencies (and 2477 thus of disease frequencies) in a population is the result of the existence 2478 of a balance between the rate at which spontaneous mutations enter the 2479 gene pool of the population in every generation and the rate at which they 2480 are eliminated by natural selection i.e., through failure of survival or 2481 reproduction. Under normal conditions (i.e., in the absence of radiation 2482 exposures), the population is assumed to be in equilibrium between 2483 mutation and selection. 2484 2485 When the mutation rate is increased as a result of radiation, say, in every 2486 generation, the balance between mutation and selection is disturbed by 2487 the influx of induced mutations, but the prediction is that the population 2488 will eventually attain a new equilibrium (over a number of generations) 2489 between mutation and selection. The amount of increase in mutation 2490 frequency, the time it takes for the population to reach the new 2491 equilibrium and the rate of approach to it are all dependent on induced 2492 mutation rates, the intensity of selection, the type of genetic disease and 2493 whether radiation exposure occurs in one generation only or generation 2494 after generation. Worth mentioning here is that, since the starting 2495 population (before radiation exposure) is assumed to be in equilibrium 2496 between mutation and selection, the quantity P in equation (1) represents 2497 the equilibrium incidence. 2498
2499 Doubling dose. The doubling dose (DD) is the amount of radiation that is 2500 required to produce as many mutations as those that arise spontaneously 2501 in a generation. Ideally, it is estimated as a ratio of the average rates of 2502 spontaneous and induced mutations in a given set of genes: 2503
2504 DD = Average spontaneous mutation rate/average induced mutation rate2505
(2) 2506 2507
The reciprocal of the DD (i.e., [1/DD] is the relative mutation risk (RMR) 2508 per unit dose. Since RMR is a fraction, the smaller the DD, the higher is 2509 the RMR and vice versa. 2510
2511 Mutation component. Formally defined, mutation component (MC) is the 2512 relative increase in disease frequency per unit relative increase in 2513 mutation rate: 2514
2515 MC = [ΔP/P]/ [Δm/m] (3) 2516 2517

79
where P is the baseline disease frequency, ΔP its change due to Δm change 2518 in mutation rate and m, the spontaneous mutation rate. The procedures 2519 used for estimating MC are relatively straightforward for autosomal 2520 dominant and X-linked diseases, slightly complicated for autosomal 2521 recessives (since an induced recessive mutation does not precipitate a 2522 recessive disease in the immediate post-radiation generations) and more 2523 complex for multifactorial diseases and depends on the model that is used 2524 to explain their stable frequencies in the population. 2525
2526 6.3 Recent advances in understanding 2527 2528
The advances that have been made during the past few years include: (a) 2529 an upward revision of the estimates of the baseline frequencies of 2530 Mendelian diseases; (b) the introduction of a conceptual change in the 2531 calculation of the DD; (c) the elaboration of methods for estimating MC for 2532 Mendelian and chronic diseases; (d) the introduction of an additional 2533 factor called the ‘potential recoverability correction factor’ (PRCF) in the 2534 risk equation to bridge the gap between the rates of radiation-induced 2535 mutations in mice and the risk of radiation-inducible genetic disease in 2536 human live births and (e) the introduction of the concept that the adverse 2537 effects of radiation-induced genetic damage in humans are likely to be 2538 manifest predominantly as multi-system developmental abnormalities in 2539 the progeny. All these have been discussed in detail in a series of recent 2540 publications (Chakraborty et al., 1998; Denniston et al, 1998; 2541 Sankaranarayanan 1998, 1999; Sankaranarayanan and Chakraborty 2542 2000a,b,c; Sankaranarayanan et al., 1994, 1999). 2543
2544 6.3.1. Baseline frequencies of genetic diseases 2545 2546
Until the 1993 UNSCEAR report, the baseline frequencies used in risk 2547 estimation were based on those compiled by Carter (1977) for Mendelian 2548 diseases, by UNSCEAR (1977) for chromosomal diseases, by Czeizel and 2549 Sankaranarayanan (1984) for congenital abnormalities and by Czeizel et 2550 al. (1988) for chronic diseases. While the estimates for the last three 2551 groups of diseases have remained unchanged, those for Mendelian 2552 diseases have now been revised upwards (Sankaranarayanan 1998). Both 2553 the earlier and the current estimates (the latter used in UNSCEAR 2001) 2554 are presented in Table 6.1. 2555 2556

80
Table 6.1: Baseline frequencies of genetic diseases in human populations 2557 Baseline frequencies (per cent of live births) Disease class UNSCEAR (1993) UNSCEAR (2001)
Mendelian Autosomal dominant 0.95 1.50 X-linked 0.05 0.15 Autosomal recessive 0.25 0.75 Chromosomal 0.40 0.40 Multifactorial Chronic diseases 65.00 a 65.00 a Congenital abnormalities 6.00 6.00 2558 a Population frequency 2559 2560 6.3.2 The doubling dose 2561 2562
A re-examination of the assumptions involved in using the DD based on 2563 mouse data for risk estimation. The DD used until the 1993 UNSCEAR 2564 report was 1 Gy (for chronic, low LET radiation conditions) and was based 2565 entirely mouse data on spontaneous and induced rates of recessive 2566 mutations in 7 genes. One of the assumptions underlying the use of 2567 mouse-data-based DD for risk estimation is that both the spontaneous and 2568 induced mutation rates in mice and humans are the same. The assumption 2569 regarding induced rates of mutations, while unavoidable, is defensible on 2570 the grounds of generally similar gene organization, 70 to 90% homology in 2571 DNA sequence of genes and substantial conservation of synteny for many 2572 (although not all) chromosomal regions in both the species. However, the 2573 situation is different with respect to spontaneous mutation rates. 2574 2575 Arguments supporting the view that the spontaneous mutation rates in 2576 mice and humans are unlikely to be similar have been discussed 2577 (Sankaranarayanan 1998; Sankaranarayanan and Chakraborty 2000a; 2578 UNSCEAR 2001). Briefly, unlike in the mouse, in humans, there are 2579 pronounced sex-differences in spontaneous mutation rates (being higher 2580 in males than in females), and the mutation rate increases with the age of 2581 the father (paternal age-effect). These when considered with the fact that 2582 the human life span is longer than that of the mouse, suggest that 2583 extrapolating from the short-lived mouse to humans is unlikely to provide 2584 a reliable average spontaneous rate in a heterogeneous human population 2585 of all ages. Additionally, recent analyses of mouse data on mutations that 2586 arise as germinal mosaics (which result in clusters of identical mutations in 2587 the following generation) have introduced considerable uncertainty about 2588 the spontaneous mutation rate in the mouse (Selby, 1998). 2589 2590 The use of human data on spontaneous mutation rates and mouse data for 2591 induced mutation rates for DD calculations. In view of the reasons stated 2592 in the preceding paragraphs, UNSCEAR (2001) considered it prudent to 2593 base DD calculations on human data on spontaneous mutation rates and 2594 mouse data on induced mutation rates, as was first done in the 1972 BEIR 2595

81
report (NRC 1972). The advantages of using human data in DD 2596 calculations are: (a) they pertain to human disease-causing genes; (b) the 2597 mutation rate estimates in humans, because they are averaged over the 2598 sexes, automatically include paternal age effects and (c) in estimating 2599 mutation rates, human geneticists count all mutations irrespective of 2600 whether they are part of a cluster or not; consequently, had clusters 2601 occurred, they would have been included. 2602 2603 Average spontaneous mutation rate for human genes. For calculating an 2604 average spontaneous mutation rate for human genes, UNSCEAR (2001) 2605 focused on published data on those genes for which estimates of selection 2606 coefficients (s) were also available, the reason being that the latter are 2607 relevant for estimating MC (to be discussed in the next section). Further, 2608 only autosomal dominant diseases, but not X-linked ones, were included in 2609 the analysis the rationale being that (a) among Mendelian diseases, 2610 autosomal dominants constitute the most important group from the 2611 standpoint of genetic risks; (b) while X-linked diseases are also expected 2612 to respond directly to an increase in mutation rate, their incidence in the 2613 population is an order of magnitude lower than that of autosomal 2614 dominants (0.15% versus 1.50%) and, consequently (c) the assumption 2615 of similar average mutation rates for these two classes of disease in the 2616 context of risk estimation is unlikely to result in an underestimate of the 2617 risk. 2618 2619 The average (unweighted) spontaneous mutation rate based on a total of 2620 26 autosomal dominant disease phenotypes (which on current knowledge 2621 relate to mutations in an estimated 135 genes) was (2.95 ± 0.64).10-6 2622 gene-1 generation-1 (Sankaranarayanan and Chakraborty 2000). This 2623 estimate is well within the range of 0.5.10-5 to 0.5.10-6 per gene assumed 2624 in the 1972 BEIR report (NRC 1972). The data used for spontaneous 2625 mutation rate calculations also permit an estimate of 0.294 for average 2626 selection coefficient (s) associated with these diseases. 2627 2628 Average rate of induced mutations in mice. As mentioned earlier, until the 2629 1993 UNSCEAR report, the average rate of induced mutations used in DD 2630 calculations, was based on data from studies of recessive specific locus 2631 mutations in 7 genes. In the 2001 report, however, UNSCEAR expanded 2632 the database to include not only the above, but also data from studies of 2633 enzyme activity mutations, as well as dominant mutations at four loci (Sl, 2634 W, Sp and T). All these data come from studies of males in which the 2635 irradiated germ cell stages were stem-cell spermatogonia (the relevant 2636 germ cell stages in males from the standpoint of risks). The data from 2637 studies with female mice were not used since, as discussed in the 1988 2638 UNSCEAR report, there is uncertainty whether the mouse immature 2639 oocytes (with nearly zero sensitivity to mutation induction after acute as 2640 well as chronic irradiation) would provide a good model for assessing the 2641 mutational radiosensitivity of human immature oocytes that are the 2642 relevant germ cell stages in the females. For the purpose of risk 2643

82
estimation, to err on the side of caution, it was assumed that the induced 2644 rates in females will be the same as those in males. 2645 2646 Details of the data used are discussed in the UNSCEAR 2001 report and by 2647 Sankaranarayanan and Chakraborty (2000a). The average induced 2648 mutation rate, based on mutations recovered at a total of 34 mouse genes 2649 is (1.08 ± 0.30).10-5 gene-1Gy-1 for acute X-or γ-irradiation. With a dose-2650 rate reduction factor of 3 traditionally used, the rate for chronic irradiation 2651 conditions becomes (0.36 ± 0.10).10-5 gene-1Gy-1. 2652 2653 The doubling dose. With the revised estimates for average spontaneous 2654 mutation rate (2.95 ± 0.64).10-6 gene-1 generation-1 for human genes 2655 and for average rate of induced mutations (0.36 ± 0.10).10-5 gene-1Gy-1 2656 for mouse genes, the new DD becomes (0.82 ± 0.29) Gy. This estimate, 2657 however, is not very different from 1 Gy that has been used thus far but 2658 which was based entirely on mouse data. 2659 2660 UNSCEAR (2001) has suggested the continued use of the 1 Gy estimate in 2661 order to avoid the impression of undue precision, but noting that a 2662 conceptual change has now been made (i.e., use of human data on 2663 spontaneous and mouse data on induced mutation rates) and that the 2664 present estimate is supported by more extensive data than had been the 2665 case thus far. The Task Group supports the UNSCEAR judgement and 2666 propose that ICRP retain a DD value of 1 Gy. 2667 2668
6.3.3 Mutation component 2669 2670 As noted in section 2.2, the quantity ‘mutation component’ (MC) used in 2671 equation (1) provides a measure of the relative change in disease 2672 frequency per unit relative change in mutation rate for the different 2673 classes of genetic diseases. The elements of the basic MC concept were 2674 introduced already in the 1972 BEIR report (NRC 1972) and was 2675 subsequently considered in the papers of Crow and Denniston (1981, 2676 1985). Within the framework of an ICRP Task Group, set up in 1993, the 2677 problem was studied in detail and the concept, theory, methods for 2678 estimation and algebraic formulations were fully elaborated for both 2679 Mendelian and multifactorial diseases. The Task Group Report has since 2680 been published (ICRP 1999). The methods developed in the above ICRP 2681 document now enable the evaluation of the magnitude of MC for any post-2682 radiation generation of interest, after either a one-time or a permanent 2683 increase in mutation rate (i.e., radiation exposure in every generation). In 2684 what follows, a brief summary of the main findings is presented. 2685 2686 Mutation component for autosomal dominant diseases. For autosomal 2687 dominant diseases (for which the relationship between mutation and 2688 disease is straightforward) the estimation procedure is relatively simple. 2689 For a one-time increase in mutation rate which produces a one time 2690
83
increase in mutation rate (‘burst’, indicated by the subscript ‘b’ in MCb 2691 below), the change with time ‘t’ (in generations) is given by the equation: 2692 2693
MCb (t) = s (1- s)t-1 (4) 2694 2695
For radiation exposure to many successive generations producing a 2696 permanent increase in mutation rate (indicated by the subscript ‘p’), 2697 2698 MCp (t) = [1- (1- s)t ] (5) 2699 2700 Equations (4) and (5) show that MCb = MCp = s for the first post-2701 radiation generation following either a one-time or a permanent increase 2702 in mutation rate. With no further irradiation in subsequent generations, 2703 the value of MC will decay back to zero at a rate of (1- s) per generation. 2704 With a permanent increase in mutation rate, however, the MC value will 2705 slowly increase to 1 at the new equilibrium. Consistent with these 2706 changes in MC, for a one-time irradiation scenario, the disease frequency 2707 will show a transitory increase in the first generation, but over time, reach 2708 the earlier or ‘old’ equilibrium value; for a permanent increase in mutation 2709 rate, the disease frequency will continue to increase until the new 2710 equilibrium value of MC = 1 is reached. At the new equilibrium, an x% 2711 increase in mutation rate will result in an x% increase in disease 2712 frequency. 2713 2714 Mutation component for X-linked and autosomal recessive diseases. For 2715 X-linked diseases, for a one-time increase in mutation rate, the first 2716 generation MC = s as in the case of autosomal dominants, but the s value 2717 needs to be adjusted to take into account the fact that only one-third of 2718 the total X-chromosome complement is in males. The dynamics of change 2719 in MC in subsequent generations is similar to that for autosomal 2720 dominants. For autosomal recessives, MC in the first generation is close to 2721 zero (consistent with the fact that an autosomal recessive mutation does 2722 not result in disease in the first generation) 2723 2724 With a permanent increase in mutation rate, for both kinds of diseases, MC 2725 progressively increases to reach a value of 1 at the new equilibrium, but 2726 the rates of approach to the new equilibrium are different and dictated by 2727 s values and time (in generations) following irradiation. In particular, for 2728 autosomal recessive diseases, the rate of approach to the new equilibrium 2729 is very slow and much slower than that for autosomal dominants and X-2730 linked diseases. 2731 2732 The important point that emerges from the above discussion is that MC is 2733 related to s and therefore given s, one can estimate the dynamics of 2734 increase in MC and in disease frequencies for any post-radiation 2735 generation of interest. As mentioned in section 3.2, the average selection 2736 coefficient estimated from data on naturally-occurring autosomal dominant 2737

84
diseases is 0.294. This value rounded to 0.30 is the one used as the best 2738 estimate for MC for autosomal dominant and X-linked diseases. 2739 2740 Mutation component for chronic diseases. As mentioned earlier, 2741 multifactorial diseases have a high population frequency, but, unlike in the 2742 case of Mendelian diseases, the lack of adequate models to explain their 2743 stable frequencies in the population precluded any meaningful assessment 2744 of the radiation risk of these diseases. Descriptive models such as the 2745 multifactorial threshold model (MTM) of disease liability to explain the 2746 observed transmission patterns of these diseases and to estimate risks to 2747 relatives of affected individuals from data on population frequencies have 2748 existed for a long time, but as such, they are not suitable for assessing the 2749 impact of an increase in mutation rate on disease frequency. Similarly, 2750 although there was a wealth of literature on mechanistic models (that 2751 invoke mutation and selection as opposing forces in the evolution and 2752 maintenance of variability of polygenic/quantitative traits in populations), 2753 none of these models was geared towards assessing the impact of an 2754 increase in mutation rate on the frequency of multifactorial diseases. 2755 2756 The ICRP Task Group (1999) took the first step in addressing the above 2757 issue by formulating a ‘hybrid model’ which included some elements of the 2758 MTM and some of the mechanistic models mentioned above. The hybrid 2759 model is henceforth referred to as the finite locus threshold model (FLTM). 2760 Although the original intention was to use the model to estimate MC for 2761 both congenital abnormalities and chronic diseases, it soon became clear 2762 that its use for congenital abnormalities is not biologically meaningful and 2763 consequently, the Task Group decided to limit its use for chronic diseases 2764 only. As discussed later, this does not pose any problem for estimating the 2765 risk of congenital abnormalities since this can now be done without 2766 recourse to the DD method. To provide a background, the assumptions 2767 and use of the MTM are first discussed below. 2768 2769 Multifactorial threshold model (MTM) of disease liability. In the absence of 2770 information on the genetic or environmental factors that underlie 2771 multifactorial diseases, in the early 1960s, the MTM used in quantitative 2772 genetics for threshold characters was extended to these diseases to 2773 explain their transmission patterns and estimate risks to relatives. Since 2774 multifactorial diseases are ‘all-or-none’ traits (unlike quantitative traits 2775 (such as height or weight), in order to use the MTM for these diseases, it 2776 was necessary to postulate a hypothetical variable called ‘liability’ that 2777 underlies multifactorial diseases and a ‘threshold’ of liability which, when 2778 exceeded, would result in disease (Carter 1961; Falconer 1965). Worthy 2779 of note here is the fact that the MTM has been (and remains) useful for 2780 our understanding of familial aggregations and recurrence risks in families 2781 and makes good predictions even when there is uncertainty about the 2782 underlying mechanisms. Details of the MTM for disease liability have been 2783 discussed in a number of publications (see ICRP 1999 for a listing of the 2784 references). 2785

85
2786 Briefly, the assumptions of the standard version of MTM are the following: 2787 (a) all environmental and genetic causes can be combined into a single 2788
continuous variable called ‘liability’ which, as such cannot be 2789 measured; 2790
(b) liability is determined by a combination of numerous (essentially 2791 infinite number of) genetic and environmental factors, that act 2792 additively without dominance or epistasis, each contributing a small 2793 amount of liability and therefore show a Gaussian (normal) 2794 distribution; and, 2795
(c) the affected individuals are those whose liability exceeds a certain 2796 threshold value. 2797
The MTM enables the conversion of information on the incidence of a 2798 given multifactorial disease in the population (P) and in the relatives of 2799 those affected (q) into an estimate of correlation in liability between 2800 relatives from which a quantity called heritability (h2) which provides a 2801 measure of the relative importance of genetic factors in disease causation, 2802 can be estimated. 2803 2804 Heritability. Heritability, a common statistic used in quantitative genetics, 2805 provides a measure of the relative importance of transmissible genetic 2806 variation to the overall phenotypic variation. Since the phenotype owes its 2807 origin to genetic and environmental factors, in the analysis of variance, the 2808 total phenotypic variance (VP) is usually partitioned into two components, 2809 genetic (VG) and environmental (VE), assuming that these are independent 2810 of each other (i.e., they are not correlated). The ratio VG/VP is called the 2811 ‘broad-sense heritability’, or degree of genetic determination, symbolized 2812 by h2. Estimates of the heritability of liability for many multifactorial 2813 diseases have been published in the literature and are in the range from 2814 about 0.30 to 0.80 although for most types of cancer the heritability 2815 coefficient is judged to be less than 0.30. 2816 2817 The genotypic variance, VG, can be subdivided into an additive component 2818 (VA) and a component due to deviations from additivity. Additive genetic 2819 variance is the component that is attributable to the average effects of 2820 genes considered singly, as transmitted in the gametes. The ratio, VA/VG, 2821 called ‘narrow-sense heritability’, determines the magnitude of correlation 2822 between relatives (Falconer, 1960). 2823 2824 The Finite-locus-threshold model used for estimating MC for chronic 2825 diseases. The FLTM incorporates the assumptions of liability threshold 2826 from the MTM (but suitably redefined to take into account mutations at a 2827 finite number of genes) and the concepts of mutation and selection from 2828 models on the maintenance and evolution of polygenic variability 2829 underlying quantitative traits. The choice of the FLTM was dictated by two 2830 main considerations: (a) current knowledge of the genetic basis of well-2831 studied chronic diseases, such as coronary heart disease (CHD), supports 2832 the view that a large proportion the variability of intermediate quantitative 2833

86
traits (such as serum cholesterol levels, a risk factor for CHD) in the 2834 population is due to mutations at a limited number of gene loci (ICRP 2835 1999; Sankaranarayanan et al. 1999) and (b) in the absence of precise 2836 information on the genetic basis of most multifactorial diseases, the FLTM 2837 provides a useful starting point, because with such a model, the meaning 2838 of parameters reflecting mutation rates and selection can be quantitatively 2839 assessed in terms of those for single gene effects. 2840 2841 Briefly, the FLTM assumes that the liability to disease, made up of genetic 2842 and environmental factors, is a continuous variable. The genetic 2843 component of liability is discrete i.e., it is determined by the total number 2844 of mutant genes (defined as a random variable, g, the number of mutant 2845 genes in a genotype at n loci) and the environmental effect, e is a random 2846 variable which has a Gaussian (normal) distribution with mean = 0 and 2847 variance = Ve. The total liability, thus, has two components: (a) a function 2848 [f(g)] of the number of mutant genes in the n-locus genotype of an 2849 individual and (b) a normally distributed environmental effect, e . The 2850 threshold characteristic of the model is described by assuming that 2851 individuals with liability exceeding T are phenotypically affected and have 2852 a fitness of (1 – s) and those below it, are normal with fitness equal to 1. 2853 Although the mathematical formulations of the FLTM cannot be expressed 2854 in the form of a single equation, the predictions of the model can be 2855 iteratively evaluated from the computer programme that was developed 2856 for this purpose. The steps include the following: first, with a defined set 2857 of parameter values (mutation rate, selection coefficients, threshold etc), 2858 the programme is run until the population reaches equilibrium between 2859 mutation and selection. When once this is achieved, the mutation rate is 2860 increased once or permanently and the computer run is resumed with the 2861 new mutation rate (with the other parameters remaining the same). The 2862 changes in the magnitude of MC and its relationship to heritability of 2863 liability (h2) are examined in desired generations and at the new 2864 equilibrium. The h2 estimates are not inputs, but outputs of the 2865 programme, obtained with different combinations of parameter values (for 2866 the numbers of gene loci from 3 to 6, mutation rate, selection coefficients, 2867 environmental variance and threshold). The conclusions discussed below 2868 are for the 5-locus model, but they remain qualitatively unaltered for other 2869 values of the number of gene loci. 2870
2871 Main conclusions of the computer simulation studies. In these studies, a 2872 5-locus model was used and the relationship between h2 and changes in 2873 MC were assessed for two scenarios: (a) the population sustains an 2874 increase in mutation rate every generation and (b) the population sustains 2875 an increase in mutation rate in one generation only. The initial 2876 (spontaneous) mutation rate assumed in the calculations was 10-6 per 2877 gene and the effects were examined for a 15% increase in mutation rate 2878 (i.e., 10-6/gene to 1.15.10-6/gene) with selection coefficients, s = 0.2 to 2879 0.8. The conclusions are the following: 2880

87
(a) Under conditions of a permanent increase in mutation rate, the MC at 2881 the new equilibrium is close to 1 over a wide range of h2 values from 2882 about 0.3 to 0.8 that are of importance in the present context; stated 2883 differently, an x% increase in mutation rate will cause an x% increase 2884 in disease frequency at the new equilibrium. 2885
(b) Again, under the same conditions and over the same range of h2 2886 values the MC in the first several generations is very small in the 2887 range from 0.01 to 0.02, often more close to 0.01 than to 0.02. In 2888 other words, the predicted relative increase in disease frequency is 2889 very small; 2890
(c) If the population sustains radiation exposure in one generation only, 2891 the MC in the first generation is as indicated above under item (b) and 2892 its value gradually decays back to zero; and, 2893
(d) Conclusions (a to c) are valid when there is no sporadic component of 2894 disease i.e., non-occurrence of individuals with disease that is 2895 unrelated to the genotype; when sporadics occur, the effect is to 2896 reduce the MC both in early generations and at the new equilibrium. 2897
2898 The conclusions discussed above hold for so many different combination of 2899 parameter values (i.e., threshold, selection coefficient, number of loci, 2900 environmental variance, spontaneous mutation rate, increases in mutation 2901 rate etc that they can be considered robust. Additionally, it was found that 2902 for mutation rates of the order known for Mendelian genes, the FLTM with 2903 a few loci and weak selection provides a good approximation to study the 2904 possible increases in the frequencies of chronic diseases in populations 2905 exposed to radiation. 2906 2907 In its 2001 report UNSCEAR used MC = 0.02 as the best estimate in the 2908 risk equation for estimating the risk of chronic diseases. 2909 2910
6.3.4 The concept of potential recoverability correction factor 2911
The use of equation (1) (i.e., risk = P × [1/DD] × MC) for risk estimation 2912 implies that the genes at which spontaneous mutations are known to 2913 cause disease (included under P) will also respond to induced mutations, 2914 that such mutations will be compatible with viability and therefore 2915 recoverable in live born progeny of irradiated individuals. This assumption 2916 gained support from studies of induced mutations in specific genes in 2917 several model systems. However, no radiation-induced germ-cell gene 2918 mutations, let alone induced genetic diseases have thus far been identified 2919 in human studies. 2920
Advances in human molecular biology and in radiobiology have now shown 2921 that: (a) spontaneous disease-causing mutations and radiation-induced 2922 mutations in experimental systems, differ in several respects, both in 2923 their nature and mechanisms by which they arise (or induced); (b) there 2924 are both structural and functional constraints that preclude the 2925 recoverability of induced mutations in all genomic regions i.e., only a 2926

88
small proportion of human genes of relevance from the disease point of 2927 view is likely to be responsive to radiation-induced mutations that are 2928 recoverable in live born progeny and (c) genes that have hitherto been 2929 used in studies on induced mutations are those that are non-essential for 2930 viability and also happen to be located in genomic regions, also non-2931 essential for viability (reviewed in Sankaranarayanan 1999). The crux of 2932 the argument then, is that the induced mutation rate from mouse studies 2933 that are used in risk estimation are likely to be over-estimates of the rate 2934 at which induced mutations in humans will precipitate disease. 2935
Since there is no alternative to the use of mouse data on induced 2936 mutations for risk estimation, methods need to be devised to bridge the 2937 gap between empirically determined rates of induced mutations in mice 2938 and the rates at which disease-causing mutations may be recovered in 2939 human live births. One such method that has been developed, involves the 2940 incorporation of a correction factor termed potential recoverability 2941 correction factor (or PRCF) into risk equation (1) so that the risk now 2942 becomes a product of 4 quantities instead of the original three: 2943
Risk per unit dose = P × [1/DD] × MC × PRCF (6) 2944
where the first three are as defined earlier and PRCF is the disease-class 2945 specific potential recoverability correction factor. Since PRCF is a fraction, 2946 the estimate of risk will now be lower. 2947
In order to estimate potential recoverability of induced mutations, a set of 2948 criteria was first defined using molecular information on recovered 2949 mutations in experimental systems. The operative words are the italicized 2950 ones, since (a) knowledge of the structural and functional genomics of the 2951 human genome is not yet complete; (b) so far, no radiation-induced 2952 human germ cell mutations have been recovered to provide a frame of 2953 reference and (c) the criteria may change with advances in knowledge in 2954 the coming years. The criteria that could be developed were then applied 2955 to human genes of relevance from the disease point of view, taking into 2956 gene size, organisation, function, genomic context (i.e., whether the gene 2957 is located in a ‘gene-rich’ or ‘gene-poor’ region), spectra of spontaneous 2958 mutations in the gene, whether deletions, including contiguous genes are 2959 known in the region and the known mutational mechanisms. The question 2960 asked was: if a deletion (the predominant type of radiation-induced 2961 change) were to be induced in this gene/gene region, is it potentially 2962 recoverable in a live birth? 2963
Details of the criteria used and the classification of the genes into three 2964 groups i.e., group 1, ‘induced deletion is unlikely to be recovered’, group 2965 2, ‘uncertain recoverability’ and group 3, ‘potentially recoverable’ are 2966 discussed in detail by Sankaranarayanan and Chakraborty (2000) and in 2967 the UNSCEAR (2001) report. Since the assignment to group 1 is less 2968 subjective (and therefore relatively more reliable), to err on the side of 2969

89
caution, potential recoverabililty was calculated as follows: if a total of N 2970 genes are analysed and if n among them could be excluded as ‘unlikely to 2971 be recovered’, the remainder (made up of groups 2 and 3) constitute 2972 (N−n) and the fraction (N−n)/N provides a crude measure of genes at 2973 which induced mutations may be recoverable. This fraction is called the 2974 ‘unweighted’ PRCF. 2975
The PRCF as estimated above, however, does not take into account 2976 differences in incidence of the different diseases. For example, if a disease 2977 with high incidence belongs to group 1, societal concern will be far less 2978 than when it belongs to the other groups. Consequently, a weighted PRCF 2979 was also calculated. If P is the total incidence of diseases due to mutations 2980 in N genes, and p is the incidence of diseases due to mutations in (N−n) 2981 genes, then [p(N−n)/PN] represents the ‘weighted PRCF’. 2982
The results of analysis of a total of 67 autosomal and X-linked genes are 2983 summarized in Table 6.2. 2984
Table 6.2: Summary of assessments of potential recoverability of 2985 radiation-induced mutations in autosomal and X-linked genes 2986 Groups No. of
genes Unweighted a PRCF
Incidence (x 104)b
Weightedc
PRCF Autosomal dominants 1 (unlikely to be recovered) 42 - 46.45 - 2 & 3 (uncertain + potentially recoverable)
17 0.29 55.90 0.157
Sub-total 59 102.35 Autosomal dominants + X-linked 1 (unlikely to be recovered) 43 - 48.95 - 2 & 3 (uncertain + potentially recoverable)
24 0.36 60.90 0.199
Total 67 109.85 2987 aUnweighted PRCF: aut. dominants: 17/59 = 0.29; aut. dominants + X-linked = 24/67 = 0.36 2988 bEstimates from Sankaranarayanan (1998) and Sankaranarayanan and Chakraborty (2000) 2989 cWeighted PCRF: aut. dominants: (55.9 x 17)/(102.35 x 59) = 0.157; aut. dominants + X-linked: 2990 (60.9 x 24)/(109.85 x 67) = 0.199 2991 2992
PRCF for autsomal dominant and X-linked diseases. In view of the fact that 2993 autosomal dominants have an order-of-magnitude higher overall incidence 2994 than X-linked ones (1.5% versus 0.15%), the PRCFs for the former are 2995 more relevant. UNSCEAR, therefore suggested the use of the PRCF range 2996 of 0.15 to 0.30 in the risk equation for estimating the risk of both 2997 autosomal dominant and X-linked diseases. 2998
2999 PRCF for autosomal recessives. While the recoverability of induced 3000 recessive mutations is also subject to structural and functional constraints, 3001 in view of the fact that these mutations are first present in heterozygotes 3002 (and 50% of the gene products are generally sufficient for normal 3003 function), one can assume that even large deletions may be recoverable in 3004
90
the heterozygotes. Additionally, as discussed earlier, induced recessive 3005 mutations do not, at least in the first several generations, result in 3006 recessive diseases. Consequently, no attempt was made to estimate PRCF 3007 for recessive diseases. It should be noted however that, ignoring PRCF in 3008 the risk equation is equivalent to assuming PRCF = 1, but in reality, this 3009 does not affect the estimate of risk (since MC is nearly zero in the first 3010 several generations, the product of P and MC is already zero). 3011
3012 PRCF for chronic diseases. As may be recalled, in the FLTM used to 3013 estimate MC for chronic diseases, one of the assumptions is that of 3014 simultaneous increase in mutation rate in all the underlying genes which, 3015 in turn, causes the liability to exceed the threshold. A crude approximation 3016 of the PRCF for each multifactorial phenotype is the xth power of that for 3017 mutations at a single locus, where x is the number of gene loci, assumed 3018 to be independent of each other, that underlie the disease. Since the 3019 PRCF for single gene mutations is in the range from 0.15 to 0.30, for 3020 chronic diseases, the figures become 0.15x to 0.30x. With the assumption 3021 of just 2 loci, the estimates become 0.02 to 0.09 and with more loci, 3022 substantially smaller. Intuitively, these conclusions are not unexpected 3023 when one considers that here, one is estimating the probability of 3024 simultaneous recoverability of induced mutations at more than one 3025 independent gene. 3026
3027 UNSCEAR adopted the PRCF range of 0.02 to 0.09 with the view that the 3028 use of this range will not underestimate risk. 3029
3030 PRCF for congenital abnormalities. The available data do not permit PRCF 3031 estimation for congenital abnormalities. However, since risk estimation for 3032 this class of diseases is now done without using the DD method (see the 3033 next section), our inability to estimate PRCF is not a problem. 3034
3035 6.3.5 The concept that multi-system developmental abnormalities are likely to 3036
be the major manifestations of radiation-induced genetic damage in 3037 humans 3038
3039 As discussed in the preceding paragraphs, in genetic risk estimation, the 3040 emphasis has been on expressing risks in terms of inducible genetic 3041 diseases, the expectation being that their phenotypes will be similar to 3042 those known from studies of naturally-occurring genetic diseases. 3043 However, when one considers the following facts it is clear that the 3044 emphasis on genetic diseases gives only a partial answer to the question 3045 of genetic risks. The facts and observations are: 3046 (i) radiation induces genetic damage through random deposition of 3047
energy; 3048 (ii) the whole genome is the target; 3049

91
(iii) most radiation-induced mutations studied in experimental systems 3050 are DNA deletions, often encompassing more than one gene; 3051
(iv) the recoverability of induced deletions is subject to structural and 3052 functional constraints so that only a small proportion of them is 3053 compatible with live births, and, 3054
(v) the phenotype of viability-compatible deletions will reflect the gene 3055 functions that are lost because of the deletion and we do not as yet 3056 have ‘windows’ for all genomic regions. 3057
3058 It follows therefore, that the problem in genetic risk estimation is one of 3059 delineating the phenotypes of viability-compatible deletions that may be 3060 induced in different genomic regions which may or may not have 3061 counterparts in naturally-occurring genetic diseases. 3062
3063 Microdeletion syndromes in humans. Some inferences are now possible on 3064 the potential phenotypes of radiation-induced deletions from studies of 3065 naturally-occurring microdeletion syndromes in humans. These result from 3066 deletions of multiple, physically contiguous often functionally unrelated 3067 genes that are compatible with viability in heterozygous condition and are 3068 identified clinically through a characteristic association of unusual 3069 appearance and defective organ development. Many examples of 3070 microdeletions have been (and continue to be) reported in the human 3071 genetics literature. They have been found in nearly all the chromosomes, 3072 but their occurrence in different chromosomal regions is non-random (e.g., 3073 Brewer et al. 1998). This is not unexpected in the light of differences in 3074 gene density in different chromosomes/chromosomal regions. The 3075 important point here is that despite their occurrence in different 3076 chromosomes, the common denominators of the phenotype of many of 3077 these deletions are: mental retardation, a specific pattern of dysmorphic 3078 features, serious malformations and growth retardation. These findings in 3079 humans are supported, among others, by studies of Cattanach et al. 3080 (1993, 1996) showing that, in the mouse, radiation-induced multi-locus 3081 deletions constitute the genetic basis for a significant proportion of growth 3082 retarded animals recovered in their work 3083 3084 It was therefore suggested that the predominant adverse effects of 3085 gonadal irradiation in humans are likely to be manifest as multi-system 3086 developmental abnormalities which are formally called ‘congenital 3087 abnormalities’ (Sankaranarayanan 1999). However, unlike naturally-3088 occurring congenital abnormalities which are interpreted as being 3089 multifactorial, radiation-induced congenital abnormalities, because they 3090 are multi-locus deletions, are predicted to show, by and large, autosomal 3091 dominant patterns of inheritance. This prediction has been fulfilled in 3092 mouse radiation studies on skeletal abnormalities (Ehling 1965, 1966; 3093 Selby and Selby 1977), cataracts (Favor 1989), growth retardation (Searle 3094 and Beechey 1986) and congenital anomalies (Kirk and Lyon 1984; Lyon 3095 and Renshaw 1988; Nomura 1982, 1988, 1994). No transmission tests 3096

92
could be carried out however, for congenital abnormalities because they 3097 were ascertained in utero. 3098
3099 Risk of developmental abnormalities. UNSCEAR (2001) used the mouse 3100 data on skeletal abnormalities, cataracts and congenital abnormalities 3101 (appropriately adjusting the rates for chronic low LET radiation conditions) 3102 to obtain an overall estimate of the risk of developmental abnormalities 3103 about 20.10-4.Gy-1 (given in Table 6.3 in this document under the heading 3104 ‘congenital abnormalities’ as 2,000.10-6. Gy-1 for the first generation). All 3105 the data used in these calculations come from studies of irradiation of 3106 males and the rate so estimated was assumed to be applicable to both 3107 sexes. 3108
3109 6.4 The 2001 UNSCEAR Risk Estimates 3110
3111 6.4.1 Estimates of genetic risk for a population sustaining radiation exposure 3112 generation after generation 3113 3114
Table 6.3 summarizes the risk estimates presented in the 2001 UNSCEAR 3115 report. The risks are expressed as the predicted number of additional 3116 cases (i.e., over the baseline) of different classes of genetic disease per 3117 million progeny per Gy for a population exposed to low LET, low-dose or 3118 chronic irradiation generation after generation. For all classes except 3119 congenital abnormalities, the estimates are based on a DD of 1 Gy and the 3120 respective values of P, MC and PRCF for the different classes. For 3121 congenital abnormalities, the risk estimate comes from mouse data 3122 (discussed in the preceding paragraph) and is not based on the DD 3123 method. 3124 3125 As can be noted, the first generation risk (i.e., the risk to the children of 3126 an exposed population) is estimated to be of the order of 750 to 1,500 3127 cases for autosomal dominant and X-linked diseases, zero for autosomal 3128 recessive diseases, 250 to 1,200 cases for chronic diseases and 2,000 3129 cases of congenital abnormalities. The total risk is of the order of about 3130 3,000 to 4,700 cases which represent about 0.4 to 0.6% of the baseline 3131 risk. 3132 3133 The risk to the second generation (i.e., to the grandchildren) becomes 3134 slightly higher for all classes except for chronic diseases in view of the fact 3135 that the mutation component for these diseases does not increase over 3136 the first several generations. 3137
3138

93
Table 6.3: Current estimates of genetic risks from continuing exposure to 3139 low LET, low-dose or chronic irradiation (UNSCEAR 2001) with assumed 3140 doubling dose of 1 Gy 3141
Risk per Gy per million progeny Disease class
Baseline frequency (per million live births)
1st generation up to 2nd generation
Mendelian Autosomal dominant 16,500 ~750 to 1,500a ~1,300 to 2,500 & X-linked Autosomal recessive 7,500 0 0 Chromosomal 4,000 b b Multifactorial Chronic 650,000c ~250 to 1,200 ~250 to 1,200 Congenital abnormalities 60,000 ~ 2,000d ~ 2,400 to 3,000e Total 738,000 ~3,000 to 4,700 ~3,950 to 6,700 Total per Gy expressed as per cent of baseline ~0.41 to 0.64 ~0.53 to 0.91 a The ranges reflect biological and not statistical uncertainties 3142 bAssumed to be subsumed in part under autosomal dominant and X-linked diseases and in part under 3143 congenital abnormalities 3144 c Frequency in the population 3145 d Estimated from mouse data without using the DD method 3146 e Newly-induced damage of pre-existing damage (it is assumed that between 20 and 50% of the 3147 progeny affected in the first generation will transmit the damage to the next generation resulting in 3148 400 to 1,000 cases.) 3149 3150 6.4.2 Estimates of genetic risks for a population that sustains radiation exposure 3151
in one generation only 3152 3153
The estimates of genetic risk under conditions when the population 3154 sustains radiation exposure in one generation only (and no further 3155 radiation in subsequent generations) are presented in Table 6.4. Again, all 3156 estimates are expressed per Gy per million progeny. As expected, the first 3157 generation risks (i.e., risks to the children of those exposed) are the same 3158 as those given in Table 6.3. With no further radiation, the risk of 3159 autosomal dominant and X-linked diseases to the second generation (i.e., 3160 to the grandchildren) declines as a result of selection. For chronic 3161 multifactorial diseases, since the mutation component remains low for 3162 several generations, the risk to the second generation remains about the 3163 same as that in the first generation. The risk of congenital abnormalities is 3164 predicted to be of the order of 400 to 1,000 cases (under the assumption 3165 that about 20 to 50% of those affected in the first generation transmit the 3166 damage to the next generation). 3167 3168

94
Table 6.4: Current estimates of genetic risks from one-generation 3169 exposure to low LET, low-dose or chronic irradiation (UNSCEAR 2001) 3170 with assumed doubling dose of 1 Gy 3171 3172
Risk per Gy per million progeny Disease class Baseline frequency (per million live births)
1st generation up to 2nd generation
Mendelian Autosomal dominant 16,500 ~750 to 1,500a ~500 to 1,000
& X-linked Autosomal recessive 7,500 0 0 Chromosomal 4,000 b b
Multifactorial Chronic 650,000c ~250 to 1,200 ~250 to 1,200
Congenital abnormalities 60,000 ~ 2,000d ~ 400 to 1,000e
Total 738,000 ~3,000 to 4,700 ~1,150 to 3,200 Total per Gy expressed as per cent of baseline ~0.41 to 0.64 ~0.16 to 0.43
3173 a Risk to second generation is lower than that in the first because of the assumption that the radiation 3174
exposure occurs in one generation only; the risk will progressively decrease with time (in 3175 generations) 3176
b Assumed to be subsumed in part under the risk of autosomal dominant and X-linked diseases and in 3177 part under that of congenital abnormalities 3178
c Frequency in the population 3179 d Estimate obtained using mouse data on developmental abnormalities and not with the doubling dose 3180
method 3181 e Under the assumption that about 20 to 50% of those affected in the first generation transmit the 3182
damage to the next generation 3183 3184 6.4.3 Strengths and limitations of the risk estimates 3185 3186
On the basis of UNSCEAR (2001) the Task Group have, for the first time, 3187 been able to provide ICRP estimates of risks for all classes of genetic 3188 diseases. While these estimates reflect our current knowledge in this 3189 area, the strengths and limitations of these estimates need to be borne in 3190 mind, in view of various assumptions that have been used. 3191 3192 Equal mutational sensitivity of human males and females. The prevalent 3193 view that the mouse immature oocytes may not be an adequate model for 3194 assessing the mutational radiosensitivity of human immature oocytes 3195 necessitated the assumption that human females and males have the 3196 same mutational radiosensitivity which in turn is equal to that of mouse 3197 males. If, however, human females have a lower sensitivity in this regard, 3198 the average rate of induced mutations would be expected to be lower than 3199 the one used. In turn, this implies that the DD will be higher (and 1/DD 3200 will be smaller than 0.01 that has been used). At present it is not possible 3201 to address this issue. 3202 3203 Average spontaneous and induced mutation rates used in DD calculations. 3204 As may be recalled, the average estimate of 2.95.10-6 per human gene 3205 was based on an estimated 135 genes underlying some 26 autosomal 3206 dominant disease phenotypes which constitute a subset of such diseases 3207

95
included in the estimate of baseline frequencies. Bearing in mind the fact 3208 that the human genome contains about 30,000 genes, one can only 3209 speculate whether the above average spontaneous mutation rate estimate 3210 is an over- or underestimate of the true average rate. 3211 3212 Similarly, although the estimate of induced mutation rate for mouse genes 3213 is based on more data than was the case until now, the total number of 3214 genes included in the present analysis is still only 34 and in a sizeable 3215 proportion of them, induced mutations were rare. Therefore, while the 3216 possibility remains that the presently-estimated induced rate may be 3217 biased upwards, its extent is difficult to determine at present. 3218
3219 Mutation components. The estimate MC = 0.3 for autosomal dominant 3220
and X-linked diseases is based on the average s value for the autosomal 3221 dominant diseases (since MC = s in the first generation) the data of which 3222 provided the basis for spontaneous mutation rate calculations. It should be 3223 realized, however, that for a substantial proportion of diseases, onset is in 3224 middle and later ages (i.e., beyond the age of reproduction) which means 3225 that s is smaller and therefore, the MC value used may be an over-3226 estimate. 3227
3228 Potential recoverability correction factors. For autosomal dominant and X-3229
linked diseases, a range of PRCF from 0.15 to 0.30 was used, the lower 3230 limit being a weighted estimate and the upper limit, the unweighted one. 3231 However, the criteria developed for potential recoverability of induced 3232 deletions do not include breakpoint specificities which are undoubtedly 3233 important in the case of deletion-associated naturally-occurring Mendelian 3234 diseases. It seems unlikely that radiation-induced deletions would share 3235 these specificities, and certainly not in all genomic regions. If these 3236 specificities are indeed relevant for recovering induced deletions, even the 3237 weighted PRCF may be an over-estimate. 3238
3239 For chronic diseases, it has been assumed that the PRCF may simply be 3240
the xth power of that for a single gene disease, with x = the number of 3241 genes which have to be simultaneously mutated to cause disease; the 3242 values of 0.02 to 0.09 have assumed x = 2 (the minimum number). 3243 Although, statistically, such a calculation can be defended, the implicit 3244 biological assumption that at low doses of radiation, two independent 3245 mutations underlying a chronic disease may be simultaneously induced 3246 and recovered seems unrealistic. 3247
3248 There is an additional issue here, namely that, the PRCF for chronic 3249 diseases is very sensitive to x (e.g., even if x = 3, the PRCF range 3250 becomes 0.003 to 0.03). The essence of the argument then is that the 3251 PRCFs used for chronic diseases may over-estimate the risk. 3252 3253 Overlap in estimates of risk. It should be recalled that: (a) the estimates 3254 for autosomal dominant and X-linked diseases have been obtained using 3255

96
the DD method; (b) the risk of induced congenital abnormalities which are 3256 also adverse dominant effects have been estimated independently using 3257 mouse data without recourse to the DD method and (c) the risk of 3258 ‘chromosomal diseases’ has been assumed to be subsumed under the risk 3259 of autosomal dominant and X-linked diseases. The important point here is 3260 that, since all these represent dominant effects (and mutations in many 3261 developmental genes are known to cause Mendelian diseases), there must 3262 be overlap between the classes of risk grouped under the headings of 3263 ‘autosomal dominant + X-linked’ and ‘congenital abnormalities’ although it 3264 is difficult to assess its magnitude. The consequence is that the sum may 3265 over-estimate the actual risk of dominant effects. 3266
6.5 ICRP’S earlier and present assessments of risk estimates for 3267 deriving risk coefficients for genetic effects 3268 3269 6.5.1 ICRP Publication 60 3270 3271
In Publication 60 (ICRP 1991), ICRP used the genetic risk estimates then 3272 available (UNSCEAR 1988; NRC 1990) as a starting point for deriving risk 3273 coefficients for ‘severe hereditary effects’. It is important to mention here 3274 that in ICRP’s calculations then, while the DD assumed (1 Gy) was the 3275 same as that used now, the baseline frequency of Mendelian diseases 3276 was only about one-half of that currently used (1.25% then versus 2.4% 3277 now). Additionally, for multifactorial diseases as a whole (estimated 3278 baseline frequency of 71%; same as now), the ICRP assumed that MC = 3279 0.05 for all post-radiation generations (this assumption is incorrect in the 3280 light of current calculations; see section 3.3) and besides, incorporated an 3281 additional arbitrary correction factor (called ‘severity correction factor’) of 3282 1/3 to estimate the proportion of inducible multifactorial diseases that 3283 may be deemed ‘severe’ (no such correction is used in the present 3284 assessments). 3285 3286 For a population exposed to low dose rate, low LET irradiation, the risk 3287 coefficients estimated by ICRP (1991) are summarized in Table 6.5 (see 3288 also Table 3 of Sankaranarayanan 1991). 3289 3290

97
Table 6.5: Estimates of risk coefficients in ICRP Publication 60 (ICRP 3291 1991; Sankaranarayanan 1991) 3292 3293
Risk coefficient in % per Gy for Time span
Disease category Reproductive
Population Total
Population Up to two generations
Mendelian & chromosomal 0.3 0.1
Multifactorial 0.23 0.09 Total 0.53 0.19 New equilibrium Mendelian & chromosomal 1.2 0.5 Multifactorial 1.2 0.5 Total 2.4 1.0a
3294 a The estimate used by ICRP (1991) in its summary of ‘nominal probability coefficients for stochastic 3295 effects’ (Table 6.3; ICRP 1991); the figure given in this Table of 1.3.10-2.Gy-1 takes into account a 3296 weighting factor for years of life lost (ICRP 1991) 3297
3298 The estimates for the ‘reproductive population’ apply when the radiation 3299 doses received by all individuals in the population are genetically 3300 significant. However, when the total population of all ages is considered, 3301 the genetically significant dose will be markedly lower than the total dose 3302 received over a lifetime. Genetic damage sustained by germ cells of 3303 individuals who are beyond the reproductive period, or who are not 3304 procreating for any reason, poses no genetic risks. On the assumption that 3305 the average life expectancy at birth is of the order of 75 years, the dose 3306 received by 30 years of age (i.e., the mean reproductive age) is 40% (i.e., 3307 30/75 = 0.4) of the total dose. The risk coefficients for the total 3308 population, therefore, are estimated to be 40% of the above values. 3309 3310 Although ICRP (1991) presented risk coefficients for the first two 3311 generations as well as for the new equilibrium, it used the equilibrium 3312 estimate of 1.0. 10-2.Gy-1 for the total population (with an additional 3313 weighting factor for years of lost life to arrive at a figure of 1.3.10-2.Gy-1 3314 for ‘severe hereditary effects’ in its summary table of ‘nominal probability 3315 coefficients’ (Table 3; ICRP 1991). 3316 3317
6.5.2 Current assessments. 3318 3319
In its current assessments, the Task Group used the estimates of risk 3320 presented in Table 6.3 as starting points. The upper and lower limits of 3321 each of the estimated ranges were first used to obtain average estimates 3322 and the latter are then combined to generate a single estimate of risk 3323 coefficient for all genetic effects. Details of calculations are given in the 3324 next section. 3325 3326 Risk coefficients up to generation 2 for a population sustaining radiation 3327
exposure in every generation 3328

98
(a) risk of Mendelian diseases = 1,300 to 2,500 cases per 106 progeny 3329 per Gy (= 0.13.10-2 to 0.25.10-2.Gy-1; average: 0.19.10-2.Gy-1); 3330
(b) risk of chronic multifactorial diseases = 250 to 1,200 cases per 106 3331 progeny per Gy (= 0.03.10-2.Gy-1 to 0.12. 10-2.Gy-1; average: 3332 0.08.10-2.Gy-1); 3333
(c) risk of congenital abnormalities = 2,400 to 3,000 cases per 106 3334 progeny per Gy (0.24.10-2 to 0.30.10-2.Gy-1; average: 0.27.10-2.Gy-3335 1) and, 3336
(d) risk of all classes (i.e., [a] to [c], combined) = 3,950 to 6,700 3337 cases per 106 progeny per Gy or 0.40.10-2 to 0.67.10-2.Gy-1; 3338 average: 0.54.10-2.Gy-1 3339
3340 The above estimates are for a reproductive population. For the total 3341 population, the estimates are multiplied by 0.4. All the estimates are 3342 summarized in Table 6.6. 3343 3344
Table 6.6: Risk coefficients for the reproductive and the total population 3345 obtained with method 1 (all values expressed in percent per Gy) and up 3346 to 2 generations when the population sustains radiation exposure 3347 generation after generation 3348
Reproductive population Total population
Disease class
Range Averagea Averageb (a) Mendelian diseases 0.13 to 0.25 0.19 0.08 (b) Chronic diseases 0.03 to 0.12 0.08 0.03 (c) Congenital abnormalities 0.24 to 0.30 0.27 0.11 Total for all classes 0.54 0.22
3349 a Average of the limits of the indicated ranges 3350 b 40% of that for the reproductive population 3351
3352 It is evident that, despite different baseline frequencies for Mendelian 3353 diseases, MCs and differences in risk estimates for comparable classes of 3354 diseases, the present estimates for the reproductive (0.54) as well as for 3355 the total population (0.22) are remarkably similar to those arrived at in 3356 ICRP Publication 60 (1991; respectively, 0.53 and 0.19; see Table 5.). It 3357 should be stressed that this similarity is a matter of pure coincidence! 3358 3359 As may be recalled, the ranges in the estimates of risk coefficients for 3360 Mendelian and chronic diseases are a reflection of the ranges of PRCFs 3361 (0.15 to 0.30 for autosomal dominant and X-linked diseases and 0.02 to 3362 0.09 for chronic diseases). Arguments to suggest that the upper limits of 3363 these ranges may represent over-estimates and that the actual values 3364 may be closer to the lower limits were presented in Section 6.3. If this 3365 reasoning is accepted, then it is meaningful to use the lower limit of the 3366 ranges for the above two classes of diseases and the average of the range 3367 for congenital abnormalities. When this is done, the risk coefficients 3368 become smaller than those presented in Table 6.6 as noted below: 3369

99
Reproductive population: 3370 Mendelian diseases, 0.13; chronic diseases, 0.03, congenital 3371 abnormalities, 0.27, Total: 0.43.10-2. Gy-1 3372
Total population: 3373 Mendelian diseases, 0.05; chronic diseases, 0.01; congenital 3374
abnormalities, 0.11, Total: 0.17.10-2. Gy-1 3375 3376
Risk coefficients for the first post-radiation generation only 3377 The risk coefficients for the first post-radiation generation are summarized 3378 in Table 6.7. Again as expected, the values are smaller than those up to 3379 the first two generations. 3380
3381 Table 6.7: Risk coefficients for the reproductive population and the total 3382 population for the first post-irradiation generation (all values are 3383 expressed as per cent per Gy) 3384
Reproductive population Total population
Disease class
Range Averagea Averageb
(a) Mendelian diseases 0.075 to 0.150 0.11 0.05 (b) Chronic diseases 0.025 to 0.120 0.07 0.03 (c) Congenital abnormalities - 0.20 0.08 Total for all classes 0.38 0.16
3385 a Average of the limits of the indicated ranges 3386 b 40% of that for the reproductive population 3387 3388
If, however, the lower limits of the ranges for Mendelian and chronic 3389 diseases are used, then the estimates are 0.30.10-2. Gy-1 for the 3390 reproductive population (i.e., 0.075 + 0.025 + 0.20 = 0.30) and 0.12.10-3391 2. Gy-1 for the total population (i.e., [0.075 × 0.4] + [0.025 × 0.4] + 3392 [0.20 × 0.4] = 0.12). 3393
6.5.3 Justifications for using risk estimates up to generation two versus the first 3394 post-radiation generation for calculating risk coefficients 3395
3396 In a strict sense, genetic risk coefficients cannot be compared or combined 3397 with those for cancers. This is because of the fact that cancer risk 3398 coefficients quantify the probability of harmful effects of radiation to the 3399 exposed individuals themselves, and genetic risk coefficients quantify the 3400 probability of harmful effects to the descendants of those exposed. In the 3401 case of genetic risk coefficients, the inclusion of risk up to two generations 3402 in the calculations can be justified on the basis that people are generally 3403 interested in the well-being of their children and grandchildren. The 3404 estimate restricted to the first post-radiation generation has the advantage 3405 that it is more comparable to those for cancers and therefore deserves 3406 serious consideration. For the purpose of tissue weighting, the use of the 3407 first post-radiation generation risk might be considered as preferable in 3408

100
order to make comparisons with cancer risk more consistent. However, 3409 given the breadth of the judgements needed for the choice of tissue 3410 weighting factors and for the purposes of simplicity the Task Group 3411 recommend the use of the estimates of risks up to the second generation 3412 shown in Table 6.6. 3413
The population genetic theory of equilibrium between mutation and 3414 selection that underlies the use of the doubling dose method and the 3415 available mathematical formulations permit, in principle, the prediction of 3416 genetic risks at the new equilibrium (under conditions of continuous 3417 radiation in every generation). As stated earlier, in order not to 3418 underestimate genetic risks, ICRP Publication 60 (ICRP 1991) used the 3419 equilibrium estimates as a basis for calculating risk coefficients for genetic 3420 effects. The arguments against such a procedure, apart from reasons 3421 stated in the preceding paragraph, entails the very unrealistic and 3422 untestable assumptions that (a) the estimates of selection coefficients, 3423 mutation components and the other quantities used in the risk equation, 3424 will remain valid for tens or hundreds of human generations; (b) the 3425 population structure, demography and health care facilities will remain 3426 constant over hundreds of years. 3427
3428 In the view of the Task Group these assumptions can no longer be 3429 sustained and the Task Group recommends that for the practical purposes 3430 of radiological protection ICRP adopts a genetic risk estimate based upon 3431 risks up to the second generation. UNSCEAR (2001) have made the same 3432 judgement on this matter. 3433 3434 The concepts that (a) radiation-induced genetic changes are 3435 predominantly deletions, often encompassing more than one gene and 3436 that only a small proportion of such induced deletions is compatible with 3437 live births, and (b) radiation-induced heritable effects in humans are more 3438 likely to be manifest as multi-system developmental abnormalities in the 3439 progeny rather than as diseases due to mutations in single genes, are 3440 particularly relevant to this issue. Because reproductive fitness of the 3441 affected progeny will be reduced, many radiation induced genetic changes 3442 affecting development are expected to be strongly selected against. It is 3443 judged therefore that expressing genetic risks up to the second generation 3444 will not lead to any substantial underestimate of the heritable effects of 3445 radiation. 3446 3447 In addition, the Task Group notes that because of the different ways used 3448 to calculate the risk of autosomal dominant plus x-linked disease (the DD 3449 method) and congenital abnormalities (directly from mouse data), there 3450 must be a considerable element of ‘double counting’ of risk. Therefore, 3451 the summing of these risk categories as used conventionally by UNSCEAR 3452 and ICRP must represent a significant overestimate of genetic risk overall. 3453
101
7. Summary of Principal Conclusions and Proposals 3454 3455
Although additional work was required, many of the conclusions and 3456 proposals from the Task Group are based upon ICRP Committee 1 3457 judgements developed over the last 8-10 years. Accordingly many 3458 sections of the report are themselves summaries of these pre-existing 3459 judgements. For this reason a simple tabular format (Table 7.1) has been 3460 used to provide an overall summary of the principal conclusions and 3461 proposals from the Task Group. The inclusion in Table 7.1 of identifiers for 3462 the relevant sections and tables for each topic serves to map the 3463 document and guide readers to the topic of interest. These sections often 3464 detail methodologies, uncertainties and caveats not fully reflected in Table 3465 7.1. Accordingly Table 7.1 cannot be taken as being fully informative of 3466 Task Group views and judgements. 3467 3468 The Task Group also wish to emphasise an important issue discussed in 3469 ICRP Committee 2 Foundation Document (FD-C-2). The conclusions and 3470 proposals summarised in Table 7.1 are for the broad purposes of 3471 prospective planning in radiological protection. For other purposes many 3472 of the proposed judgements may well be insufficient and in these 3473 circumstances specific, well justified, judgements on radiation effects and 3474 their risks will need to be made. 3475
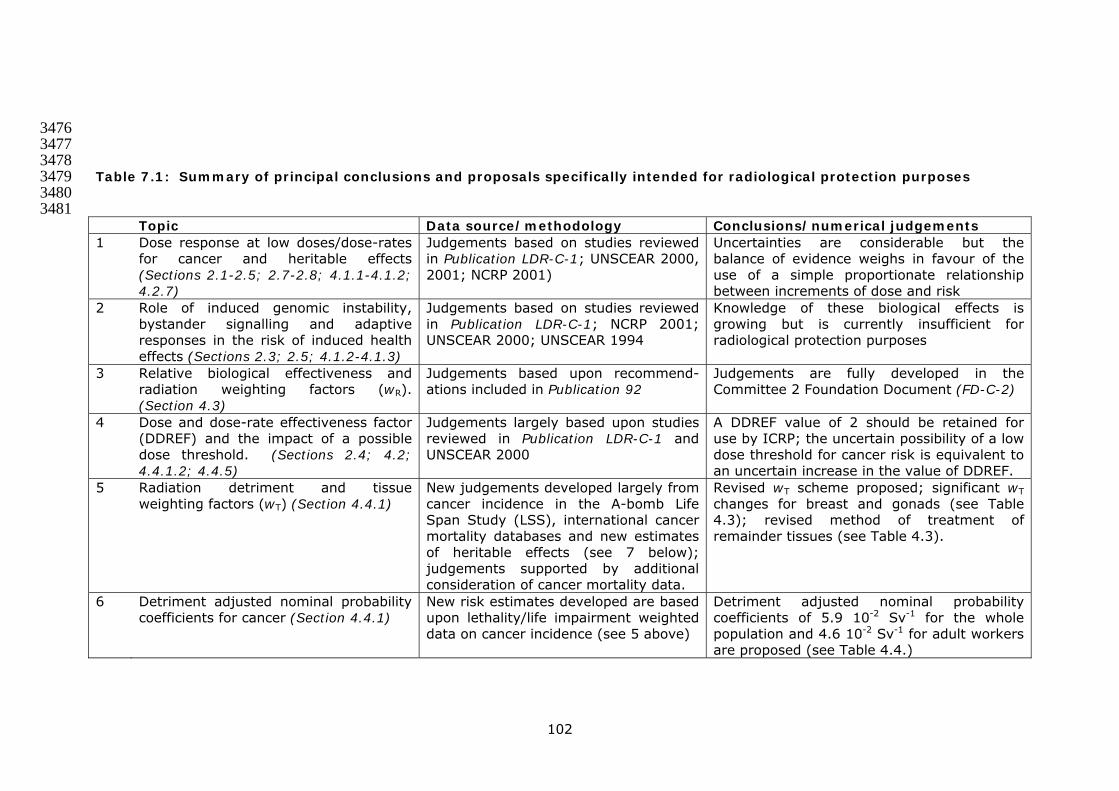
102
3476 3477 3478 Table 7.1: Summary of principal conclusions and proposals specifically intended for radiological protection purposes 3479
3480 3481
Topic Data source/methodology Conclusions/numerical judgements 1 Dose response at low doses/dose-rates
for cancer and heritable effects (Sections 2.1-2.5; 2.7-2.8; 4.1.1-4.1.2; 4.2.7)
Judgements based on studies reviewed in Publication LDR-C-1; UNSCEAR 2000, 2001; NCRP 2001)
Uncertainties are considerable but the balance of evidence weighs in favour of the use of a simple proportionate relationship between increments of dose and risk
2 Role of induced genomic instability, bystander signalling and adaptive responses in the risk of induced health effects (Sections 2.3; 2.5; 4.1.2-4.1.3)
Judgements based on studies reviewed in Publication LDR-C-1; NCRP 2001; UNSCEAR 2000; UNSCEAR 1994
Knowledge of these biological effects is growing but is currently insufficient for radiological protection purposes
3 Relative biological effectiveness and radiation weighting factors (wR). (Section 4.3)
Judgements based upon recommend-ations included in Publication 92
Judgements are fully developed in the Committee 2 Foundation Document (FD-C-2)
4 Dose and dose-rate effectiveness factor (DDREF) and the impact of a possible dose threshold. (Sections 2.4; 4.2; 4.4.1.2; 4.4.5)
Judgements largely based upon studies reviewed in Publication LDR-C-1 and UNSCEAR 2000
A DDREF value of 2 should be retained for use by ICRP; the uncertain possibility of a low dose threshold for cancer risk is equivalent to an uncertain increase in the value of DDREF.
5 Radiation detriment and tissue weighting factors (wT) (Section 4.4.1)
New judgements developed largely from cancer incidence in the A-bomb Life Span Study (LSS), international cancer mortality databases and new estimates of heritable effects (see 7 below); judgements supported by additional consideration of cancer mortality data.
Revised wT scheme proposed; significant wT changes for breast and gonads (see Table 4.3); revised method of treatment of remainder tissues (see Table 4.3).
6 Detriment adjusted nominal probability coefficients for cancer (Section 4.4.1)
New risk estimates developed are based upon lethality/life impairment weighted data on cancer incidence (see 5 above)
Detriment adjusted nominal probability coefficients of 5.9 10-2 Sv-1 for the whole population and 4.6 10-2 Sv-1 for adult workers are proposed (see Table 4.4.)

103
Topic Data source/methodology Conclusions/numerical judgements 7 Detriment adjusted nominal probability
coefficients for hereditary effects (Section 6)
New risks estimates are based upon UNSCEAR 2001 judgements using risks for all classes of hereditary effects up to the second post-irradiation generation (see Tables 6.4 and 6.6)
Second generation, detriment adjusted nominal risk coefficients of 0.2 10-2 Sv-1 for the whole population and 0.1 10-2 Sv-1 for adult workers are proposed (see Table 4.4). Publication 60 used population genetic risks at a theoretical equilibrium so the present estimates are markedly lower.
8 Cancer risk following in utero exposures (Section 4.4.3)
Judgements based upon the studies reviewed in Publication 90
Life-time cancer risk judged to be no greater than that following exposure in early childhood
9 Genetic susceptibility to radiation-induced cancer (Sections 2.7.3; 4.4.4)
Judgements based upon studies reviewed and analyses made in Publication 79 and UNSCEAR 2000, 2001
Strongly expressing cancer-predisposing disorders are too rare to appreciably distort risk estimates for the whole population; the impact of potentially common but weak genetic determinants remains uncertain
10 Radiation-induced tissue reactions in adults (Sections 2.6; 3)
Mechanisms have been re-evaluated and dose thresholds for morbidity/mortality revised on the basis of various data
Tables 3.1; 3.2 and 3.4 provide revised judgements but with few changes from other ICRP publications. The dose threshold for cataract is revised downwards. Dose limits for the lens of the eye remain unchanged but may require future attention.
11 In utero risks of tissue reactions, malformations and neurological effects (Section 3.2)
Judgements based upon studies reviewed in Publication 90
Strengthened judgement on the existence of a dose-threshold for tissue reactions, malformation and severe mental retardation - therefore, absence of risk at low doses. Greater uncertainty for IQ deficits but low dose risk judged to be insignificant
12 Risks of non-cancer diseases Judgements based upon LSS data and studies on post-radiotherapy outcomes particularly for cardiovascular disease
Great uncertainty on the form of the dose-response below 1 Sv – no specific judgement on low dose risk is possible.

104
8. References 3482 AFRRI Contract Report 94-1 (1994). Analysis of chronic radiation sickness cases 3483 in the population of the Southern Urals. AFRRI, Bethesda, Maryland, USA. 3484 AFRRI Contract Report 98-1 (1998). Chronic radiation sickness among Techa 3485 Riverside Residents. AFRRI, Bethesda, Maryland, USA. 3486 Akleyev AV and Kisselyov MF, Editors (2002). Medical-biological and ecological 3487 impacts of radioactive contamination of the Techa river. Fregat, Chelyabinsk. 3488 ISBN5-88931-026-7 3489 Akleyev A, Veremeyeva GA, Silkina LA and Vozilova AV (1999). Long-term 3490 hemopoiesis and immunity status after chronic radiation exposure of red bone 3491 marrow in humans. Central European Journal of Occupational and Environmental 3492 Medicine 5: 113-129. 3493 Brewer C, Holloway, S, Zawalnyski et al (1998). A chromosomal deletion map of 3494 human malformations. Am. J. Hum. Genet. 63, 1153-1159. 3495 Carter CO (1961). The inheritance of pyloric stenosis. Brit. Med. Bull. 17, 251-3496 254. 3497 Carter, CO (1977). Monogenic disorders. J. Med. Genet. 14, 316-320. 3498 Chakraborty R, Yasuda N, Denniston C, Sankaranarayanan K (1998). Ionizing 3499 radiation and genetic risks. VII. The concept of mutation component and its use 3500 in risk estimation for mendelian diseases. Mutat. Res. 400, 41-52. 3501 Cherubini R, Goodhead DT, Menzel HG and Ottolenghi A (eds) (2002). 3502 Proceedings of the 13th Symposium on Microdosimetry. Radiat. Prot. Dosim. 99 3503 Nos. 1-4. 3504 CERRIE (2004). Report of the Committee Examining Radiation Risks of Internal 3505 Emitters (CERRIE). CERRIE: London October 2004, www.cerrie.org ISBN 0-3506 85951-545-1. 3507 Cox R and Edwards AA (2002). Comments on the paper: Microsatellite instability 3508 in acute myelocylic leukaemia developed from A-bomb survivors and related 3509 cytogenetic data. Int. J. Radiat. Biol. 78: 443-445. 3510 Crow JF and Denniston C (1981). The mutation component of genetic damage. 3511 Science 212, 888-893. 3512 Crow JF and Denniston C (1985). Mutation in human populations. In: Harris, H., 3513 Hirschhorn, H., Eds, Adv. Hum. Genet, Vol 12, Plenum Press, N. Y., pp 59-123. 3514 Czeizel A and Sankaranarayanan K (1984). The load of genetic and partially 3515 genetic disorders in man. I. Congenital anomalies: estimates of detriment in 3516 terms of years lost and years of impaired life. Mutat. Res. 128, 73-103. 3517 Czeizel A, Sankaranarayanan K, Losonci A, et al (1988). The load of genetic and 3518 partially genetic disorders in man. II. Some selected common multifactorial 3519 diseases. Estimates of population prevalence and of detriment in terms of years 3520 lost and impaired life. Mutat. Res. 196, 259-292. 3521 Denniston C, Chakraborty R, Sankaranarayanan K (1998). Ionizing radiation and 3522 genetic risks. VIII. The concept of mutation component and its use in risk 3523 estimation for multifactorial diseases. Mutat. Res. 405, 7-79. 3524 Doerr W and Hendry JH (2001). Consequential late effects in normal tissues. 3525 Radiother Oncol. 61: 223-31. 3526 3527

105
Edwards AA and Lloyd DC (1996). Risk from deterministic effects of ionising 3528 radiation. Doc. NRPB Vol. 7 No.3. 3529 Ehling UH (1965). The frequency of X-ray-induced dominant mutations affecting 3530 the skeleton in mice. Genetics 51, 723-732. 3531 Ehling UH (1966). Dominant mutations affecting the skeleton in offspring of X-3532 irradiated male mice. Genetics 54, 1381-1389. 3533 Environmental Protection Agency (1999). Estimating Radiogenic Cancer Risks. 3534 EPA Report 402-R-00-003, Washington DC. 3535 Falconer DS (1960). Introduction to Quantitative Genetics, Oliver and Boyd, 3536 Edinburgh. 3537 Falconer DS (1965). The inheritance of liability to certain diseases, estimated 3538 from the incidence among relatives, Ann. Hum. Genet. (Lond) 29, 51-76. 3539 Favor J (1989). Risk estimation based on germ cell mutations in animals. 3540 Genome 31, 844-852. 3541 Goodhead DG, O’Neill P and Menzel HG (eds) (1997). Microdosimetry: An 3542 interdisciplinary approach. Proceedings of the 12th Symposium on 3543 Microdosimetry. Royal Society of Chemistry, Cambridge. 3544 Guskova AK,Gusev IA and Okladnikova ND (2001). Russian concepts of chronic 3545 radiation disease in man. Br. J. Radiol. Supplement 26, 19-23. 3546 Hall P, Granath F, Lundell M, Olsson K and Holm L-E (1999). Lenticular opacities 3547 in individuals exposed to ionising radiation in infancy. Radiat. Res. 152: 190-195. 3548 Hendry JH (1994). Biological response modifiers and normal tissue injury after 3549 irradiation. Seminars in Radiation Oncology 4: 123-132. 3550 Hendry JH and Thames HD (1987). Fractionation in Radiotherapy. Taylor and 3551 Francis, London. 3552 IARC (2000). IARC monographs on the evaluation of carcinogenic risks to 3553 humans: Volume 75. Ionizing radiation, Part I, X- and gamma- radiation and 3554 neutrons. IARC Press, Lyon. 3555 IARC (2001). IARC monographs on the evaluation of carcinogenic risks to 3556 humans: Volume 78. Ionizing radiation, Part 2: some internally deposited 3557 radionuclides. IARC Press, Lyon. 3558 ICRP Publication 41 (1984). Non-stochastic effects of irradiation. Annals of the 3559 ICRP Vol 14, Number 3, 1984. 3560 ICRP Publication 59 (1992). The biological basis for dose limitation in the skin. 3561 Annals of the ICRP Vol 22, Number 2, 1992. 3562 ICRP Publication 60 (1991). 1990 Recommendations of the International 3563 Commission on Radiological Protection, Annals of the ICRP 21 (1-3). 3564 ICRP Publication 66 (1994). Human Respiratory Tract Model for Radiological 3565 Protection. Annals of the ICRP 24 (4). 3566 ICRP Publication 79 (1998). Genetic susceptibility to cancer. Annals of the ICRP, 3567 28(1-2). 3568 ICRP Publication 83 (1999). Risk estimation for multifactorial diseases. Annals of 3569 the ICRP, 29 (3-4). 3570 ICRP Publication 90 (2003). Biological effects after prenatal irradiation (Embryo 3571 and Fetus). Annals of the ICRP, 33(1-2). 3572 ICRP Publication 92 (2003). Relative biological effectiveness (RBE), quality factor 3573 (Q) and radiation weighting factor (wR). Annals of the ICRP 33(4). 3574

106
ICRP Publication PPRA-MC. Protecting people against radiation exposure in the 3575 aftermath of a radiological attack. Awaiting publication in Annals of the ICRP 3576 following website consultation. 3577 ICRP Publication LDR-C-1. Low dose extrapolation of radiation-related cancer 3578 risk. Awaiting publication in Annals of the ICRP following website consultation. 3579 ICRP Publication FD-C-2. Basis for dosimetric quantities used in radiological 3580 protection. Website consultation document accompanying this report. 3581 Izumi S, Suyama A and Koyama K (2003). Radiation-related mortality among 3582 offspring of atomic bomb survivors after a half-century of follow-up. Int. J. 3583 Cancer 107: 291-297. 3584 Izumi S, Koyama K, Soda M and Suyama A (2003). Cancer incidence in children 3585 and young adults did not increase relative to parental exposure to atomic bombs. 3586 Br. J. Cancer 89: 1709-1713, 3587 Joiner MC, Marples B, Lambin P, Short SC and Turesson I (2001). Low-dose 3588 hypersensitivity: current status and possible mechanisms. Int J Radiat Oncol Biol 3589 Phys. 49:379-89. 3590 Jung H, Beck-Bornholdt HP, Svoboda V, Alberti W and Herrmann T (2001). 3591 Quantification of late complications after radiation therapy. Radiother Oncol. 3592 61:233-46. 3593 Kirk KM and Lyon MF (1984). Induction of congenital abnormalities in the 3594 offspring of male mice treated with x-rays at pre-meiotic and post-meiotic stages. 3595 Mutat. Res. 125, 75-85. 3596 Land CE, Hayakawa N, Machado SG, Yamada Y, Pike MC, Akiba S and Tokunaga 3597 M (1994). A case-control interview study of breast cancer among Japanese A-3598 bomb survivors. II. Interactions with radiation dose. Cancer Causes Control 5: 3599 167-76. 3600 Land CE and Sinclair WK (1991). The relative contributions of different organ 3601 sites to the total cancer mortality associated with low-dose radiation exposure. 3602 Ann ICRP 22: 31-57. 3603 Lefaix JL, Delanian S, Leplat JJ, Tricaud Y, Martin M, Nimrod A, Baillet F, Daburon 3604 F. Successful treatment of radiation-induced fibrosis using Cu/Zn-SOD and Mn-3605 SOD: an experimental study. Int J Radiat Oncol Biol Phys. 1996; 35: 305-12. 3606 Little JB (2003). Genomic instability and bystander effects: a historical 3607 perspective. Oncogene 22: 6978-6987. 3608 Lohrer HD, Braselmann H, Richter HE, Jackl G, Herbeck J, Hieber L, Kellerer AM 3609 and Bauchinger M (2001). Instability of microsatellites in radiation-associated 3610 thyroid tumours with short latency periods. Int. J. Radiat. Biol 77:891-899. 3611 Lubin JH, Boice JD Jr, Edling C, Hornung RW, Howe GR, Kunz E, et al (1995). 3612 Lung cancer in radon-exposed miners and estimation of risk from indoor 3613 exposure. J Natl Cancer Inst 87: 817-827. 3614 Lyon MF, Renshaw R (1988). Induction of congenital malformation in mice by 3615 parental irradiation: transmission to later generations. Mutat. Res. 198: 277-283. 3616 Michalowski A (1981). Effects of radiation on normal tissues: hypothetical 3617 mechanisms and limitations of in situ assays of clonogenicity. Radiat Environ 3618 Biophys. 19:157-72. 3619 Minamoto A, Taniguchi H and Yoshitani N et al (2004). Cataracts in atomic bomb 3620 survivors. Int. J. Radiat. Biol. 80:339-345. 3621

107
Mitchel RE, Jackson JS, McCann RA and Boreham DR (1999). The adaptive 3622 response modifies latency for radiation-induced myeloid leukaemia in CBA/H 3623 mice. Radiat. Res. 152: 273-279. 3624 Mitchel RE, Jackson JS, Morrison DP and Carlisle SM (2003). Low doses of 3625 radiation increase the latency of spontaneous lymphomas and spinal 3626 osteosarcomas in cancer-prone, radiation-sensitive Trp53 heterozygous mice. 3627 Radiat. Res. 159: 320-327. 3628 Morgan WF (2003). No-targeted and delayed effects of exposure to ionizing 3629 radiation: I Radiation induced genomic instability and bystander effects in vitro. 3630 Radiat. Res. 159: 567-580. 3631 Mothersill C and Seymour C (2001). Radiation-induced bystander effects: Past 3632 history and future directions. Radiat. Res. 155: 759-767. 3633 Nakanishi M, Tanaka K, Takahashi T, Kyo T, Dohy H, Fujiwara M and Kamada N 3634 (2001). Microsatellite instability in acute myelocytic leukaemia developed from A-3635 bomb survivors. Int. J. Radiat. Biol 77: 687-694 and Comments (2002), Int. J. 3636 Radiat. Biol. 78: 441-445. 3637 NCI/CDC (2003). Report of the NCI-CDC Working Group to revise the 1985 NIH 3638 Radioepidemiological Tables. US Department of Health and Human Services, 3639 National Institutes of Health, National Cancer Institute, Bethesda, Maryland, NIH 3640 Publication No. 03-5387. 3641 NCRP (1974). Radiological factors affecting decision-making in a nuclear attack. 3642 Report No. 42. National Council on Radiation Protection and Measurements, 3643 Bethesda, MD. 3644 NCRP (1989). Radiation protection for medical and allied health personnel. 3645 Report No. 105. National Council on Radiation Protection and Measurements, 3646 Bethesda, MD. 3647 NCRP (1997). National Council on Radiation Protection and Measurements. 3648 Uncertainties in Fatal Cancer Risk Estimates Used in Radiation Protection. NCRP 3649 Report No. 126. National Council on Radiation Protection and Measurements, 3650 Bethesda, MD. 3651 NCRP (2001). National Council on Radiation Protection and Measurements. 3652 Evaluation of the Linear-Non-threshold Dose-Response Model for Ionizing 3653 Radiation. NCRP Report No. 36. National Council on Radiation Protection and 3654 Measurements, Bethesda MD. 3655 Nomura T (1982). Parental exposure to X-rays and chemicals induces heritable 3656 tumors and anomalies in mice. Nature 296, 575-577. 3657 Nomura T (1988). X-ray and chemically-induced germ line mutations causing 3658 phenotypic anomalies in mice. Mutat. Res. 198, 309-320. 3659 Nomura T (1994). Male-mediated teratogenesis: ionizing radiation and 3660 ethylnitrosourea studies. In: Male-mediated Developmental Toxicity (Mattison, D. 3661 R., Olshan, A. F., Eds), Plenum Press, New York, pp 117-127. 3662 NRC (1972). National Academy of Sciences-National Research Council, The BEIR 3663 Report, National Academy Press, Washington, D.C. 3664 NRC (1990). National Academy of Sciences-National Research Council, The BEIR 3665 V Report, National Academy Press, Washington, D. C. 3666 NUREG (1994). Probabilistic accident consequence uncertainty analysis – Early 3667 health effects uncertainty assessment. CR-6545/ EUR 16775. US Nuclear 3668 Regulatory Commission, Washington DC, USA, and Commission of the European 3669 Communities, Brussels, Belgium. 3670

108
Okunieff P, Mester M, Wang J, Maddox T, Gong X, Tang D, Coffee M, Ding I. In 3671 vivo radioprotective effects of angiogenic growth factors on the small bowel of 3672 C3H mice. Radiat Res. 1998; 150: 204-11. 3673 Otake M and Schull WJ (1990). Radiation-related posterior lenticular opacities in 3674 Hiroshima and Nagasaki atomic bomb survivors based on the DS86 dosimetry 3675 system. Radiat. Res. 121: 3-31. 3676 Parkin DM, Whelan SL, Ferlay J, Teppo L and Thomas DB (eds) (2003). Cancer 3677 Incidence in Five Continents Vol VIII. IARC Scientific Publications No. 155. Lyon 3678 International Agency for Research on Cancer. 3679 Pierce DA, Sharp GB and Mabuchi K (2003). Joint effects of radiation and 3680 smoking on lung cancer risk among atomic bomb survivors. Radiat. Res. 159: 3681 511-520. 3682 Pierce DA, Stram DO and Vaeth M (1990). Allowing for random errors in 3683 radiation dose estimates for the atomic bomb survivor data. Radiat. Res. 123: 3684 275-284. 3685 Preston DL, Kusumi S, Tomonaga M, Izumi S, Ron E, Kuramoto A et al (1994). 3686 Cancer incidence in atomic bomb survivors. Part III. Leukaemia, lymphoma and 3687 multiple myeloma, 1950-1987. Radiat. Res. 137:S68-97. 3688 Preston DL, Mattsson A, Holmberg E, Shore R, Hildreth NG and Boice JD (2002). 3689 Radiation effects on breast cancer risk: a pooled analysis of eight cohorts. 3690 Radiat. Res. 158: 220-235. 3691 Preston DL, Pierce DA, Shimizu Y, Cullings HM, Fujita S, Funamoto S and Kodama 3692 K (2004). Effect of recent changes in atomic bomb survivor dosimetry on cancer 3693 mortality risk estimates. Radiat. Res. 162: 377-389. 3694 Ron E, Lubin JH, Shore RE, Mabuchi K, Modan B, Pottern LM et al (1995). Thyroid 3695 cancer after exposure to external radiation: a pooled analysis of seven studies. 3696 Radiat. Res. 141: 259-277. 3697 Rubin P, Finklestein JN and Williams JP (1998). Paradigm shifts in the radiation 3698 pathophysiology of late effects in normal tissues: molecular vs classical concepts. 3699 In: Current Radiation Oncology Vol 3. Editors: JS Tobias and PRM Thomas. 3700 Arnold, London. 3701 Sankaranarayanan K (1991). Genetic effects of ionising radiation in man. Annals 3702 of the ICRP 22, 76-94. 3703 Sankaranarayanan K (1998). Ionizing radiation and genetic risks. IX. Estimates 3704 of the frequencies of mendelian diseases and spontaneous mutation rates in 3705 human populations: a 1998 perspective. Mutat. Res. 411, 129-178. 3706 Sankaranarayanan K (1999). Ionizing radiation and genetic risks. X. The 3707 potential ‘disease phenotypes’ of radiation-induced genetic damage in humans: 3708 perspectives from human molecular biology and radiation genetics. Mutat. Res. 3709 429, 45-83. 3710 Sankaranarayanan K and Chakraborty R (2000a). Ionizing radiation and genetic 3711 risks. XI. The doubling dose estimates from the mid-1950s to the present and the 3712 conceptual change to the use of human data on spontaneous mutation rates and 3713 mouse data on induced mutation rates for doubling dose calculations. Mutat. Res. 3714 453, 107-127. 3715 Sankaranarayanan K and Chakraborty R (2000b). Ionizing radiation and genetic 3716 risks. XII. The concept of ‘potential recoverability correction factor’ (PRCF) and its 3717 use for predicting the risk of radiation-inducible genetic disease in human live 3718 births. Mutat. Res. 453, 129-181. 3719

109
Sankaranarayanan K and Chakraborty R (2000c). Ionizing radiation and genetic 3720 risks. XIII. Summary and synthesis of papers VI to XII and estimates of genetic 3721 risks in the year 2000. Mutat. Res. 453, 183-197. 3722 Sankaranarayanan K, Yasuda N, Chakraborty R, et al (1994). Ionizing radiation 3723 and genetic risks. V. Multifactorial diseases: a review of epidemiological and 3724 genetic aspects of congenital abnormalities in man and of models on maintenance 3725 of quantitative traits in populations. Mutat. Res. 317, 1-23. 3726 Sankaranarayanan K, Chakraborty R, Boerwinkle EA (1999). Ionizing radiation 3727 and genetic risks. VI. Chronic multifactorial diseases: a review of epidemiological 3728 and genetic aspects of coronary heart disease, essential hypertension and 3729 diabetes mellitus. Mutat. Res. 436, 21-57. 3730 Scott BR and Hahn FF (1989). Early occurring and continuing effects models for 3731 nuclear power plant accident consequence analysis. Low LET radiation. 3732 Washington DC, Nuclear Regulatory Commission, NUREG/CR-4214 (SAND85-3733 7185) Rev. 1, Part II. 3734 Scott BR (1993). Early occurring and continuing effects. IN Modification of 3735 models resulting from addition of effects of exposure to alpha-emitting nuclides, 3736 Washington DC, Nuclear Regulatory Commission, NUREG/CR-4214, Rev 1, Part II, 3737 Addendum 2 (LMF-136). 3738 Selby PB (1998). Discovery of numerous clusters of spontaneous mutations in the 3739 specific locus test in mice necessitates major increases in estimates of doubling 3740 doses. Genetica 102/103, 463-487. 3741 Selby PB and Selby PR (1977). Gamma-ray-induced dominant mutations that 3742 cause skeletal abnormalities in mice. I. Plan, summary of results and discussion. 3743 Mutat. Res. 43, 357-375. 3744 Sharp GB, Mizuno T, Cologne JB, Fukuhara T, Fujiwara S, Tokuoka S et al (2003). 3745 Hepatocellular carcinoma among atomic bomb survivors: significant interaction of 3746 radiation with hepatitis C virus infections. Int. J. Cancer 103: 531-537. 3747 Tawn EJ, Whitehouse CA and Tarone RE (2004). FISH Chromosome analysis of 3748 retired radiation workers from the Sellafield nuclear facility. Radiat. Res. 162 3749 249-256. 3750 Thompson DE, Mabuchi K, Ron E, Soda M, Tokunaga M, Ochikubo S et al (1994). 3751 Cancer Incidence in atomic bomb survivors. Part II: Solid tumours, 1958-1987. 3752 Radiat. Res. 137:S17-67. 3753 Travis LB, Gospodarowicz M, Curtis RE, Clarke EA, Andersson M, Glimelius B, et al 3754 (2002). Lung cancer following chemotherapy and radiotherapy for Hodgkin's 3755 disease. J Natl Cancer Inst 94: 182-192. 3756 Tucker JD; Tawn EJ, Holdsworth D, Morris S, Langlois R, Ramsey MJ, Kato P, 3757 Boice JD, Tarone RE and Jensen RH (1997). Biological dosimetry of radiation 3758 workers at the Sellafield nuclear facility. Radiat. Res. 148 216-226. 3759 UNSCEAR (1977). United Nations Scientific Committee on the Effects of Atomic 3760 Radiation. Sources and Effects of Ionizing Radiation. 1977 Report to the General 3761 Assembly with Annexes, United Nations, New York. 3762 UNSCEAR (1988). United Nations Scientific Committee on the Effects of Atomic 3763 Radiation. Sources, Effects and Risks of Ionizing Radiation. 1988 Report to the 3764 General Assembly with Annexes, United Nations, New York. 3765

110
UNSCEAR (1993). United Nations Scientific Committee on the Effects of Atomic 3766 Radiation. Sources and Effects of Ionizing Radiation. UNSCEAR 1993 Report to 3767 the General Assembly with Scientific Annexes, United Nations, New York. 3768 UNSCEAR (1994). United Nations Scientific Committee on the Effects of Atomic 3769 Radiation. Sources and Effects of Ionizing Radiation. UNSCEAR 1994 Report to 3770 the General Assembly with Scientific Annexes, United Nations, New York. 3771
UNSCEAR (2000). United Nations Scientific Committee on the Effects of Atomic 3772 Radiation. Sources and Effects of Ionizing Radiation. Vol. II Effects. UNSCEAR 3773 2000 Report to the General Assembly with Scientific Annexes, United Nations, 3774 New York. 3775 UNSCEAR (2001). United Nations Scientific Committee on the Effects of Atomic 3776 Radiation. Hereditary Effects of Radiation., UNSCEAR 2001 Report to the 3777 General Assembly with Scientific Annex, United Nations, New York. 3778 Van der Kogel AJ. Radiation response and tolerance of normal tissues. In: Basic 3779 Clinical Radiobiology. Editor: GG Steel. Arnold, London. 2002. 3780 Wang J, Albertson CM, Zheng H, Fink LM, Herbert JM, Hauer-Jensen M. Short-3781 term inhibition of ADP-induced platelet aggregation by clopidogrel ameliorates 3782 radiation-induced toxicity in rat small intestine. Thromb Haemost. 2002; 87: 122-3783 8. 3784 Wheldon TE, Michalowski AS and Kirk J (1982). The effect of irradiation on 3785 function in self-renewing normal tissues with differing proliferative organisation. 3786 Br J Radiol. 55:759-66. 3787 Withers HR, Taylor JM and Maciejewski B (1988). Treatment volume and tissue 3788 tolerance. Int J Radiat Oncol Biol Phys. 14:751-759. 3789