biology in focus - chapter 20
TRANSCRIPT
CAMPBELL BIOLOGY IN FOCUS
© 2014 Pearson Education, Inc.
Urry • Cain • Wasserman • Minorsky • Jackson • Reece
Lecture Presentations by Kathleen Fitzpatrick and Nicole Tunbridge
20Phylogeny
© 2014 Pearson Education, Inc.
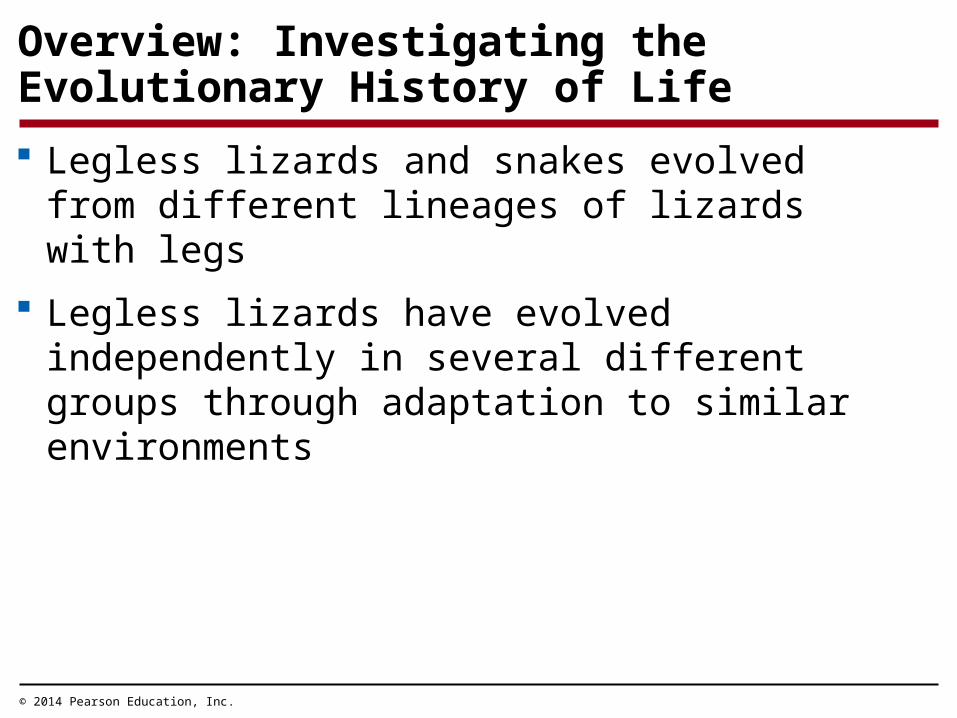
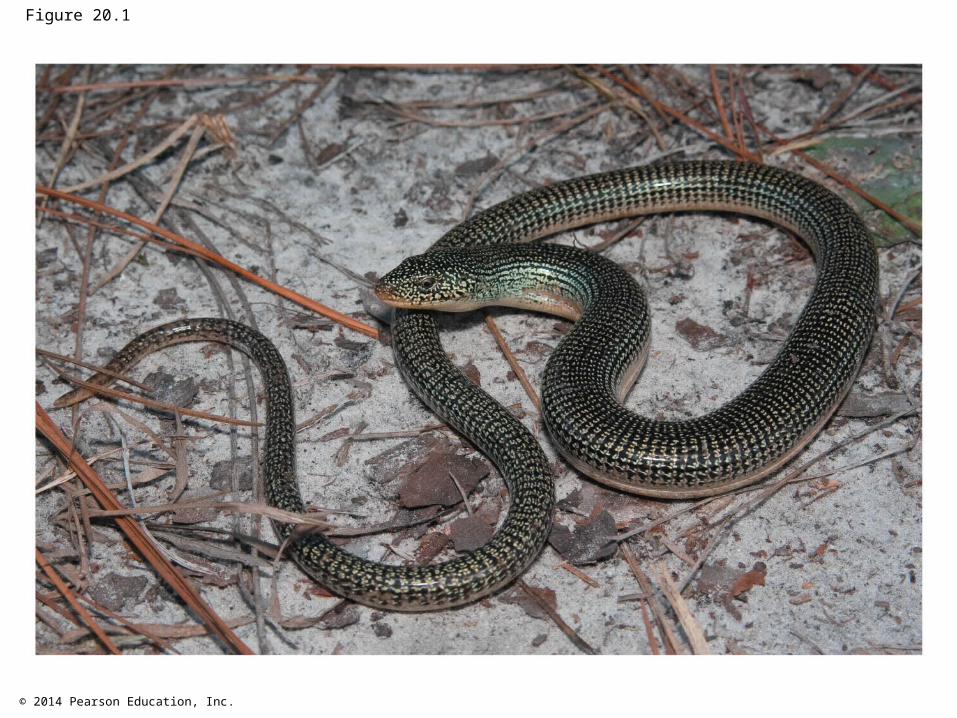
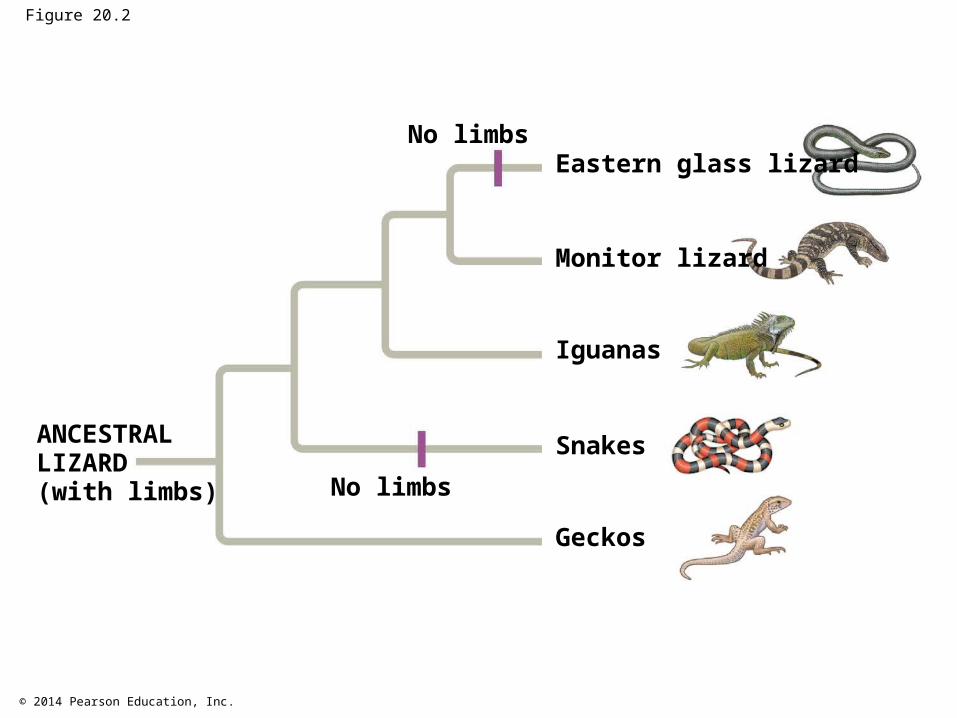
Overview: Investigating the Evolutionary History of Life Legless lizards and snakes evolved from different
lineages of lizards with legs Legless lizards have evolved independently in
several different groups through adaptation to similar environments
© 2014 Pearson Education, Inc.
Figure 20.1
© 2014 Pearson Education, Inc.
Figure 20.2
ANCESTRALLIZARD(with limbs)
Eastern glass lizard
Monitor lizard
Snakes
Geckos
No limbs
Iguanas
No limbs
© 2014 Pearson Education, Inc.
Phylogeny is the evolutionary history of a species or group of related species
The discipline of systematics classifies organisms and determines their evolutionary relationships
© 2014 Pearson Education, Inc.
Concept 20.1: Phylogenies show evolutionary relationships
Taxonomy is the ordered division and naming of organisms
© 2014 Pearson Education, Inc.
Binomial Nomenclature
In the 18th century, Carolus Linnaeus published a system of taxonomy based on resemblances
Two key features of his system remain useful today: two-part names for species and hierarchical classification
© 2014 Pearson Education, Inc.
The two-part scientific name of a species is called a binomial
The first part of the name is the genus The second part, called the specific epithet, is
unique for each species within the genus The first letter of the genus is capitalized, and the
entire species name is italicized Both parts together name the species (not the
specific epithet alone)
© 2014 Pearson Education, Inc.
Hierarchical Classification
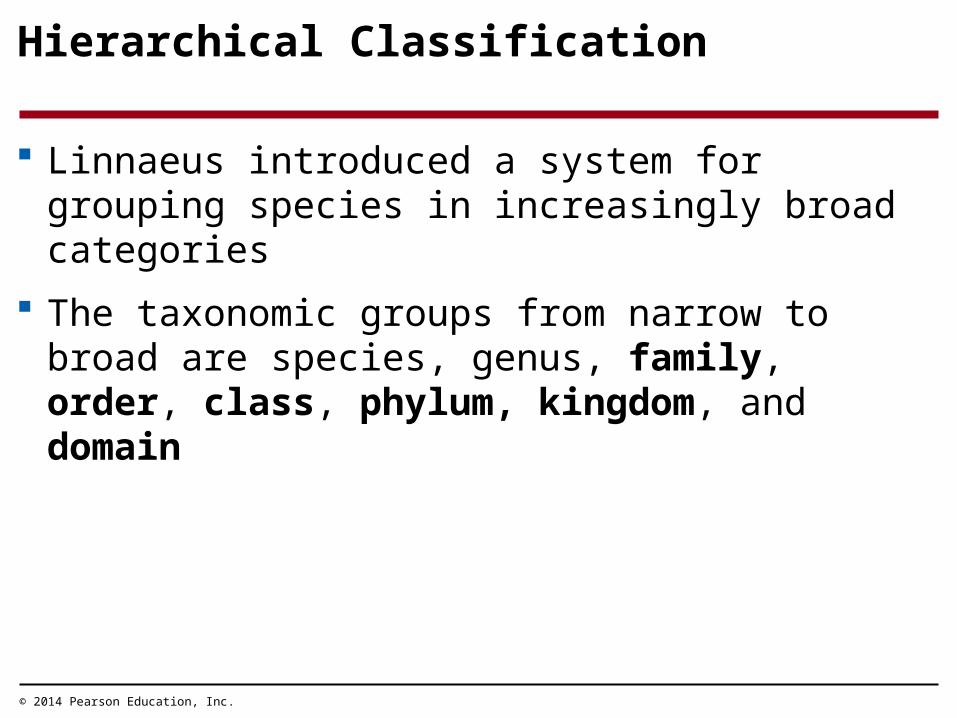
Linnaeus introduced a system for grouping species in increasingly broad categories
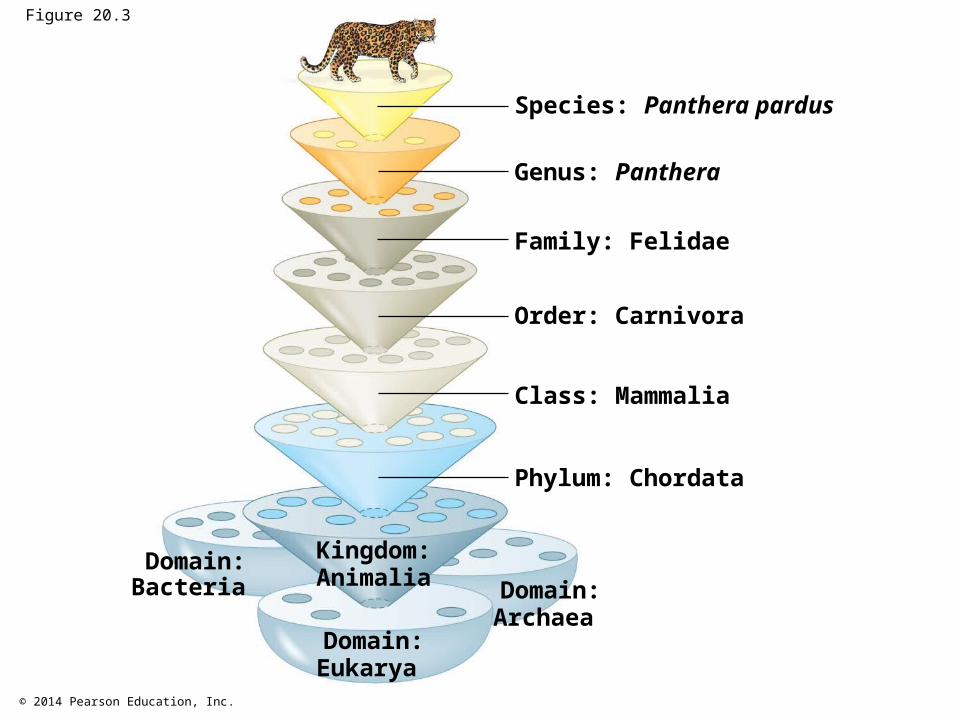
The taxonomic groups from narrow to broad are species, genus, family, order, class, phylum, kingdom, and domain
© 2014 Pearson Education, Inc.
Figure 20.3
Species: Panthera pardus
Kingdom: Animalia Domain:
Archaea
Domain:Bacteria
Domain:Eukarya
Genus: Panthera
Order: Carnivora
Family: Felidae
Class: Mammalia
Phylum: Chordata
© 2014 Pearson Education, Inc.
A taxonomic unit at any level of hierarchy is called a taxon
The broader taxa are not comparable between lineages For example, an order of snails has less genetic
diversity than an order of mammals
© 2014 Pearson Education, Inc.
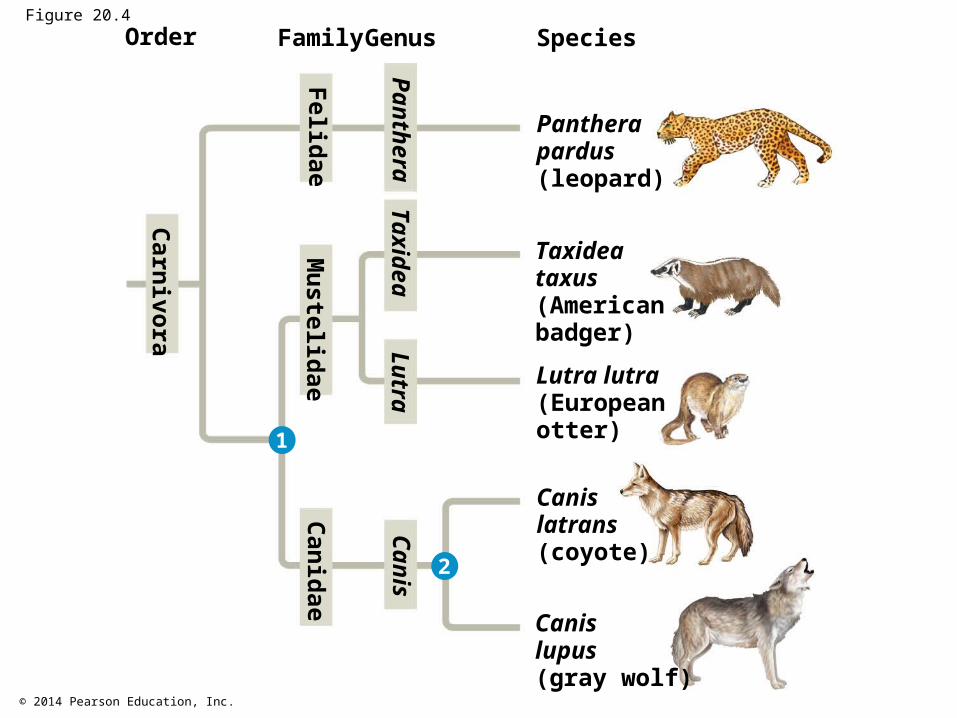
Linking Classification and Phylogeny
Systematists depict evolutionary relationships in branching phylogenetic trees
© 2014 Pearson Education, Inc.
Figure 20.4
Pantherapardus(leopard)
SpeciesOrder Family Genus
Taxideataxus(Americanbadger)
Canislatrans(coyote)
Lutra lutra(Europeanotter)
Canislupus(gray wolf)
PantheraTaxidea
Canis
Lutra
FelidaeM
ustelidae
Carnivora
Canidae
1
2
© 2014 Pearson Education, Inc.
Linnaean classification and phylogeny can differ from each other
Systematists have proposed that classification be based entirely on evolutionary relationships
© 2014 Pearson Education, Inc.
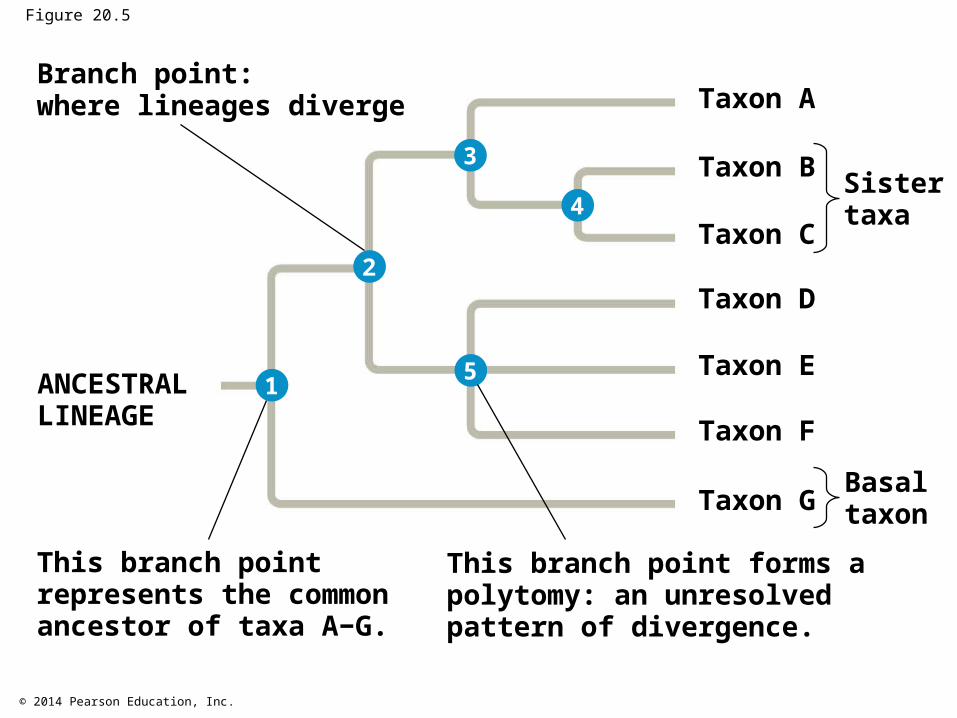
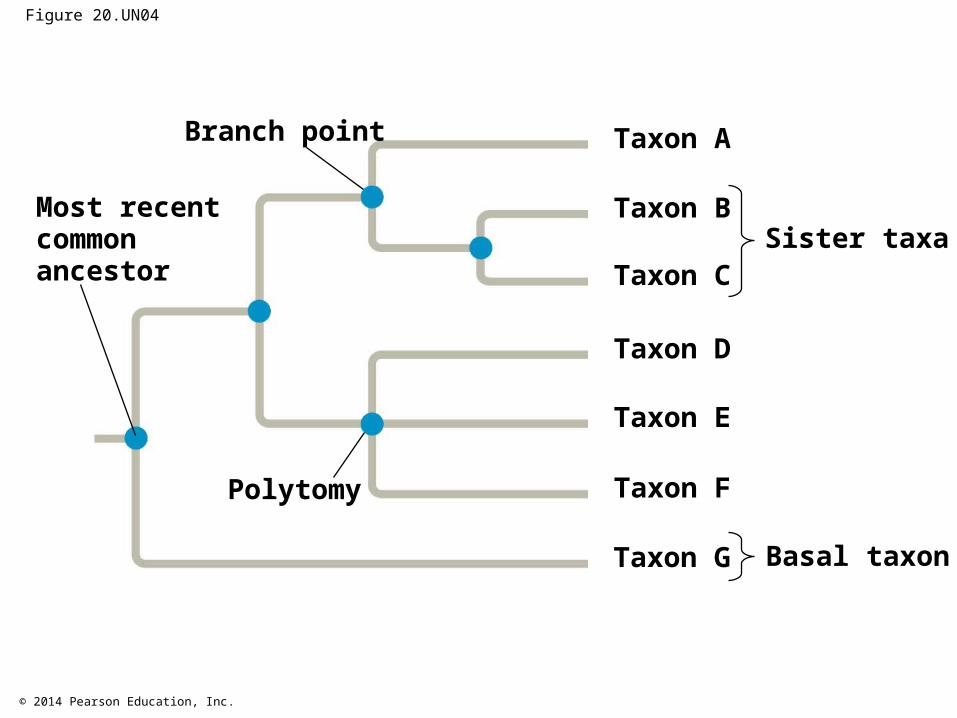
A phylogenetic tree represents a hypothesis about evolutionary relationships
Each branch point represents the divergence of two taxa from a common ancestor
Sister taxa are groups that share an immediate common ancestor
© 2014 Pearson Education, Inc.
A rooted tree includes a branch to represent the most recent common ancestor of all taxa in the tree
A basal taxon diverges early in the history of a group and originates near the common ancestor of the group
A polytomy is a branch from which more than two groups emerge
© 2014 Pearson Education, Inc.
Figure 20.5
1
2
3
4
5
Branch point:where lineages diverge
This branch pointrepresents the commonancestor of taxa A−G.
This branch point forms apolytomy: an unresolvedpattern of divergence.
ANCESTRALLINEAGE
Sistertaxa
Basaltaxon
Taxon A
Taxon B
Taxon C
Taxon D
Taxon E
Taxon F
Taxon G
© 2014 Pearson Education, Inc.
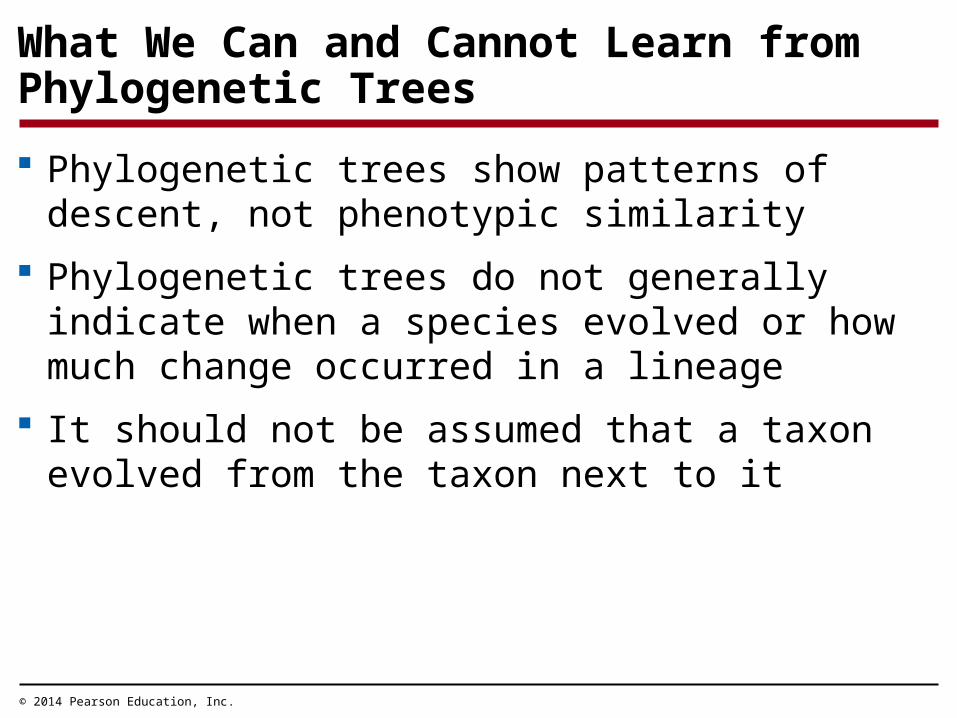
What We Can and Cannot Learn from Phylogenetic Trees
Phylogenetic trees show patterns of descent, not phenotypic similarity
Phylogenetic trees do not generally indicate when a species evolved or how much change occurred in a lineage
It should not be assumed that a taxon evolved from the taxon next to it
© 2014 Pearson Education, Inc.
Applying Phylogenies
Phylogeny provides important information about similar characteristics in closely related species
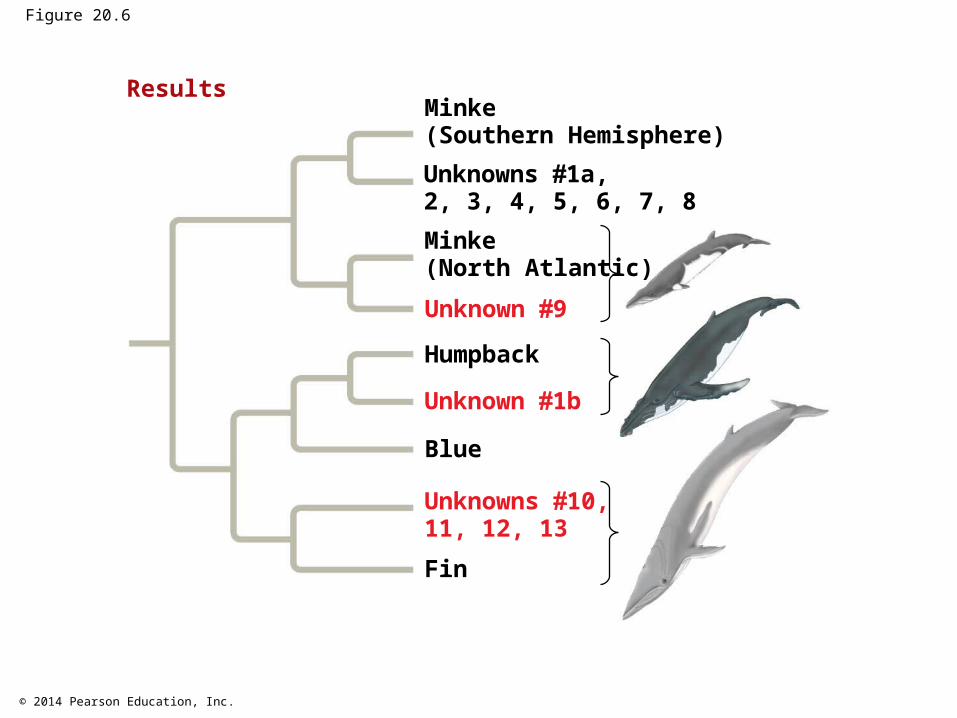
Phylogenetic trees based on DNA sequences can be used to infer species identities For example: A phylogeny was used to identify the
species of whale from which “whale meat” originated
© 2014 Pearson Education, Inc.
Figure 20.6
Minke(Southern Hemisphere)
Unknowns 10,11, 12, 13
Unknown 1b
Unknown 9
Minke(North Atlantic)
Unknowns 1a,2, 3, 4, 5, 6, 7, 8
Humpback
Blue
Fin
Results
© 2014 Pearson Education, Inc.
Concept 20.2: Phylogenies are inferred from morphological and molecular data
To infer phylogeny, systematists gather information about morphologies, genes, and biochemistry of living organisms
The similarities used to infer phylogenies must result from shared ancestry
© 2014 Pearson Education, Inc.
Morphological and Molecular Homologies
Phenotypic and genetic similarities due to shared ancestry are called homologies
Organisms with similar morphologies or DNA sequences are likely to be more closely related than organisms with different structures or sequences
© 2014 Pearson Education, Inc.
Sorting Homology from Analogy
When constructing a phylogeny, systematists need to distinguish whether a similarity is the result of homology or analogy
Homology is similarity due to shared ancestry Analogy is similarity due to convergent evolution
© 2014 Pearson Education, Inc.
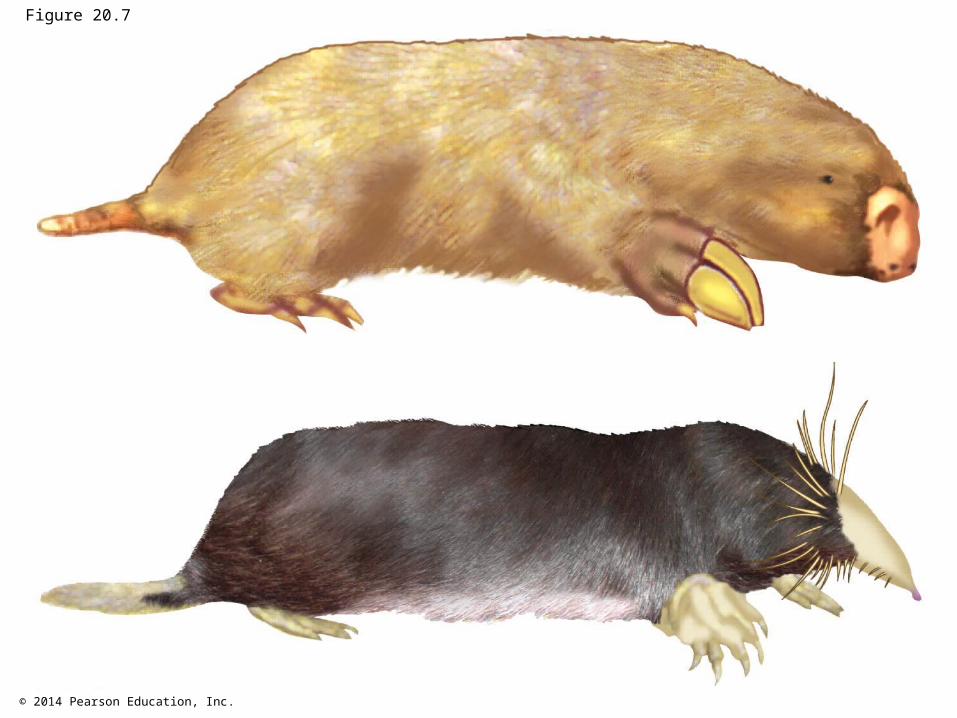
Convergent evolution occurs when similar environmental pressures and natural selection produce similar (analogous) adaptations in organisms from different evolutionary lineages
© 2014 Pearson Education, Inc.
Figure 20.7
© 2014 Pearson Education, Inc.
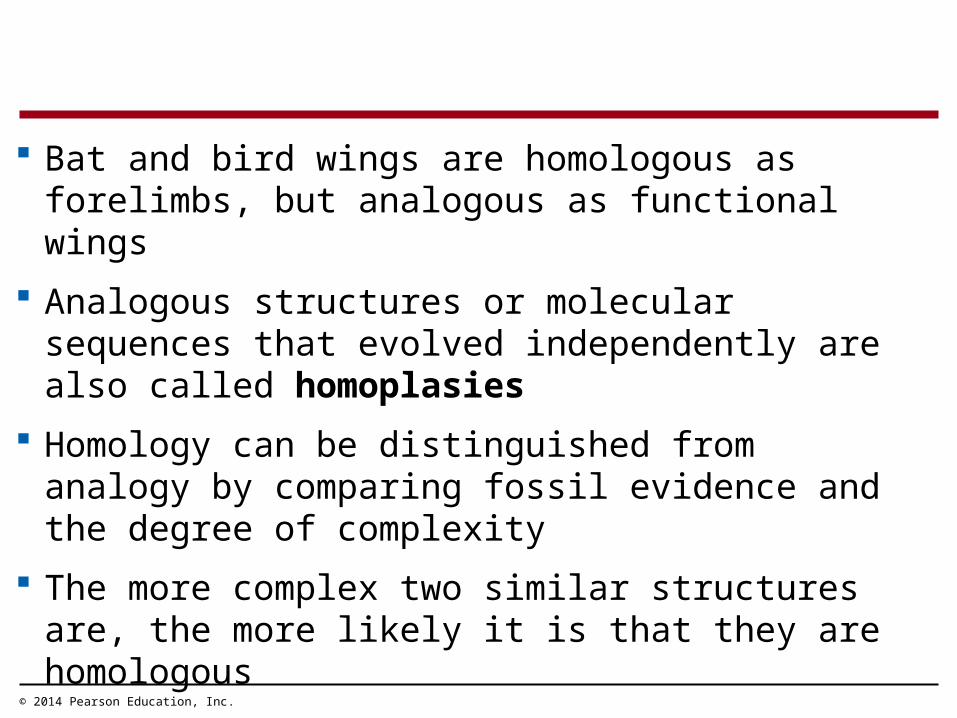
Bat and bird wings are homologous as forelimbs, but analogous as functional wings
Analogous structures or molecular sequences that evolved independently are also called homoplasies
Homology can be distinguished from analogy by comparing fossil evidence and the degree of complexity
The more complex two similar structures are, the more likely it is that they are homologous
© 2014 Pearson Education, Inc.
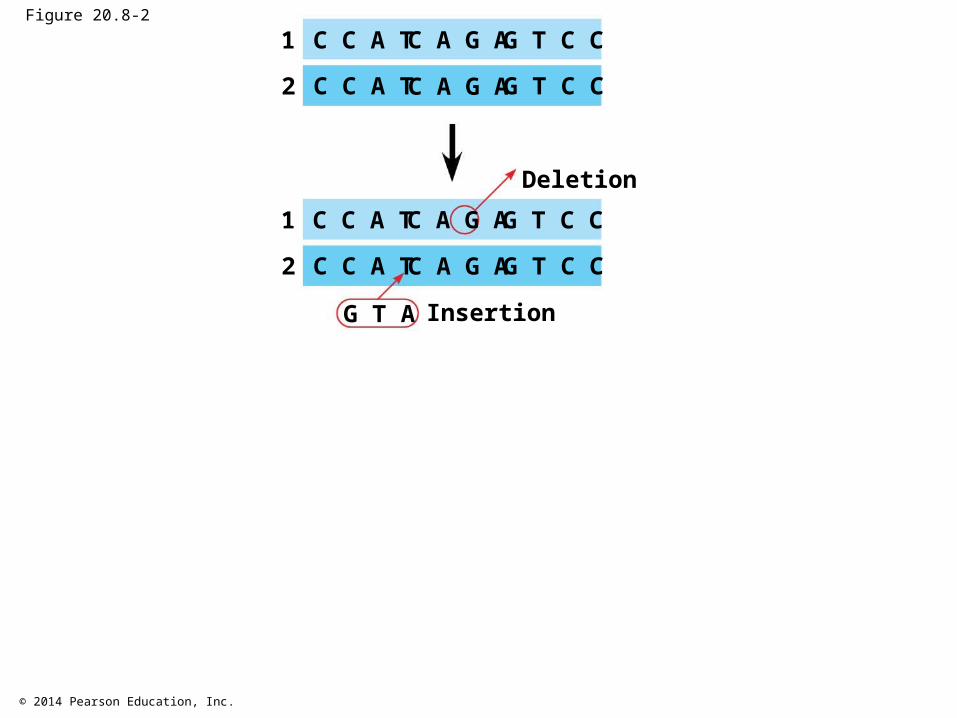
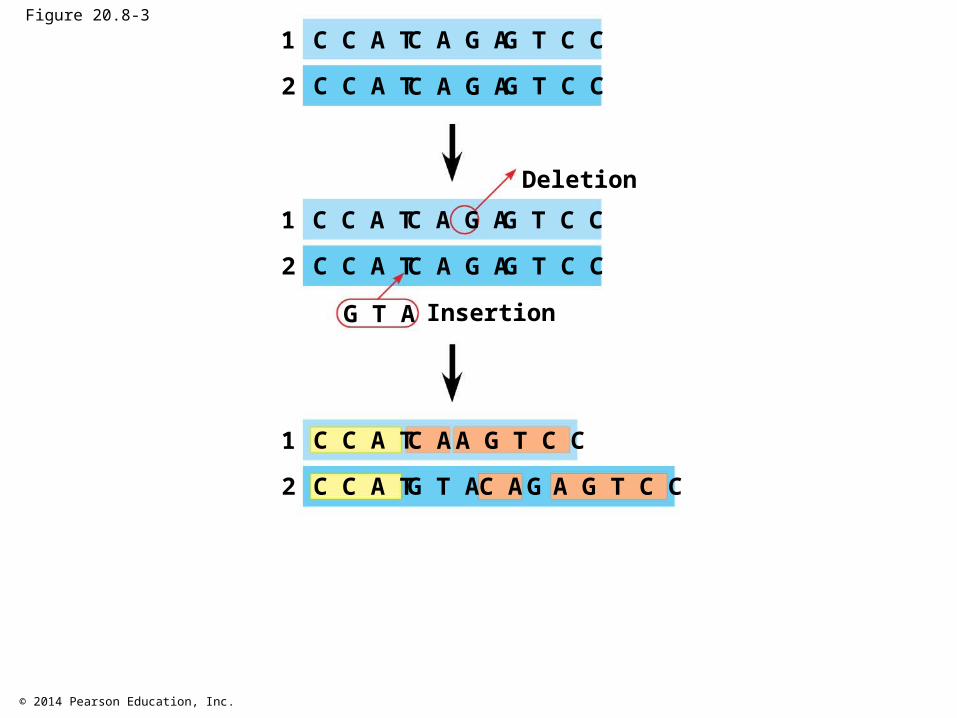
Evaluating Molecular Homologies
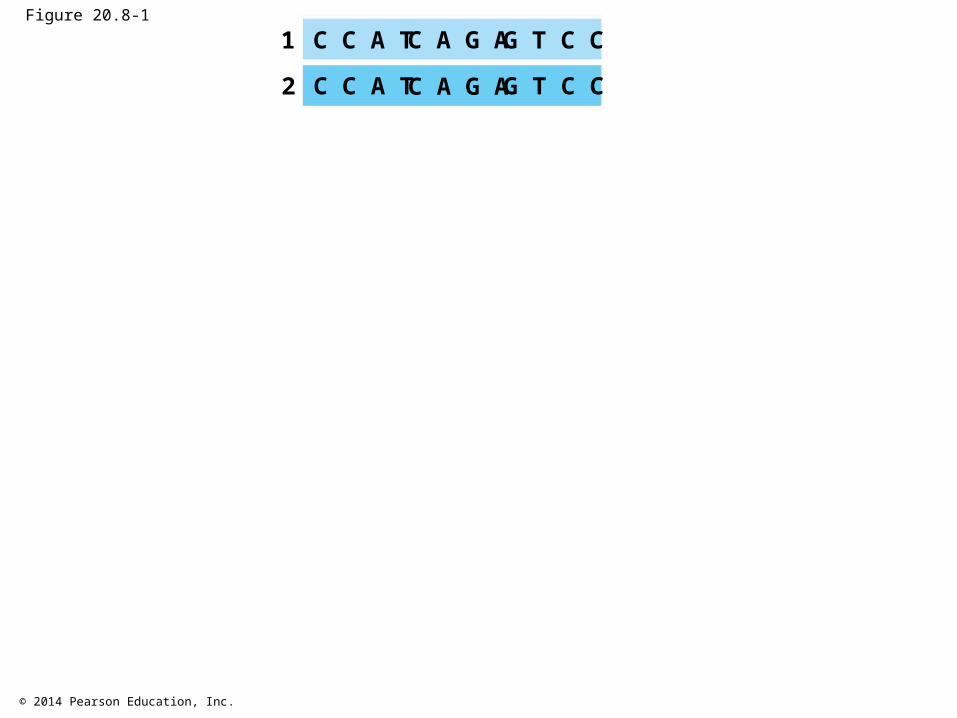
Molecular homologies are determined based on the degree of similarity in nucleotide sequence between taxa
Systematists use computer programs when analyzing comparable DNA segments from different organisms
© 2014 Pearson Education, Inc.
Figure 20.8-1
C C A T C A G A G T C C
C C A T C A G A G T C C
1
2
© 2014 Pearson Education, Inc.
Figure 20.8-2
C C A T C A G A G T C C
C C A T C A G A G T C C
C C A T C A G A G T C C
C C A T C A G A G T C C
G T A
Deletion
Insertion
1
2
1
2
© 2014 Pearson Education, Inc.
Figure 20.8-3
C C A T C A G A G T C C
C C A T C A G A G T C C
C C A T C A G A G T C C
C C A T C A G A G T C C
G T A
Deletion
Insertion
C C A T C A A G T C C
G T AC C A T C A A G T C CG
1
2
1
2
1
2
© 2014 Pearson Education, Inc.
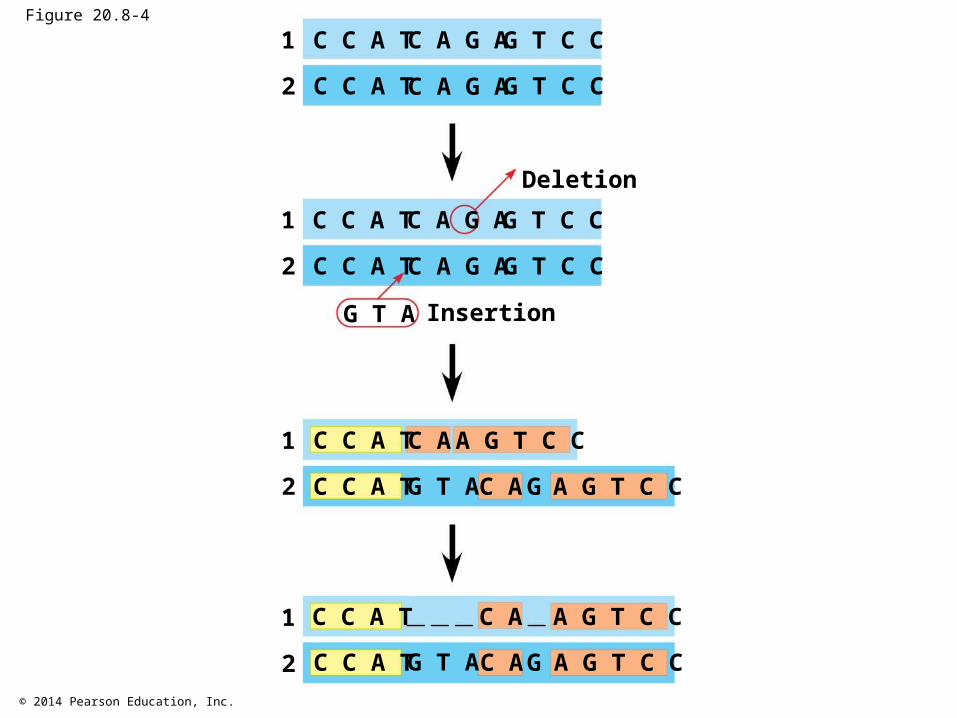
Figure 20.8-4
C C A T C A G A G T C C
C C A T C A G A G T C C
C C A T C A G A G T C C
C C A T C A G A G T C C
G T A
Deletion
Insertion
C C A T C A A G T C C
G T AC C A T C A A G T C CG
C C A T C A A G T C C
G T A GC C A T C A A G T C C
1
2
1
2
1
2
1
2
© 2014 Pearson Education, Inc.
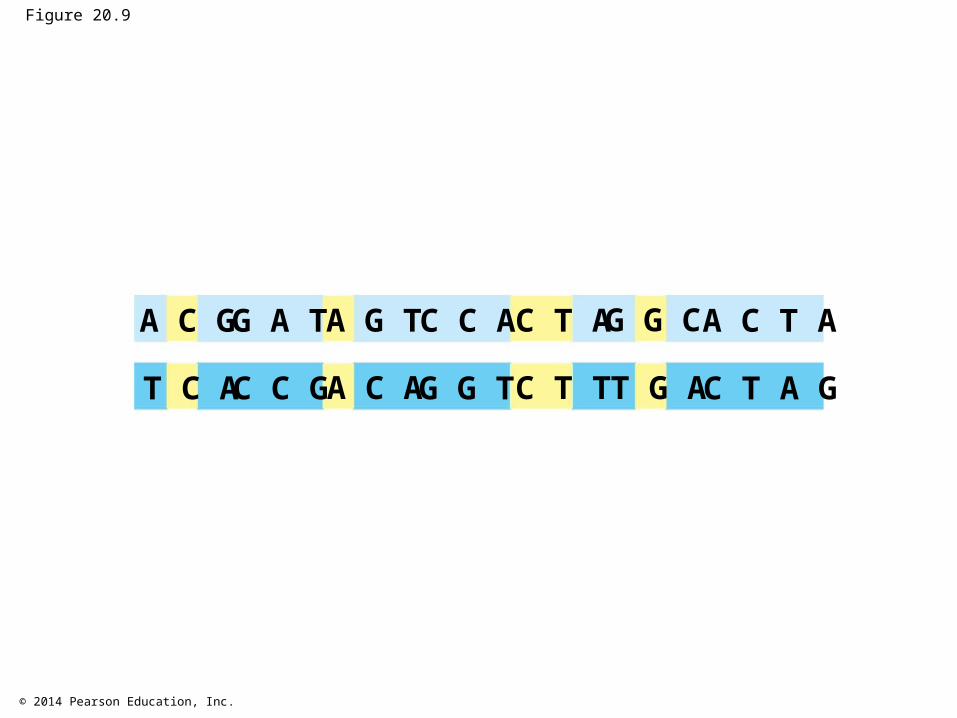
Shared bases in nucleotide sequences that are otherwise very dissimilar are called molecular homoplasies
© 2014 Pearson Education, Inc.
Figure 20.9
G A T C C AA C G A G T C T A G G C A C T A
C C G G G TT C A A C A C T T T G A C T A G
© 2014 Pearson Education, Inc.
Concept 20.3: Shared characters are used to construct phylogenetic trees
Once homologous characters have been identified, they can be used to infer a phylogeny
© 2014 Pearson Education, Inc.
Cladistics
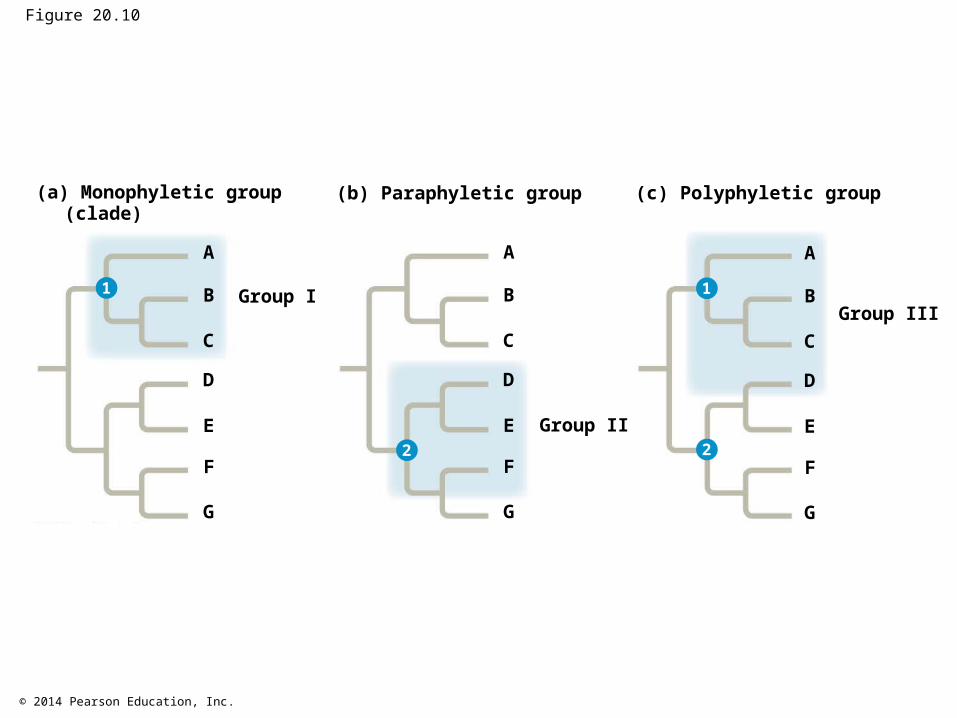
Cladistics classifies organisms by common descent A clade is a group of species that includes an
ancestral species and all its descendants Clades can be nested in larger clades, but not all
groupings of organisms qualify as clades
© 2014 Pearson Education, Inc.
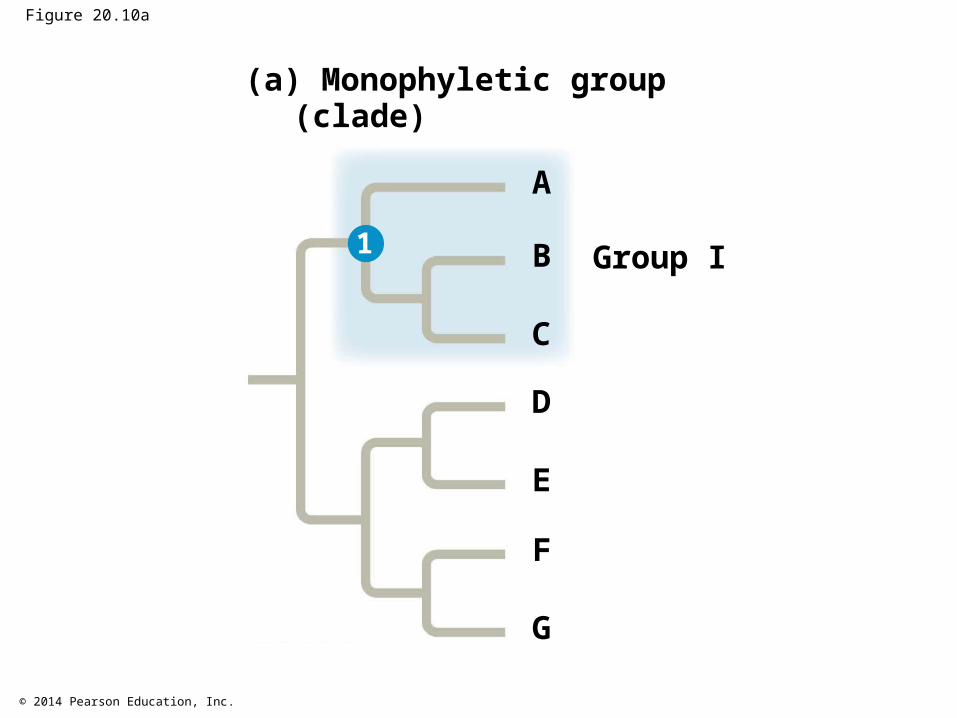
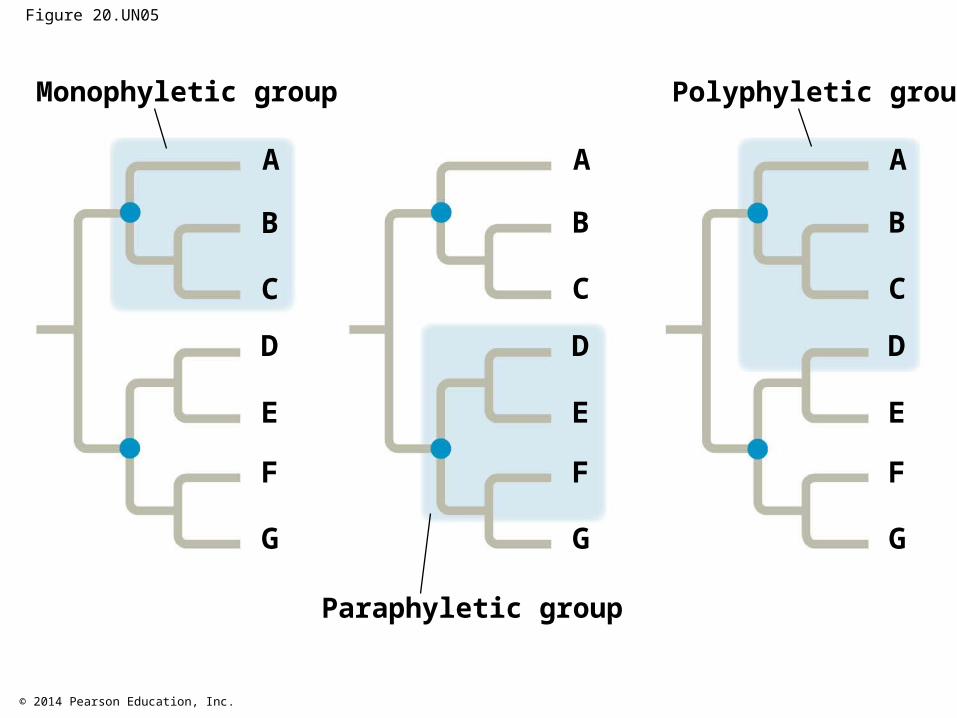
A valid clade is monophyletic, signifying that it consists of the ancestor species and all its descendants
© 2014 Pearson Education, Inc.
Figure 20.10
B
C
A
D
E
F
G
Group I
(a) Monophyletic group(clade)
1 1B
C
A
D
E
F
G
Group II
(b) Paraphyletic group (c) Polyphyletic group
B
C
A
D
E
F
G
Group III
22
© 2014 Pearson Education, Inc.
Figure 20.10a
B
C
A
D
E
F
G
Group I
(a) Monophyletic group(clade)
1
© 2014 Pearson Education, Inc.
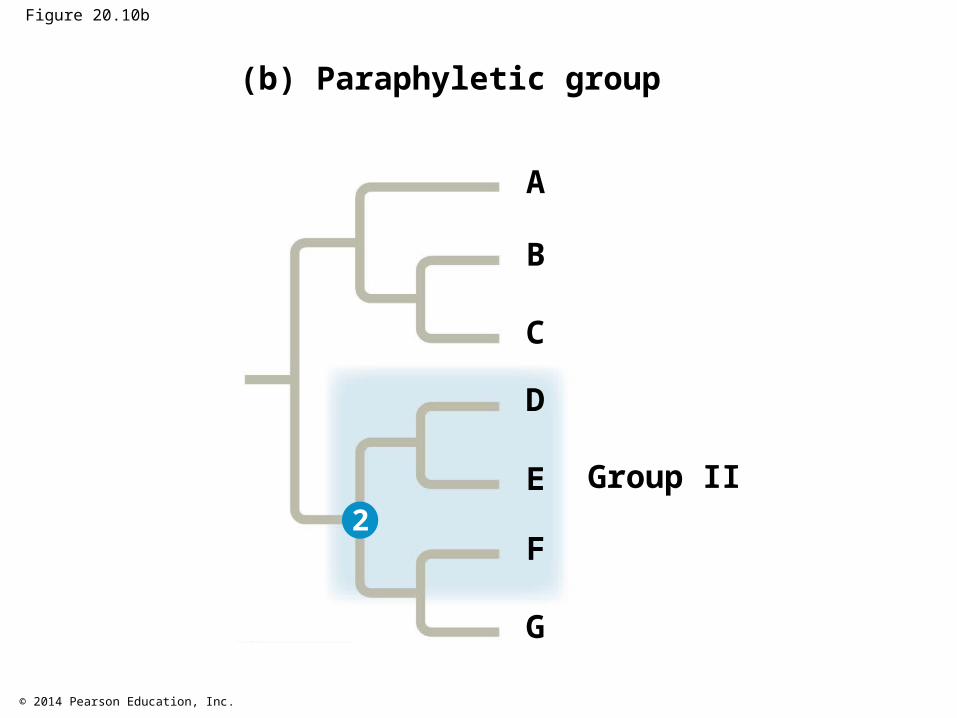
A paraphyletic grouping consists of an ancestral species and some, but not all, of the descendants
© 2014 Pearson Education, Inc.
Figure 20.10b
B
C
A
D
E
F
G
Group II
(b) Paraphyletic group
2
© 2014 Pearson Education, Inc.
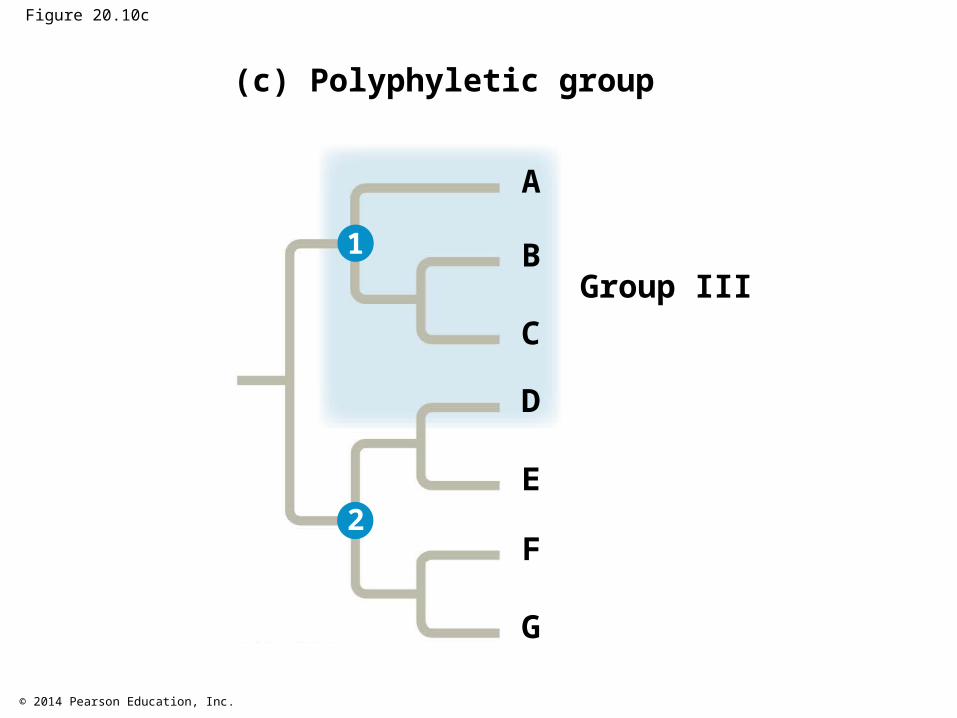
A polyphyletic grouping consists of various taxa with different ancestors
© 2014 Pearson Education, Inc.
Figure 20.10c
(c) Polyphyletic group
B
C
A
D
E
F
G
Group III1
2
© 2014 Pearson Education, Inc.
Shared Ancestral and Shared Derived Characters
In comparison with its ancestor, an organism has both shared and different characteristics
© 2014 Pearson Education, Inc.
A shared ancestral character is a character that originated in an ancestor of the taxon
A shared derived character is an evolutionary novelty unique to a particular clade
A character can be both ancestral and derived, depending on the context
© 2014 Pearson Education, Inc.
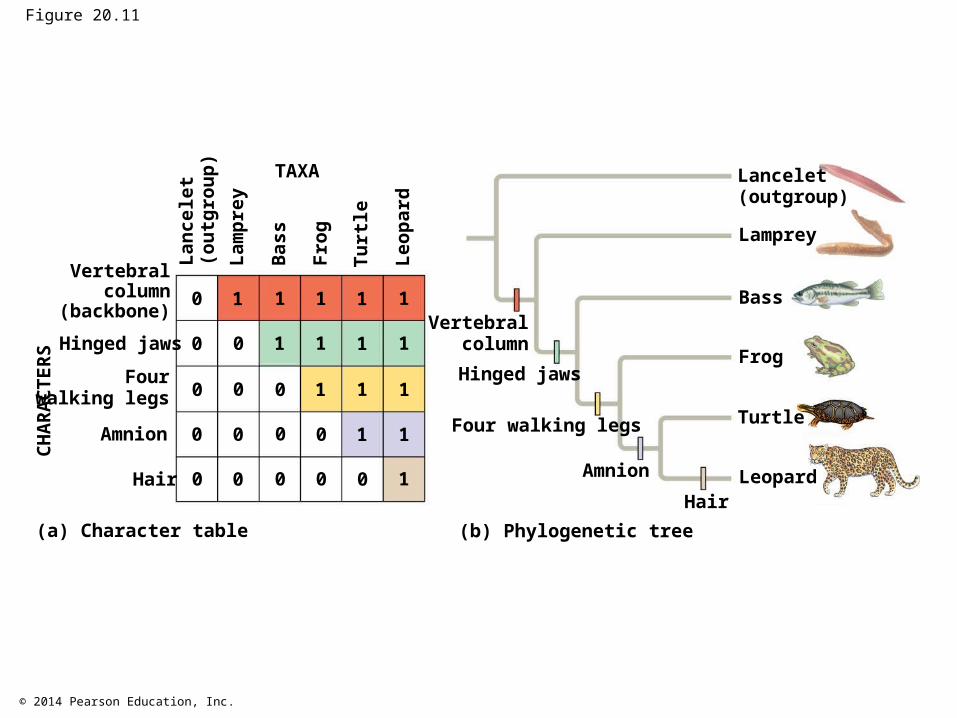
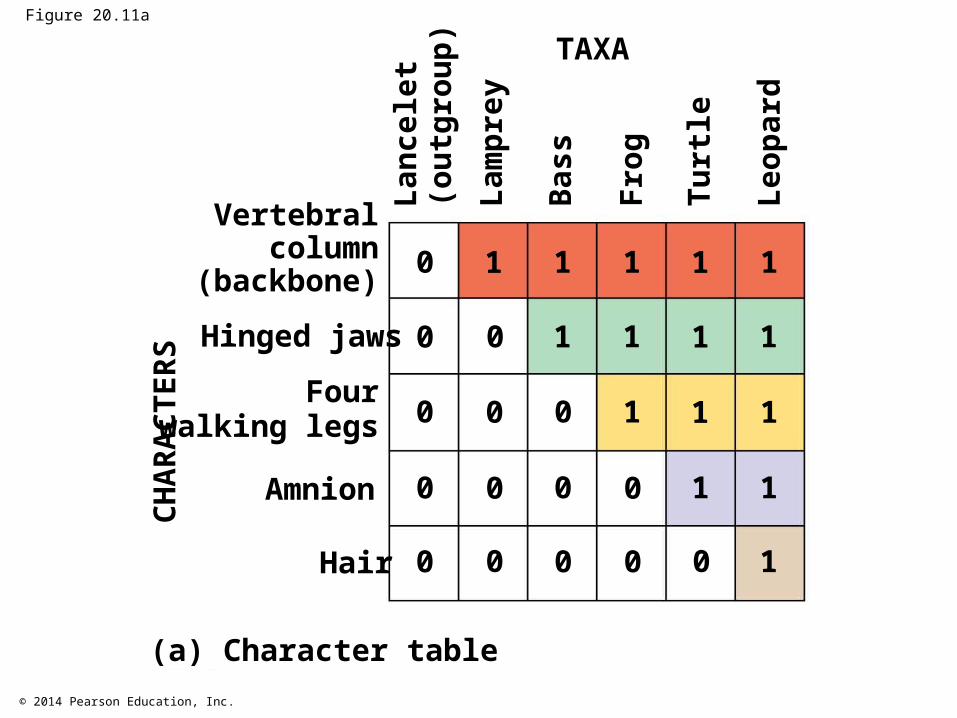
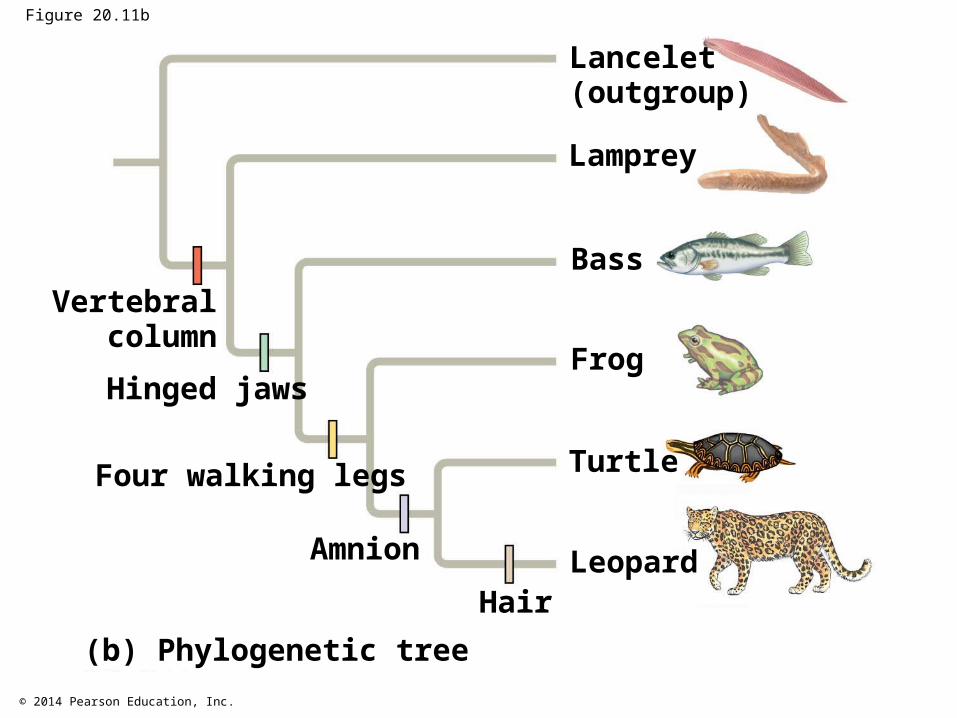
Inferring Phylogenies Using Derived Characters
When inferring evolutionary relationships, it is useful to know in which clade a shared derived character first appeared
© 2014 Pearson Education, Inc.
Figure 20.11
Leopard
Turtle
Frog
Bass
Lamprey
Lancelet(outgroup)
HairAmnion
Four walking legs
Hinged jaws
Vertebralcolumn
Leop
ard
Turt
le
Frog
Bas
s
Lam
prey
Lanc
elet
(out
grou
p)
Hair
Amnion
Fourwalking legs
Hinged jaws
Vertebralcolumn
(backbone)
CH
AR
AC
TER
S
TAXA
(b) Phylogenetic tree(a) Character table
0 10
1
0
1
0
1
0
10 1
0
1
0
1
0
1
0
1
0
10
10 1
0 10
1
© 2014 Pearson Education, Inc.
Figure 20.11a
Leop
ard
Turt
le
Frog
Bas
s
Lam
prey
Lanc
elet
(out
grou
p)
Hair
Amnion
Fourwalking legs
Hinged jaws
Vertebralcolumn
(backbone)
CH
AR
AC
TER
S
TAXA
(a) Character table
0 10
1
0
1
0
1
0
10 1
0
1
0
1
0
1
0
1
0
10
10 1
0 10
1
© 2014 Pearson Education, Inc.
Figure 20.11b
Leopard
Turtle
Frog
Bass
Lamprey
Lancelet(outgroup)
HairAmnion
Four walking legs
Hinged jaws
Vertebralcolumn
(b) Phylogenetic tree
© 2014 Pearson Education, Inc.
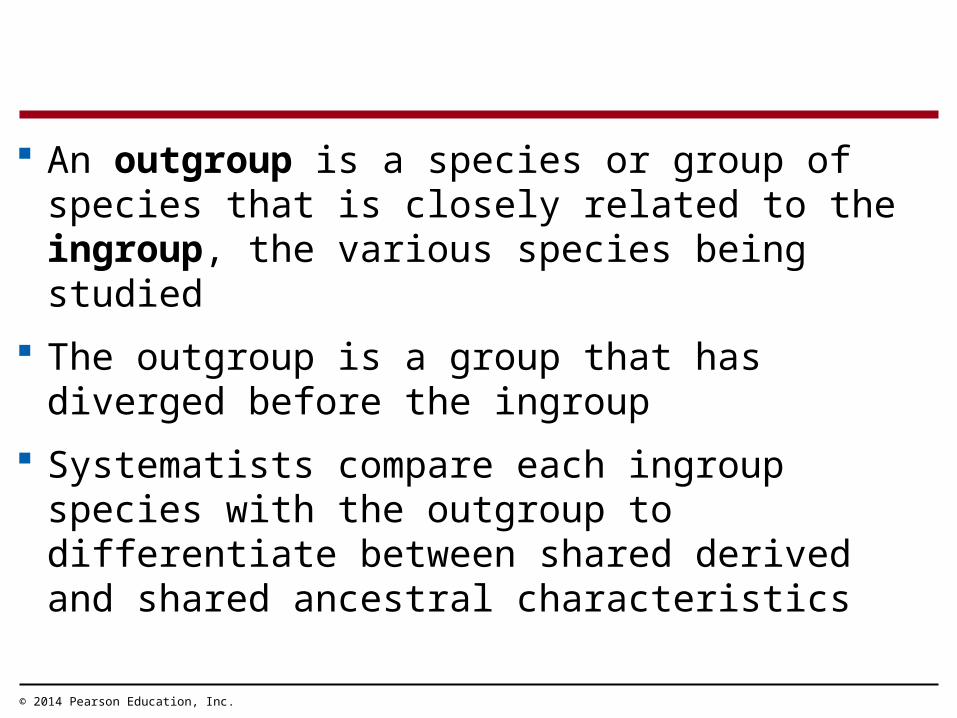
An outgroup is a species or group of species that is closely related to the ingroup, the various species being studied
The outgroup is a group that has diverged before the ingroup
Systematists compare each ingroup species with the outgroup to differentiate between shared derived and shared ancestral characteristics
© 2014 Pearson Education, Inc.
Characters shared by the outgroup and ingroup are ancestral characters that predate the divergence of both groups from a common ancestor
© 2014 Pearson Education, Inc.
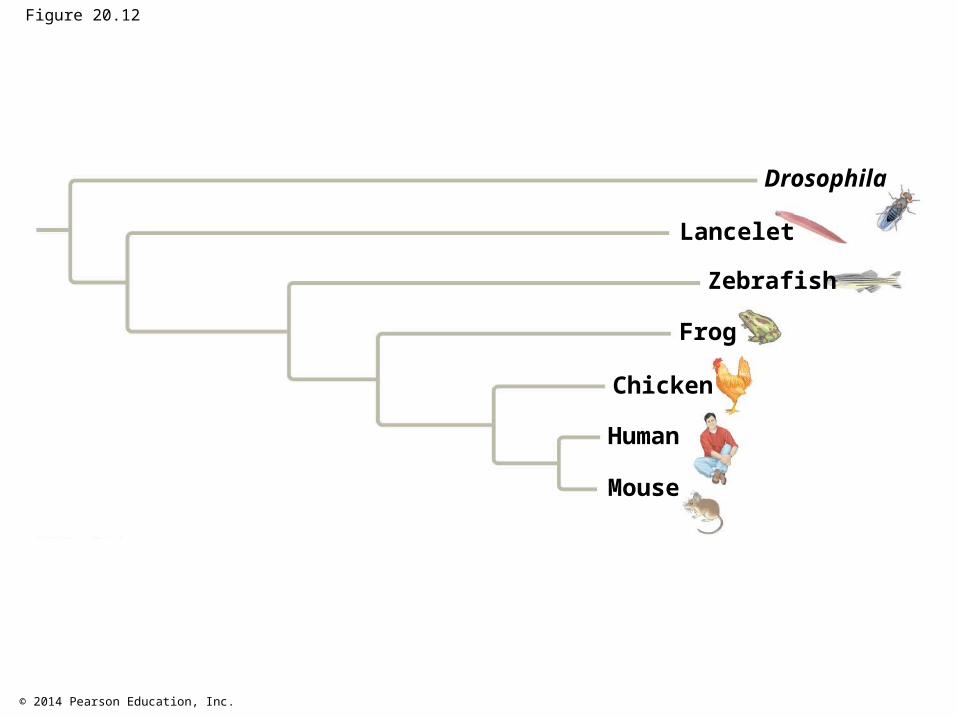
Phylogenetic Trees with Proportional Branch Lengths
In some trees, the length of a branch can reflect the number of genetic changes that have taken place in a particular DNA sequence in that lineage
© 2014 Pearson Education, Inc.
Figure 20.12
Mouse
Human
Chicken
Frog
Zebrafish
Lancelet
Drosophila
© 2014 Pearson Education, Inc.
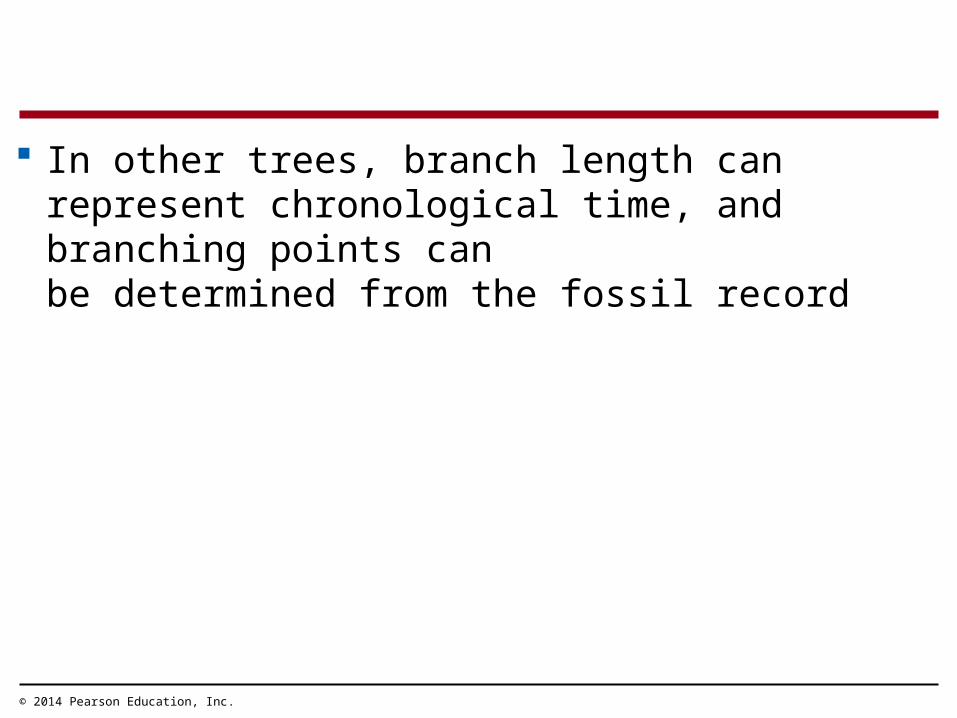
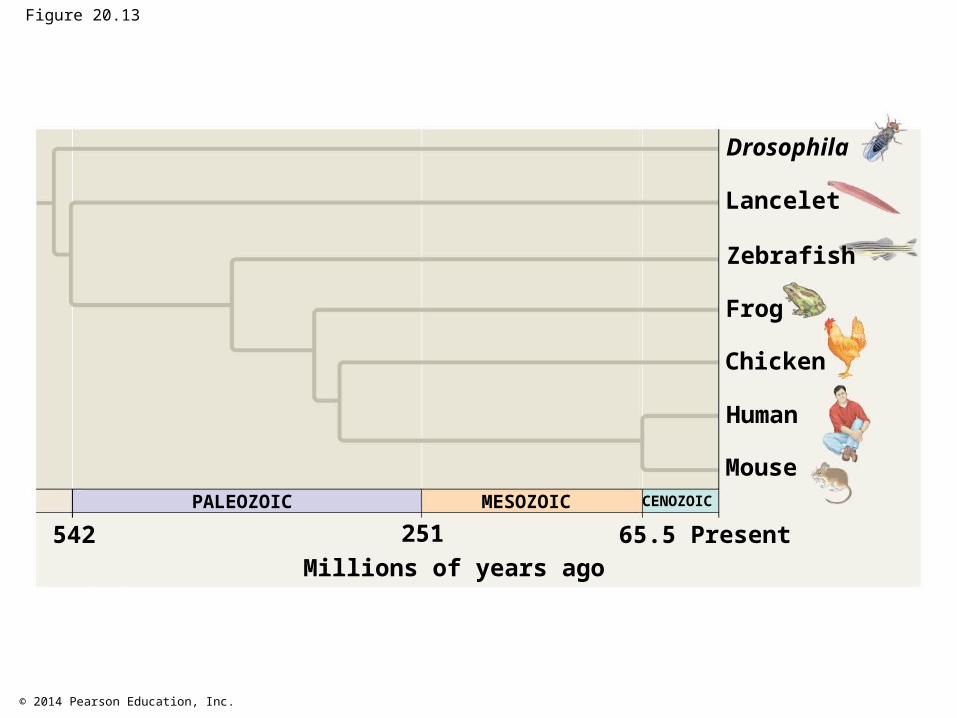
In other trees, branch length can represent chronological time, and branching points can be determined from the fossil record
© 2014 Pearson Education, Inc.
Figure 20.13
Mouse
Human
Chicken
Frog
Zebrafish
Lancelet
Drosophila
Millions of years ago65.5 Present542
PALEOZOIC
251MESOZOIC CENOZOIC
© 2014 Pearson Education, Inc.
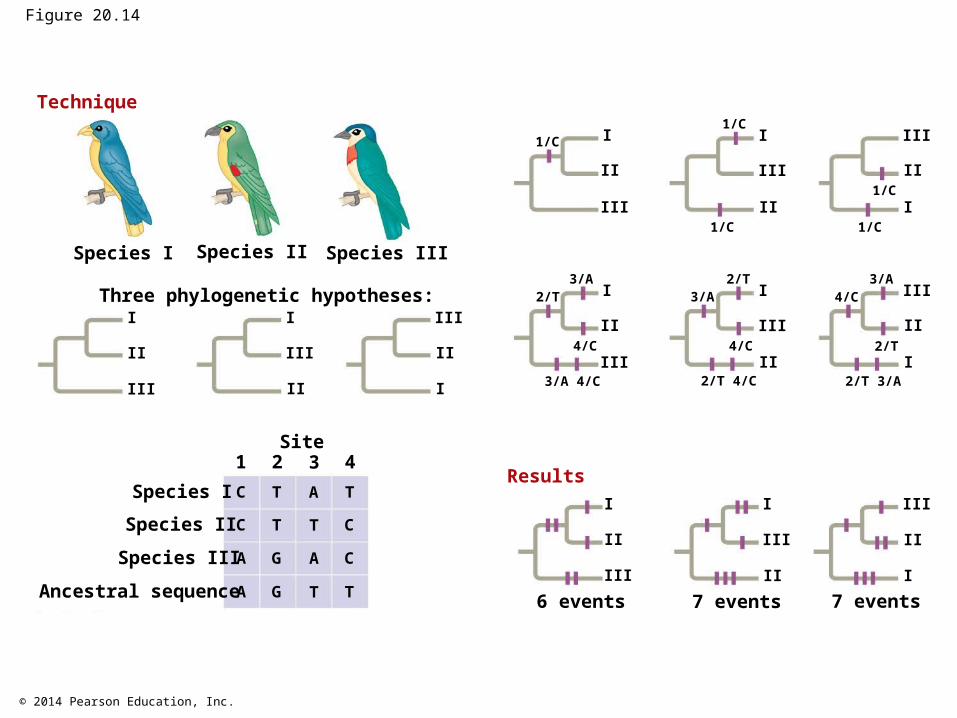
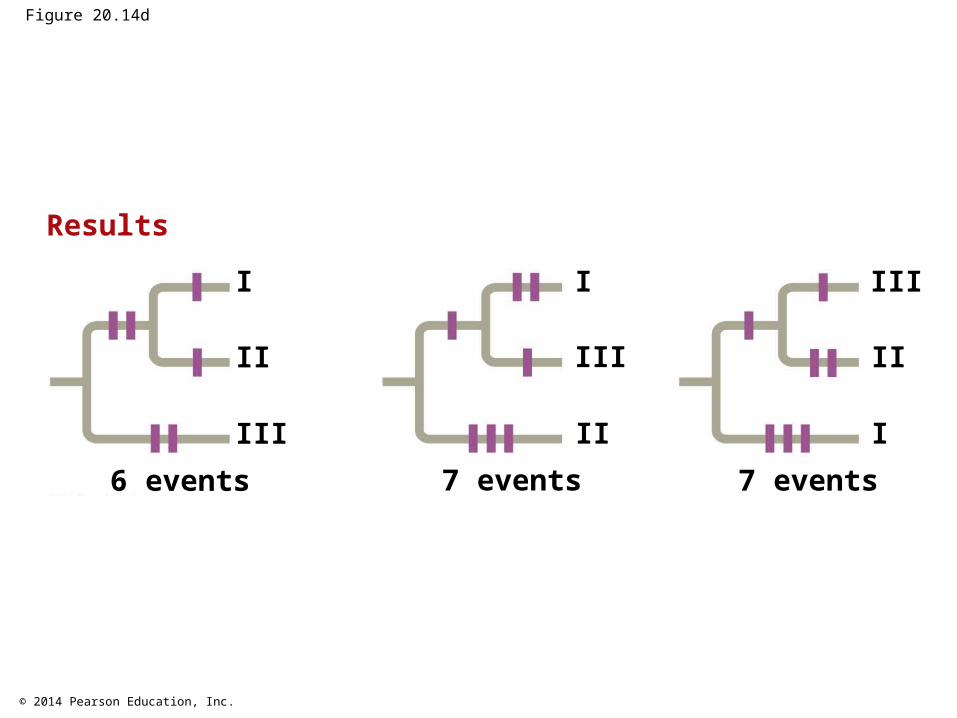
Maximum Parsimony
Systematists can never be sure of finding the best tree in a large data set
They narrow possibilities by applying the principle of maximum parsimony
© 2014 Pearson Education, Inc.
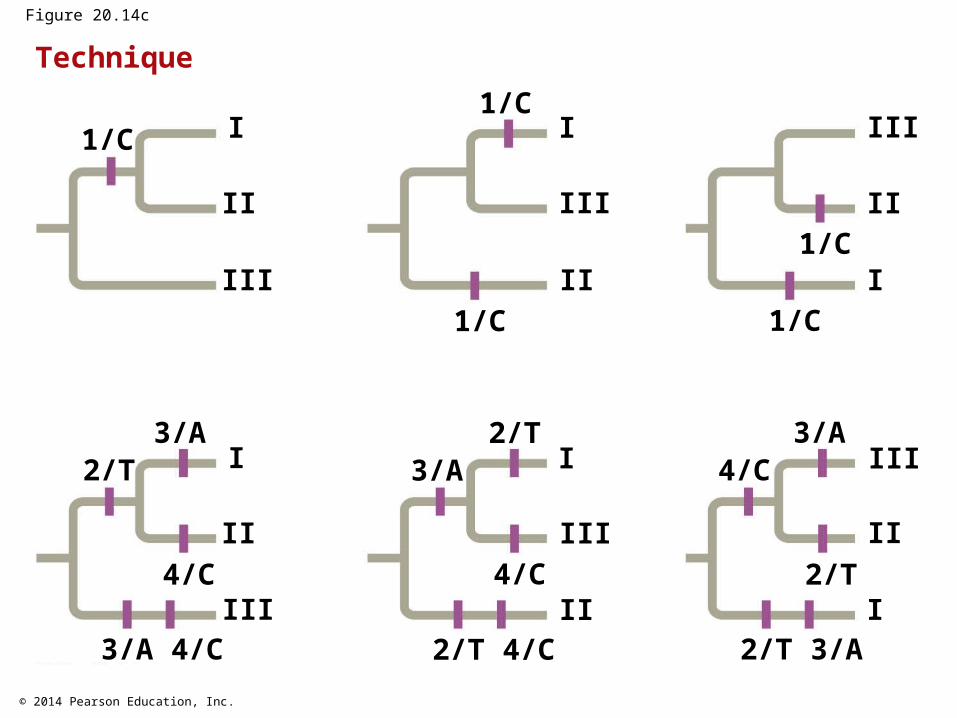
Maximum parsimony assumes that the tree that requires the fewest evolutionary events (appearances of shared derived characters) is the most likely
Computer programs are used to search for trees that are parsimonious
© 2014 Pearson Education, Inc.
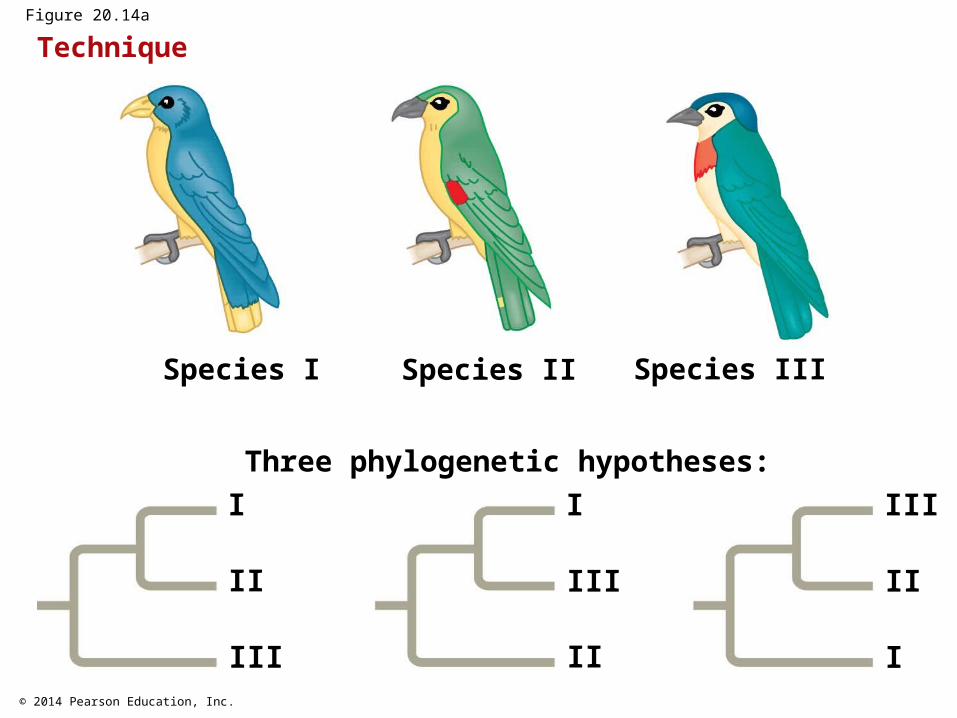
Figure 20.14
Species I Species II Species III
Three phylogenetic hypotheses:I I
I
II II
IIIII
III
III
Species ISpecies II
Species III
Ancestral sequence
Site
Technique
Results
6 events 7 events 7 events
1 2 3 4
A G T T
C T A T
C T T C
A G A C
I I
I
II II
IIIII
III
III
3/A 4/C
I I
I
II II
IIIII
III
III
2/T 4/C 2/T 3/A
4/C
2/T 3/A3/A
4/C 2/T
3/A2/T 4/C
I I
I
II II
IIIII
III
III1/C1/C
1/C
1/C
1/C
© 2014 Pearson Education, Inc.
Figure 20.14a
Species I Species II Species III
Three phylogenetic hypotheses:I I
I
II II
IIIII
III
III
Technique
© 2014 Pearson Education, Inc.
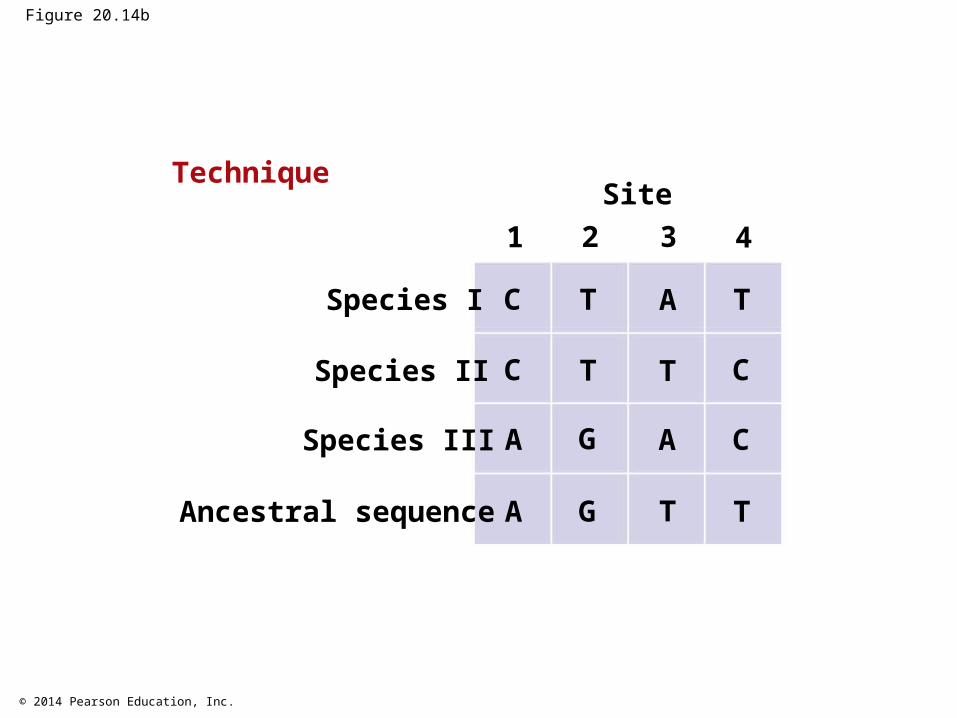
Figure 20.14b
Species I
Species II
Species III
Ancestral sequence
SiteTechnique
1 2 3 4
A G T T
C T A T
C T T C
A G A C
© 2014 Pearson Education, Inc.
Figure 20.14c
3/A 4/C
I I
I
II II
IIIII
III
III
2/T 4/C 2/T 3/A
4/C
2/T 3/A3/A
4/C 2/T
3/A2/T 4/C
I I
I
II II
IIIII
III
III1/C1/C
1/C
1/C
1/C
Technique
© 2014 Pearson Education, Inc.
Figure 20.14d
Results
6 events 7 events 7 events
I I
I
II II
IIIII
III
III
© 2014 Pearson Education, Inc.
Phylogenetic Trees as Hypotheses
The best hypotheses for phylogenetic trees fit the most data: morphological, molecular, and fossil
Phylogenetic hypotheses are modified when new evidence arises
© 2014 Pearson Education, Inc.
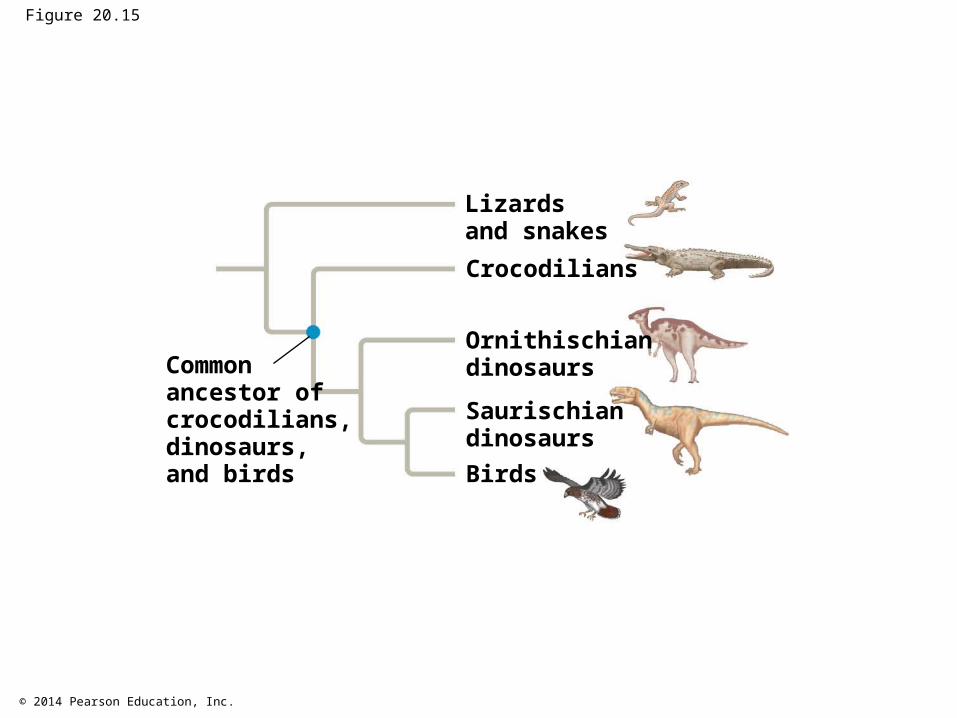
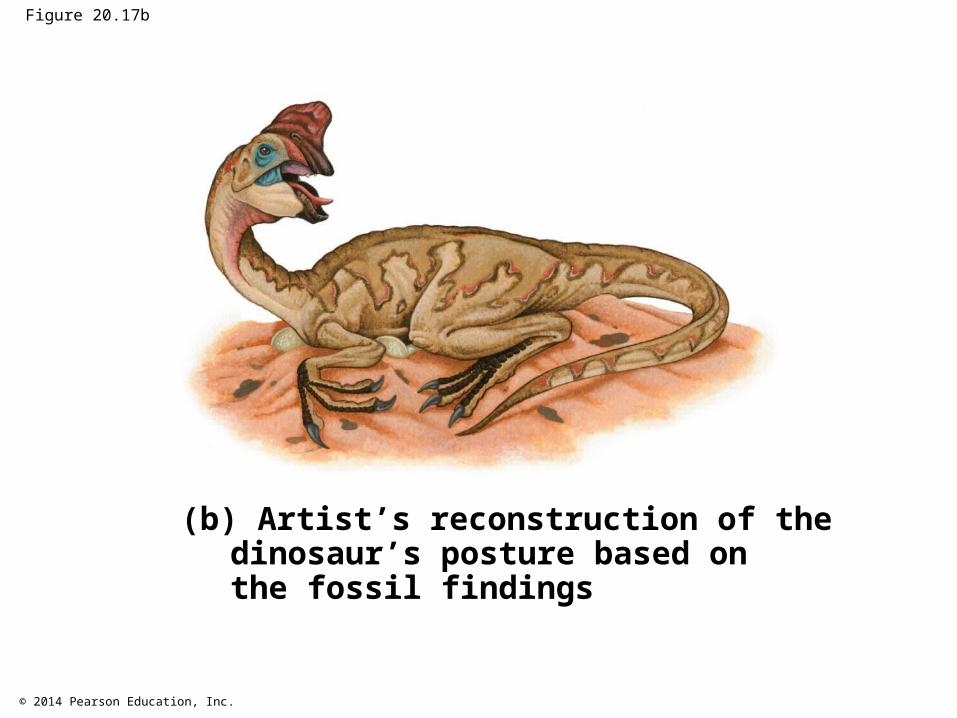
Phylogenetic bracketing allows us to predict features of ancestors and their extinct descendants based on the features of closely related living descendants For example, phylogenetic bracketing allows us to
infer characteristics of dinosaurs based on shared characters in modern birds and crocodiles
© 2014 Pearson Education, Inc.
Figure 20.15
Ornithischiandinosaurs
Birds
Crocodilians
Lizardsand snakes
Saurischiandinosaurs
Commonancestor ofcrocodilians,dinosaurs,and birds
© 2014 Pearson Education, Inc.
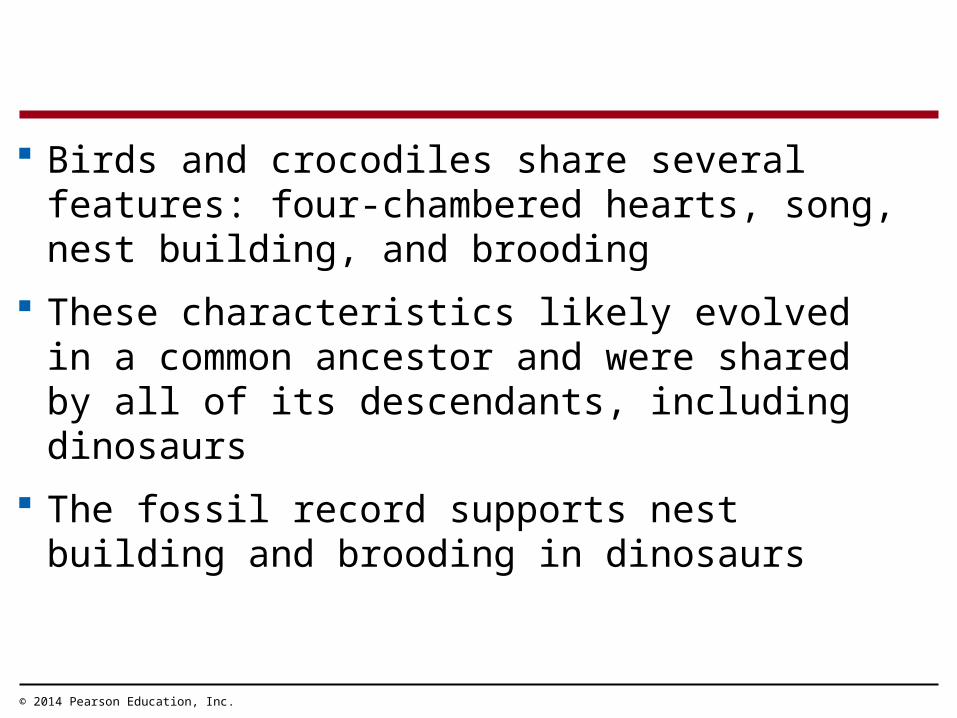
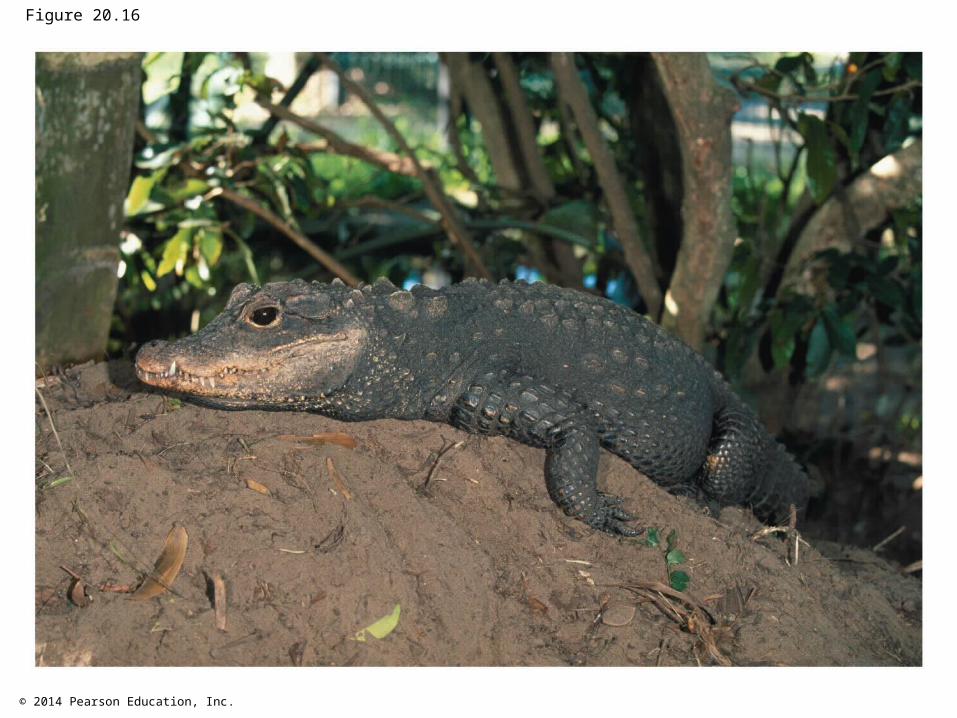
Birds and crocodiles share several features: four-chambered hearts, song, nest building, and brooding
These characteristics likely evolved in a common ancestor and were shared by all of its descendants, including dinosaurs
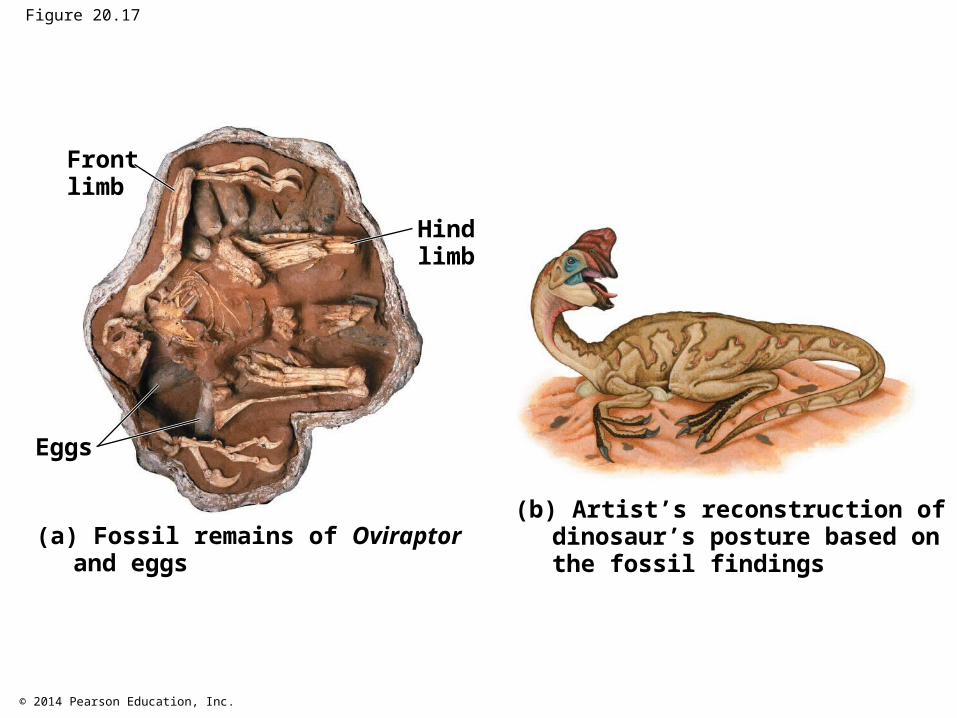
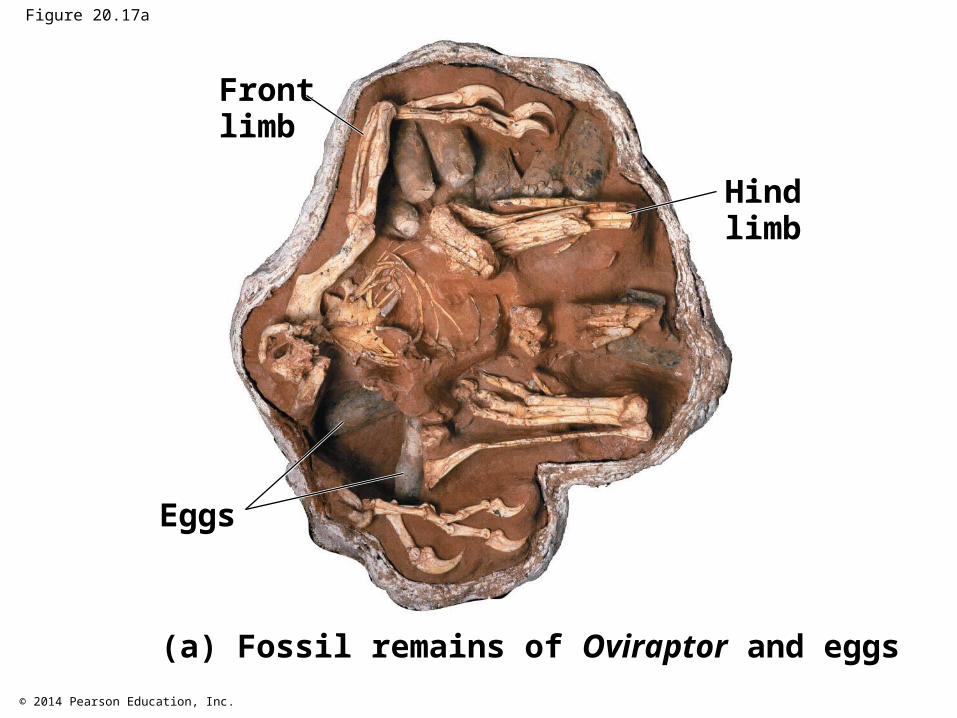
The fossil record supports nest building and brooding in dinosaurs
© 2014 Pearson Education, Inc.
Figure 20.16
© 2014 Pearson Education, Inc.
Figure 20.17
Hindlimb
Frontlimb
(a) Fossil remains of Oviraptorand eggs
(b) Artist’s reconstruction of thedinosaur’s posture based onthe fossil findings
Eggs
© 2014 Pearson Education, Inc.
Figure 20.17a
Hindlimb
Frontlimb
(a) Fossil remains of Oviraptor and eggs
Eggs
© 2014 Pearson Education, Inc.
Figure 20.17b
(b) Artist’s reconstruction of thedinosaur’s posture based onthe fossil findings
© 2014 Pearson Education, Inc.
Concept 20.4: Molecular clocks help track evolutionary time
To extend molecular phylogenies beyond the fossil record, we must make an assumption about how molecular change occurs over time
© 2014 Pearson Education, Inc.
Molecular Clocks
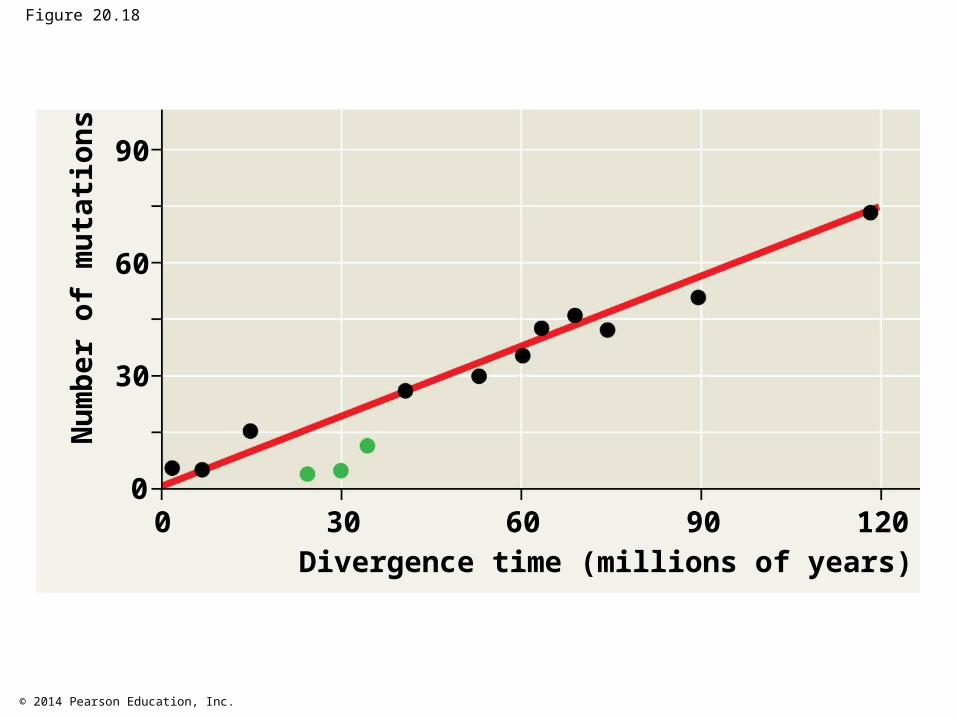
A molecular clock uses constant rates of evolution in some genes to estimate the absolute time of evolutionary change
The number of nucleotide substitutions in related genes is assumed to be proportional to the time since they last shared a common ancestor
© 2014 Pearson Education, Inc.
Molecular clocks are calibrated by plotting the number of genetic changes against the dates of branch points known from the fossil record
Individual genes vary in how clocklike they are
© 2014 Pearson Education, Inc.
Figure 20.18
Divergence time (millions of years)
Num
ber o
f mut
atio
ns
1209060300
90
60
30
0
© 2014 Pearson Education, Inc.
Differences in Clock Speed
Some mutations are selectively neutral and have little or no effect on fitness
Neutral mutations should be regular like a clock The neutral mutation rate is dependant on how
critical a gene’s amino acid sequence is to survival
© 2014 Pearson Education, Inc.
Potential Problems with Molecular Clocks
Molecular clocks do not run as smoothly as expected if mutations were selectively neutral
Irregularities result from natural selection in which some DNA changes are favored over others
Estimates of evolutionary divergences older than the fossil record have a high degree of uncertainty
The use of multiple genes may improve estimates
© 2014 Pearson Education, Inc.
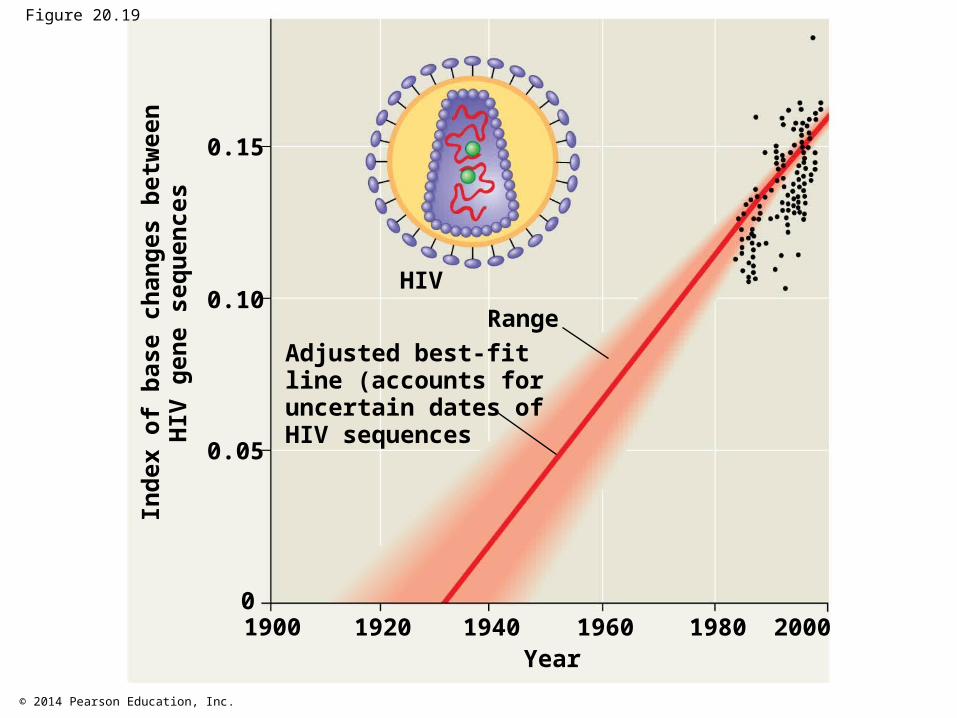
Applying a Molecular Clock: Dating the Origin of HIV Phylogenetic analysis shows that HIV is descended
from viruses that infect chimpanzees and other primates
HIV spread to humans more than once Comparison of HIV samples shows that the virus
evolved in a very clocklike way Application of a molecular clock to one strain of HIV
suggests that that strain spread to humans during the 1930s
Animation: Class Schemes
© 2014 Pearson Education, Inc.
Figure 20.19
Year
Inde
x of
bas
e ch
ange
s be
twee
nH
IV g
ene
sequ
ence
s
19401920 196019000
0.15
0.10
0.05
1980 2000
HIVRange
Adjusted best-fitline (accounts foruncertain dates ofHIV sequences
© 2014 Pearson Education, Inc.
Concept 20.5: New information continues to revise our understanding of evolutionary history
Recently, systematists have gained insight into the very deepest branches of the tree of life through analysis of DNA sequence data
© 2014 Pearson Education, Inc.
From Two Kingdoms to Three Domains
Early taxonomists classified all species as either plants or animals
Later, five kingdoms were recognized: Monera (prokaryotes), Protista, Plantae, Fungi, and Animalia
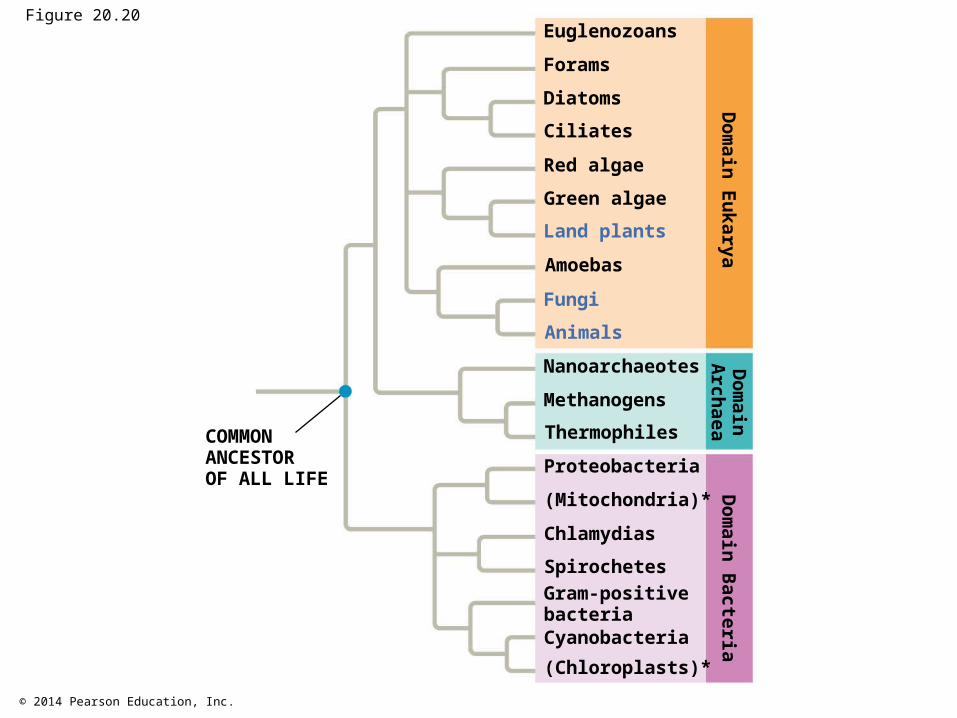
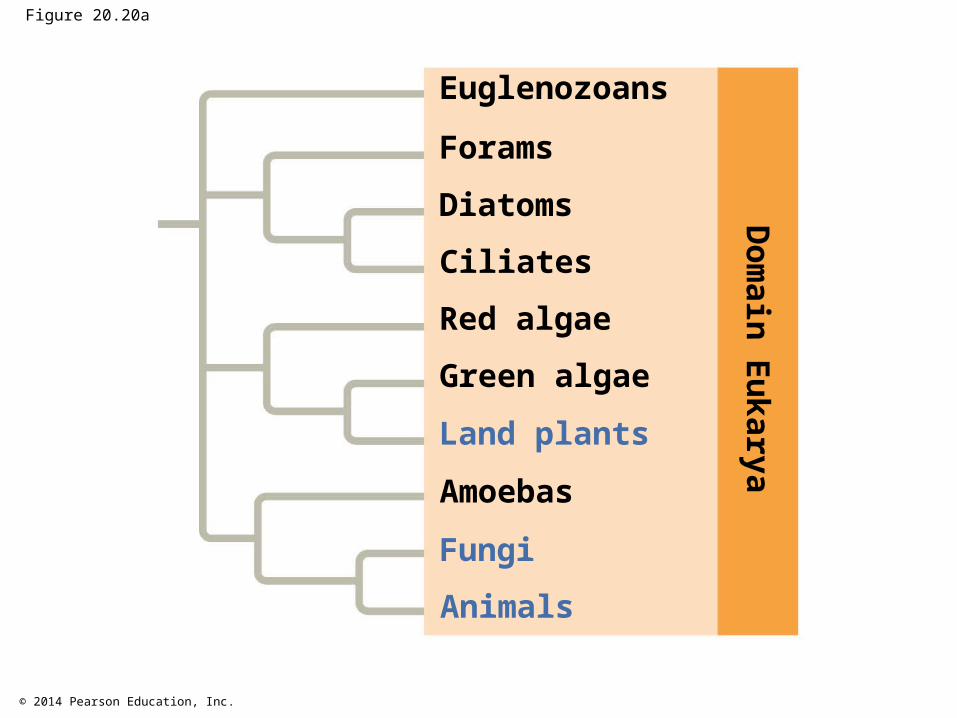
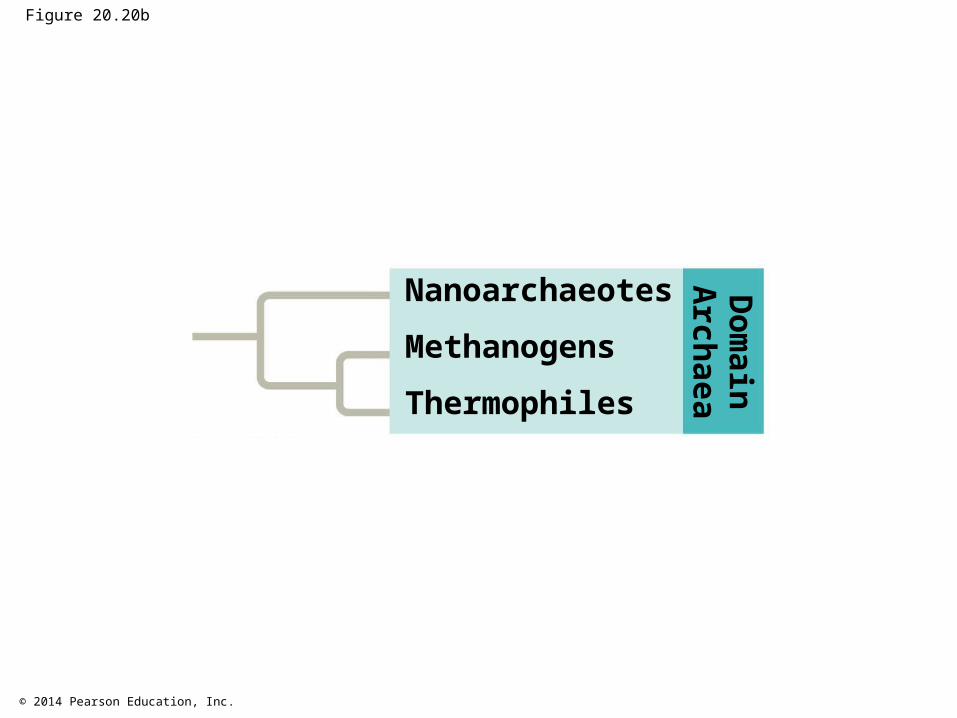
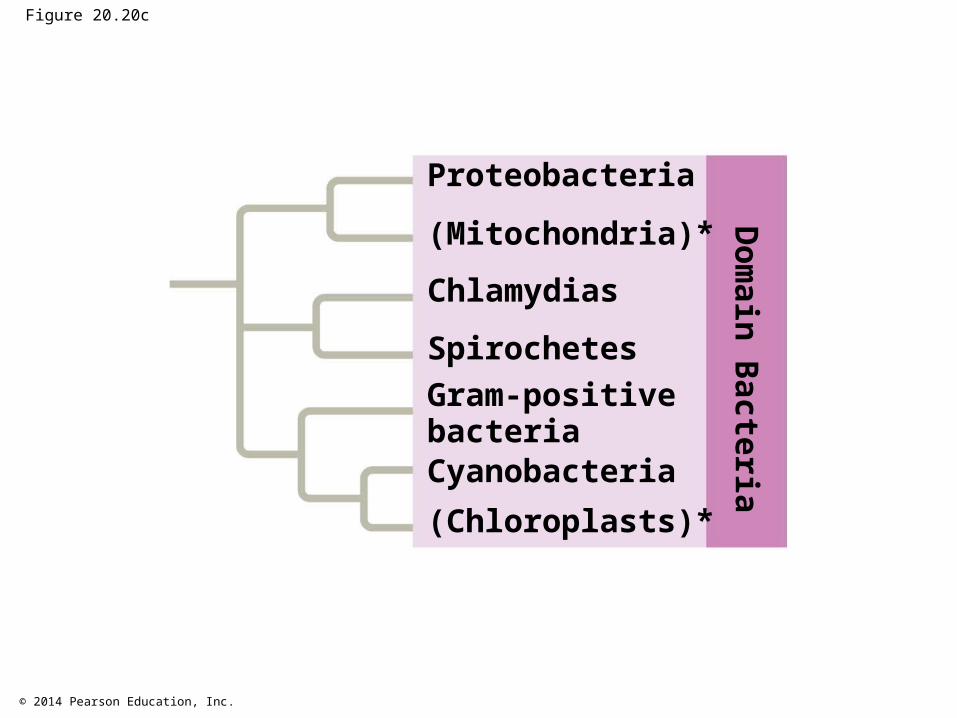
More recently, the three-domain system has been adopted: Bacteria, Archaea, and Eukarya
The three-domain system is supported by data from many sequenced genomes
© 2014 Pearson Education, Inc.
Figure 20.20
Forams
Ciliates
Euglenozoans
Diatoms
COMMONANCESTOR OF ALL LIFE
Land plants
Animals
Amoebas
Fungi
Red algae
Chlamydias
Green algae
(Mitochondria)*
Methanogens
Proteobacteria
Nanoarchaeotes
Thermophiles
Dom
ain Eukarya
Gram-positivebacteria
(Chloroplasts)*
Spirochetes
Cyanobacteria
Dom
ain Bacteria
Dom
ainA
rchaea
© 2014 Pearson Education, Inc.
Figure 20.20a
Forams
Ciliates
Euglenozoans
Diatoms
Land plants
Animals
Amoebas
Fungi
Red algae
Green algae
Dom
ain Eukarya
© 2014 Pearson Education, Inc.
Figure 20.20b
Methanogens
Nanoarchaeotes
Thermophiles
Dom
ainA
rchaea
© 2014 Pearson Education, Inc.
Figure 20.20c
Chlamydias
(Mitochondria)*
Proteobacteria
Gram-positivebacteria
(Chloroplasts)*
Spirochetes
Cyanobacteria
Dom
ain Bacteria
© 2014 Pearson Education, Inc.
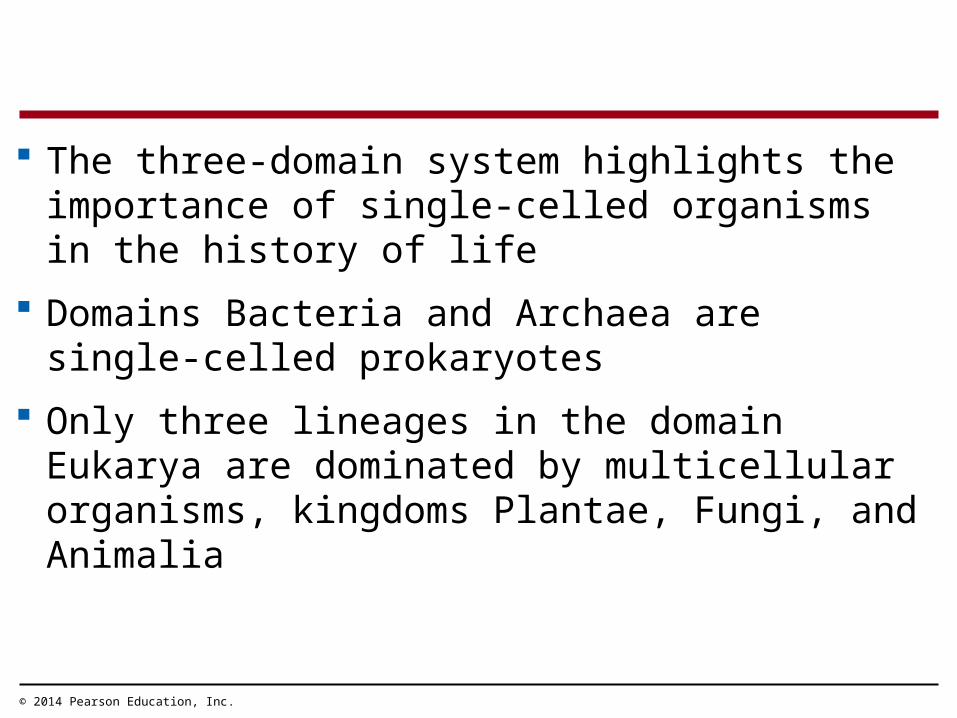
The three-domain system highlights the importance of single-celled organisms in the history of life
Domains Bacteria and Archaea are single-celled prokaryotes
Only three lineages in the domain Eukarya are dominated by multicellular organisms, kingdoms Plantae, Fungi, and Animalia
© 2014 Pearson Education, Inc.
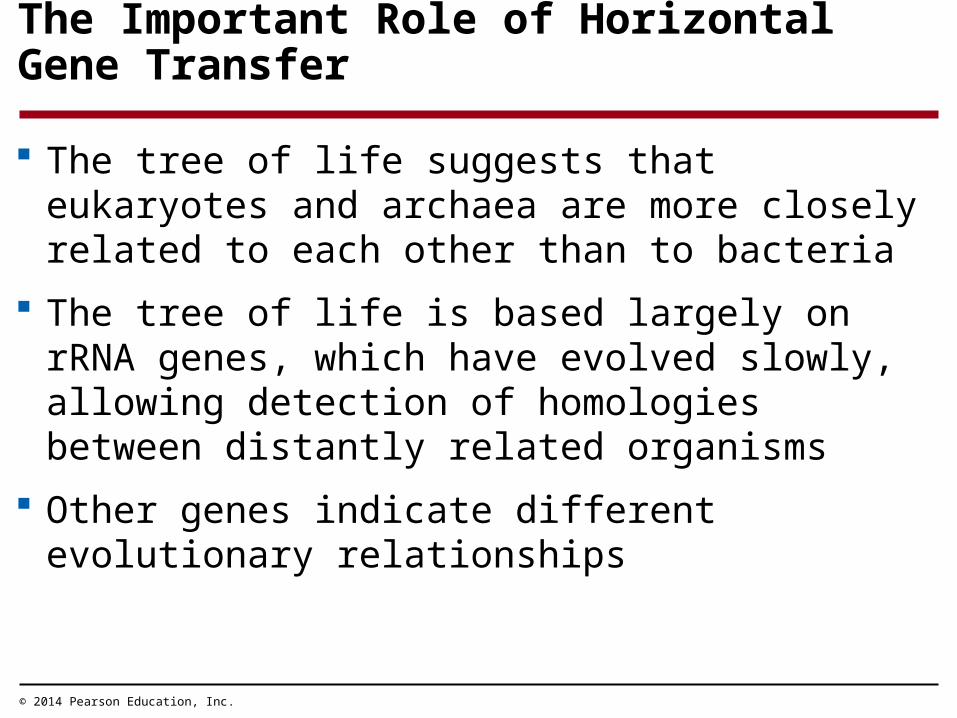
The Important Role of Horizontal Gene Transfer
The tree of life suggests that eukaryotes and archaea are more closely related to each other than to bacteria
The tree of life is based largely on rRNA genes, which have evolved slowly, allowing detection of homologies between distantly related organisms
Other genes indicate different evolutionary relationships
© 2014 Pearson Education, Inc.
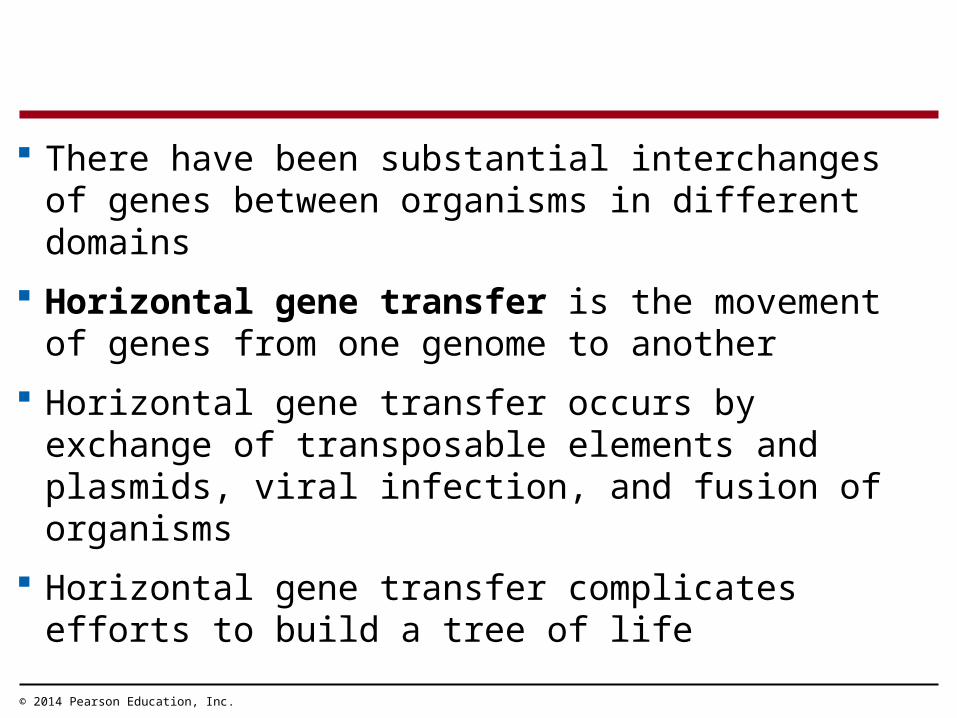
There have been substantial interchanges of genes between organisms in different domains
Horizontal gene transfer is the movement of genes from one genome to another
Horizontal gene transfer occurs by exchange of transposable elements and plasmids, viral infection, and fusion of organisms
Horizontal gene transfer complicates efforts to build a tree of life
© 2014 Pearson Education, Inc.
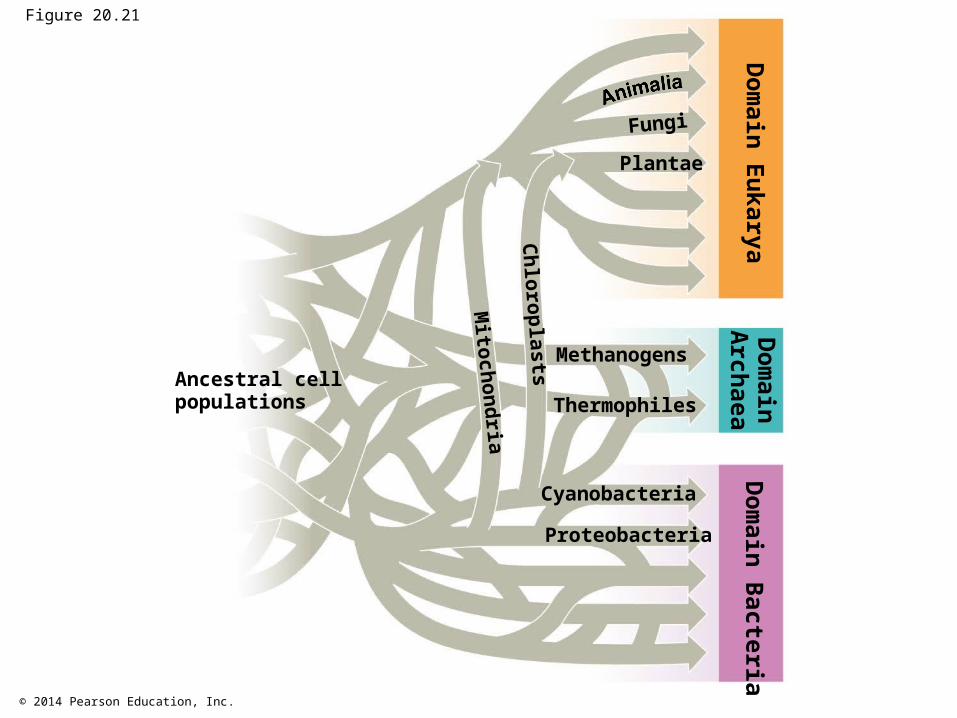
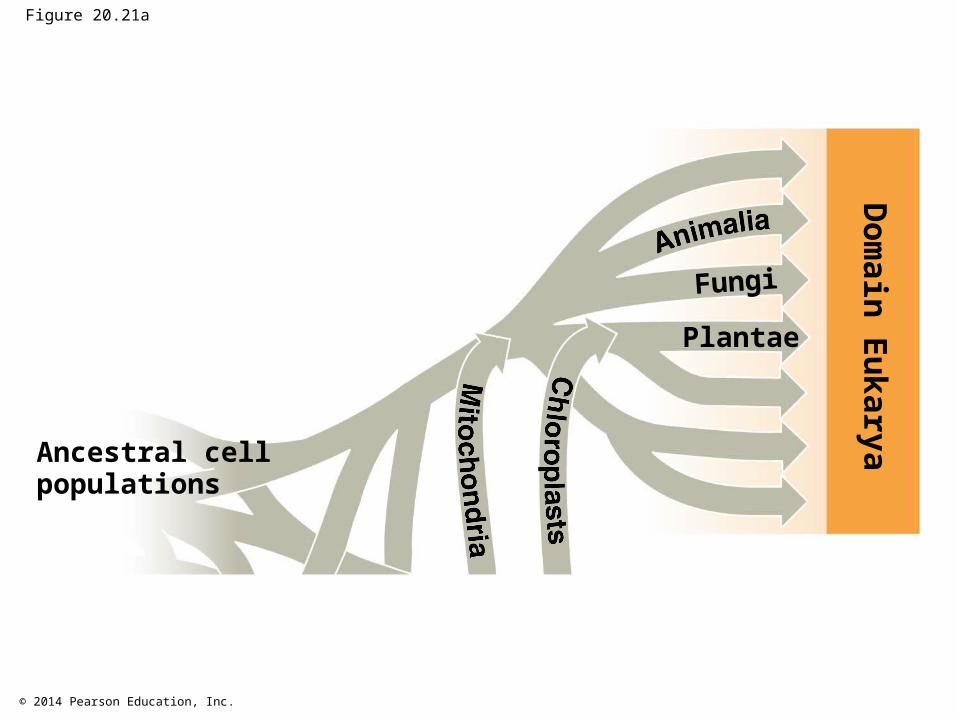
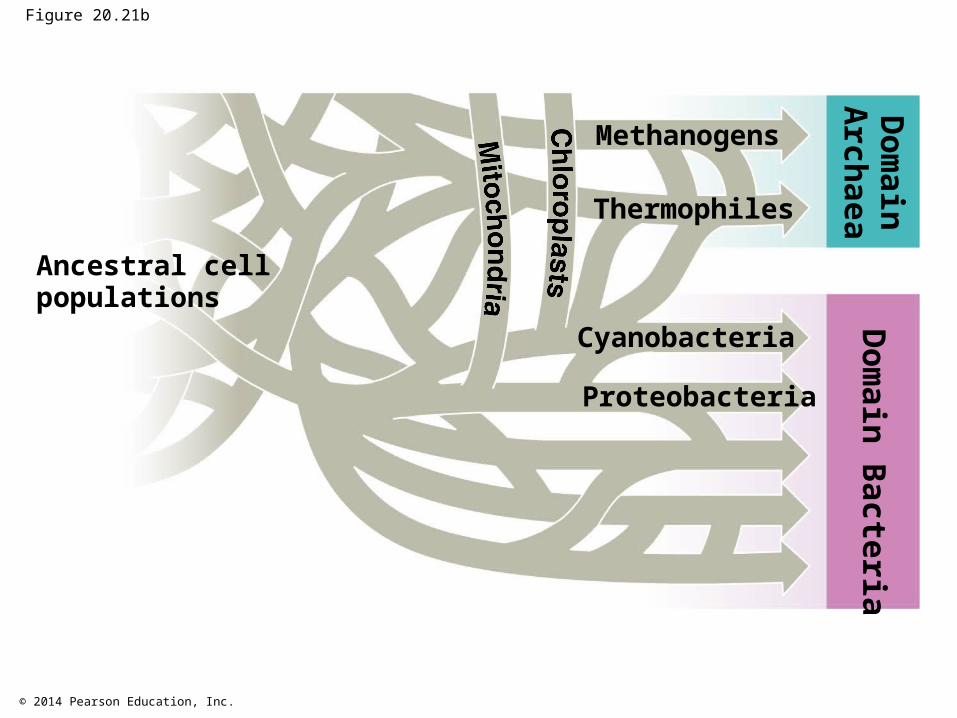
Horizontal gene transfer may have been common enough that the early history of life is better depicted by a tangled web than a branching tree
© 2014 Pearson Education, Inc.
Figure 20.21
Cyanobacteria
Proteobacteria
Thermophiles
Dom
ain EukaryaD
omain B
acteriaD
omain
Archaea
Fungi
Plantae
Chloroplasts
Mitochondria
MethanogensAncestral cellpopulations
© 2014 Pearson Education, Inc.
Figure 20.21a
Dom
ain Eukarya
Fungi
Plantae
Ancestral cellpopulations
© 2014 Pearson Education, Inc.
Figure 20.21b
Cyanobacteria
Proteobacteria
Thermophiles
Dom
ain Bacteria
Dom
ainA
rchaeaMethanogens
Ancestral cellpopulations
© 2014 Pearson Education, Inc.
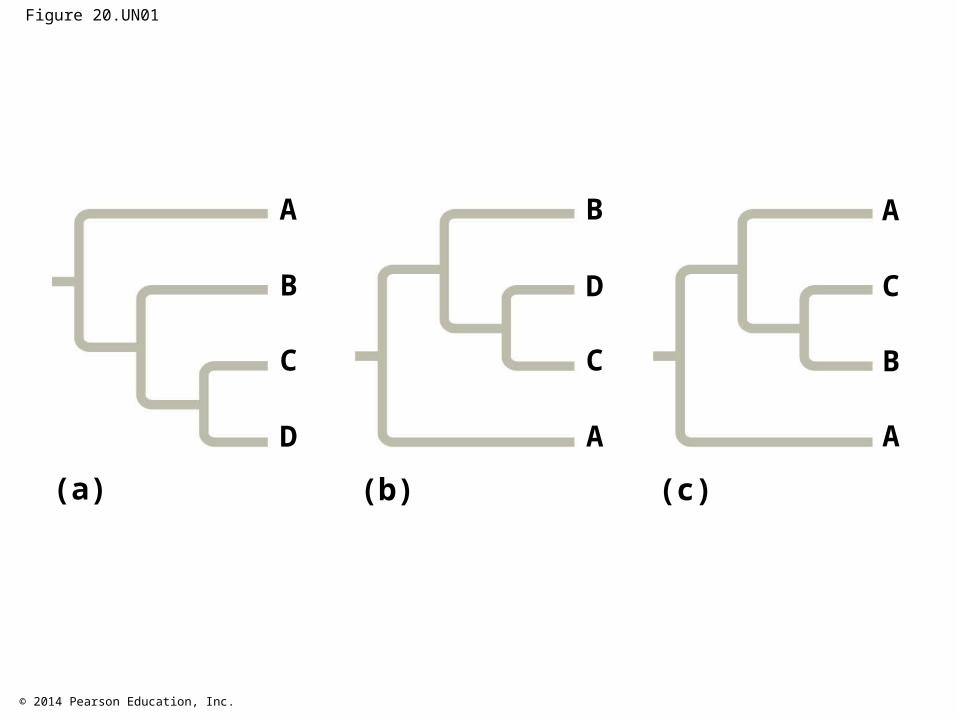
Figure 20.UN01
A
B
C
D
(a)
A
C
B
A
(c)
B
D
C
A
(b)
© 2014 Pearson Education, Inc.
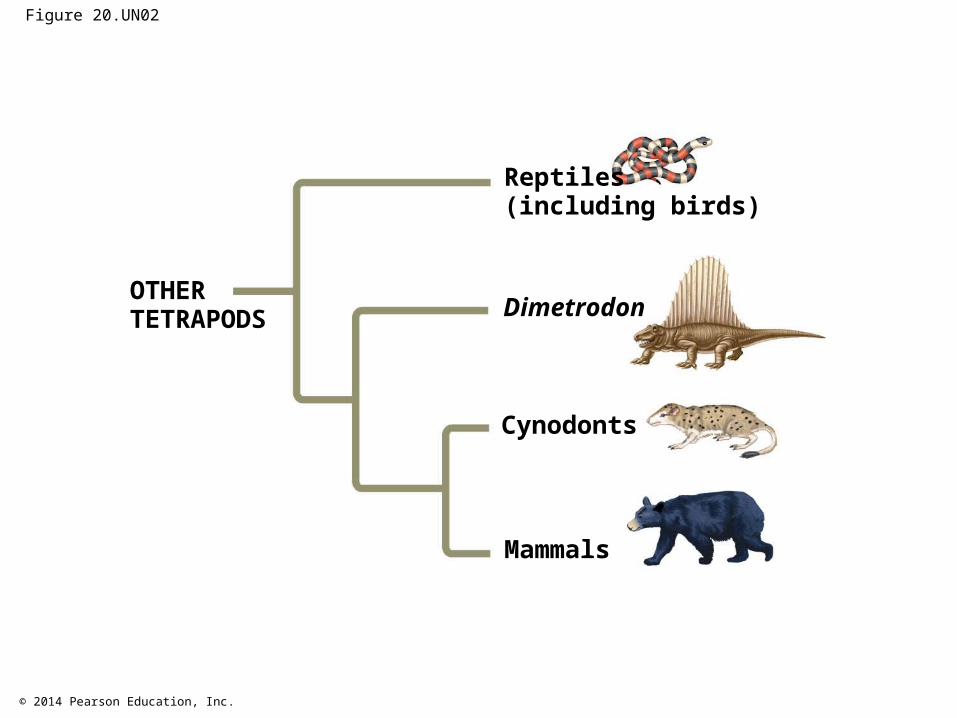
Figure 20.UN02
Reptiles(including birds)
Mammals
Cynodonts
DimetrodonOTHERTETRAPODS
© 2014 Pearson Education, Inc.
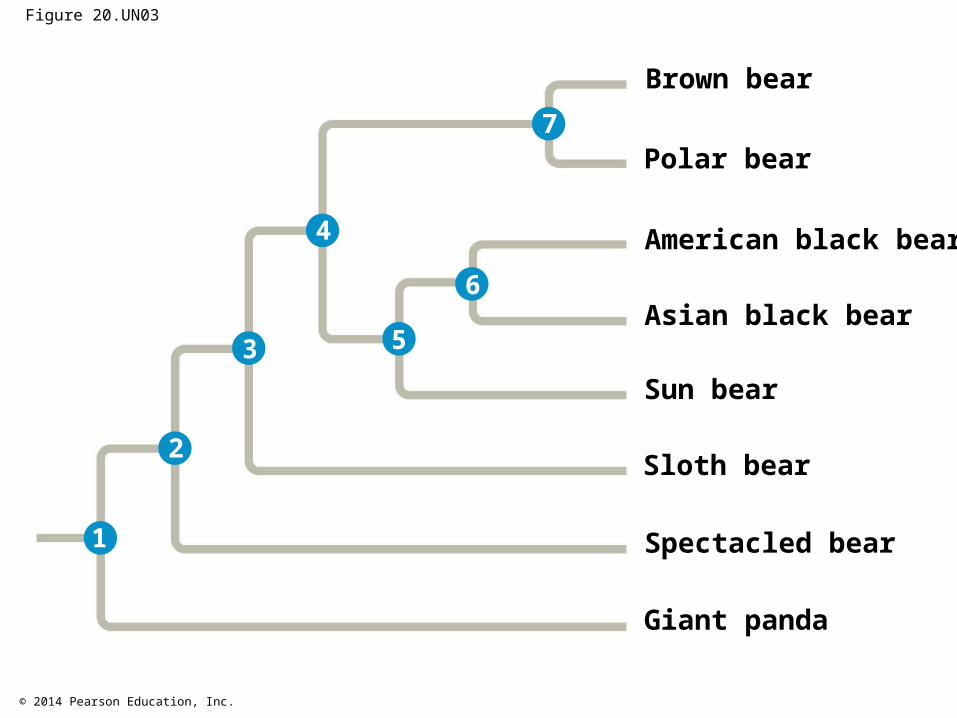
Figure 20.UN03
American black bear
Sun bear
Polar bear
Brown bear
Asian black bear
Sloth bear
Spectacled bear
Giant panda
1
2
3 5
4
6
7
© 2014 Pearson Education, Inc.
Figure 20.UN04
Branch point
Most recentcommonancestor
Polytomy
Sister taxa
Basal taxon
Taxon A
Taxon B
Taxon C
Taxon D
Taxon E
Taxon F
Taxon G
© 2014 Pearson Education, Inc.
Figure 20.UN05
Monophyletic group
Paraphyletic group
Polyphyletic group
A
B
C
D
E
F
G
A
B
C
D
E
F
G
A
B
C
D
E
F
G
© 2014 Pearson Education, Inc.
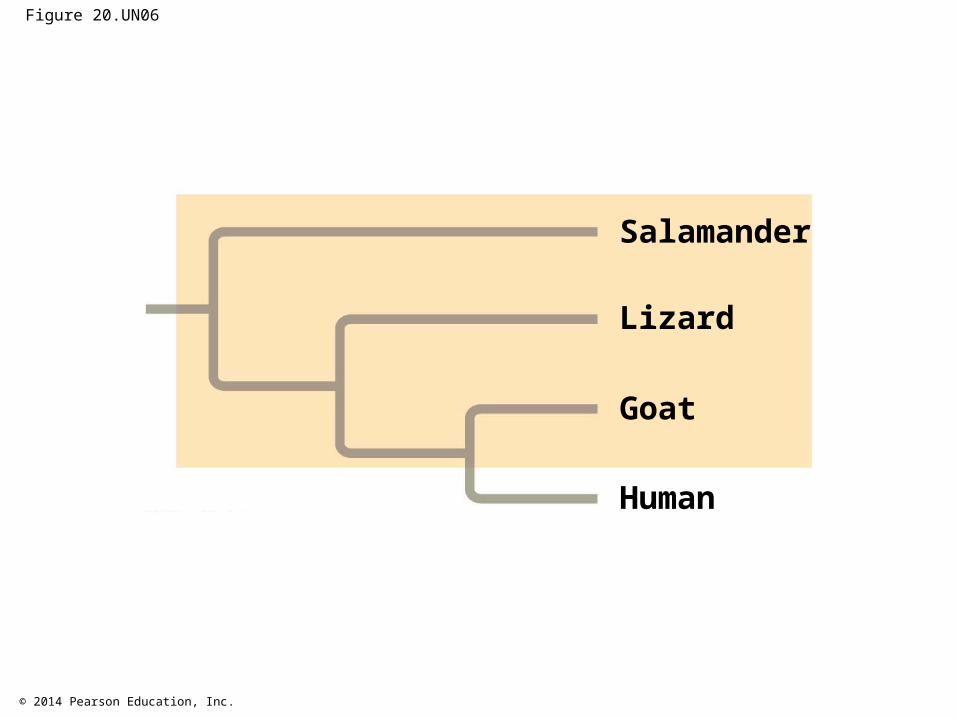
Figure 20.UN06
Salamander
Lizard
Goat
Human
© 2014 Pearson Education, Inc.
Figure 20.UN07