bioluminescence imaging of mitochondrial ca2+ dynamics in soma and neurites of individual adult...
TRANSCRIPT

J Physiol 580.2 (2007) pp 385–395 385
Bioluminescence imaging of mitochondrial Ca2+ dynamicsin soma and neurites of individual adult mousesympathetic neurons
Lucıa Nunez, Laura Senovilla, Sara Sanz-Blasco, Pablo Chamero, Marıa T. Alonso, Carlos Villalobos
and Javier Garcıa-Sancho
Instituto de Biologıa y Genetica Molecular (IBGM), Universidad de Valladolid and Consejo Superior de Investigaciones Cientıficas (CSIC), c/Sanz y
Fores s/n, 47003 Valladolid, Spain
Changes in the cytosolic Ca2+ concentration ([Ca2+]c) are essential for triggering
neurotransmitter release from presynaptic nerve terminals. Calcium-induced Ca2+ release
(CICR) from the endoplasmic reticulum (ER) may amplify the [Ca2+]c signals and facilitate
neurotransmitter release in sympathetic neurons. In adrenal chromaffin cells, functional triads
are formed by voltage-operated Ca2+ channels (VOCCs), CICR sites and mitochondria. In fact,
mitochondria take up most of the Ca2+ load entering the cells and are essential for shaping
[Ca2+]c signals and exocytosis. Here we have investigated the existence of such functional triads in
sympathetic neurons. The mitochondrial Ca2+ concentration ([Ca2+]m) in soma and neurites of
individual mouse superior cervical ganglion (SCG) neurons was monitored by bioluminescence
imaging of targeted aequorins. In soma, Ca2+ entry through VOCCs evoked rapid, near milli-
molar [Ca2+]m increases in a subpopulation of mitochondria containing about 40% of the
aequorin. Caffeine evoked a similar [Ca2+]m increase in a mitochondrial pool containing about
30% of the aequorin and overlapping with the VOCC-sensitive pool. These observations suggest
the existence of functional triads similar to the ones described in chromaffin cells. In neurites,
mitochondria were able to buffer [Ca2+]c increases resulting from activation of VOCCs but
not those mediated by caffeine-induced Ca2+ release from the ER. The weaker Ca2+ buffering
by mitochondria in neurites could contribute to facilitate Ca2+-induced exocytosis at the pre-
synaptic sites.
(Resubmitted 13 December 2006; accepted after revision 18 January 2007; first published online 18 January 2007)
Corresponding author L. Nunez : Instituto de Biologıa y Genetica Molecular (IBGM), Universidad de Valladolid and
CSIC, c/ Sanz y Fores s/n, 47003 Valladolid, Spain. Email: [email protected]
Calcium signals govern important processes inneurons, including neurotransmitter release, membraneexcitability, neurite outgrowth and neurodegeneration(Clapham, 1995; Ghosh & Greenberg, 1995). The cytosolicCa2+ concentration ([Ca2+]c) increases upon activationof plasma membrane Ca2+ channels or Ca2+ releasefrom intracellular stores (Berridge, 1998). In addition,Ca2+ signals can be amplified by release of Ca2+ fromthe endoplasmic reticulum (ER) through Ca2+-inducedCa2+ released (CICR; Thayer et al. 1988; Hernandez-Cruzet al. 1990; Friel & Tsien, 1992), mediated by ryanodinereceptors (RyRs). Cytoplasmic organelles also participatein Ca2+ signalling (Alvarez et al. 1999). It is becomingincreasingly clear that, besides its central role in cellenergetics (Robb-Gaspers et al. 1998), mitochondriamodulate cytosolic Ca2+ homeostasis (Herrington et al.1996). Mitochondria can take up Ca2+ through the
mitochondrial Ca2+ uniporter (Gunter & Pfeiffer, 1990;Kirichok et al. 2004), a high-capacity, low-affinity Ca2+
transport that activates exponentially with the increaseof [Ca2+] in the surrounding cytosol (Gunter & Pfeiffer,1990; Rizzuto et al. 1993; Montero et al. 2000). It hasbeen reported that mitochondria can take up Ca2+
with relatively modest increases of [Ca2+] in the bulkcytosol (Herrington et al. 1996; Villalobos et al. 2002). Inparticular, mitochondria seem able to buffer physiologicalCa2+ loads in neurons, and activation is paralleled bythe increase of mitochondrial calcium concentration([Ca2+]m; Werth & Thayer, 1994; Babcock et al. 1997).This probably results from the generation of subcellularhigh-Ca2+ domains at sites of Ca2+ entry or Ca2+ release(Rizzuto et al. 1993; Xu et al. 1997; Duchen, 1999;Montero et al. 2000), and mitochondrial uptake is muchfaster at these high-Ca2+ microdomains. Thus, Ca2+
C© 2007 The Authors. Journal compilation C© 2007 The Physiological Society DOI: 10.1113/jphysiol.2006.126524

386 L. Nunez and others J Physiol 580.2
uptake by mitochondria is favoured in mitochondrialocated strategically near Ca2+ hot spots, such as themouth of Ca2+ channels or ryanodine and/or inositol1,4,5-trisphosphate (IP3) receptors. We have reportedthat, in chromaffin cells, a subpopulation of mitochondriais strategically and functionally coupled to both Ca2+
entry through voltage-operated Ca2+ channels (VOCCs)and Ca2+ release from intracellular stores, whereas theremaining mitochondria are located far away fromthese Ca2+ hot spots (Montero et al. 2000). The formermitochondrial subpopulation takes up larger Ca2+ loads,approaching millimolar levels, during cell stimulation(Montero et al. 2000; Villalobos et al. 2001). In fact,quantitative analysis of Ca2+ redistribution amongdifferent cytoplasmic compartments in chromaffin cellshas demonstrated that most of the Ca2+ entering throughVOCCs or released from ER by CICR is, in the short term,removed from the cytosol by mitochondria rather thanby the other Ca2+ extruding systems (Villalobos et al.2002). Consistently, prevention of mitochondrial Ca2+
uptake enhanced both the [Ca2+]c rise and exocytosis(Montero et al. 2000). Therefore, strategically locatedmitochondria modulate the [Ca2+]c signals and makepossible the coexistence of high subplasmalemmal Ca2+
levels favouring exocytosis with a much lower [Ca2+]c atthe cell core. This is attained by avoiding spread of theentering Ca2+ load towards the cell core. In addition,intramitochondrial Ca2+ stimulates cellular respirationand tunes ATP synthesis to the increased requirementsduring the active state. The functional units or triadsformed by VOCCs, RyRs and mitochondria seem essentialfor correct organization of the secretory process inadrenal chromaffin cells (Montero et al. 2000). Whethersuch functional units are present in neurons has notbeen investigated, perhaps owing to the difficulty ofmonitoring aequorin bioluminescence in single neurons.Here we combine the superb selectivity of targetedaequorin, the high expression induced by a viral vector(Alonso et al. 1998) and the high sensitivity provided bya photon-counting camera (Frawley et al. 1994; Rutteret al. 1996; Villalobos et al. 2002) to resolve changes of[Ca2+]m at the single-cell level and even at the subcellularlevel (cell body and neurites).
Methods
Primary culture of sympathetic neurons from adultmouse superior cervical ganglion
The cell culture method was a modification of apreviously described protocol (Martınez et al. 2002).Adult (8–12 weeks old) male Balb/c mice were fed adlibitum and maintained under a standard 12 h light–12 hdark photoregime. Experiments were conducted followingthe Guidelines of the Animal Care Committee and the
Commission d’Ethique d’Experimentation Animale of theUniversity of Lovain School of Medicine. Groups of fouror five animals were killed by cervical dislocation andtheir superior cervical ganglia (SCG) rapidly removedunder sterile conditions and transferred to a Petri dishcontaining ice-cold, Ca2+- and Mg2+-free Hank’s balancedsalt solution (HBSS). Ganglia were incubated for 10 minin HBSS containing collagenase (1.6 mg ml−1) at 37◦C,washed and incubated again in HBSS containing trypsin(1 mg ml−1) for 15 min at 37◦C. After gentle mechanicaldisruption with a siliconized, fire-polished Pasteur pipette,the cells were suspended in Dulbecco’s modified Eagle’smedium (DMEM) containing 10% fetal bovine serum(FBS), washed twice and suspended in culture medium(DMEM supplemented with 10% FBS and 50 ng ml−1
of nerve growth factor, NGF). Aliquots of the cellsuspension (25 μl) were plated on poly l-lysine-coated12 mm diameter glass coverslips. On average, we obtainedthe same number of cell-containing coverslips as gangliadispersed. Cells were allowed to attach for 1 h and thenan additional 300 μl of culture medium was added toeach well and culture was continued for 2 days before theexperiments.
Measurements of cytosolic [Ca2+] by fluorescencemicroscopy
The cells were loaded with fura-2 by incubation withfura-2 AM (4 μm) for about 1 h at room temperaturein a standard medium of the following composition(mm): NaCl, 145; KCl, 5; MgCl2, 1; CaCl2, 1; glucose, 10;and sodium-Hepes, 10; pH 7.4 (adjusted with NaCH).Cells were then washed with the same medium, placedin a thermostatically controlled (37◦C) chamber on thestage of an inverted microscope (Nikon Diaphot) andperfused with standard medium, prewarmed at 37◦C.Cells were epi-illuminated alternately at 340 and 380 nm,and light emitted above 520 nm was recorded using aMagical Image processor (Applied Imaging, Newcastle,UK). Pixel-by-pixel ratios of consecutive frames werecaptured, and [Ca2+]c values were estimated from theseratios by comparison with fura-2 standards. Other detailswere as reported previously (Nunez & Garcıa-Sancho,1996; Villalobos et al. 2002).
Expression of aequorins
Mitochondria-targeted wild-type aequorin (mitAEQ) andlow-Ca2+-affinity, mutated aequorin (mitmutAEQ) weredelivered using defective herpes simplex virus type 1(HSV-1) amplicons prepared, packed and titrated aspreviously described (Alonso et al. 1998; Montero et al.2000). The range of Ca2+ sensitivies for these aequorinshas been published elsewhere (Montero et al. 2000).The native aequorin can discriminate different Ca2+
C© 2007 The Authors. Journal compilation C© 2007 The Physiological Society

J Physiol 580.2 Mitochondrial calcium in sympathetic neurons 387
concentrations within the 0.1–10 μm range, whereasthe low-Ca2+-affinity, mutated aequorin can distinguishdifferent Ca2+ concentrations from the tens of micromolarto the low millimolar range when used in combination withcelenterazine n. Cells were infected with 1 × 10³ to 3 × 10³
infectious virus particles per coverslip of the HSV-1containing the corresponding aequorin gene and culturedfor 18 h before measurements. Infection efficiency rangedbetween 50 and 85% (mean ± s.e.m., 67 ± 3%; 120 cellsfrom 18 experiments). The correct targeting of aequorinsto mitochondria has been reported elsewhere (Monteroet al. 2000) and was confirmed here (results not shown).
Imaging of aequorin bioluminescence
Cells expressing the apoaequorins were incubated for1–2 h at room temperature with 1 μm coelenterazine.Coelenterazine n was used in some experiments forreconstitution of the low-Ca2+-affinity mutmitAEQ.Cells were placed into a perfusion chamber thermo-statically regulated to 37◦C under a Zeiss Axiovert 100 TVmicroscope and perfused at 5–10 ml min−1 with thetest solutions, based on the standard perfusing solutiondescribed above, prewarmed at 37◦C. At the end ofeach experiment, cells were permeabilized with 0.1 mm
digitonin in 10 mm CaCl2 to release all the residualaequorin counts. Bioluminescence images were taken witha Hamamatsu VIM photon counting camera handledwith an Argus-20 image processor and integrated for 10 speriods. Photons per cell in each image were quantifiedusing the Hamamatsu Aquacosmos software. Total countsper cell ranged between 2 × 10³ and 2 × 10⁵ and noisewas (mean ± s.d.) 1 ± 1 counts s−1 per typical cell area(2000 pixels). Data were first quantified as rates ofphotoluminescence emission divided by the total countsremaining at each time and divided by the integrationperiod (L/Ltotal in s−1). Emission values of less than4 counts s−1 were not used for calculations. Calibrationsin terms of [Ca2+]m were performed using the constant’svalues published previously (Alvarez & Montero, 2001). Abright field image was also taken at the beginning of eachexperiment. Further details have been reported previously(Villalobos et al. 2001, 2005).
Confocal microscopy
To identify endoplasmic reticulum and mitochondria inliving sympathetic neurons, we first transiently expresseda fused green fluorescent protein (GFP) targeted tothe ER. Endoplasmic reticulum–GFP contain in-framefusion of enhanced green fluorescent protein (EGFP)and a Lys-Asp-Glu-Leu (KDEL) ER retention sequencein the herpes simplex virus plasmid (pHSV) ampliconvector. Expression was achieved by infecting cells witha defective HSV-1 containing the ER–GFP–aequoringene and cultured for 18 h before measurements. Then,
cells were loaded with Mitotracker Red® (200 nm) for30 min at 37◦C and washed with standard incubationmedium. Confocal images were obtained using a Bio-Radlaser scanning system (Radiance 2100) coupled to aNikon eclipse TE2100U inverted microscope with ×63oil immersion objective (N.A. = 1.4). Green fluorescentprotein was excited by the 488 nm laser line and emissionwas collected through a 500–560 nm bandpass filter.
Mitotracker Red® was excited at 543 nm, and emitted lightwas collected through a 590 nm long-pass filter.
Results
In a first series of experiments, we studied the effectsof both Ca2+ entry from the extracellular medium andCa2+ release from the intracellular stores on [Ca2+]m.Calcium entry was induced by stimulation with high-K+
solution, which depolarizes the plasma membrane andopens VOCCs. Calcium release from the ER was inducedby stimulation of the ryanodine receptors with caffeine(Thayer et al. 1988; Hernandez-Cruz et al. 1995). Inall cases, we measured the changes of the [Ca2+]c
using fura-2 (Villalobos et al. 2002) and the changes of[Ca2+]m with different aequorins (Montero et al. 2000).Both measurements were performed in the soma of thesympathetic neurons.
Figure 1 summarizes the effects of repetitive stimulationwith high K+. Use of fura-2 produced reproducibleincreases of [Ca2+]c, whose size varied between 800and 2000 nm from cell to cell (Fig. 1A). In contrast,bioluminescence imaging of mitochondria-targetedaequorin (Montero et al. 2000; Villalobos et al. 2001)produced very different effects for the first stimulationand for subsequent ones (Fig. 1B). Since aequorin isburned out during the high-[Ca2+] periods (Shimomuraet al. 1993; Alvarez & Montero, 2001; Villalobos et al.2001), aequorin consumption provides a realistic recordof what has happened each time, not biased by anycalculation. The first stimulus consumed 44 ± 3% ofthe total photonic emissions (mean ± s.e.m. of 35 cellsin 17 experiments). Aequorin consumption could beprevented by collapsing the mitochondrial membranepotential with the protonophore carbonyl cyanidep-(trifluoromethoxy) phenylhydrazone (FCCP) (data notshown), confirming that it results from mitochondrialCa2+ uptake. The second and subsequent K+ pulsesreleased only 3 ± 1% of the total photons (Fig. 1B). Theremaining photonic emissions could be released easilyby permeabilizing the plasma membrane with digitoninand perfusing these permeabilized cells with solutionscontaining high levels of Ca2+ (> 20 μm; Fig. 1B andresults not shown). The bottom part of Fig. 1B shows thecalibrated [Ca2+]m values. Apparently, the first stimulusproduced a large [Ca2+]m increase, whereas subsequentones had a much smaller effect.
C© 2007 The Authors. Journal compilation C© 2007 The Physiological Society

388 L. Nunez and others J Physiol 580.2
The outcome of these experiments is similar toprevious findings in chromaffin cells (Montero et al. 2000;Villalobos et al. 2002), and we interpret them in terms ofthe existence of two mitochondrial pools with differentspatial locations. The first pool, probably closer to themouth of the Ca2+ channels at the plasma membrane,senses the high [Ca2+] concentrations built up in thehigh-Ca2+ microdomains. These mitochondria take uplarge amounts of Ca2+ that burns up all the aequorinvery quickly during the first stimulus. During subsequentstimuli, this subplasmalemmal mitochondrial pool does
B mitAEQ
[Ca 2+ ]M
in μM
0.02
0.04
0.06
0
L/L
tota
l (s
–1)
K+ K+ K+
0.9
1.9
2.8
4.6
K+ K+ K+
Rem
ain
ing A
EQ
(%
) 80
60
40
20
0
100 2 min
Digitonin
A Fura-2
K+ K+ K+
2 min
1600
2000
1200
800
400
0
Cyto
solic
Calc
ium
(nM
)
0
0.002
0.004
0.006
0.008
0.010 1 min
33
60
130
280
K+K+
L/L
tota
l (s
–1)
C mitmutAEQ[Ca 2+ ]
M in μM
Figure 1. Effects of repeated stimulation of sympathetic neurons by depolarization with high K+ oncytosolic and mitochondrial [Ca2+]Cells were repeatedly stimulated by perfusion with high K+ solution (150 mM; 10 s pulses every 2 min).A, sympathetic neurons loaded with fura-2. [Ca2+]c traces from two representative neurons (large and smallresponse) are shown. Sixty-four consecutive fura-2 fluorescence images taken at either 340 or 380 nm excitationwere captured, averaged and ratioed by hardware every 5 s. The image size was 256 × 256 pixels and the spatialresolution was 1 μm per pixel. Results are representative of 15 similar experiments. B, sympathetic neurons infectedwith mitAEQ and subjected to photon counting imaging. The upper traces show AEQ consumption in tworepresentative neurons (large and small response), and open circles show the average value of 7 neurons present inthe same microscopic field. The lower traces show calibrated signals (two single cells) from the same experiment.Data are representative of 17 similar experiments. C, sympathetic neurons were infected with mitmutAEQ andreconstituted with coelenterazine n (the low-Ca2+-affinity system; see Methods). Data were corrected for the poolsize (44% of the total AEQ counts). The traces corresponding to two extreme individual cells (large and smallresponse) and the average of 5 cells present in the same microscope field (open circles) are shown. Only photo-nic emissions from the neuron cell body were counted for quantification of [Ca2+]m. Data are representative of7 similar experiments.
not emit photoluminescence because all the aequorincontained therein was burned during the first stimulus.The second mitochondrial pool is closer to the cell coreand would sense smaller [Ca2+]c increases, of the sameorder of magnitude as the ‘averaged’ values found usingfura-2. These mitochondria take up smaller amounts ofCa2+ and emit a much weaker photoluminescence signal,which is concealed during the first stimulus by the signalcoming from the first mitocondrial pool. During thesecond and third stimuli, when all the aequorin fromthe first mitochondrial pool has burned out, the smaller
C© 2007 The Authors. Journal compilation C© 2007 The Physiological Society
J Physiol 580.2 Mitochondrial calcium in sympathetic neurons 389
signals coming from the core mitochondria show up(Fig. 1B).
In order to test the validity of this interpretation,we studied the effects of the same sequential stimuliin cells expressing mitmutAEQ reconstituted withcoelenterazine n. This low-Ca2+-affinity aequorin(Montero et al. 2000) would not be burned outcompletely during the first stimulus, and should thenreport the real and reproducible [Ca2+]m responses torepetitive stimuli. Confirmation of this prediction isshown in Fig. 1C. This panel shows the calibrated [Ca2+]m
recordings of two representative individual cells (the oneswith the strongest and the smallest response) and theaverage value of five cells present in the same microscopicfield. Note that the responses were similar during the firstand second stimuli, reaching [Ca2+]m values that rangedbetween 100 and 300 μm. Note also that at such high Ca2+
concentrations the wild-type aequorin would be fullyburned within a few seconds, since the half-consumptiontime is below 1 s at these saturating Ca2+ concentrations(Shimomura et al. 1993; Alvarez & Montero, 2001). The[Ca2+]m peaks reached in the core mitochondrial pool,as shown by the wild-type aequorin during the secondand the third high-K+ stimuli, were much smaller (about1 μm; Fig. 1B) and therefore should not be sensed by thelow-Ca2+-affinity mutmitAEQ.
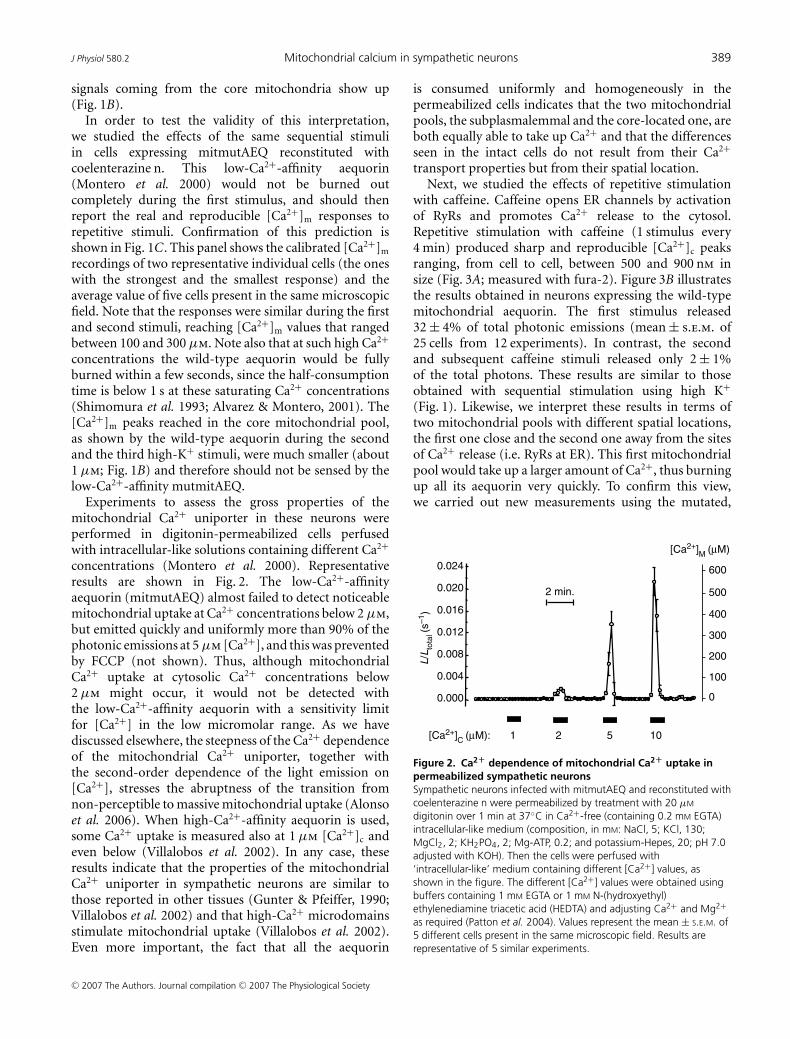
Experiments to assess the gross properties of themitochondrial Ca2+ uniporter in these neurons wereperformed in digitonin-permeabilized cells perfusedwith intracellular-like solutions containing different Ca2+
concentrations (Montero et al. 2000). Representativeresults are shown in Fig. 2. The low-Ca2+-affinityaequorin (mitmutAEQ) almost failed to detect noticeablemitochondrial uptake at Ca2+ concentrations below 2 μm,but emitted quickly and uniformly more than 90% of thephotonic emissions at 5 μm [Ca2+], and this was preventedby FCCP (not shown). Thus, although mitochondrialCa2+ uptake at cytosolic Ca2+ concentrations below2 μm might occur, it would not be detected withthe low-Ca2+-affinity aequorin with a sensitivity limitfor [Ca2+] in the low micromolar range. As we havediscussed elsewhere, the steepness of the Ca2+ dependenceof the mitochondrial Ca2+ uniporter, together withthe second-order dependence of the light emission on[Ca2+], stresses the abruptness of the transition fromnon-perceptible to massive mitochondrial uptake (Alonsoet al. 2006). When high-Ca2+-affinity aequorin is used,some Ca2+ uptake is measured also at 1 μm [Ca2+]c andeven below (Villalobos et al. 2002). In any case, theseresults indicate that the properties of the mitochondrialCa2+ uniporter in sympathetic neurons are similar tothose reported in other tissues (Gunter & Pfeiffer, 1990;Villalobos et al. 2002) and that high-Ca2+ microdomainsstimulate mitochondrial uptake (Villalobos et al. 2002).Even more important, the fact that all the aequorin
is consumed uniformly and homogeneously in thepermeabilized cells indicates that the two mitochondrialpools, the subplasmalemmal and the core-located one, areboth equally able to take up Ca2+ and that the differencesseen in the intact cells do not result from their Ca2+
transport properties but from their spatial location.Next, we studied the effects of repetitive stimulation
with caffeine. Caffeine opens ER channels by activationof RyRs and promotes Ca2+ release to the cytosol.Repetitive stimulation with caffeine (1 stimulus every4 min) produced sharp and reproducible [Ca2+]c peaksranging, from cell to cell, between 500 and 900 nm insize (Fig. 3A; measured with fura-2). Figure 3B illustratesthe results obtained in neurons expressing the wild-typemitochondrial aequorin. The first stimulus released32 ± 4% of total photonic emissions (mean ± s.e.m. of25 cells from 12 experiments). In contrast, the secondand subsequent caffeine stimuli released only 2 ± 1%of the total photons. These results are similar to thoseobtained with sequential stimulation using high K+
(Fig. 1). Likewise, we interpret these results in terms oftwo mitochondrial pools with different spatial locations,the first one close and the second one away from the sitesof Ca2+ release (i.e. RyRs at ER). This first mitochondrialpool would take up a larger amount of Ca2+, thus burningup all its aequorin very quickly. To confirm this view,we carried out new measurements using the mutated,
0.000
0.004
0.008
0.012
0.016
0.020
0.024
L/L
tota
l (s
–1)
[Ca2+]C
(μM): 1 2 5 10
2 min.
[Ca2+]M
(μM)
600
500
400
300
200
100
0
Figure 2. Ca2+ dependence of mitochondrial Ca2+ uptake inpermeabilized sympathetic neuronsSympathetic neurons infected with mitmutAEQ and reconstituted withcoelenterazine n were permeabilized by treatment with 20 μM
digitonin over 1 min at 37◦C in Ca2+-free (containing 0.2 mM EGTA)intracellular-like medium (composition, in mM: NaCl, 5; KCl, 130;MgCl2, 2; KH2PO4, 2; Mg-ATP, 0.2; and potassium-Hepes, 20; pH 7.0adjusted with KOH). Then the cells were perfused with‘intracellular-like’ medium containing different [Ca2+] values, asshown in the figure. The different [Ca2+] values were obtained usingbuffers containing 1 mM EGTA or 1 mM N-(hydroxyethyl)ethylenediamine triacetic acid (HEDTA) and adjusting Ca2+ and Mg2+as required (Patton et al. 2004). Values represent the mean ± S.E.M. of5 different cells present in the same microscopic field. Results arerepresentative of 5 similar experiments.
C© 2007 The Authors. Journal compilation C© 2007 The Physiological Society

390 L. Nunez and others J Physiol 580.2
low-Ca2+-affinity aequorin (mitmutAEQ reconstitutedwith coelenterazine n). Figure 3C shows that now eachcaffeine stimulus produced a similar output that, oncecorrected for the pool size (32%), revealed an increase of[Ca2+]m of about 150 μm, a value close to the one achievedin the mitochondria sensing the VOCCs upon high-K+
stimulation. These results suggest that Ca2+ releasefrom ER by activation of ryanodine receptors generatessubcellular high-[Ca2+] microdomains that are sensedonly by a subpopulation of mitochondria, while theremainder sense much smaller Ca2+ concentrations.
We then asked whether the pool of mitochondriathat sense Ca2+ entry and the one sensing Ca2+ releaseis the same or a different pool. To this end, neuronsexpressing the high-Ca2+-affinity mitochondrial aequorinwere subjected to photon counting imaging for [Ca2+]m
measurements after sequential stimulation, first with highK+ and then with caffeine (Fig. 4A) or the same stimuli inthe reverse order (Fig. 4B). After stimulation with high K+
the effects of caffeine on mitAEQ consumption were verysmall, only 6 ± 1% of all the photons (mean ± s.e.m. of17 cells from 7 experiments; Fig. 4A). When the protocol
1 min
C mitmutAEQ
L/L
tota
l (s
–1)
0.001
0
0.002
0.003
0.004
0.005
Cf Cf
33
60
180
[Ca 2+ ]M
in μM
0
200
400
600
800
1000
2 min
CfCfCf
Cyto
solic
Calc
ium
in n
M
A Fura-2
0
0.02
0.04
0.06
CfCfCf
[Ca 2+ ]M
in μM
2 min
0
20
40
60
80
100
CfCfCf
L/L
tota
l (s
–1)
0.9
1.9
2.8
4.6
Rem
ain
ing A
EQ
(%
)
Digitonin
B mitmutAEQ
Figure 3. Effects of repeated stimulation with caffeine on [Ca2+]c and [Ca2+]m
Sympathetic neurons were repeatedly stimulated with caffeine (Cf; 50 mM for 10 s every 4 min). A, effects on[Ca2+]c measured with fura-2. Data are representative of 16 similar experiments. B, effects on [Ca2+]m measuredwith mitAEQ (high-Ca2+-affinity system). Data are representative of 12 similar experiments. C, effect on [Ca2+]mmeasured with mutmitAEQ and coelenterazine n (low-Ca2+-affinity system). Data are representative of 6 similarexperiments. Other details as in Fig. 1.
was performed in the reverse order, first stimulation withcaffeine and then with high K+, the consumption duringthe first K+ stimulus was only 15 ± 2% of the total counts(21 cells in 12 experiments; Fig. 4B). This value is largerthan with caffeine, but still much smaller than the oneof about 40% obtained during the first stimulation withhigh K+ when there was not previous stimulation withcaffeine (Figs 1B and 4A). These results indicate thatthe subpopulation of mitochondria sensing the plasmamembrane Ca2+ entry and the ER Ca2+ release have a largedegree of overlap.
All the above observations refer to the mitochondrialocated in the soma. We then asked whether mitochondrialocated in the neurites would behave in a similarmanner. To this end, we collected photonic emissionssimultaneously in both neurites and soma of sympatheticneurons subjected to stimulation with high K+ and/orcaffeine. Figure 5A summarizes the effects on [Ca2+]c,measured with fura-2. The [Ca2+]c increase induced byhigh K+ was similar in soma and neurites (Fig. 5A, K+
panel, and results not shown). Interestingly, the size ofthe [Ca2+]c increases induced by caffeine was significantly
C© 2007 The Authors. Journal compilation C© 2007 The Physiological Society

J Physiol 580.2 Mitochondrial calcium in sympathetic neurons 391
larger in the neurites than in the soma (Fig. 5A, Caff paneland recordings). In four independent experiments, themean �[Ca2+]c values obtained after stimulation withcaffeine were (mean ± s.e.m. of 6 cells) 325 ± 8 nm inthe soma and 435 ± 27 nm in the neurites, respectively.The differences were statistically significant (P < 0.05;Student’s paired t test). However, the duration of the peakand the rates of [Ca2+]c increase and decline were similarin the neurites and the soma.
In another set of experiments, the effects of sequentialand repetitive stimulation with high K+ and caffeine on[Ca2+]m were measured using the mitochondrial aequorin(Fig. 5B). The outcome with high K+ was not surprising.As already shown for the soma in another experiment(Fig. 3B), the second and third stimuli were scarcelyeffective, and previous stimulation with K+ ‘occluded’ thefurther effect of caffeine. The behaviour in the neurites inresponse to stimulation with high K+ was similar (Fig. 5B).The results with caffeine were, however, most unexpected,since the effect of caffeine on [Ca2+]m was much smallerin the neurites than in the soma (Fig. 5B). Taken together,these results indicate that mitochondria in neurites arescarcely able to take up and buffer the Ca2+ releasedfrom the ER, even though they efficiently buffer the Ca2+
entering though VOCCs.Finally, we attempted to quantify the relative contents
of mitochondria and ER in both soma and neurites.
A
L/L
tota
l (s
–1)
CfCfCfK+ K+ K+
0
0.02
0.04
0.06
0.08
2 min
0
20
40
60
80
100
B
L/L
tota
l (s
–1)
CfCfCf K+ K+ K+
0.06
0.05
0.04
0.03
0.02
0.01
0
2 min
0
20
40
60
80
100
[Ca2+ ]M
in μM
1.9
2.8
4.6
[Ca2+ ]M
in μM
4.6
2.8
1.9
0.90.9
Rem
ain
ing A
EQ
(%
)
Rem
ain
ing A
EQ
(%
)
DigitoninDigitonin
CfCfCfK+ K+ K+ CfCfCf K+ K+ K+
Figure 4. Overlap between the mitochondrial pools sensing Ca2+ entry through the plasma membraneand Ca2+ release from ERSympathetic neurons expressing the high-Ca2+-affinity mitAEQ were repeatedly stimulated first with high K+ andthen with caffeine (Cf; A) or first with caffeine and then with high K+ (B), as shown. The upper traces showaequorin consumption and lower traces show the calibrated signal. Values obtained in two extreme cells (largeand small responses) and the average of all the cells present in the same microscope fields (circles) are shown. Dataare representative of 7 (A) and 12 independent experiments (B).
To this end, sympathetic neurons were infected with adefective HSV-1 virus containing ER-targeted GFP. After18 h of culture, these cells were loaded with MitotrackerRed® to selectively stain mitochondria and analysedby double-channel laser scanning confocal fluorescencemicroscopy (Fig. 5C). The amount of mitochondriarelative to ER in both soma and neurites was quantified by
dividing the Mitotracker Red® fluorescence signal comingfrom mitochondria by the green GFP fluorescence comingfrom the ER. The first two images in Fig. 5C show thelabelling of mitochondria and ER, respectively, in two serial1 μm optical sections (data representative of 18 cells).Mitochondria and ER were present in both the somaand the neurites. These results are in agreement withthe ability to release aequorin photonic emissions frommitochondria-targeted aequorin both in the soma and inthe neurites. The presence of ER at both locations, somaand neurites, is consistent with the ability of caffeine toincrease [Ca2+]c at both locations (Fig. 5A). The relativeabundance of mitochondria and ER in soma and neuriteswas, however, not uniform. Mitochondria seemed to bemore abundant in neurites, as shown by the more extensivered labelling at this location (see merged image in Fig. 5C).The average of red/green fluorescence ratio in soma andneurites in 10 independent experiments is summarized inthe bar graph in Fig. 5C. The values have been normalizedfor each neuron with regard to the value in the soma. On
C© 2007 The Authors. Journal compilation C© 2007 The Physiological Society

392 L. Nunez and others J Physiol 580.2
average, the mitochondria/ER ratio in the neurites wasalmost twice as large as in the soma (P < 0.001).
Discussion
Single-cell photon counting imaging of targeted aequorinsreveals that mitochondria take up large amounts of Ca2+
CaffK+
CfCfCfK K K
0
20
40
60
80
100
Rem
ain
ing A
EQ
(%
)
B mitAEQ
0
20
40
60
80
100
2 min
Neurite
Soma
CfCfCf K K K
Rem
ain
ing A
EQ
(%
)
Soma
Neurite
2 min
A Fura-2
Soma
Neurite
Cyto
solic
Calc
ium
in n
M
0
200
400
600 2 min
Cf Cf Cf
CaffK+ 800
0
Mitochondria E.R. Merge
C Distribution of mitochondria and endoplasmic reticulum
Mitochondria
/ER
(%
)
020406080
100120140160
200180
SO
MA
NE
UR
ITE
S
Figure 5. Differential effects of stimulation with high K+ and caffeine in the cell body and the neuritesA, effects on [Ca2+]c measured with fura-2 as described in Methods. Sixty-four 256 × 256 pixel images at alternateexcitation wavelengths (340 and 380 nm) were averaged and ratioed by hardware every 5 s. Spatial resolution wasof 1 μm per pixel. Results are representative of 4 similar experiments. B, effects on [Ca2+]m measured with mitAEQ(high-Ca2+-affinity system). The first high-K+ stimulation released 37 ± 4% of the total photonic emissions inneurites; the second and subsequent stimuli released 3 ± 1% (mean ± S.E.M. of 20 cells from 15 experiments). Thefirst caffeine stimulus induced a very small aequorin consumption in neurites (5 ± 1% of total photonic emissions;mean ± S.E.M. of 22 cells from 16 experiments); the subsequent stimulation with high K+ consumed 21 ± 2% ofaequorin. Regions of interest for measurements were defined selectively either in soma or neurites. Other detailsare as in Figs 1 and 2. C, analysis of relative content of mitochondria and ER in soma and neurites of sympathetic
neurons. A sample of confocal slicing of a neuron expressing ER-GFP (green) and loaded with Mitotracker Red®
(red) and the merged image are shown. The right-hand panel compares the contents of soma and neurites for12 neurons (mean ± S.E.M.). The values are expressed as mitochondria/ER ratio and were normalized to 100% forthe soma content in each case (∗P < 0.001). Bars in images represent 10 μM.
during stimulation of mouse sympathetic neurons. Sincemitochondrial aequorin is consumed when [Ca2+]m
increases, the history of the different mitochondrial poolsthat contribute to Ca2+ accumulation during repetitivestimulation could be traced (Montero et al. 2000;Villalobos et al. 2002). As in chromaffin cells (Montero
C© 2007 The Authors. Journal compilation C© 2007 The Physiological Society

J Physiol 580.2 Mitochondrial calcium in sympathetic neurons 393
et al. 2000), most of the Ca2+ uptake takes place in asubpopulation of mitochondria, probably the ones closestto the sites of Ca2+ entry or Ca2+ release. The applicabledimensions have been estimated between 0.2 and 2 μmin adrenal chromaffin cells (Villalobos et al. 2002). Thesemitochondria would sense Ca2+ microdomains in whichhigh enough concentrations are achieved to activate thelow-affinity mitochondrial Ca2+ uniporter for fasttransport inside the mitochondrial matrix. Theprogression of the Ca2+ wave towards the cell coreis effectively shielded by this mitochondrial pool insuch a way that the other mitochondrial pool sensesand takes up much smaller amounts of Ca2+ (Figs 1and 3). These results agree with previous studies usingX-ray microanalysis, in which stimulated and rapidlyfrozen frog sympathetic neurons contained two differentsubpopulations of mitochondria with different Ca2+
levels (Pivovarova et al. 1999). This black and white viewis somewhat artificial. A continuum of mitochondriawith different Ca2+ uptakes must exist, but the transitionbetween both ends of the population must be extremelysteep because the rate of mitochondrial Ca2+ uptakedepends exponentially on [Ca2+]c (Gunter & Pfeiffer,1990; Rizzuto et al. 1993; Montero et al. 2000). Thisreal bimodality is further exaggerated by aequorin,whose luminescence emission also depends exponentiallyon [Ca2+] (Alonso et al. 2006). Thus, the low-affinityaequorin system senses almost exclusively the high-Ca2+
mitochondrial pool, whereas the high-affinity aequorinsystem is quickly burned in this pool and, after awhile, only detects the low-Ca2+ mitochondrial pool.In this way, by buffering the Ca2+ load, mitochondriacan shape the cytosolic Ca2+ signal and exocytosis(Herrington et al. 1996; Montero et al. 2000; Friel, 2000;Villalobos et al. 2002; David & Barrett, 2003). Previousobservations showing that mitochondrial depolarization,a manoeuvre that limits mitochondrial Ca2+ uptake,results in increased [Ca2+]c spikes induced by electricstimulation in sympathetic neurons (Peng, 1998; Friel,2000) are consistent with this view. The mitochondrialpool sensing Ca2+ entry through VOCCs overlapped withthe one that accumulated Ca2+ after Ca2+ release throughRyRs. These results suggest that, as in chromaffin cells(Montero et al. 2000), plasma membrane channels, ERrelease sites and mitochondria group spatially in triads orfunctional units that activate jointly, regardless of whetherthe Ca2+ originates extra- or intracellularly. Consistentwith this view, local Ca2+ release events evoked by lowcaffeine concentrations have recently been reported totake place near the plasma membrane in the soma ofsuperior cervical ganglion neurons (Yao et al. 2006).
It has been proposed that, in addition to Ca2+ fluxesthrough Ca2+ channels at the plasma membrane orthe ER, other modulatory processes may contributeto generate Ca2+ signals with specific spatial location
(Johenning et al. 2002). In dorsal root ganglion (DRG)neurons, mitochondria seem to buffer Ca2+ enteringthrough plasmalemmal channels more efficiently thanCa2+ released from the ER (Svichar et al. 1997). Wehave investigated here whether redistribution of Ca2+
among different subcellular compartments is similarin the soma and neurites inside single sympatheticneurons. Our bioluminescence imaging approach enablesphotonic emissions from mitochondria in soma andneurites to be dissected. As in the soma, the behaviour inneurites was not homogeneous with regard to VOCCs, andwe identified two different populations of mitochondria.One pool accumulated large amounts of Ca2+, whereasthe other took up much smaller amounts. In contrast,the mitochondria in neurites differed from those in thesoma in that they were not able to sense Ca2+ releaseinduced by caffeine, as revealed by the high-Ca2+-affinityaequorin (Fig. 5B). This did not result from a lack ofRyRs in neurites, since caffeine was able to increase[Ca2+]c at this location (Fig. 5A), and previous reportshave also demonstrated the presence of functional RyRs inthe presynaptic terminals of sympathetic neurons (Peng,1996). In contrast, ER-directed GFP was also expressed inneurites (Fig. 5C). Thus, even though mitochondria aremore abundant in neurites than in the soma (Fig. 5C),mitochondria in neurites are more loosely coupled to ERand do not efficiently buffer the Ca2+ released throughRyRs. This may explain why the [Ca2+]c signal inducedby caffeine is larger in the neurites than in the soma(Fig. 5A). Interestingly, other authors have also reportedthat Ca2+ signals may be larger in neurites than in thesoma in a variety of cell models (Svichar et al. 1997;Koizumi et al. 1999; Johenning et al. 2002; Yao et al.2006). For example, interference of mitochondrial Ca2+
uptake with carbonyl cyanide m-chlorophenylhyrazone(CCCP) modulated [Ca2+]c transients induced by Ca2+
entry through VOCC channels, but not those resultingfrom caffeine-induced release of Ca2+ from ER in DRGneurons (Svichar et al. 1997). In addition, the somatic Ca2+
response to carbachol in differentiated PC12 cells displayeda much shallower slope and smaller amplitude than theresponse obtained in the neurites (Johenning et al. 2002).These differences were not attributable to differences inthe Ca2+ contents of the ER in the neurites and soma,and the authors suggested that additional, unrecognizedmodulatory processes are necessary to generate spatiallyspecific calcium signals. Global Ca2+ signals in neuronsare made of elementary signals, which have been studied ingreat detail in both differentiated PC12 cells (Koizumi et al.1999) and superior cervical ganglion neurons (Yao et al.2006). In fact, the so-called elementary events (Ca2+ sparksand glows) were reported to be larger and more frequentin the neurites than in the soma of these neurons (Yaoet al. 2006). The larger responses of these neurites couldbe at least partly explained by the smaller Ca2+-buffering
C© 2007 The Authors. Journal compilation C© 2007 The Physiological Society

394 L. Nunez and others J Physiol 580.2
capacity of the mitochondria in the neurites. Our dataare consistent with previous suggestions (Svichar et al.1997) attributing the smaller buffering capacity to peculiarlocalization of mitochondria, far away from the ER releasesites, rather than to functional differences in Ca2+ handlingby the mitochondrial uniporter. Calcium-induced Ca2+
release is believed to play an important role in theaction potential-evoked release of neurotransmitter inpostganglionic sympathetic nerve terminals (Smith &Cunnane, 1996) and presynaptic neuromuscular terminals(Narita et al. 2000). We can speculate that the lackof mitochondria close enough to ER could result inlocal higher [Ca2+]c increases at the synaptic sites. Thus,strategic location of mitochondria may shape cytosolicCa2+ signals differentially in soma and neurites.
References
Alonso MT, Barrero MJ, Carnicero E, Montero M,Garcıa-Sancho J & Alvarez J (1998). Functionalmeasurements of [Ca2+] in the endoplasmic reticulum usinga herpes virus to deliver targeted aequorin. Cell Calcium 24,87–96.
Alonso MT, Villalobos C, Chamero P, Alvarez J &Garcıa-Sancho J (2006). Calcium microdomains inmitochondria and nucleus. Cell Calcium 40, 513–525.
Alvarez J & Montero M (2001). Ca2+ measurements withluminescent proteins in the endoplasmic reticulum. InMeasuring Calcium and Calmodulin Inside and Outside Cells,Springer Laboratory Manual,, ed. Petersen OH, pp. 147–163.Springer Verlag Berlin.
Alvarez J, Montero M & Garcıa-Sancho J (1999). SubcellularCa2+ dynamics. News Physiol Sci 14, 161–168.
Babcock DF, Herrington J, Park YB & Hille B (1997).Mitochondrial participation in the intracellular Ca2+network. J Cell Biol 136, 833–843.
Berridge MJ (1998). Neuronal calcium signaling. Neuron 21,13–26.
Clapham DE (1995). Calcium signaling. Cell 80, 259–268.David G & Barrett EF (2003). Mitochondrial Ca2+ uptake
prevents desynchronization of quantal release and minimizesdepletion during repetitive stimulation of mouse motornerve terminals. J Physiol 548, 425–438.
Duchen MR (1999). Contributions of mitochondria to animalphysiology: from homeostatic sensor to calcium signalingand cell death. J Physiol 516, 1–17.
Frawley LS, Faught WJ, Nicholson J & Moomaw B (1994). Realtime measurement of gene expression in living endocrinecells. Endocrinology 135, 468–471.
Friel DD (2000). Mitochondria as regulators of stimulus-evoked calcium signals in neurons. Cell Calcium 28, 307–316.
Friel DD & Tsien RW (1992). A caffeine- and ryanodine-sensitive Ca2+ store in bullfrog sympathetic neuronsmodulates effects of Ca2+ entry on [Ca2+]. J Physiol 450,217–246.
Ghosh A & Greenberg ME (1995). Calcium signaling inneurons: molecular mechanisms and cellular consequences.Science 268, 239–247.
Gunter TE & Pfeiffer DR (1990). Mechanisms by whichmitochondria transport calcium. Am J Physiol Cell Physiol258, C755–C786.
Hernandez-Cruz A, Dıaz-Munoz M, Gomez-Chavarin M,Canedo-Merino R, Protti DA, Escobar AL, Sierralta J &Suarez-Isla BA (1995). Properties of the ryanodine-sensitiverelease channels that underlie caffeine-induced Ca2+mobilization from intracellular stores in mammaliansympathetic neurons. Eur J Neurosci 7, 1684–1699.
Hernandez-Cruz A, Sala F & Adams PR (1990). SubcellularCa2+ transients visualizad by confocal microscopy in avoltage-clamped vertebrate neuron. Science 247, 858–862.
Herrington J, Park YB, Babcock DF & Hille B (1996).Dominant role of mitochondria in clearance of large Ca2+loads from rat adrenal chromaffin cells. Neuron 16,219–228.
Johenning FW, Zochowski M, Conway SJ, Holmes AB, KoulenP & Ehrlich BE (2002). Distinct intracellular calciumtransients in neurites and somata integrate neuronal signals.J Neurosci 22, 5344–5353.
Kirichok Y, Krapivinsky G & Clapham DE (2004). Themitochondrial calcium uniporter is a highly selective ionchannel. Nature 427, 360–364.
Koizumi S, Bootman MD, Bobanovic LK, Schell MJ, BerridgeMJ & Lipp P (1999). Characterization of elementary Ca2+release signals in NGF-differentiated PC12 cells andhippocampal neurons. Neuron 22, 125–137.
Martınez JA, Lamas JA & Gallego R (2002). Calcium currentcomponents in intact and dissociated adult mousesympathetic neurons. Brain Res 951, 227–236.
Montero M, Alonso MT, Carnicero E, Cuchillo-Ibanez I,Albillos A, Garcıa AA, Garcıa-Sancho J & Alvarez J (2000).Chromaffin-cell stimulation triggers fast millimolarmitochondrial Ca2+ transients that modulate secretion.Nature Cell Biol 2, 57–61.
Narita K, Akita T, Hachisuka J, Huang S, Ochi K & Kuba K(2000). Functional coupling of Ca2+ channels to ryanodinereceptors at presynaptic terminals. Amplification ofexocytosis and plasticity. J Gen Physiol 115, 519–532.
Nunez L & Garcıa-Sancho J (1996). Two different constituentsof plasma increase cytosolic calcium selectively in neurons orglia of primary rat cerebellar cultures. J Physiol 490, 577–583.
Patton C, Thompson S & Epel D (2004). Some precautions inusing chelators to buffer metals in biological solutions. CellCalcium 35, 427–431.
Peng Y (1996). Ryanodine-sensitive component of calciumtransients evoked by nerve firing at presynaptic nerveterminals. J Neurosci 16, 6703–6712.
Peng YY (1998). Effects of mitochondrion on calciumtransients at intact presynaptic terminals depend onfrequency of nerve firing. J Neurophysiol 80, 186–195.
Pivovarova NB, Hongpaisan J, Andrews SB & Friel DD (1999).Depolarization-induced mitochondrial Ca2+ accumulationin sympathetic neurons: spatial and temporal characteristics.J Neurosci 19, 6372–6384.
Rizzuto R, Brini M, Murgia M & Pozzan T (1993).Microdomains with high Ca2+ close to IP3-sensitivechannels that are sensed by neighboring mitochondria.Science 262, 744–747.
C© 2007 The Authors. Journal compilation C© 2007 The Physiological Society

J Physiol 580.2 Mitochondrial calcium in sympathetic neurons 395
Robb-Gaspers LD, Burnett P, Rutter GA, Denton RM, RizzutoR & Thomas AP (1998). Integrating cytosolic calcium signalsinto mitochondrial metabolic responses. EMBO J 17,4987–5000.
Rutter GA, Burnett P, Rizzuto R, Brini M, Murgia M, Pozzan T,Tavare JM & Denton RM (1996). Subcellular imaging ofintramitochondrial Ca2+ with recombinant targetedaequorin: significance for the regulation of pyruvatedehydrogenase activity. Proc Natl Acad Sci U S A 93,5489–5494.
Shimomura O, Musicki B, Kishi Y & Inouye S (1993).Light-emitting properties of recombinant semi-syntheticaequorins and recombinant fluorescein-conjugatedaequorin for measuring cellular calcium. Cell Calcium 14,373–378.
Smith AB & Cunnane TC (1996). Ryanodine-sensitive calciumstores involved in neurotransmitter release from sympatheticnerve terminals of the guinea-pig. J Physiol 497, 657–664.
Svichar N, Kostyuk P & Verkhratsky A (1997). Mitochondriabuffer Ca2+ entry but not intracellular Ca2+ release in mouseDRG neurons. Neuroreport 8, 3929–3932.
Thayer SA, Hirning LD & Miller RJ (1988). The role ofcaffeine-sensitive calcium stores in the regulation of theintracellular free calcium concentration in rat sympatheticneurons in vitro. Mol Pharmacol 34, 664–673.
Villalobos C, Nadal A, Nunez L, Quesada I, Chamero P, AlonsoMT & Garcıa-Sancho J (2005). Bioluminescence imaging ofnuclear calcium oscillations in intact pancreatic islets ofLangerhans from the mouse. Cell Calcium 38, 131–139.
Villalobos C, Nunez L, Chamero P, Alonso MT &Garcıa-Sancho J (2001). Mitochondrial [Ca2+] oscillationsdriven by local high [Ca2+] domains generated byspontaneous electric activity. J Biol Chem 276, 40293–40297.
Villalobos C, Nunez L, Montero M, Garcıa AG, Alonso MT,Chamero P, Alvarez J & Garcıa-Sancho J (2002).Redistribution of Ca2+ among cytosol and organella duringstimulation of bovine chromaffin cells. FASEB J 16, 343–353.
Werth JL & Thayer SA (1994). Mitochondria bufferphysiological calcium loads in cultured rat dorsal rootganglion neurons. J Neurosci 14, 346–356.
Xu T, Naraghi M, Kang H & Neher E (1997). Kinetic studies ofCa2+ binding and Ca2+ clearance in the cytosol of adrenalchromaffin cells. Biophys J 73, 532–545.
Yao L, Wang G, Ou-Yang K, Wei C, Wang X, Wang S, Yao W,Huang H, Luo J, Wu C, Liu J, Zhuan Z & Cheng H (2006).Ca2+ sparks and Ca2+ glows in superior cervical ganglionneurons. Acta Pharmacol Sin 7, 848–852.
Acknowledgements
This work was supported by grants from Junta de Castilla y
Leon (VA071/02; VA022A05), Ministerio de Educacion y Ciencia
(MEC; BFU2004-02764), Fondo de Investigaciones Sanitarias
FIS 04/1510 and Ministerio de Sanidad, Instituto de Salud Carlos
III, Red de Terapia Celular. L.N. is fellow of the Ramon y
Cajal Program (MEC and FEDER-FSE). L.S. is the recipient
of a predoctoral fellowship from MEC. Pablo Chamero held a
predoctoral fellowship from the Basque Government.
C© 2007 The Authors. Journal compilation C© 2007 The Physiological Society