biomass energy perspectives in mexico and central...
TRANSCRIPT

Biomass energy perspectives in
Mexico and Central America
Emilio de los Ríos Ibarra, Red Mexicana de Bioenergía
Salvador de Bahia, November 2007

Plan
Bioenergy in Mexico.
Mexico & Central America Resource use and Sustainability
Is there a path for Sustainable Biomass energy?
Biomass energy perspectives,
The case of firewood in Yucatan
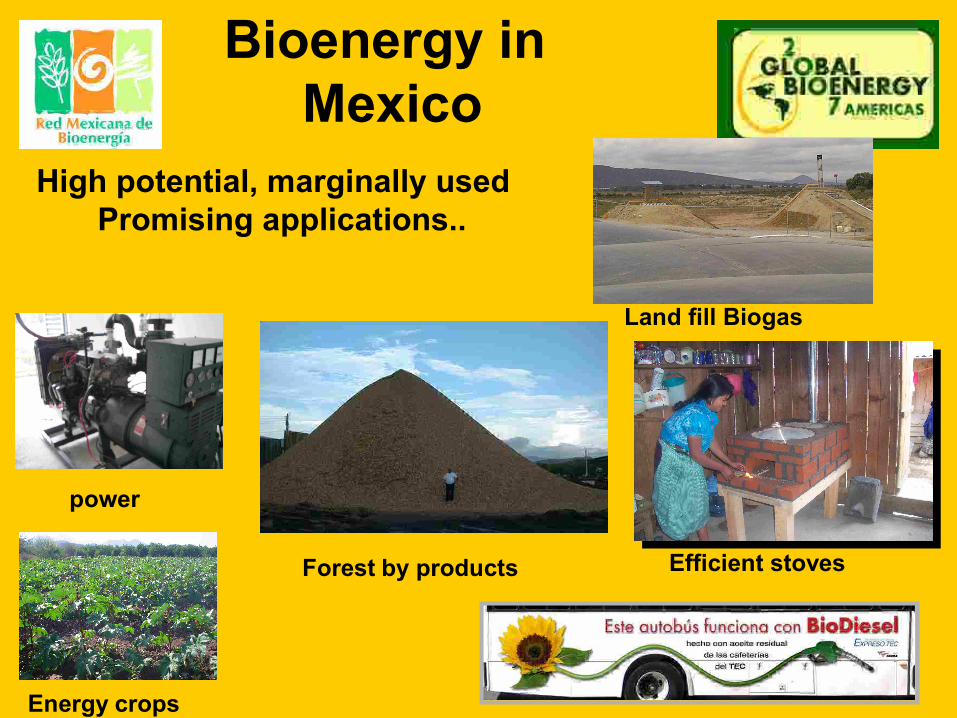
Bioenergy in Mexico
High potential, marginally used Promising applications..
Land fill Biogas
Efficient stovesForest by products
Energy crops
power

Energy use in Mexico
Bioenergy supplies 8% of total primary energy in México (455 de 5,690 PJ/yr)Bioenergy supplies 8% of total primary energy in México (455 de 5,690 PJ/yr)
0.0
1000.0
2000.0
3000.0
4000.0
5000.0
6000.0
7000.0
1965 1970 1975 1980 1985 1990 1995 2000
Año
PETA
JOU
LES
firewood
sugar canebagasseWind
Geothermic
Hydraulic
Nuclear
associated gas
non associatedgasCondensates
Crude oil
Coal

Natural Forest38%
Manure 3%
energy crops6%
Plantation27%
Forest waste2%
Agricultural by products
19%
Agro-industrial wastes
4% MSW derived1%
Total availablility : 3,000-4550 PJ/año 50-80% total energy demand
Bioenergy Sources in Mexico

Global Warming
POWER GENERATION MITIGATION POTENTIAL 2030Gt CO2 eq/ yr
Fuel switch and plant efficiency, 1.07
Nuclear, 1.88
Hydro, 0.87Wind, 0.93
Bio-energy, 1.22
Geothermal, 0.43
Solar PV and Concentrated Solar
Power, 0.25
CCS + coal, 0.49
CCS + gas, 0.22
TOTAL 7.4 GtCO2eq/year Fuente: IPCC, 2007

Biodiesel: Experience in México
• Waste vegetable oil plant in Monterrey
• Propalm Plant• Michoacán state project (Jatropha)
• Comisión Bioenergéticos- Chiapas (Jatropha)
Nivel 3
Nivel 2
Nivel 1
Biodiesel pilot plant
Planta Grupo Energéticos
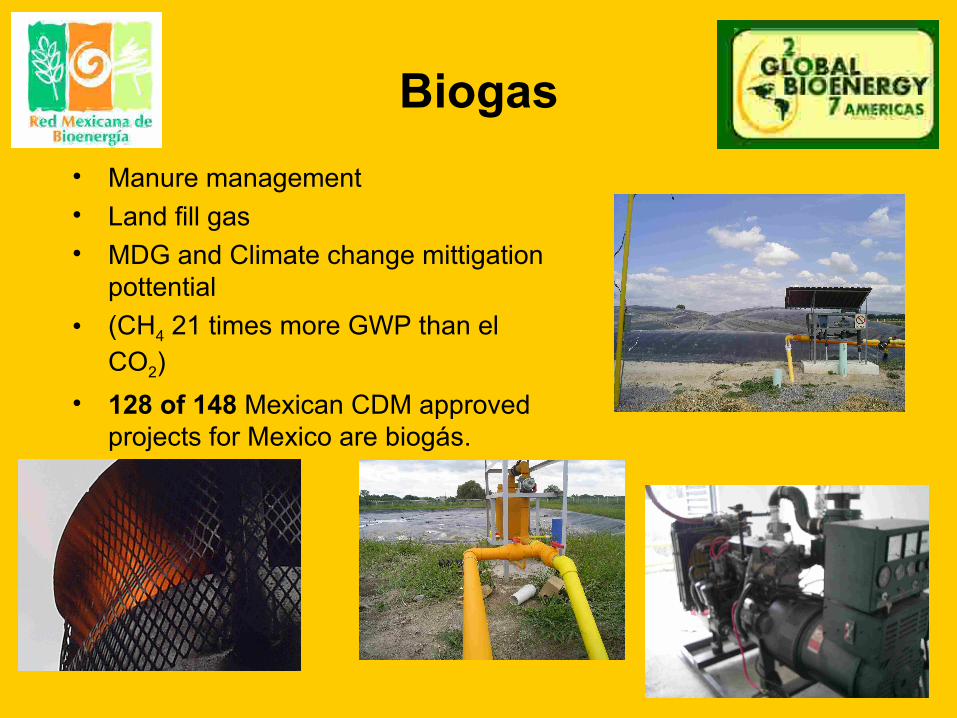
Biogas• Manure management • Land fill gas• MDG and Climate change mittigation
pottential • (CH4 21 times more GWP than el
CO2)• 128 of 148 Mexican CDM approved
projects for Mexico are biogás.

Mexico’s Sugar Industry
Sugar is Mexico’s largest agricultural industrySugar cane fifth largest cultivated crop, (614 000 ha)
58 sugar mills in 15 states, most obsolete.
Fossil fuel consumption 8.5 liters/ton sugar.
More than 440,000 jobs.(cane cutters, seasonal field workers, and factory workers)
158,000 cane growers,Mean surface per grower < 4 ha, produce 300 tons each.Quensland Australia 6,500 growers with 85 ha.
Mexican sugar cane industry has been in permanent crisis, as state intervention, aims job creation not labor productivity.

Sugar cane Ethanol
Domestic production during the 2004/2005 crop 60 million liters
Domestic demand industrial ethanol 164 million liters
Imports from Guatemala, Salvador
FOB mill price $372.00 Mex pesos/ ton =
Sugar Cane
$34.00 US $/ton (2006)

Maize production costs in Mexico
$ 280.48 $ 3,034.78 1.38 $ 4,188.00 TABPV 2005 $ 269.38 $ 2,914.67 3 $ 8,744.00 GROOI 05-06 $ 217.03 $ 2,348.24 2.5 $ 5,870.60 E MEXPV 2005 $ 216.97 $ 2,347.62 2.1 $ 4,930.00 VERPV 2005 $ 186.97 $ 2,023.00 5.5 $11,126.50 SONOI 05-06 $ 168.24 $ 1,820.33 3 $ 5,461.00 YUCPV2005 $ 154.48 $ 1,671.50 3 $ 5,014.50 TAMPSPV 2005 $ 108.84 $ 1,177.60 5 $ 5,888.00 JALISCOPV 2005 $ 95.02 $ 1,028.15 6.5 $ 6,683.00 E MEXPV 2005 $ 88.96 $ 962.57 7 $ 6,738.00 JALISCOPV 2005 $ 75.22 $ 813.86 7 $ 5,697.00 SINALOAPV 2005 $ 56.48 $ 611.15 9.15 $ 5,592.00 SINALOAOI 05-06USCy PESOSton
Cost/toncost/ tonyieldCost/haStateSeason
Source:www.siap.sagarpa.gob.mx.viocs CBOT price $149.6 us cy/ton380 cents/bushell 15 nov 07
Food or fuel ?

How can maize be produced at this cost?
Cost per ton$ us/ton
Cost per tonpesosYield ton/ha
Cost pesos/hastateseason
$ 280.48
$ 269.38
$ 217.03
$ 216.97 $ 2,347.62 2.1 $ 4,930.00 VERPV 2005
$ 2,348.24 2.5 $ 5,870.60 E MEXPV 2005
$ 2,914.67 3 $ 8,744.00 GROOI 05-06
$ 3,034.78 1.38 $ 4,188.00 TABPV 2005
Maize in Mexico and C. America is:• Base of tortillas, the staple product
for most of the population. • Specific varieties are main
ingredient for delicate dishes.• And a commodity.commodity.
CBOT price $149.6 us cy / ton380cents / bushell 15 nov 07

Energy equiv.cost
Total cost$ US / lt
Feed stock cost $ us/ l
$ 1.2140 $ 0.8608 $ 0.6722 TAB
$ 1.1765 $ 0.8342 $ 0.6456 GRO
$ 0.9996 $ 0.7088 $ 0.5201 E MEX
$ 0.9994 $ 0.7086 $ 0.5200 VER
$ 0.8980 $ 0.6367 $ 0.4481 SON
$ 0.8347 $ 0.5919 $ 0.4032 YUC
$ 0.7882 $ 0.5589 $ 0.3702 TAMPS
$ 0.6339 $ 0.4495 $ 0.2608 JALISCO
$ 0.5872 $ 0.4164 $ 0.2277 E MEX
$ 0.5667 $ 0.4019 $ 0.2132 JALISCO
$ 0.5472 Gasoline
$ 0.5203 $ 0.3689 $ 0.1803 SINALOA
$ 0.4570 $ 0.3240 $ 0.1354 SINALOA
Ethanol production cost maize feed stock
Source Compete task 4.4 report

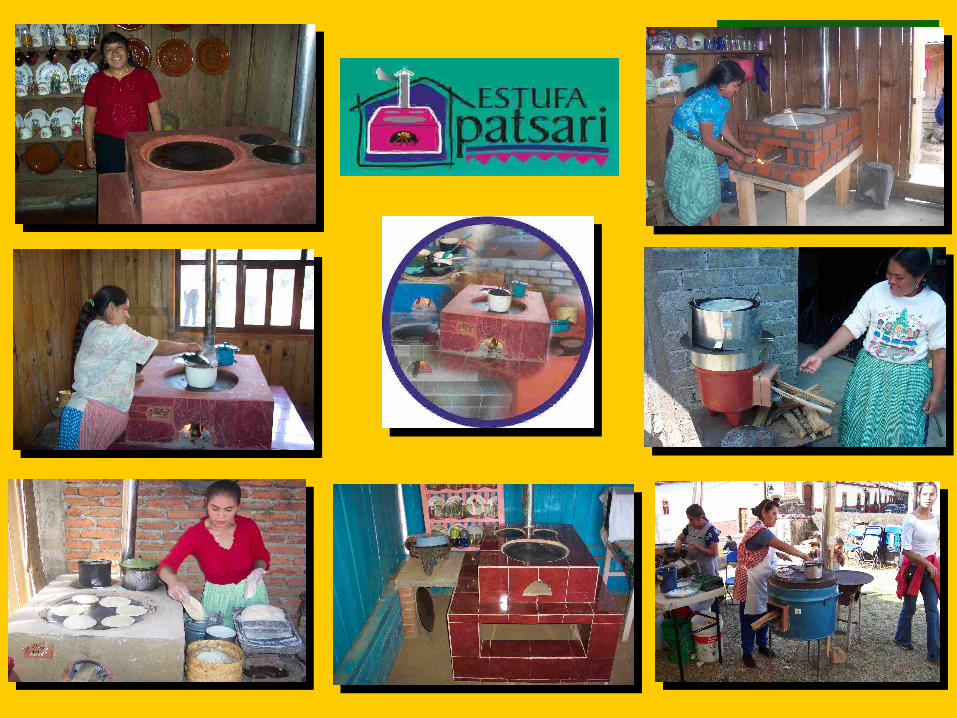
Domestic wood fuel
• 5 millon families, use wood fuel in Mexico.
• Efficient wood stoves are a true alternative
• Benefit cost Ratio 7 : 1 just for health benefits.

Environmental issues
have transboundary Effects and need
transboundary actions
Biodiversity conservation
Bioenergy &
Conservation

Meso America
5 Mexican states % area Chiapas 10% Campeche 7% Tabasco 3% Yucatán 6% Quintana Roo 5%Belice 3%Costa Rica 7%Guatemala 14% Honduras 15%Nicaragua 18%El Salvador 3%Panama 10% Total area 768,543 Km2

People & Landscapes

BiodiversityMeso - America bridge between North and South América.
Second world’s largest reef, many different Landscapes. Mountains that reach 4,211 m. above sea level.
Rainfall from 500 mm to more than 7,000 mm/year.
Mean annual temperatures from 7,5 to 32,5 0 C.
24,000 vascular plant species, 5,000 (21%) endemic. (Jatropha curcas)
521 mamalian species, 210 (40 %) endémic.
1,193 bird species
Crop center of origin: Maize, Zea Mays cocoa Theobroma cacao, Beans Phaseolus. Sp. Squashes Cucurbita sp,

Socio-economic data
51,072Total9,992 *
3,284
5,594
7,518
13,018
6,991
4,399
276
2006
7.413.9Mexico7.619.3Panama
31.929Nicaragua22.636.3Honduras28.218.9Guatemala18.918.4El Salvador3.815Costa Rica5.3N-DBelize
20052005Year
Agricultural labour % labour force
Source: CEPAL Anuario Estadístico 2006*INEGI Recuento 2005 ( only 5 states )
Illiteracy Rate %Population >15 yr
Populationthousands
Population density: 66.43 hab / sq km
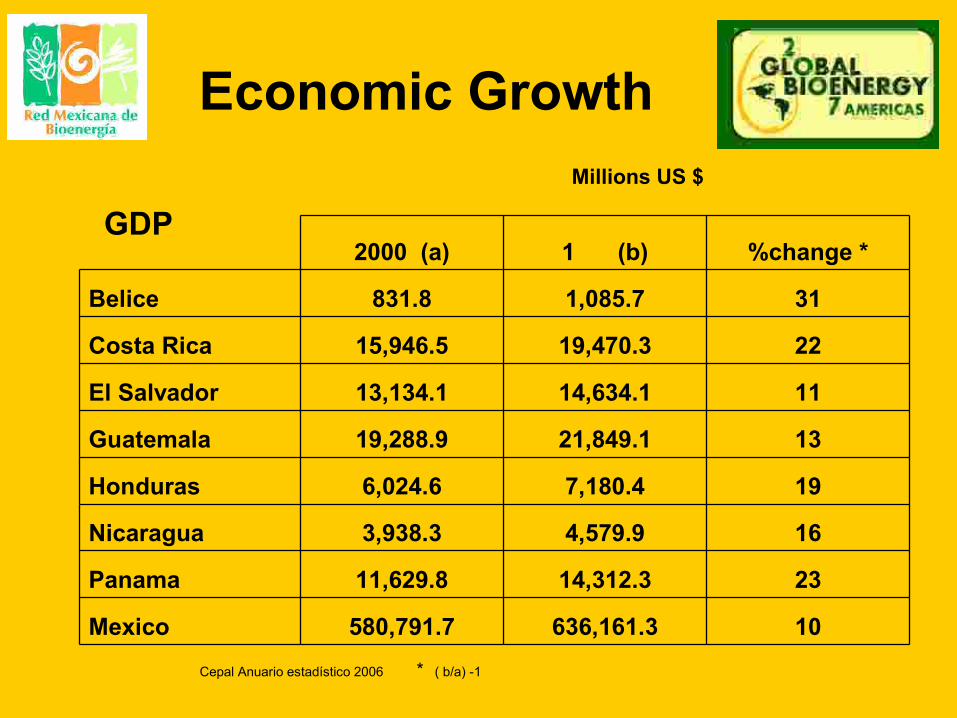
Economic Growth
10636,161.3580,791.7Mexico
2314,312.311,629.8Panama
164,579.93,938.3Nicaragua
197,180.46,024.6Honduras
1321,849.119,288.9Guatemala
1114,634.113,134.1El Salvador
2219,470.315,946.5Costa Rica
311,085.7831.8Belice
%change *1 (b)2000 (a)
Cepal Anuario estadístico 2006 * ( b/a) -1
Millions US $
GDP
Exports
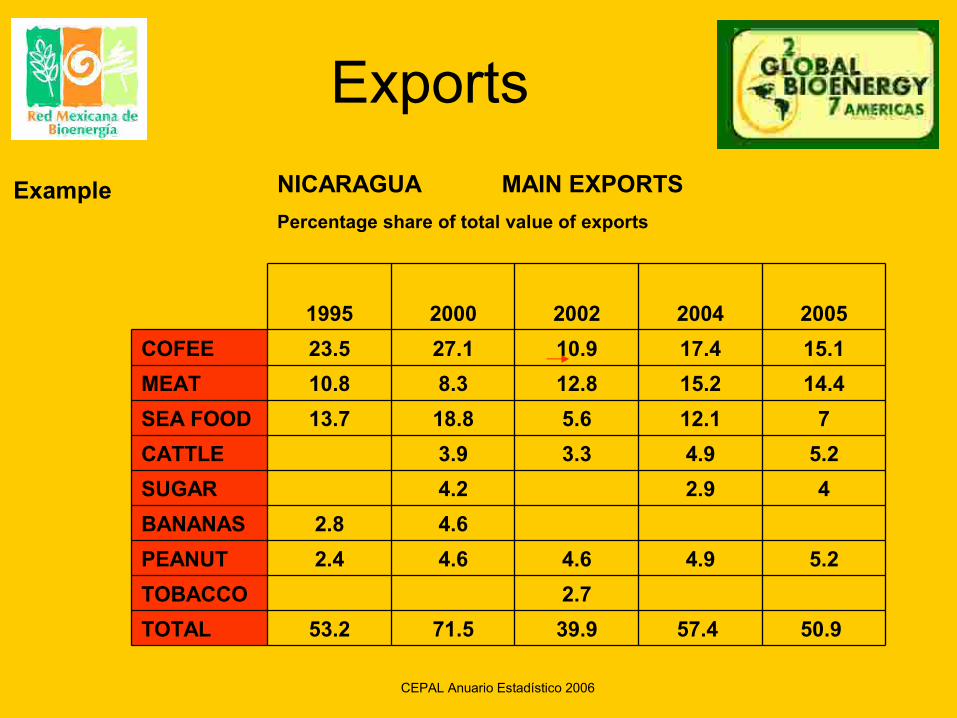
2.7 TOBACCO5.24.94.64.62.4PEANUT
CEPAL Anuario Estadístico 2006
50.9 57.4 39.971.553.2TOTAL
4.62.8BANANAS42.9 4.2 SUGAR
5.24.93.33.9 CATTLE712.15.618.813.7SEA FOOD
14.415.212.88.310.8MEAT 15.117.410.927.123.5COFEE 20052004200220001995
Percentage share of total value of exports
NICARAGUA MAIN EXPORTSExample

Remitances
FDI = foreign direct investment
ODA = official development aid GDP = gross domestic product
154.0%24888.0%100.0%2.5%Mexico
58.0%1556.0%253.0%6.8%Belize
35.0%6435.0%49.0%1.8%Panama
24.0%7960.0%55.0%1.7%Costa Rica
286.0%385.0%582.0%15.1%Honduras
432.0%127.0%310.0%17.8%Nicaragua
756.0%6620.0%655.0%16.1%El Salvador
348.0%3052.0%2145.0%10.0%Guatemala
TourismODAFDIGDP
2004 data
Migrant worker cash remitances as percentage of :
Currently main foreign currency source
Source: World Bank 2005

Sustainability
Biodiversity loss

Soil erosion
Source Global soil degradation. (1997). In UNEP/GRID-Arendal Maps and Graphics Library. Retrieved 19:35, November 17, 2007 from http://maps.grida.no/go/graphic/global_soil_degradation.

Energy and Human development
6.57.0501.0245.072.1118Guatemala4.95.0694.0259.063.6117Honduras5.58.7492.0363.069.3112Nicaragua6.97.6663.0336.046.3101El Salvador--708.0370.025.096Belice
7.67.31733.0930.028.558Panama5.65.52108.0955.013.053Mexico9.910.21764.0964.029.648Costa Rica
20031980 20031980 2003
Human dev.IndexRank
GDP per energy unit2000 PPP US$ / kg oil
Per capitaelectricity consumption
Traditional fuels% total energy
Source UNDP 2006 Human development report

Domestic Fuel Use
7.911.53.1Other
2.50.84.8Electricity
12.63.424.6Charcoal
45.320.378LPG
5.48.41.4Kerosene
73.695.445.2Fuelwood
GlobalRuralUrban
Household Cooking fuels in Guatemala
ESMAP- world bank 2005
% households
Multiple fuel use

Forest Area
Source Cifor 1996 Square km
288,000
52,000
70,000
68,000
71,000
27,000
1950
95,000193,000Total
21,00031,000Panama
10,00060,000Nicaragua
22,00046,000Honduras
29,00042,000Guatemala
13,00014,000Costa Rica
Forest loss
1990YearFrom 1990 to 2005Central America lost 52,280 Km 2 more.17 % of 1990 Forests 10 % of total area for Central America.
Deforestation
Source: FAO State of the World Forests 2007
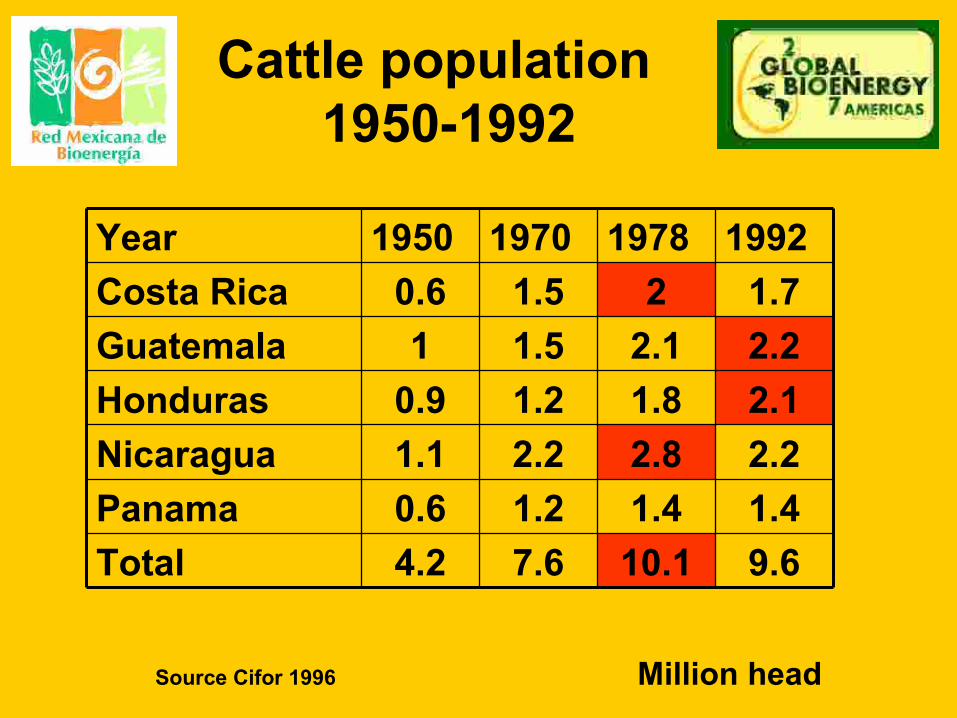
Cattle population 1950-1992
Source Cifor 1996 Million head
4.20.61.10.91
0.61950
7.61.22.21.21.51.5
1970
10.11.42.81.82.12
1978
9.61.42.22.12.21.7
1992
TotalPanamaNicaraguaHondurasGuatemalaCosta RicaYear

Land Use
Cash crop production within a capital intensive and export oriented sector.
Cocoa, Coffee, Sugar Cane, Bananas, Sisal, Rubber, Cotton, Soybeans, Beef, Cardamom, Oil Palm, Annato, Jatropha ??
Non sustainable forestry to extract:Chewing gum, Mahogany and other tropical timbers, dyes (palo de tinte), Barbasco, Xate palm leaves.
According to commodity
Consequences: Environmental degradation, poverty, political unrest.
Is bioenergy a new boom?
“booms”

Is there a path for Sustainable
Biomass Energy?

Fao (2007) Sustainable Bioenergy a Framework for Decision Makers
FAO’s 9 key Issues, to consider for bioenergy policy design.
• Ability of bioenergy to provide energy services for the poor.
• Implications for agro industrial development and job creation.
• Health and gender implications of modern bioenergy.
• Implications for the structure of agriculture.
• Implications for food security.
• Implications for government budget.
• Implications for trade, foreign exchange balances and energy security
• Impacts on biodiversity and natural resource management
• Implications for climate change

How do these issues apply in a
real context?

Wood fuel in YucatanMexico
Case study:

Yucatan population 2005
• 1, 800, 000 inhabitants • 36% households, use fire wood • More than 650,000 firewood users.

Wood fuel consumption
Domestic per capita comsumption 2.1 kg / dayHeat equivalent almost 10kW / hr (Sánchez G M 1993 Diaz J R. 2000)

Biomass Alternative
Woodfuel estimated domestic consumption 500,000 ton/year
with efficient stoves 50 % could be saved
which means
250,000 tons / year enough to generate
292 GW/hr electric assuming 30 % efficiency
11 % current electrical consumption in Yucatan.
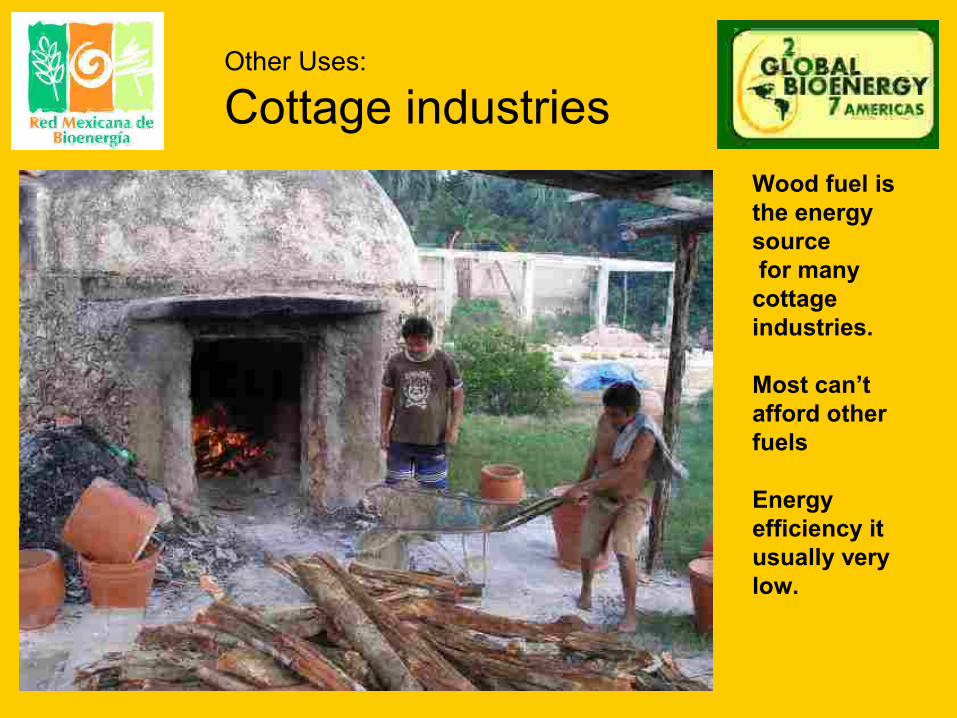
Other Uses:
Cottage industriesWood fuel is the energy source for many cottage industries. Most can’t afford other fuels
Energy efficiency it usually very low.

Other Uses:
Charcoal

Charcoal Production
Peasants produce charcoal to use wood that otherwise would be burnt, when clearing land for shifting agriculture.
Earth kilns have very low yields No cash investment,
Capital is the scarce production factor

Charcoal marketing chain in Yucatan
Field (Peasant)
$1.30
Small Vehicle owner
½ to 3 tons
Field Agent
Wholesale Merida $1.70
retailer$2.00
Consumer $3.50
Merida Restaurant $2.00
Transport (cost $0.30)
Mexico City Warehouse
(cost $1.70)Mexico City consumer
$7.00
Mexico CityRestaurant
$4.00
Prices per kilogram in Mexican pesos, exchage rate 10.5 per US $

CharcoalCharcoal production transforms forest resources in wages at rural labor opportunity cost.
Imperfect market. Wholesaler has best margin. Waste of natural capital.
Great environmental cost.
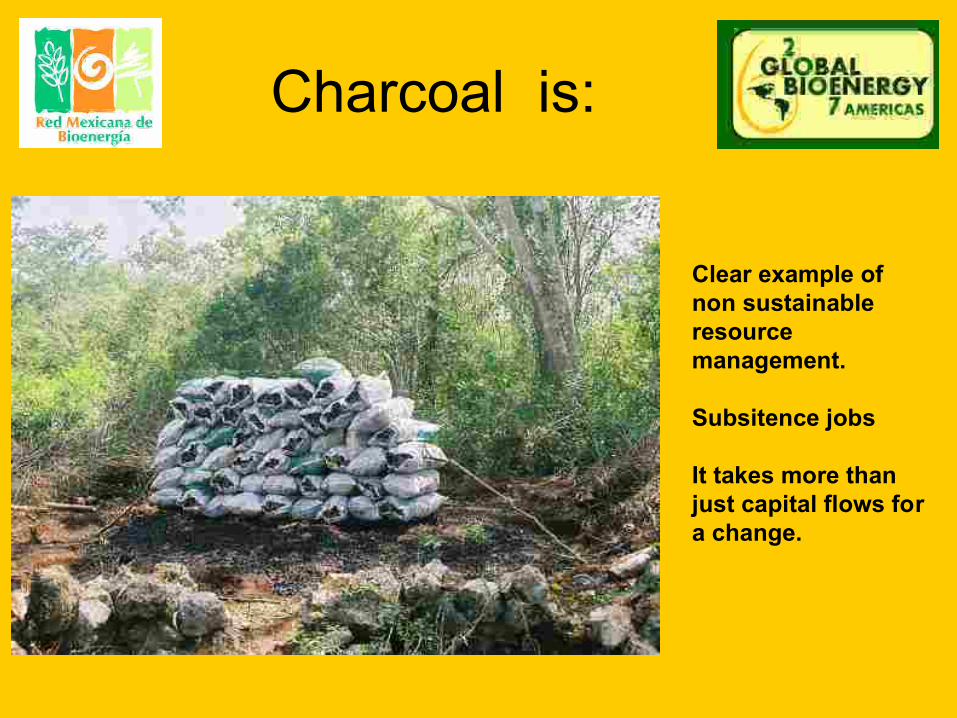
Charcoal is:
Clear example of non sustainable resource management.
Subsitence jobs
It takes more than just capital flows for a change.
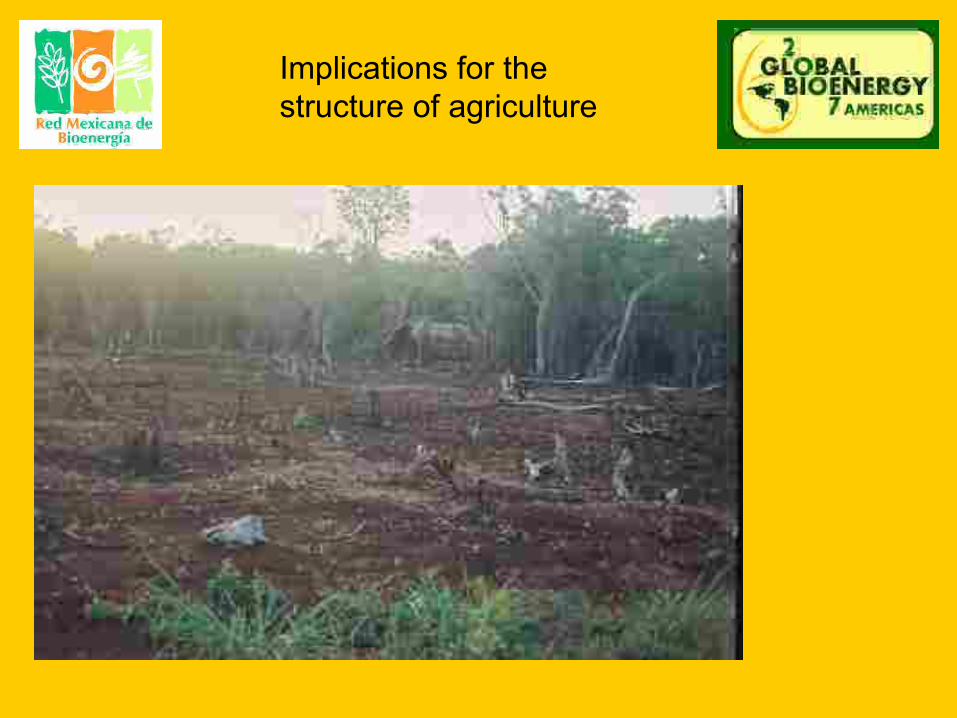
Implications for thestructure of agriculture

food security

www.rembio.org
Questions?...
Thank you