biomechanical comparison between sprint start, sled
TRANSCRIPT

BIOMECHANICAL COMPARISON BETWEEN SPRINT
START, SLED-PULLING AND SELECTED SQUAT TYPE
EXERCISES
Olli Okkonen
Master’s thesis in Science of Sport Coaching
and Fitness Testing
Spring 2012
Department of Biology of Physical Activity
University of Jyväskylä
Supervisor: Professor Keijo Häkkinen

ABSTRACT
Okkonen, Olli 2012. Biomechanical comparison between sprint start, sled-pulling and selected
squat type exercises. Department of Biology of Physical Activity, University of Jyväskylä.
Master’s Thesis in Science of Sport Coaching and Fitness Testing. 69 pp.
The purpose of the present study was to compare kinetics, kinematics and muscle activity
between sprint start, sled-pulling and selected squat type exercises and also to examine how
different exercises and variables correlate with the performance time of the block start (10 m).
Nine male athletes (4 sprinters, 3 decathlonists, 1 long jumper and 1 triple jumper; mean ± SD;
age = 24.9 ± 3.9 yr; height = 180.4 ± 5.9 cm; weight = 80.3 ± 7.5 kg; 100 m record = 11.35 ±
0.29 s) performed measurements and different force-time, electromyographic (EMG) and
kinematic variables were compared to sprint start. Most of the comparison was done to the
block phase (the phase of force production towards starting blocks) of the block start. In nearly
all exercises, the activity of the gluteus maximus (GM) was significantly (p≤0.05) higher than
during the block phase. The opposite was true for the activation of the biceps femoris (BF).
Ground reaction forces (GRF) were highest during the 1-RM (one repetition maximum) ½-squat
(SMAX). The GRFs were also significantly (p≤0.05) larger during the countermovement jumps
(CMJ) with different loads and during the ½-squat with 70 % of 1-RM (S70) as compared to the
block phase. The angular velocity of the knee was significantly (p≤0.05) higher during CMJs
than during the block phase. The highest correlation existed between the performance time in
the block start (10 m) and the takeoff velocity during CMJ (r=-0.950, p≤0.05). According to the
results of the present study, it can be suggested that to overload the force production (peak and
average force) of the block phase, CMJs and ½-squats could be used in training. If the aim is to
activate the GM intensively, almost all of the exercises analyzed in the present study seems to
be suitable. The results also indicate that CMJs could be used as supra-velocity exercise for the
knee joint in the training of the block start. In addition, the correlation analyses indicate the
importance of a good performance in CMJs for a good performance in the block start.
Keywords: Sprint start, sled-pulling, CMJ, squat, biomechanics, comparison

CONTENTS
ABSTRACT
1 INTRODUCTION……………………………………………………………….....…6
2 TRANSFER OF STRENGTH AND POWER TRAINING TO SPORTS
PERFORMANCE.............................................................................................................7
3 INFLUENCE OF VELOCITY SPECIFICITY OF TRAINING ON SPRINT
PERFORMANCE...........................................................................................................10
3.1 Resisted, normal and supramaximal sprint training.............................................10
3.2 High velocity vs. low velocity training.................................................................11
3.3 Plyometric training vs. sprint training..................................................................15
3.4 Summary of the effects of velocity specific training…………….……….….….16
4 BIOMECHANICS OF SPRINT START…………………………………...…….....17
4.1 Contact and flight times……………………………………………………..….17
4.2 Force production…………………………………………………………..…....18
4.2.1 Peak forces…………………………………………………………….…19
4.2.2 Impulses……………………………………………………………….....20
4.3 Joint angles and angular velocities………………………………………….......21
4.4 Muscle activity……………………………………………………………….....22
5 BIOMECHANICAL COMPARISON BETWEEN SPRINT START AND
SELECTED STRENGTH EXERCISES…………………………………………........24
5.1 Sprint start vs. sled-pulling……………………………………………….…......24
5.2 Sprint start vs. selected squat type exercises…………………………….…..….26
5.2.1 Peak velocities and force production times……………………….….......26
5.2.2 Peak forces…………………………………………………….….….…...27
5.2.3 Peak angular velocities of hip, knee and ankle…………………..……....27

5.3 Associations between sprint start and speed-strength / strength exercises…..…31
6 PURPOSE OF THE STUDY………………………………………………….….…32
6.1 Research problems……………………………………………………….……..32
7 METHODS…………………………………………………………………….…....33
7.1 Subjects……………………………………………………………………..…..33
7.2 Procedures…………………………………………………………………..…..33
7.3 Analyses……………………………………………………………………...…36
7.4 Statistical analyses………………………………………………………..……..37
8 RESULTS……………………………………………………………………..….….38
8.1 Force-time variables………………………………………………………..…...38
8.1.1 Block start vs. sled pulling, CMJs and ½-squats……………………..…..38
8.1.2 Comparison of force-time variables between block phase, 2nd
and
6th
steps……………………………………………………………….......39
8.1.3 Associations between performance time in block start (10 m) and force-
time variables……………………………………………………….…....41
8.2 EMG variables……………………………………………………………….….44
8.2.1 Block start vs. sled-pulling, CMJs and ½-squats………………………....44
8.2.2 Comparison of EMG variables between block phase, 2nd
and
6th
steps…………………………………………………………..….……47
8.2.3 Associations between performance time in block start (10 m) and EMG
variables………………………………………………………………..…48
8.3 Kinematic variables………………………………………………………….….49
8.3.1 Block start vs. sled-pulling, CMJs and ½-squats…….…………….……..49
8.3.2 Associations between performance time in block start (10 m) and
kinematic variables…………………………………..…………….……..52
9 DISCUSSION………………………………………………………………………..54
9.1 Sled-pulling vs. Block start……………………………………………….…….54
9.2 CMJs vs. Block start…………………………………………………….………56
9.3 Half squats vs. Block start……………...……………………………………….57

9.4 Associations between performance time in block start (10 m) and studied
exercises…………………………………………………………..…..…….….59
9.5 Limitations and strengths of the present study…………………………...….…60
10 CONCLUSIONS……………………………………………………………….….61
11 REFERENCES…………………………………………………………….………62
ACKNOWLEDGEMENTS

1 INTRODUCTION
Sprint training usually includes i.a. speed, speed-endurance and strength training.
Strength training of sprinters comprises of hypertrophy, maximum- and speed-strength
training. By hypertrophy training (60–80% 1RM) sprinters are trying to increase the
cross-sectional area of muscles (especially the cross-sectional area of fast muscle fibers)
and thereby increasing maximum strength. By maximum strength training (90–100%
1RM) athletes are trying to improve the function of their nervous system (e.g.
rapid/increased recruitment of motor units, increased firing rate of motor units and
improved synchronization of motor units). (Komi 1986; Schmidtbleicher 1991, 384;
Delecluse 1997.) In maximum strength training the goal is also to activate the largest
fast twitch motor units (Delecluse et al. 1995), although it might be also possible with
rapid ballistic muscle actions (Sale 1991, 256).
In speed-strength training, loads are lighter than in maximum strength training (and
usually lighter than in hypertrophy training) and thereby movement speeds are faster
and closer to the movement speeds of sprint running. Examples of speed-strength
training include ballistic exercises (e.g. squat jump), plyometric exercises (jumps) and
sprint specific exercises (e.g. sled pulling). It is thought that strength training effects are
movement and velocity specific so that adequate employment of plyometric and sprint
specific exercises is important in sprint training. (Delecluse 1997.)
Despite the common use of speed-strength / strength exercises in training of sprinters,
there is a lack of knowledge of biomechanical characteristics of these exercises (e.g.
force production, angular velocities, EMG activity) as compared to sprinting (Lockie et
al. 2003, Maulder et al. 2008 and Mero & Komi 1994). The purpose of the present study
was to compare kinetics, kinematics and muscle activity between the sprint start, sled
pulling and selected squat type exercises and thus to acquire more information about the
relations between these exercises. Ultimately, this new information could probably be
utilized in sprint start training and possibly in general sprint training.

7
2 TRANSFER OF STRENGTH AND POWER TRAINING TO
SPORTS PERFORMANCE
The ability to produce relatively high forces (strength) and to produce a high work rate
(power) is important for various sports. As such, resistance training has become an
integral part of many training programs. A key issue is the efficiency of training.
Therefore, transfer of training to performance is paramount. Transfer may be
conceptually expressed as: gain in performance / gain in trained exercise. (Young 2006.)
Essential to the concept of transfer is the well-accepted training principle of specificity.
Specificity means that adaptations are specific to the nature of the training stress.
Extremity of this principle would be that all training would mimic competition
demands. (Young 2006.) Such an approach might induce a good transfer to performance
in short term, but it also might have some negative influences: overtraining, muscle
imbalances, increased risk of injuries and boredom in long term (Young 2006).
Positive transfer could be achieved by increased excitatory neural drive to agonist and
synergist muscles that contribute to skillful performance and/or by inhibition of muscles
that can decrease performance. The coordination of muscles involved in a sports
movement has been termed intermuscular coordination and is considered important for
sprint performance. (Young 2006.) Also improvement of intramuscular coordination can
contribute to the performance enhancement. Improved intramuscular coordination refers
to increased motor-unit recruitment, firing rates, synchronization and reflex potentiation
and decreased inhibition from eccentric loads during stretch-shortening cycle. (Komi
1986; Schmidtbleicher 1991, 384.) A poor transfer might be explained by a violation of
the specificity principle. It is suggested that training should be specific in terms of
movement pattern, contraction velocity, contraction type and contraction force. (Young
2006.)
However, if only the principle of specific training would be followed, it can be
hypothesized that neuromuscular system would adapt to that kind of training and after a
while no further adaptation would most likely occur. In this kind of a scenario, it could

8
be advisable to add some exercises wherein force production and/or velocity of the
movement would be higher than in a certain sport performance. This kind of a training
could lead to improvements in force production and/or velocity of the movement
(positive changes on the force-velocity curve) and to improvement in a certain sport
performance (Malisoux et al. 2006; Cormie et al. 2010).
Also general strength training might be beneficial for athletes, because of its potential to
enhance the force-generating capabilities of muscle, reduce the risk of sports injuries,
and improve core stability. However, direct transfers to improve sports performance
might be limited by such training in experienced athletes. It appears that to maximize
transfer to specific sport skills, training should be as specific as possible, especially with
regard to movement pattern and contraction velocity. This type of training can be
expected to enhance intermuscular coordination. Resisted sports movements might be
suitable strategy to achieve this specificity (Table 1). (Young 2006.)
TABLE 1. Strategies for developing power in a sprinter based on neuromuscular factors
(modified from Young 2006).
Strength training Example of Influence on
Method neuromuscular sprinting
factor performance
Hypertrophy Increased Increased
muscle cross- muscle cross-
sectional area sectional area
Exercises with Increased motor- Enhanced
loads that maximizes unit recruitment, intramuscular
power outputs firing rates, coordination of
synchronization, involved muscles
reflex potentiation
Resisted sprints, Increased activation Enhanced
unilateral/horizontal of agonists and synergists intermuscular
plyometrics Decreased activation of coordination
antagonists
Velocity and movement pattern specificity. In general, smaller (slow twitch) muscle units
are recruited first, followed by larger (fast twitch) muscle units (size principle). In some
cases this size principle does not necessarily hold. For example, the largest fast twitch
motor units may be preferentially recruited over the smaller slow twitch units when

9
rapid ballistic muscle actions are performed. It is possible that neural adaptations to
high velocity training consists of an accentuation of the preferential activation of fast
twitch motor units and/or an acquired ability to increase the maximum motor unit firing
rates in ballistic actions. The high firing rate increases the rate of force development and
the peak force of dynamic actions done at high velocity. (Sale 1991, 256–258.)
It has often been observed in strength-training studies that the magnitude of measured
increase in strength depends on how similar the strength test is to the actual training
exercise. This specificity of movement pattern in strength training probably reflects the
role of learning and coordination. Improved coordination shows in the most efficient
activation of all of the involved muscles, and the most efficient activation of motor units
within each muscle. Fast muscles (relatively high proportion of fast twitch motor units)
may be preferentially activated over slow muscles in the execution of high velocity
movements. The gastrocnemius has shown to be preferentially activated over the soleus
during stationary cycling at higher pedaling speeds and in hopping. In moderate force
concentric and eccentric actions, the soleus is preferentially activated during the con-
centric phase, while the gastrocnemius is preferentially activated in eccentric phase. The
latter pattern is accentuated at higher lengthening velocities. Similar observations have
been made when the activity of slow and fast twitch fibers in concentric and eccentric
actions have been studied (slow twitch fibers were preferentially activated in concentric
phase and fast twitch fibers were preferentially activated in eccentric phase). (Sale 1991,
258–259.)

10
3 INFLUENCE OF VELOCITY SPECIFICITY OF TRAINING
ON SPRINT PERFORMANCE
3.1 Resisted, normal and supramaximal sprint training
It is generally accepted that strength training can improve sprint performance and
muscle strength seems to be an important factor in sprinting, especially in the
acceleration period (Kristensen et al. 2006). It has been suggested that to achieve an
effective transfer between strength training and sprint running, there is a need for
specificity in the strength exercises that mimics sprinting (Delecluse et al. 1995).
Kristensen et al. (2006) studied the training effects of normal, resisted and supra-
maximal sprinting in athletes who did not have previous experience with specific sprint
training. During resisted sprinting the running velocity was 8.5 % lower and during
supramaximal sprinting 3.3 % higher when compared to normal sprinting. Every
training group trained 6 weeks, 3 trainings / week (5 x 20 m / training).
FIGURE 1. Pre-post difference (%) in running velocity is shown in Y-axis (modified from
Kristensen et al. 2006).

11
As it can be seen from Figure 1, every training group had training specific adaptations:
supramaximal training increased most supramaximal running velocity, normal training
normal running velocity and resisted sprinting resisted running velocity.
Zafeiridis et al. (2005) studied the effects of resisted sled-pulling (5 kg) and unresisted
sprint-training on acceleration and maximum speed performance in recreational athletes
(Table 2). Subjects trained 3 times / week for 8 weeks.
TABLE 2. Relative changes (%) in sprint times in different running sections and in few biome-
chanical variables after resisted sprint training (sled-pulling) and unresisted sprint training.
(Modified from Zafeiridis et al. 2005.)
Variable Resisted Unresisted
0-10 m (s) -4.1 n.s.
0-20 m (s) -2.0 n.s.
Stride rate (acceleration phase) 7.0 n.s.
Trunk angle (acceleration phase) -9.7 n.s.
20-40 m (s) n.s. -3.4
40-50 m (s) n.s. -3.3
20-50 m (s) n.s. -3.7
Stride length (maximum running phase) n.s. 5.3
0-50 m (s) n.s. -1.9
n.s.= not statistically significant
The authors concluded that sled-pulling (5 kg) improves acceleration and unresisted
running maximum speed. Therefore, the results of their study supported the view that
each phase of sprint running demands different training methods. The main reason for
improved acceleration was increased stride frequency which was a possible result of
decreased trunk angle. Improved maximum speed was a consequence of increased stride
length.

12
3.2 High velocity vs. low velocity training
Blazevich and Jenkins (2002) investigated the effects of high and low velocity resis-
tance training on strength and sprint times in elite junior sprinters (mean 100 m record
10.89 s). The intervention period lasted 7 weeks and concurrent ”normal” training was
done by subjects (e.g. sprint training). The high-velocity group used weights of 30–50
% of 1RM and the low-velocity group weights of 70–90 % of 1RM in each exercise.
The concentric phases of the movements were performed as quickly as possible in both
groups. The exercises used in the training were ½-squat, hip extension, leg extension,
hip flexion and leg flexion.
In both groups, there were statistically significant improvements in 20 m acceleration
time, squat strength and torque produced during hip extension at 60 °/s and near-
significant (p<0.20) improvements in ”flying” 20 m time and torque produced during
hip extension and flexion at 270 °/s (Table 3). There was also near-significant
interaction effect (time x group) on hip flexion torque at 480 °/s, indicating that the
high-velocity group improved more than the low-velocity group.
TABLE 3. Relative changes (%) in 20 m acceleration time, 20 m running time with flying start
and squat (modified from Blazevich and Jenkins 2002).
Variable High-velocity group Low-velocity group P
20 m acceleration -4.3 -2.9 <0.05
20 m flying -1.9 -2.4 <0.20
Squat 12.4 11.8 <0.05
Probably because of a low number of subjects (the high-velocity group 5 and the low-
velocity group 4 subjects), there were only few statistically significant changes. The
results of their study suggest that a movement speed in resistance training does not have
significant effect on sprint performance when resistance training is combined with
sprint training in high level athletes.
Cronin et al. (2001) investigated the effect of 6 weeks heavy load training (80 % 1RM;
2 times / week) and power training (60 % 1RM; 2 times / week) on netball chest pass

13
throwing velocity. Both training methods were combined with sport specific training
(explosive netball passing). As subjects, they had female netball players (n=21) with no
previous weight training history. Subjects were randomly assigned to three groups:
strength, power or control. Both training groups were instructed to move their
respective loads as rapidly as possible. The strength-trained group improved peak
velocity of netball chest pass by 12.4 % and the power-trained group by 8.8 % and there
was no significant difference between groups.
The authors noticed that there was a great difference between the velocities performed
during the training and those attained during netball chest pass. Average training
velocity during bench press throw was 0.308 m/s for strength group and 0.398 m/s for
power group. Mean netball chest pass velocity was 11.38 m/s, 28–37 times greater than
training velocities. They concluded that most weight training could be classified as low
velocity training in relation to high velocity sports movements such as the netball throw.
They thought that explanations other than velocity-specificity are necessary to explain
the improvement in throwing velocity following strength and power training found in
their study. Possibly the intention to move an isoinertial load as rapidly as possible
coupled with performance of the sport specific movement immediately after a weights
set, allows improved adaptation and increased control of muscle to occur. (Cronin et al.
2001.) However, if sport specific movement influenced (possibly a lot) on passing ve-
locity, then the principle of velocity-specificity would hold true.
Harris et al. (2008b) examined the effects of machine squat jump training at heavy load
(80 % 1RM) vs. at a load maximizing power output (20–43.5 % 1RM) on concentric
strength and power output and sprint ability. As subjects they had 15 elite-level rugby
players (age: 21.8 years; height: 180.7 cm; mass: 96.2 kg). Both groups (heavy and
power load) trained approximately 2 times / week for 7 weeks. The heavy load group
(H- group) performed 5 x 5 x 80 % 1RM / training session and the power load group (P-
group) performed 6 x 10–12 x 20.0–43.5 %. Both groups were instructed to perform all
training as explosively as possible. In addition both groups performed sprint drills, other
lower-body exercises at various loads and upper-body training. Machine squat jump
training constituted about 20 % of total lower-body training. The machine hack squat
apparatus is shown in Figure 2 and results in Table 4.

14
TABLE 4. Percent changes in sprint times and strength for H- and P-groups after intervention
(modified from Harris et al. 2008b).
Variable Heavy load group Power load group
10 m time -2.9 -1.3
30 m time -1.9 -1.2
Squat 15.0 10.5
The authors concluded that a lack of difference in improvement of sprint times between
the H- and P-groups could be explained by that both groups did their squat jumps as
explosively as possible. They also thought that biomechanical specificity of training
exercises to the functional tasks would seem to be important.
FIGURE 2. Customized machine hack squat apparatus (Harris et al. 2008a).
Also Delecluse et al. (1995) have investigated the effects of heavy resistance training
and high velocity training on sprint performance. Subjects were physical education
students who had not taken part in an earlier strength training program. They were
divided in four groups: the high-velocity group (HV, n=21), high-resistance group (HR,
n=22), run control group (RUN, n=12) and passive control group (PAS, n=11). The HV
and HR groups followed specific strength training program twice a week and both
group participated together in a sprint running workout once a week. The training of the

15
HV group included, for example, different kind of vertical and horizontal jumping/
bounding (plyometrics) and the training of the HR group comprised of lower- and
upper-body training executed at the highest possible speed. Loads were in the range of
10 RM to 3 RM. The RUN group participated in a sprint running workout together with
the HV and HR group. The PAS group did not train. The HV training was expected to
be the most efficient training method to improve maximum running velocity because it
can be organized according to the principles of movement specificity and velocity
specificity (Table 5).
The authors concluded that velocity specificity and movement specificity of the training
exercises is of paramount importance for realizing a significant improvement in sprint
performance within 9 week. It is clear that sprint specific approach is necessary to
improve maximum running velocity within a short period.
TABLE 5. Relative changes (%) in high-velocity group and high-resistance group (Modified
from Delecluse et al. 1995).
Variable HV group HR group
0-10 m average acceleration 7.1 1.1
Max velocity 1.4 n.s.
100 m time -1.7 n.s.
3.3 Plyometric training vs. sprint training
Plyometric exercises include vertical jumps and bounds (body moves in horizontal and
vertical planes) and these movements involve stretch-shortening cycle. Plyometrics
develops the ability of muscles to produce power (force at high speeds). (Rimmer &
Sleivert 2000.)
The aim of the study of Rimmer and Sleivert (2000) was to determine the effects of a
sprint-specific plyometrics program on sprint performance. Their subjects were either
rugby (n=22) or touch rugby (n=4) players and they were randomly allocated to the
plyometrics, sprint or control group. The intervention took 8 weeks and the training

16
groups trained twice a week. The plyometrics group performed different kind of vertical
jumps and bounds (body moves in horizontal and vertical planes), and the sprint group
performed maximal effort sprint training (distances 25–55 m).
Improvement in 40 m time was 1.8 % after plyometrics training and 1.1 % after sprint
training. The plyometrics group improved especially over the first 10 m. The authors
thought that improvement in the acceleration phase could be a result of velocity speci-
ficity of plyometric exercise used in their study.
3.4 Summary of the effects of velocity specific training
According to some above mentioned studies, it would seem that adaptations to training
are velocity specific and according to some they are not. In many of those studies,
where adaptations were velocity specific, subjects did not do any additional training. On
the other hand, in many of those studies where authors did not find differences in
adaptations between training velocities, additional training (e.g. sprint training) was
done. An exception was the study of Delecluse et al. (1995), where additional sprint
training was done, but there was still velocity specific adaptation. Other things that may
have influenced on adaptations is the level of subjects (untrained or athletes) and
contrast between “high-velocity” and “low-velocity” training (80 % 1RM vs. 60 %
1RM [Cronin et al. 2001] or heavy load vs. plyometrics [Delecluce et al. 1995]).

17
4 BIOMECHANICS OF SPRINT START
4.1 Contact and flight times
Contact times of sprint running are longest during the block phase and tend to decrease
after it. The decrease will continue till the maximum (constant) velocity is achieved. For
the flight times, the opposite is true: they are short at the beginning and tend to increase
till the maximum (constant) velocity is achieved. Contact and flight times of sprint start
from various studies are presented in Table 6.
TABLE 6. Contact and flight times (ms) of sprint start.
Contact time Contact time Contact time Contact time Contact time
Block phase 310-370 342 365 1st step
193 168 200 177
2nd step
139 173 159
3rd step
159 136
4th step
135 131
5th step
120
6th step
123
7th step
120
8th step
112
9th step
103
10th step
110
Flight time Flight time Flight time Flight time Flight time
1st step
82 45 51
2nd step
101 58 82
3rd step
74 82
4th step
81 99
5th step
89
6th step
98
7th step
101
8th step
112
9th step
105
10th step 116
Subject(s) Skilled Men (100 m: Woman (100 m Man (100 m: Man (100 m:
sprinters 10.79 s) hurdles:13.19 s) 10.80 s) 10.14 s)
Reference Harland & Mero (1988) Coh (2007) Salo et al. Coh (2006)
Steele (1997) (2005)

18
4.2 Force production
An example of force production during the sprint start is presented in Figure 3. The Y-
axis indicates force (N) and the X-axis indicates time (s). The upper part of the figure
presents vertical force and the lower part horizontal force (anterior-posterior force). The
body weight (BW) of this particular subject was about 780 N and it is shown in the
upper part of the figure. The ”cursor 1” is placed at the beginning of the force
production towards the starting blocks and the ”cursor 2” is placed at the end of block
phase force production. The ”cursor 3” points out the beginning and the ”cursor 4” the
end of the force production of the first step after block clearance. The first peak force
achieved in the block phase is a sum of force production through both legs toward the
blocks and the second peak is produced only through the front leg. At the beginning of
the first steps after block clearance there is a short negative force production in
horizontal direction (lower part of the Figure 3). During this negative horizontal force
production, velocity decreases and during the positive horizontal force production,
FIGURE 3. Force production during the block phase and three steps after block clearance. See
text for further information. (Unpublished observation, Okkonen 2009.)

19
velocity increases. During the sprint start peak vertical force tends to increase step by
step and net horizontal impulse (negative horizontal impulse + positive horizontal
impulse) tends to decrease step by step.
4.2.1 Peak forces
The peak forces from the block start in Mero’s (1988) and Salo’s et al. (2005) studies
are presented in Table 7. The vertical peak forces (VPF) were larger than horizontal
peak forces (HPF), and VPF also tend to increase during the first steps.
TABLE 7. Horizontal (HPF), vertical (VPF) and resultant peak forces (RPF) during the block
start.
Phase of the HPF (N) VPF (N) RPF (N) Subject(s) Reference
block start
Block phase 1220 1490 1920* Men (10.79 s) Mero 1988
1st step 790 1460 1660*
1st step 850 1450# 1680* Man (10.80 s) Salo et al. 2005
2nd step 710 1300# 1480* 3rd step 705 1450# 1610* 4th step 750 1600# 1770*
* Computed from the HPF and VPF; # Estimated from a figure
4.2.2 Impulses
Impulse is the integral of force with respect to time. In simple words, impulse = average
force x time (of a force production). Impulse is an important variable because a change
in velocity depends on impulse. For example, during a ground contact in sprint running
velocity is decreased during a braking phase of a contact (negative horizontal force
production → negative horizontal impulse) and increased during a propulsion phase of a
contact (positive horizontal impulse). The different phases of horizontal force pro-
duction are shown in Figure 5. Darkened area under the horizontal line is the area of
negative (braking) force production so the darkened area is the negative horizontal

20
impulse. Lined area in turn represents positive (propulsion) force production so the
lined area represents positive horizontal impulse.
FIGURE 5. An example of horizontal force production during the second step after leaving the
blocks. See text for further information. (Unpublished observation, Okkonen 2009.)
TABLE 8. Horizontal (Hor IMP), vertical (Ver IMP) and resultant impulses (Res IMP) during
the block start.
Phase of the Hor IMP Ver IMP Res IMP Subject(s) Reference
block start (Ns) (Ns) (Ns)
Block phase 223 173 282 Men (10.79 s) Mero 1988
1st step 87* 74 114
Block phase
276 Men (10.27 s) Slawinski et al. 2010
215 Men (11.31 s)
1st step
105 Men (10.27 s)
79 Men (11.31 s)
2nd step
75 Men (10.27 s)
56 Men (11.31 s)
1st step 94*
Man (10.80 s) Salo et al. 2005
2nd step 65*# 3rd step 60*# 4th step 50*#
* Horizontal net impulse (negative impulse + positive impulse); # Estimated from a figure
As it can be seen above (Figure 5 and Table 8), propulsion horizontal impulses are large
compared to braking horizontal impulses during the block phase and few steps after the
block phase. On the other hand, propulsion impulses decrease step by step until constant
velocity is achieved and the opposite is true for braking impulses.

21
4.3 Joint angles and angular velocities
In Mero's (1988) study knee angles of the front and rear legs in the set position were 96°
and 126°, respectively. Same values for hip were 39° and 77°. According to Harland and
Steele (1997), knee angles of front and rear legs are ”usually” between 89–111 ° and
118–136°, respectively and that there are not significant differences in the knee angles
between good and average sprinters. In turn, there seems to be differences in the hip
angles of different level sprinters (good: 41° [front leg] and 80° [rear leg]; average: 52°
[front leg] and 89° [rear leg]). The peak extension velocity values for hip, knee and
ankle joints from various studies are shown in Table 9. For a comparison, there are also
values from maximum running phase (at 45-m and 60-m mark).
TABLE 9. The peak extension velocity values (°/s) for hip, knee and ankle joints at various
phases of sprint running.
Phase PAV (°/s) Number and Reference
Hip Knee Ankle level of subjects
Block start Front leg 460 660 640 8; Elite Slawinski et al.(2010)
Rear leg 200* 100* 380* 16-m mark 740* 400* 1100* 4; Sub elite Hunter et al. (2004)
45-m mark (max) 800* 570* 1400* 4; Elite to regional Bezodis et al. (2008)
60-m mark (max) 774 -50 664 1; Top elite Ito et al. (2008)
60-m mark (max) 693 -68 743 1; Top elite Ito et al. (2008)
* = estimated from figure; max = maximum running phase
As it can be seen from the values above, peak extension values of hip and ankle seems
to be lower and peak extension values of knee extension higher during block phase
when compared to acceleration phase (at the 16-m mark). The values of the study of
Hunter et al. (2004) (at 16-m mark; acceleration) and the values of the study of Bezodis
et al. (2008) (at 45-m mark; maximum speed) were quite similar. But the values of two
maximum speed studies (Bezodis et al.2008 and Ito et al. 2008) were significantly
different, except the values of hip extension velocity. In the former the knee extended in
propulsion phase while in the latter the knee actually bent in propulsion phase.
However, it is good to remember that the actual change in joint angle is not as obvious
as you could assume according the peak angular velocities, because the change in joint

22
angle is the product of the average angular velocity and time.
4.4 Muscle activity
Mero and Komi (1990) and Coh et al. (2007) studied the EMG activity in sprint start.
The results from these two studies were quite similar, although there were also some
differences between the results. In addition, great interindividual variation in the pattern
of muscle activation was noticed in the study of Mero and Komi (1990) which empha-
sizes the complexity of the sprint start.
The gluteus maximus muscles (GM) of the front and rear legs were active at the
beginning of the block phase and GM of the front leg reached another activation peak at
the end of the block phase. GM was also active at the end of the contralateral contact,
probably because of eccentric action. Moreover, the activation was high during the
entire 1st and 2
nd contact phases.
The biceps femoris muscles (BF) were active during the block phase, although the
timing of the peak activation varied among studies (at the beginning / in the middle).
Like GM also, BF was active at the end of the contralateral contact. During the 1st and
2nd
contact phase the activation was highest in the second half of the contact phase.
The vastus lateralis (VL) of the front leg was active throughout the block phase and VL
of the rear leg was active at the beginning of the block phase. During the 1st step the VL
was active throughout the contact phase. The rectus femoris (RF) of the front increased
its activation through block phase. The RF of the rear leg was active at the beginning of
the block phase and after rear leg left the block the RF acted as a hip flexor. RF was also
activated during the swing/flight phase (hip flexion). During the contact phase the
timing of the peak activation varied among studies (at the beginning / at the end).
The peak activation of the gastrocnemius muscles (GA) were achieved in the final phase
of the push off from the blocks. The timing of the peak activation during the contact
phase varied among studies (at the beginning / at the middle).

23
GM, VM, VL, BF (Coh et al. 2007; Mero & Komi 1990) and GA (Mero & Komi 1990)
were activated before the first and second ground contact. Adequate pre-activation is
important because it ensures that muscles are properly rigid to overcome ground
reaction forces (Coh et al. 2007). When muscles are properly rigid at the beginning of
the ground contact, the associated cross-bridges are responsible for the short-range
elastic stiffness, which diminishes the lengthening of the muscle during the initial
ground contact. At the same time, stretch reflex activity enhances the actual muscle
force which enhances the storing of elastic energy in the elastic parts of the associated
muscles and tendons. This permits a powerful push off of the body during the
subsequent concentric phase. (Schmidtbleicher 1992, 383; Komi 1991, 169; Kyröläinen
2004, 150.)

24
5 BIOMECHANICAL COMPARISON BETWEEN SPRINT
START AND SELECTED STRENGTH EXERCISES
There has been only a few studies comparing biomechanics of sprinting and strength
exercises: sprint start vs. sled-pulling (Maulder et al. 2008 and Lockie et al. 2003) and
maximum speed sprinting vs. forward bounding exercises (Mero & Komi 1994).
Moreover, it seems that there has not been any studies executing a biomechanical
comparison between sprint start and squat type exercises.
5.1 Sprint start vs. sled-pulling
Maulder et al. (2008) compared the kinematics of sprint start and sled-pulling. As
subjects they had 10 male sprinters (100 m: 10.87 s). Each subject performed 4 x 10 m
sprints from the starting blocks in three experimental conditions: unresisted sprinting
and sled-pulling with approximately 10 % and 20 % of body mass (BM).
TABLE 10. The values for various kinematic variables in different resistance conditions. Rela-
tive change (%) from unresisted condition is represented in parenthesis. (Modified from
Maulder et al. 2008.)
Variable Unresisted 10 % BM 20 % BM
Start velocity (m/s) 3.4 3.1 (8) 2.9 (15)
Block takeoff angle (°) 42 40 (5) 38 (10)
Force production
time in blocks (ms) 310 330 (6) 340 (10)
1st step CT (ms) 200 210 (5) 220 (10)
2nd step CT (ms) 180 180 (0) 200 (11)
3rd step CT (ms) 160 170 (6) 180 (13)
Step frequency (Hz) 4.26 4.13 (3) 4.07 (5)
Block takeoff angle = the angle (relative to horizontal) between the most front part of the front
foot and the center of gravity at the moment of takeoff; CT = contact time

25
The 10 m time deteriorated from unresisted sprinting by 8 % and 14 % in sled-pulling
with 10 % BM and 20 % BM, respectively. The start velocity (the horizontal velocity at
the moment of takeoff from the starting blocks) decreased in similar way: 8 % and 15
%, respectively. Values for various kinematic variables in different resistance conditions
are shown in Table 10.
Lockie et al. (2003) also studied the effects of sled-pulling on sprint kinematics. Their
subjects (n = 20; i.a. rugby and soccer players; body mass: 82.6 kg) performed 15 m
sprints in three experimental conditions: unresisted and sled pulling with 12.6 % and
32.2 % of body mass (BM). These loads were selected because the aim was to achieve a
10 and 20 % decrease in running speed.
The velocity (hip velocity at takeoff into the second stride) decreased 9 % and 24 %,
respectively. The contact times of the first and second steps increased statistically
significantly in both resisted conditions compared to unresisted condition, and there was
also change in trunk lean (Table 11). Sled-pulling also increased the range of motion
(ROM) of the shoulders and flexion of the hips during the first and second stride.
(Lockie et al. 2003.)
TABLE 11. Contact times of first two steps and trunk lean in relation to vertical line (at the
touchdown of the first stride). Relative change (%) from unresisted condition is represented in
parenthesis. (Modified from Lockie et al. 2003)
Variable Unresisted 13 % BM 32 % BM
1st step CT (ms) 210 230 (10) 250 (19)
2nd step CT (ms) 180 200 (11) 220 (22)
Trunk lean (°) 39 42 (8) 45 (15)
Stride frequency (Hz) 1.8 1.7 (6) 1.7 (6)
The authors suggested that increase in ground contact time seems to be a result of the
athlete requiring more time to produce greater muscular power, in order to overcome the
higher resistance, and would consequently be appropriate for the development of hip
extension power. Increased ROM of shoulder, flexion of hip and trunk lean are also
thought to be positive differences. A vigorous arm action is thought to assist the forward
drive during the sprint start, one of the main muscle groups that increase gait speed is

26
thought to be hip flexors and greater trunk lean might allow greater application of
horizontal force to the ground. The authors concluded that sled-pulling may be very
useful in order to overload an athlete’s sprint technique and develop the specific
recruitment of fast-twitch muscle fibers, particularly compared with traditional weight
training.
5.2 Sprint start and selected squat type exercises
As mentioned earlier, biomechanical comparisons between the sprint start and squat
type exercises have not been performed. Therefore, the following Tables (12, 13 and 14)
include information from several different studies, and the results are not fully compara-
ble because of some methodological reasons (i.a. different subjects). However, it can be
thought that values from different studies describe quite well the exercises and a com-
parison, at least in some level, can be executed. Unfortunately, in many studies only the
peak values are presented, although the average values could possibly tell something
more about exercises.
5.2.1 Peak velocities and force production times
The peak and average concentric velocities, concentric force production times and
contact times from selected squat type exercises and sprint start are shown in Table 12.
As expected the peak concentric velocity increases when the weight in the bar decreases
in squat type movements and the opposite is true for the concentric force production
time. For example, the peak concentric velocity during the block start (Mero 1988) is
7.7 times as great as during the 1RM squat (Escamilla et al. 2001) and, on the other
hand, concentric force production time is 7.8 times as long as in the 1RM squat than in
the block start. The peak concentric velocity in the countermovement jump (CMJ)
(Cormie et al. 2009) is rather similar to the block start velocity (Mero 1988): 3.64 vs.
3.46 m/s, respectively. Also the concentric force production time in the concentric squat
jump with weight of 7 % of 1RM (Kellis et al. 2005) is rather similar to the block start
force production time (Mero 1988): 377 vs. 342 ms, respectively.

27
5.2.2 Peak forces
The peak concentric forces from the selected squat type exercises and sprint start are
presented in Table 13. When the weight in the bar decreases, decreases also the relative
peak force (peak force / body weight). According to the data presented in Table 13, the
relative peak concentric force in the squat jump with the load of 55 % 1RM is similar to
the corresponding force in the block start. Interestingly, when the relative peak force per
leg is examined, the force is greater in the first step after block clearance than in the
isometric squat (knee angle 90°).
5.2.3 Peak angular velocities of hip, knee and ankle
As expected, the peak extension angular velocities of hip, knee and ankle are lowest
during the 1RM squat and increases as extra load decreases (Table 14). In the study of
Kellis et al. (2005) the peak angular velocities of hip, knee and ankle were significantly
higher at the lightest load (7 % 1RM = 10 kg) than with other loads in the concentric
squat jump. Furthermore, peak angular velocity decreased significantly in the two
heaviest loads (62 and 70 % 1RM = 90 and 100 kg). The peak angular velocity of the
hip extension at the lightest load was approximately 680°/s (Kellis et al. 2005) and it is
quite similar than the corresponding angular velocities during acceleration (16-m mark,
Hunter el al. 2004), and during maximum speed running (45-m mark, Bezodis et al.
2008; and 60-m mark, Ito et al. 2008). According to the data presented in Table 14, the
peak angular velocities of the hip extension at the loads from 14 % to 54 % 1RM
corresponds quite well the peak extension velocity of the hip of the front leg during the
block start. The peak angular velocity of the knee extension at the load of 7 % 1RM
(Kellis et al. 2005) exceeds the peak knee extension values achieved at the different
phases of sprinting. The values at the loads of 14–54 % 1RM are rather similar to the
value of the front leg in the block start. The value of the peak angular velocity of the
ankle extension at the load of 7 % 1RM is the closest to the values at the block start and
maximal running (Slawinski et al. 2010 and Ito et al. 2008) (Table 14).

28
TABLE 12. Peak and average concentric velocities, concentric force production times and contact times from the selected squat type exercises and sprint start.
Italicized values are estimated from figures.
Exercise/phase of exercise PCV (m/s) ACV (m/s) FPT (ms) Subject(s) Reference
Powerlifting squat (1RM) 0.45
2680 39 competitive powerlifters Escamilla et al. 2001
Powerlifting squat (1RM) 0.7
2500 25 competitive powerlifters Hales et al. 2009
Concentric SJ 70 % 1RM (knee 80°) 0.78 0.54 1119 8 students (1RM 140kg) Kellis et al. 2005
Concentric SJ 62 % 1RM (knee 80°) 0.9
991 Concentric SJ 54 % 1RM (knee 80°) 1
914
Concentric SJ 47 % 1RM (knee 80°) 1.1
894 Concentric SJ 40 % 1RM (knee 80°) 1.3
773
Concentric SJ 32 % 1RM (knee 80°) 1.5
783 Concentric SJ 28 % 1RM (knee 80°) 1.6
624
Concentric SJ 21 % 1RM (knee 80°) 2
613 Concentric SJ 14 % 1RM (knee 80°) 2.1
500
Concentric SJ 7 % 1RM (knee 80°) 2.5 2.39 377 SJ 74% 1RM 1.62
18 untrained males (1RM 113 kg) Cormie et al. 2008
SJ 55% 1RM 1.86 SJ 37% 1RM 2.15 SJ 18% 1RM 2.56 SJ 0% 1RM 3.09 CMJ 3.64
12 male power ahtletes Cormie et al. 2009
CMJ 3.02
14 untrained males Cormie et al. 2009
Block start 2.84
365 1 female sprinter Coh et al. 2007
1st step 4.03
168 2nd step 4.78
139
Block start 3.46
342 8 male sprinters Mero 1988
1st step 4.65
193 Blocks 3.46-3.94
Skilled sprinters Harland & Steele 1997
1st step 4.65-5.16 Block start 4.18
1 male sprinter Coh et al. 2006
1st step 4.52
177 2nd step 6.05 159
PCV = peak concentric velocity; ACV = average concentric velocity; FPT = force production time; 1RM = 1 repetition maximum; SJ = squat jump; CMJ =
countermovement jump

29
TABLE 13. Peak concentric forces from the selected squat type exercises and sprint start.
Exercise/ Peak Peak Peak Peak Subject(s) Reference
phase of exercise concentric concentric concentric concentric force (N) force / BW force (N) / leg force (N) / leg / BW
Isometric squat (knee 90°)
3.26
1.63 8 students (1RM 140kg) Kellis et al. 2005
Concentric SJ 70 % 1RM (knee 80°)
3.21
1.61 Concentric SJ 7 % 1RM (knee 80°)
2.30
1.15
SJ 74 % 1RM 2292 2.89 1146 1.45 18 untrained males (1RM 113 kg) Cormie et al. 2008
SJ 55% 1RM 2106 2.66 1053 1.33 SJ 37% 1RM 1935 2.44 968 1.22 SJ 18% 1RM 1745 2.20 873 1.10 SJ 0% 1RM 1688 2.13 844 1.06 CMJ 1993 2.38 997 1.19 12 male power ahtletes Cormie et al. 2009
CMJ 1664 2.14 832 1.07 14 untrained males Cormie et al. 2009
Block start (front leg) 1023* 1.86 1023* 1.86 1 female sprinter Coh et al. 2007
Block start (rear leg) 628* 1.14 628* 1.14 Block start (net vertical force) 1426* 1.97
8 male sprinters (100 m: 10.79 s) Mero 1988
Block start 1920*# 2.67 1st step 1660*# 2.31 1660*# 2.31
1st step 1680*# 2.16 1680*# 2.16 1 male sprinter (100 m: 10.80 s) Salo et al. 2005
2nd step 1480*# 1.90 1480*# 1.90 3rd step 1610*# 2.07 1610*# 2.07 4th step 1770*# 2.27 1770*# 2.27
1RM = 1 repetition maximum; SJ = squat jump; CMJ = countermovement jump; * = resultant force; # = computed from peak horizontal and vertical force

30
TABLE 14. Peak extension angular velocities (PAV) of hip, knee and ankle from the selected squat type exercises and sprint start. Italicized values are estimated
from figures.
Exercise/ PAV (°/s) Subject(s) Reference
phase of exercise Hip Knee Ankle
Powerlifting squat (1RM) 109 120 37 39 competitive powerlifters Escamilla et al. 2001
Powerlifting squat (1RM)
170
29 different level powerlifters Miletello et al. 2009
Concentric SJ 70 % 1RM (knee 80°) 350 280 300 8 students (1RM 140kg) Kellis et al. 2005
Concentric SJ 62 % 1RM (knee 80°) 350 400 400 Concentric SJ 54 % 1RM (knee 80°) 450 570 450 Concentric SJ 47 % 1RM (knee 80°) 400 450 570 Concentric SJ 40 % 1RM (knee 80°) 400 570 570 Concentric SJ 32 % 1RM (knee 80°) 450 550 500 Concentric SJ 28 % 1RM (knee 80°) 450 550 400 Concentric SJ 21 % 1RM (knee 80°) 450 650 570 Concentric SJ 14 % 1RM (knee 80°) 450 570 570 Concentric SJ 7 % 1RM (knee 80°) 680 800 680 Block start (front leg) 460 660 640 8 elite sprinters Slawinski et al. 2010
Block start (rear leg) 200 100 380 Acceleration 16-m mark 740 400 1100 4 male sprinters Hunter et al. 2004
Max speed 45-m mark 800 570 1400 4 male sprinters Bezodis et al. 2008
Max speed 60-m mark 774 -50 664 1 top elite sprinter Ito et al. 2008
Max speed 60-m mark 693 -68 743 1 top elite sprinter Ito et al. 2008
1RM = 1 repetition maximum; SJ = squat jump

31
5.3 Associations between sprint start and speed-strength / strength
exercises
Correlations between different exercises and a certain sport event are interesting and
important to know because they can tell, for example, which exercises and/or qualities
are essential in a certain sport event. Thus, it is not surprising that there have been quite
a lot of studies examining correlations between sprint start and speed-strength / strength
exercises (e.g. Young et al. 1995; Cronin & Hansen 2005; Smirniotou et al. 2008). Dif-
ferent kind of vertical and horizontal jumps (e.g. countermovement jump (CMJ), squat
jump (SJ), drop jump (DJ), unilateral horizontal drop jump) are examples of speed-
strength exercises. These kind of speed-strength exercises have correlated quite well
with sprint start (10 m; correlation coefficients between -0.55 and -0.66) (Cronin &
Hansen 2005; Smirniotou et al. 2008; Jonsson Holm et al. 2008). Young et al. (1995)
found even higher correlations when different variables during speed-strength exercise
(static jump squat from knee angle of 120° [19 kg]) were examined. A correlation
coefficient between relative peak force (PF/BW [body weight]) during exercise and
sprint start was -0.86 and corresponding value for relative PF in 100 ms was -0.73.
Correlations between sprint start and strength exercises seem to be more equivocal. In
the study of Harris et al. (2008), 1-RM squat (knee angle 110°) correlated rather poorly
with sprint start (10 m; r=0.2) and, on the other hand, in the study of Young et al. (1995)
PF in isometric squat (knee angle 120°) correlated well (r=-0.72).

32
6 PURPOSE OF THE STUDY
The purpose of the study was to compare kinetics, kinematics and muscle activity
between the sprint start, sled pulling and selected squat type exercises and also to
examine how different exercises and variables correlate with the performance time of
the block start (10 m). Thus, the purpose was to acquire more information about the
relations between these exercises. Ultimately, this new information could probably be
utilized in sprint start training and possibly in general sprint training.
6.1 Research problems
1) Which of the exercise(s) analyzed in the present study is/are movement and/or
velocity specific with regard to the block start?
2) In which exercise(s) the ground reaction forces (GRF) are larger than in the
block start?
3) In which exercise(s) the electromyographic (EMG) values of the gluteus
maximus (GM), biceps femoris (BF) and/or vastus lateralis (VL) are higher than
in the block start?
4) In which exercise(s) the angular velocities of the hip, knee and/or ankle are
higher than in the block start?
5) How different exercise(s) / variable(s) correlate with regard to performance time
of the block start (10 m)?

33
7 METHODS
7.1 Subjects
Subjects included 9 male athletes (4 sprinters, 3 decathlonists, 1 long jumper and 1
triple jumper; mean ± SD; age = 24.9 ± 3.9 yr; height = 180.4 ± 5.9 cm; weight = 80.3 ±
7.5 kg; 100 m record = 11.35 ± 0.29 s). All subjects were familiar with the exercises
done in the present study. Subjects provided informed consent and health inquiry before
the study. Approval for the study was obtained from the ethics committee of the Central
Finland Health Care District.
7.2 Procedures
Subjects attended only one session. At the beginning of the session each subject filled
out informed consent and health inquiry. Then weight and height of the subject were
measured and the locations of the EMG electrodes were defined and shaved (if
necessary). After defining EMG electrode locations (SENIAM), subject did his own
warm up (which usually lasted about 30–40 min). After warm up, electrode locations
were slightly treated with abrasive paper and alcohol to reduce the impedance (< 10
kOhm). Electrodes (Blue sensor N, Ambu A/S, Denmark, Ballerup) were placed only on
the other leg (the front leg in the starting blocks). The EMG activity was measured from
the gluteus maximus (GM), biceps femoris (BF), vastus lateralis (VL) and
gastrocnemius medialis (Ga). After electrode placements, subject tested starting blocks
(Nordic) and after attaching the markers (for 2D movement analysis) subject was ready
to start the measurements. The marker locations were head of the second metatarsal,
calcaneous, lateral malleolus, lateral epicondyle of the femur, greater trochanter and
middle portion of the neck. In CMJ10, CMJ20 and S70, the marker of the neck was
replaced by the marker in the head of the weightlifting bar.
The measurements included following exercises: block start (10 m) (Blocks), sled
pulling with about 10 % and 20 % of body mass (10 m) (Sled10 and Sled20), testing of

34
½-squat 1-RM in smith machine (SMax; Figure 6), countermovement jump (CMJ),
CMJ with a load of about 10 % and 20 % of 1-RM in ½-squat (CMJ10 and CMJ20) and
½-squat with a load of about 70 % of 1-RM in ½-squat (S70). One subject did not do
either S70 or SMAX. The deepness in ½-squat exercises (knee angle 90°) was
controlled by rubber band and visual control. All exercises, except 1-RM ½-squat, were
performed twice. If the subject performed 2-RM squat, 1-RM was calculated (Ahtiainen
& Häkkinen 2010, 147). The exercises were performed in the above mentioned order
and recovery times between repetitions and exercises were about 2–5 minutes to
minimize fatigue accumulation. An exception was 1-RM ½-squat testing which
included own warm up (½-squatting with increasing weights) and the recovery after ½-
squat testing was at least 10–15 minutes before performing next exercise (CMJ).
FIGURE 6. Smith machine which was used in ½-squat 1-RM testing.
In all exercises ground reaction forces (GRF) were measured by strain gauge sensor
force plates (Raute PLC, Finland, Lahti; sampling rate 1000 Hz) and EMG activity was
measured by wireless EMG system (Telemyo DTS, Noraxon U.S.A. Inc., U.S.A.,
Arizona; sampling rate 1500 Hz, gain 1000-fold, band-pass filter 10–500 Hz). All
exercises, except ½-squat 1-RM, were also recorded by high-speed digital video
cameras (Fastec Imaging, Fastec InLine, Fastec Imaging Corporation, U.S.A, San

35
Diego; frequency 250 frames per second, shutter speed 1/500, resolution 640 x 480).
High speed cameras were calibrated before every subject with the calibration frame.
The data from force plates and EMG system passed through analog-to-digital converter
(ADC) to computer and was recorded and analyzed with Signal-program (Signal 4.04,
Cambridge Electronic Design Ltd.). High-speed digital video camera data was recorded
on another computer with FIMS -software (FIMS 3.0.4, Fastec Imaging inc., San Diego,
CA, USA) and analyzed with Vicon Motus -software (Vicon Motus 9.2, Vicon Motion
Systems Inc.). Before analyzing with Vicon Motus, data was converted with MiDAS
Player 2.2.0.8. Measurements were started by manual triggering (Figure 7).
FIGURE 7. Measurement design.
Blocks, Sled10 and Sled20 were performed on the strain gauge force plates which were
embedded in the ground. The force plates covered the distance of 10 meters and were
surfaced with normal synthetic running track (Figure 8). Blocks was performed from
starting blocks and Sled10 and Sled20 from “3-point starting position” (Figure 9). Sled-
pullings were performed with custom made sled (mass 4.9 kg; Figure 10). The sled was
attached to the waist of the subject with rope (17.4 m long) and powerlifting belt. The
placement of the starting blocks on the force plates is presented in Figure 8. The force
plates measured GRFs during the block phase (the phase when force is produced toward
the starting blocks) and at least 6 following steps. GRFs were measured separately from
both legs. Photo cells were used in timing.

36
FIGURE 8. Position of the starting blocks on the force plates.
FIGURE 9. Three-point starting position. FIGURE 10. Custom made sled.
7.3 Analyses
The best trial in each exercise for each subject was analyzed (if the measurements were
successful). Force and EMG data was analyzed manually with Signal -software (Signal
4.04). In Blocks, Sled10 and Sled20, clear increase in the horizontal force (anterior-
posterior) was used as the mark for the beginning of the performance and signal from
photo cells at 10-m mark ended the performance. In most analyses, only “block phase”
(phase of force production toward starting blocks [or corresponding phase in Sled10 and
Sled20]), 2nd
and 6th
step were used. An exception was step frequency which was
presented as a mean value of first six steps. Resultant peak forces (RPF) were calcu-
lated at the moment of vertical peak forces (VPF). Almost all force-time variables were
defined from the propulsion phase of ground contact, with the exception of FPT in

37
which the braking phase was also included. Resultant impulses (Res IMP) and angle of
force productions (angle of FP) were calculated from vertical (net) impulses (Ver IMP)
and horizontal impulses (Hor IMP). The takeoff velocity in the block phase was
computed from Res IMP. In the kinematic analyses, in addition to the block phase, also
the 6th
step was analyzed (flight and contact phase). The flight phase was defined to
begin when the hip of the swinging leg started to extend.
In the CMJs and ½-squats, the beginning of concentric phase was computed from force-
time signal and concentric phases of CMJs and squats were used in analyses. The
takeoff velocity in the CMJs was computed from net concentric impulse. In the
kinematic analyses the beginning of the concentric phase was defined from the
kinematic analyses data.
The EMG values were normalized individually to the EMG values of the CMJ20 when
Blocks was compared to Sled10, Sled20, CMJs and ½-squats. When only Blocks,
Sled10 and Sled20 were compared, the EMG values were normalized to the block phase
of Sled20. These phases of exercises were selected, because the EMG measurements
were most successful in them. Because of some problems in measurements, EMG
values of the gastrocnemius medialis were not analyzed in the present study (small n-
value). Also statistical differences were not calculated for all phases of exercises in
movement analysis, because of low n-value (measurement problems). These phases of
exercises were the flight phase of the 6th
step in Blocks, Sled10, and Sled20 and the
contact phase of the 6th
step in Blocks.
7.4 Statistical analyses
Standard statistical methods were used for the calculation of means and standard
deviations (SD). General linear model (GLM) and repeated measures (PASW Statistics
18 -software) were used to compute statistically significant differences between the
exercises. Spearman's rho was used to calculate correlation coefficients between
performance time in block start (10m) and other variables. An alpha level of p≤0.05 was
chosen as the criterion for significance.

38
8 RESULTS
Average ½-squat 1-RM was 185.5 kg (range: 167–227 kg) and average 1-RM / body
mass was 2.32 (range: 1.91–3.01). Average load used in CMJ10, CMJ20 and S70 were
11.0 % (20.3 kg), 20.6 % (38.1 kg) and 70.2 % (130.3 kg) of SMAX, respectively.
Average load used in Sled10 and Sled20 were 9.9 % (7.9 kg) and 20.1 % (16.1 kg) of
body mass, respectively.
8.1 Force-time variables
8.1.1 Block start vs. sled-pulling, CMJs and ½-squats
Performance times (10 m), force production times (FPT) and resultant impulses (IMP)
were significantly greater and step frequency (over six first steps) significantly smaller
in Sled10 and Sled20 than in Blocks. FPTs in concentric phase during CMJ and CMJ10
were significantly shorter, and FPTs in squats were significantly longer than in Blocks
(Figure 11). Resultant peak forces (RPF) and resultant average forces (RAF; Figure 12)
were significantly greater in CMJs and squats when compared to Blocks (Table 15).
FIGURE 11. Force production times (FPT) (means and standard deviations (SD)) during the
“block phase” in block start (Blocks), sled-pulling with a load of 10 % and 20 % of body mass
(Sled10 and Sled20), and during the concentric phase in countermovement jump (CMJ), CMJ
with a load of 10 % and 20 % of ½-squat 1-RM (CMJ10 and CMJ20), ½-squat with 70 % of ½-
squat 1-RM (S70) and ½-squat 1-RM (SMAX). * Significantly (p≤0.05) different from Blocks.
0.00
0.20
0.40
0.60
0.80
1.00
1.20
1.40
1.60
Fo
rce
pro
du
ctio
n tim
e (
s)
BlocksSled10Sled20CMJCMJ10CMJ20S70SMAX
*
* *
*
*
*

39
TABLE 15. Force-time variables (means and SDs) during the “block phase” in block start
(Blocks), sled-pulling with a load of 10 % and 20 % of body mass (Sled10 and Sled20), and
during the concentric phase in countermovement jump (CMJ), CMJ with a load of 10 % and 20
% of ½-squat 1-RM (CMJ10 and CMJ20), ½-squat with 70 % of ½-squat 1-RM (S70) and ½-
squat 1-RM (SMAX). Step frequency value presents a mean value of first six steps.
Exercise Variable
Performance Step FPT RPF RAF Res IMP Takeoff
time (10 m) frequency
velocity
(s) (Hz) (s) (N) (N) (Ns) (m/s)
Blocks 1.980 4.30 0.355 1722 1172 266 3.28
0.060 0.27 0.024 202 63 22 0.12
Sled10 2.272* 4.18* 0.494* 1747 1086* 299*
0.118 0.27 0.068 186 90 27
Sled20 2.422* 4.00* 0.476* 1780 1128 311*
0.092 0.29 0.053 238 97 26
CMJ
0.261* 2273* 1742* 247* 3.06*
0.013 244 118 21 0.21
CMJ10
0.326* 2231* 1809* 264 2.60*
0.026 131 93 20 0.17
CMJ20
0.372 2292* 1919* 276 2.31*
0.028 116 110 18 0.14
S70
0.737* 2990* 2298*
0.118 307 183
SMAX
1.046* 3152* 2655*
0.359 343 204
FPT = force production time; RPF = resultant peak force; RAF = resultant average force; Res
IMP = resultant impulse; * Significantly (p≤0.05) different from Blocks
8.1.2 Comparison of force-time variables between block phase, 2nd
and 6th
steps
Force-time variables during the different phases of Blocks, Sled10 and Sled20 are
presented in Table 16 and vertical and horizontal forces from the same phases are
presented in Table 17. FPT and Res IMP during the second step were greater and the
angle of force production (angle of FP) smaller in Sled20 when compared to Blocks.
During the 6th
step, FPTs were longer and RPFs, RAFs (Figure 13) and angle of FPs
(Figure 14) were smaller in Sled10 and Sled20 than in Blocks.

40
FIGURE 12. Resultant average forces (RAF) (means and SDs) during the “block phase” in
block start (Blocks), sled-pulling with a load of 10 % and 20 % of body mass (Sled10 and
Sled20), and during the concentric phase in countermovement jump (CMJ), CMJ with a load of
10 % and 20 % of ½-squat 1-RM (CMJ10 and CMJ20), ½-squat with 70 % of ½-squat 1-RM
(S70) and ½-squat 1-RM (SMAX). * Significantly (p≤0.05) different from Blocks.
FIGURE 13. Resultant average forces (RAF) during the “block phase” (B), second (2) and sixth
step (6) in block start (Blocks), and sled-pulling with a load of 10 % and 20 % of body mass
(Sled10 and Sled20). * Significantly (p≤0.05) different from Blocks/B. # Significantly (p≤0.05)
different from Blocks/2 or Blocks/6.
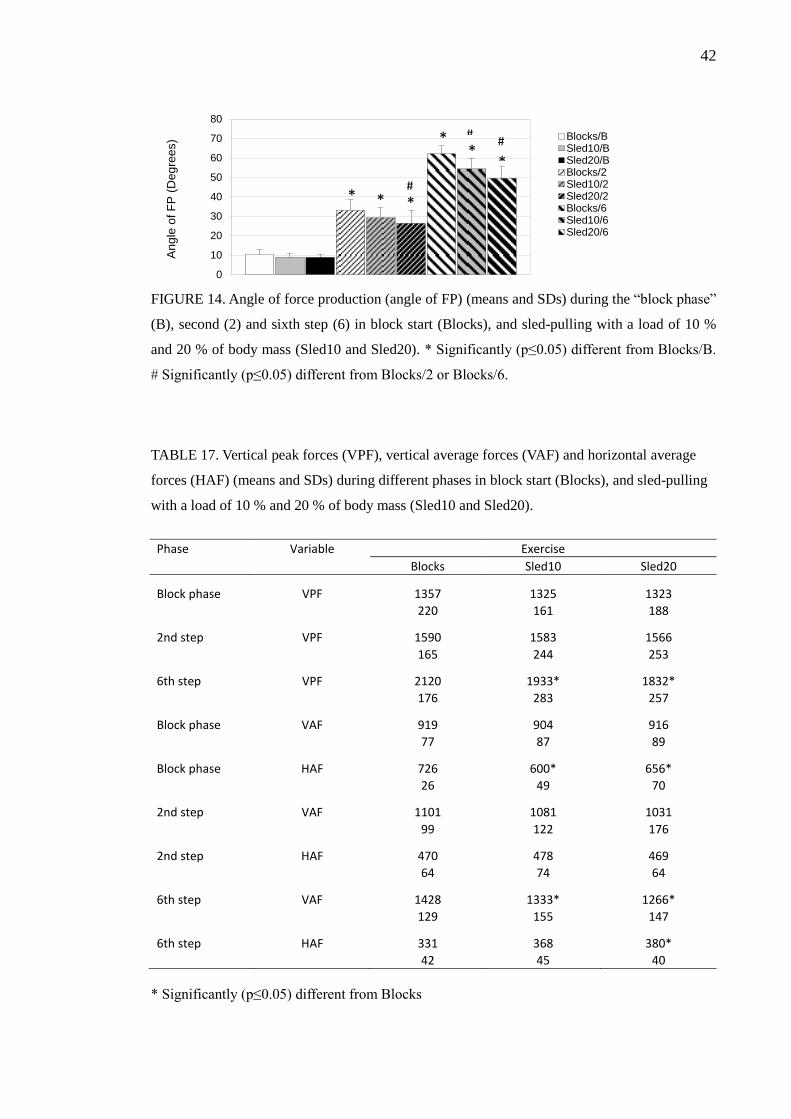
There were no large differences in vertical and horizontal forces during the block phase
and actually, horizontal AFs in Sled10 and Sled20 were significantly smaller than in
Blocks. However, during the 6th
step horizontal AFs were higher and vertical AFs and
PFs were lower, especially in Sled20 (Table 17).
500
1000
1500
2000
2500
3000
3500
RA
F (
N)
Blocks
Sled10
Sled20
CMJ
CMJ10
CMJ20
S70
SMAX
*
* * *
*
*
500
1000
1500
2000
RA
F (
N)
Blocks/B
Sled10/B
Sled20/B
Blocks/2
Sled10/2
Sled20/2
Blocks/6
Sled10/6
Sled20/6
*
* *
*
# #

41
TABLE 16. Force-time variables (means and SDs) during the “block phase” (B), second (2) and
sixth step (6) in block start (Blocks), and sled-pulling with a load of 10 % and 20 % of body
mass (Sled10 and Sled20).
Exercise/ Variable
phase of exercise FPT RPF-Both RPF-Front RAF-Both Res IMP Angle of
(s) (N) (N) (N) (Ns) FP (°)
Blocks/B 0.355 1722 1379 1172 266 10
0.024 202 150 63 22 3
Sled10/B 0.494* 1747 1438 1086* 299* 9
0.068 186 138 90 27 2
Sled20/B 0.476* 1780 1445 1128 311* 9
0.053 238 157 97 26 2
Blocks/2 0.175* 1705 1705* 1198 90* 33*
0.020 191 191 110 10 6
Sled10/2 0.179* 1717 1717* 1183 91* 29*
0.023 248 248 136 13 5
Sled20/2 0.203*# 1720 1720* 1134 101*# 26*#
0.018 250 250 178 12 7
Blocks/6 0.135* 2139* 2139* 1467* 88* 62*
0.014 175 175 124 13 4
Sled10/6 0.150*# 1969*# 1969*# 1384*# 87* 54*#
0.016 292 292 154 15 5
Sled20/6 0.166*# 1887# 1887*# 1322*# 91* 50*#
0.016 257 257 147 14 6
FPT = force production time; RPF-Both = resultant peak force produced through both legs;
RPF-Front = resultant peak force produced through front leg; Res IMP = resultant impulse;
Angle of FP = angle of force production; * Significantly (p≤0.05) different from Blocks/B; #
Significantly (p≤0.05) different from Blocks/2 or Blocks/6
8.1.3 Associations between performance time in block start (10 m) and
force-time variables
The highest correlation existed between takeoff velocity in CMJ and block start (10 m)
(r=-0.950, p≤0.05; Figure 15). Also, for example, takeoff velocity in CMJ10; PF in
squats; AF in CMJs; and relative 1-RM in SMAX (load/BM; Figure 16) correlated
significantly with perfor-mance time in the block start (10 m) (Table 18).
42
FIGURE 14. Angle of force production (angle of FP) (means and SDs) during the “block phase”
(B), second (2) and sixth step (6) in block start (Blocks), and sled-pulling with a load of 10 %
and 20 % of body mass (Sled10 and Sled20). * Significantly (p≤0.05) different from Blocks/B.
# Significantly (p≤0.05) different from Blocks/2 or Blocks/6.
TABLE 17. Vertical peak forces (VPF), vertical average forces (VAF) and horizontal average
forces (HAF) (means and SDs) during different phases in block start (Blocks), and sled-pulling
with a load of 10 % and 20 % of body mass (Sled10 and Sled20).
Phase Variable Exercise
Blocks Sled10 Sled20
Block phase VPF 1357 1325 1323
220 161 188
2nd step VPF 1590 1583 1566
165 244 253
6th step VPF 2120 1933* 1832*
176 283 257
Block phase VAF 919 904 916
77 87 89
Block phase HAF 726 600* 656*
26 49 70
2nd step VAF 1101 1081 1031
99 122 176
2nd step HAF 470 478 469
64 74 64
6th step VAF 1428 1333* 1266*
129 155 147
6th step HAF 331 368 380*
42 45 40
* Significantly (p≤0.05) different from Blocks
0
10
20
30
40
50
60
70
80
An
gle
of F
P (
De
gre
es) Blocks/B
Sled10/BSled20/BBlocks/2Sled10/2Sled20/2Blocks/6Sled10/6Sled20/6
* * *
* *
*
#
# #

43
TABLE 18. Statistically significant correlations between performance time in block start (10 m)
and force-time variables.
Variable Exercise/ R Significance
phase of the exercise
Performance time Sled10 (10 m) 0.733 *
Sled20 (10 m) 0.617 #
Force production time Blocks B 0.600 #
Resultant peak force Sled10 2 0.617 #
Sled20 B -0.600 #
CMJ20 -0.650 #
S70 -0.714 *
SMAX -0.738 *
Resultant average force Blocks B -0.683 *
CMJ -0.933 *
CMJ10 -0.783 *
CMJ20 -0.800 *
SMAX -0.667 #
Resultant impulse Blocks 6 0.867 *
Sled10 6 0.800 *
Sled20 6 0.767 *
Load/BM SMAX -0.810 *
Takeoff velocity CMJ -0.950 *
CMJ10 -0.900 *
CMJ20 -0.683 *
Angle of force production Blocks 6 0.617 #
Step frequency Blocks (10 m) -0.667 *
Sled10 (10 m) -0.650 #
Sled20 (10 m) -0.633 #
Blocks = block start; Sled10 = sled-pulling with a load of 10 % of body mass (BM); Sled20 =
sled-pulling with a load of 20 % of BM; CMJ = countermovement jump; CMJ10 = CMJ with a
load of 10 % of ½-squat 1-RM; CMJ20 = CMJ with a load of 20 % of ½-squat 1-RM; S70 = ½-
squat with 70 % of ½-squat 1-RM (n = 8); SMAX = ½-squat 1-RM (n = 8); B = “block phase”;
2 = second step; 6 = sixth step; * = p≤0.05; # = p≤0.10

44
FIGURE 15. Relationship between 10 m performance time (s) in block start (Blocks) and
takeoff velocity (m/s) in countermovement jump (CMJ).
FIGURE 16. Relationship between 10 m performance time (s) in block start (Blocks) and
relative load (load/body mass [BM]) used in ½-squat 1-RM (SMAX).
8.2 EMG variables
8.2.1 Block start vs. sled-pulling, CMJs and ½-squats
Table 19 presents the integrated EMG (IEMG) and averaged EMG (aEMG) values in
Blocks, Sled10, Sled20, CMJs and squats. The activity of the gluteus maximus (GM)
2.4
2.6
2.8
3.0
3.2
3.4
3.6
1.85 1.90 1.95 2.00 2.05 2.10
CM
J -
Ta
ke
off
ve
locity (
m/s
)
Blocks - 10 m performance time (s)
r = -0.95 p ≤ 0.05 n = 9
1.5
1.9
2.3
2.7
3.1
3.5
1.85 1.90 1.95 2.00 2.05 2.10
SM
AX
- L
oa
d/B
M
Blocks - 10 m performance time (s)
r = -0.81 p ≤ 0.05 n = 8

45
was higher in Sled10, Sled20, CMJ10, CMJ20 and squats (Figure 17). On the other
hand, the activity of the biceps femoris (BF) was lower, especially in CMJs and squats
(Figure 18). The IEMG value of the vastus lateralis (VL) was higher in Sled10 and
squats. However, the aEMG value of VL was quite similar in all exercises.
TABLE 19. Relative integrated EMG (IEMG) and averaged EMG (aEMG) values (means and
SDs) during the “block phase” in block start (Blocks), sled-pulling with a load of 10 % and 20
% of body mass (Sled10 and Sled20), and during the concentric phase in countermovement
jump (CMJ), CMJ with a load of 10 % and 20 % of ½-squat 1-RM (CMJ10 and CMJ20), ½-
squat with 70 % of ½-squat 1-RM (S70) and ½-squat 1-RM (SMAX). (EMG-GM: squats [n=7],
other exercises [n=8]; EMG-BF [n=8])
Exercise Variable
IEMG-GM aEMG-GM IEMG-BF aEMG-BF IEMG-VL aEMG-VL
(%) (%) (%) (%) (%) (%)
Blocks 100 100 100 100 100 100
24 20 43 44 23 20
Sled10 182* 140* 111 88 129* 100
48 30 45 37 36 24
Sled20 175* 139* 95 75* 115 90
35 30 40 33 32 20
CMJ 88 119 35* 47* 85 113
15 18 8 9 18 20
CMJ10 120 131* 43* 46* 101 108
20 28 3 5 15 13
CMJ20 140* 133* 58* 53* 118 111
0 0 0 0 0 0
S70 260* 126 95 45* 210* 102
77 25 37 17 43 18
SMAX 490* 164* 105 35* 275* 92
194 28 63 18 114 24
GM = gluteus maximus; BF = biceps femoris; VL = vastus lateralis; * Significantly (p≤0.05)
different from Blocks

46
FIGURE 17. Relative averaged EMG (aEMG) value of gluteus maximus (GM) (means and
SDs) during the “block phase” in block start (Blocks), sled-pulling with a load of 10 % and 20
% of body mass (Sled10 and Sled20), and during the concentric phase in countermovement
jump (CMJ), CMJ with a load of 10 % and 20 % of ½-squat 1-RM (CMJ10 and CMJ20), ½-
squat with 70 % of ½-squat 1-RM (S70) and ½-squat 1-RM (SMAX). * Significantly (p≤0.05)
different from Blocks.
FIGURE 18. Relative aEMG value of biceps femoris (BF) (means and SDs) during the “block
phase” in block start (Blocks), sled-pulling with a load of 10 % and 20 % of body mass (Sled10
and Sled20), and during the concentric phase in countermovement jump (CMJ), CMJ with a
load of 10 % and 20 % of ½-squat 1-RM (CMJ10 and CMJ20), ½-squat with 70 % of ½-squat
1-RM (S70) and ½-squat 1-RM (SMAX). * Significantly (p≤0.05) different from Blocks.
0
25
50
75
100
125
150
175
200
225
aE
MG
(%)
Blocks
Sled10
Sled20
CMJ
CMJ10
CMJ20
S70
SMAX
* * * *
*
0
25
50
75
100
125
150
175
aE
MG
(%)
Blocks
Sled10
Sled20
CMJ
CMJ10
CMJ20
S70
SMAX
*
* * * * *

47
8.2.2 Comparison of EMG variables between block phase, 2nd
and 6th
steps
The EMG values of GM were quite similar during the second and sixth step in Blocks,
Sled10 and Sled20. During the second step, the aEMG value of GM was greater in
Blocks, Sled20 and Sled20 when compared to the block phase of the Blocks (Blocks/B).
The aEMG value of BF during the second step was smaller in Sled20 and during the
sixth step smaller in Sled10 and Sled20. The EMG values of VL during second and
sixth step were rather similar in Blocks, Sled10 and Sled20 (Table 20).
TABLE 20. . Relative integrated EMG (IEMG) and averaged EMG (aEMG) values (means and
SDs) during the “block phase” (B), and during the contact phase of the second (2) and sixth
step (6) in block start (Blocks), sled-pulling with a load of 10 % and 20 % of body mass (Sled10
and Sled20). (EMG-GM and EMG-BF [n=8]).
Exercise/ Variable
phase of exercise IEMG-GM aEMG-GM IEMG-BF aEMG-BF IEMG-VL aEMG-VL
(%) (%) (%) (%) (%) (%)
Blocks/B 100 100 100 100 100 100
25 23 19 18 22 21
Sled10/B 185* 143* 113 89 127* 99
59 45 20 15 19 19
Sled20/B 172* 136* 94 74* 112 88
0 0 0 0 0 0
Blocks/2 60* 119* 44* 89 45* 89
20 36 14 29 14 27
Sled10/2 73 140* 35* 72* 44* 84*
31 50 10 22 17 28
Sled20/2 85# 145* 36* 63*# 56* 94
26 43 11 16 21 28
Blocks/6 42* 107 45* 120 34* 88*
16 39 9 22 11 32
Sled10/6 44* 101 35*# 85# 39*# 89
20 40 6 13 17 34
Sled20/6 45* 95 41* 89# 36* 76
14 29 13 29 20 39
GM = gluteus maximus; BF = biceps femoris; VL = vastus lateralis; * Significantly (p≤0.05)
different from Blocks/B. # Significantly (p≤0.05) different from Blocks/2 or Blocks/6.

48
8.2.3 Associations between performance time in block start (10 m) and
EMG variables
EMG variables did not correlate as significantly (Table 21) as force-time variables with
block start (10 m). The aEMG value of BF in CMJ and Blocks B, the aEMG value of
VL in Sled10/B and the IEMG value of BF in CMJ correlated significantly with block
start (10 m).
TABLE 21. Statistically significant correlations between performance time in block start (10 m)
and EMG variables.
Variable Exercise/ R Significance N
phase of the exercice
IEMG-GM - -
IEMG-BF Blocks B -0.667 # 8
Blocks 6 C 0.619 # 8
Blocks 6 FC 0.643 # 8
CMJ -0.667 * 9
IEMG-VL - -
aEMG-GM Sled20 6 C 0.643 # 8
Sled20 6 FC 0.619 # 8
SMAX 0.643 # 8
aEMG-BF Blocks B -0.738 * 8
Blocks 6 FC 0.643 # 8
CMJ -0.817 * 9
S70 0.619 # 8
aEMG-VL Blocks B -0.617 # 9
Sled10 B -0.783 * 9
S70 0.643 # 8
IEMG = integrated EMG; aEMG = averaged EMG; GM = gluteus maximus; BF = biceps
femoris; VL = vastus lateralis; Blocks = block start; Sled10 = sled-pulling with a load of 10 %
of body mass (BM); Sled20 = sled-pulling with a load of 20 % of BM; CMJ = counter-
movement jump; S70 = ½-squat with 70 % of ½-squat 1-RM (n = 8); SMAX = ½-squat 1-RM
(n = 8); B = “block phase”; 2 = second step; 6 = sixth step; F = flight phase; C = contact phase;
* = p≤0.05; # = p≤0.10;

49
8.3 Kinematic variables
8.3.1 Block start vs. sled-pulling, CMJs and ½-squats
Table 22 shows peak angular velocities (PAV) and average angular velocities (AAV),
and Table 23 shows minimum (MIN) and maximum angles (MAX) of hip, knee and
ankle during different exercises or phases of exercises. The PAV and AAV of the hip
(Figure 19) and knee (Figure 20) were mostly significantly lower during the block phase
of Sled10 (Sled10/B) and Sled20 (Sled20/B). On the other hand, corresponding values
in CMJ were higher. The PAV and AAV of the knee were also higher in CMJ10 and
CMJ20. During S70 all the PAV and AAV values were lower.
Minimum (MIN) and maximum (MAX) angles (Table 23) were mostly similar in the
block phase of Blocks (Blocks/B), Sled10/B and Sled20/B, although the MIN-ankle was
smaller in Sled10/B and Sled20/B. The MIN-hip was larger in CMJ10, CMJ20 and S70
and, on the other hand, MIN-knee and MIN-ankle were smaller in CMJs and S70. The
MIN-hip seemed to be smaller during Sled20/6 [F], but statistical differences were not
computed from this phase. The MAX-hip was greater in CMJ10, CMJ20 and S70, and
MAX-knee was greater in CMJs and S70.
FIGURE 19. Average angular velocity of the hip joint (AAV-HIP) (means and SDs) during the
“block phase” (B) and the flight [F] and contact phase [C] of the sixth (6) step in block start
(Blocks), sled-pulling with a load of 10 % and 20 % of body mass (Sled10 and Sled20), and
during the concentric phase in countermovement jump (CMJ), CMJ with a load of 10 % and 20
% of ½-squat 1-RM (CMJ10 and CMJ20) and ½-squat with 70 % of ½-squat 1-RM (S70).
* Significantly (p≤0.05) different from Blocks/B. (Note! Statistical differences were not
calculated for Blocks/6 [F], Sled10/6 [F], Sled20/6 [F], Blocks/6 [C]).
0
100
200
300
400
500
600
700
AA
V-H
IP (
°/s)
Blocks/BSled10/BSled20/BBlocks/6 [F]Sled10/6 [F]Sled20/6 [F]Blocks/6 [C]Sled10/6 [C]Sled20/6 [C]CMJCMJ10CMJ20S70
*
*
* *
*
*

50
TABLE 22. Peak angular velocities (PAV) and average angular velocities (AAV) (means and
SDs) of hip, knee and ankle during the “block phase” (B) and the sixth step (6) in block start
(Blocks), sled-pulling with a load of 10 % and 20 % of body mass (Sled10 and Sled20), and
during the concentric phase in countermovement jump (CMJ), CMJ with a load of 10 % and 20
% of ½-squat 1-RM (CMJ10 and CMJ20) and ½-squat with 70 % of ½-squat 1-RM (S70).
(Note! Statistical differences were not calculated for Blocks/6 [F], Sled10/6 [F], Sled20/6 [F],
Blocks/6 [C]).
Exercise/ PAV AAV N
phase of exercise (°/s)
(°/s)
Hip Knee Ankle Hip Knee Ankle
Blocks/B 604 724 836
308 206 138 8
87 97 155
23 38 34
Sled10/B 532* 544* 930*
282 154* 148 8
77 78 132
32 44 19
Sled20/B 477* 536* 899
270* 153* 143 8
60 50 138
27 37 20
Blocks/6 [F] 467 831 173
304 407 34 7
100 116 61
55 72 56
Sled10/6 [F] 493 720 144
322 378 31 7
82 137 52
43 78 45
Sled20/6 [F] 526 594 122
333 314 15 6
45 115 51
14 42 35
Blocks/6 [C] 834 618 1213
504 184 224 5
137 188 189
70 48 65
Sled10/6 [C] 761* 602 1083*
453* 221 250* 8
142 166 120
87 53 53
Sled20/6 [C] 689 556* 1051*
400* 212 232* 8
125 119 150
62 39 32
CMJ 758* 1046* 931
388* 344* 224* 8
79 79 104
33 49 35
CMJ10 642 961* 844
299 297* 189* 8
57 82 68
22 30 22
CMJ20 587 907* 847
259* 259* 165* 8
57 74 93
15 26 24
S70 435* 513* 267*
122* 114* 51* 7
109 133 104 25 19 19
F = flight phase; C = contact phase; * Significantly different from Blocks/B

51
TABLE 23. Minimum (MIN) and maximum (MAX) angles of hip, knee and ankle (means and
SDs) during the “block phase” (B) and the sixth step (6) in block start (Blocks), sled-pulling
with a load of 10 % and 20 % of body mass (Sled10 and Sled20), and during the concentric
phase in countermovement jump (CMJ), CMJ with a load of 10 % and 20 % of ½-squat 1-RM
(CMJ10 and CMJ20) and ½-squat with 70 % of ½-squat 1-RM (S70). (Note! Statistical
differences were not calculated for Blocks/6 [F], Sled10/6 [F], Sled20/6 [F], Blocks/6 [C]).
Exercise / Minimum Maximum N
phase of exercise angle (°)
angle (°)
Hip Knee Ankle Hip Knee Ankle
Blocks/B 53 95 73
158 165 126 8
8 11 6
5 4 8
Sled10/B 53 94 63*
162 160* 123 8
6 7 6
9 5 10
Sled20/B 53 93 63*
161 162 124 8
6 7 6
10 6 10
Blocks/6 [F] 80 92 83
111 131 91 7
9 10 4
7 6 6
Sled10/6 [F] 78 91 80
108 125 86 7
10 10 4
7 6 4
Sled20/6 [F] 72 92 79
102 120 84 6
10 9 5
11 7 5
Blocks/6 [C] 110 126 66
176 156 120 5
6 3 7
9 9 7
Sled10/6 [C] 114* 124* 66*
176* 157* 118* 8
10 3 6
8 7 10
Sled20/6 [C] 106* 121* 64*
172* 158* 119* 8
12 6 6
9 8 8
CMJ 54 79* 60*
159 173* 124 8
8 12 6
5 6 10
CMJ10 73* 77* 60*
171* 174* 125 8
10 12 6
10 4 9
CMJ20 80* 80* 63*
178* 177* 126 8
7 11 6
5 5 8
S70 94* 89* 68*
180* 173* 107* 7
11 9 6 6 6 12
F = flight phase; C = contact phase; * Significantly different from Blocks/B

52
FIGURE 20. Average angular velocity of the knee joint (AAV-KNEE) (means and SDs) during
the “block phase” (B) and the flight [F] and contact phase [C] of the sixth (6) step in block start
(Blocks), sled-pulling with a load of 10 % and 20 % of body mass (Sled10 and Sled20), and
during the concentric phase in countermovement jump (CMJ), CMJ with a load of 10 % and 20
% of ½-squat 1-RM (CMJ10 and CMJ20) and ½-squat with 70 % of ½-squat 1-RM (S70). *
Significantly (p≤0.05) different from Blocks/B. (Note! Statistical differences were not
calculated for Blocks/6 [F], Sled10/6 [F], Sled20/6 [F], Blocks/6 [C]).
8.3.2 Associations between performance time in block start (10 m) and
kinematic variables
From kinematic variables, for example, AAV-hip during Blocks/6 and CMJ, PAV-hip
during CMJ10 and CMJ20, AAV-knee during CMJ and PAV-knee during CMJs corre-
lated significantly with block start (10 m) (Table 24).
0
100
200
300
400
500
600
AA
V-K
NE
E (
s/°
)
Blocks/B
Sled10/B
Sled20/B
Blocks/6 [F]
Sled10/6 [F]
Sled20/6 [F]
Blocks/6 [C]
Sled10/6 [C]
Sled20/6 [C]
CMJ
CMJ10
CMJ20
S70
* *
* *
*
*
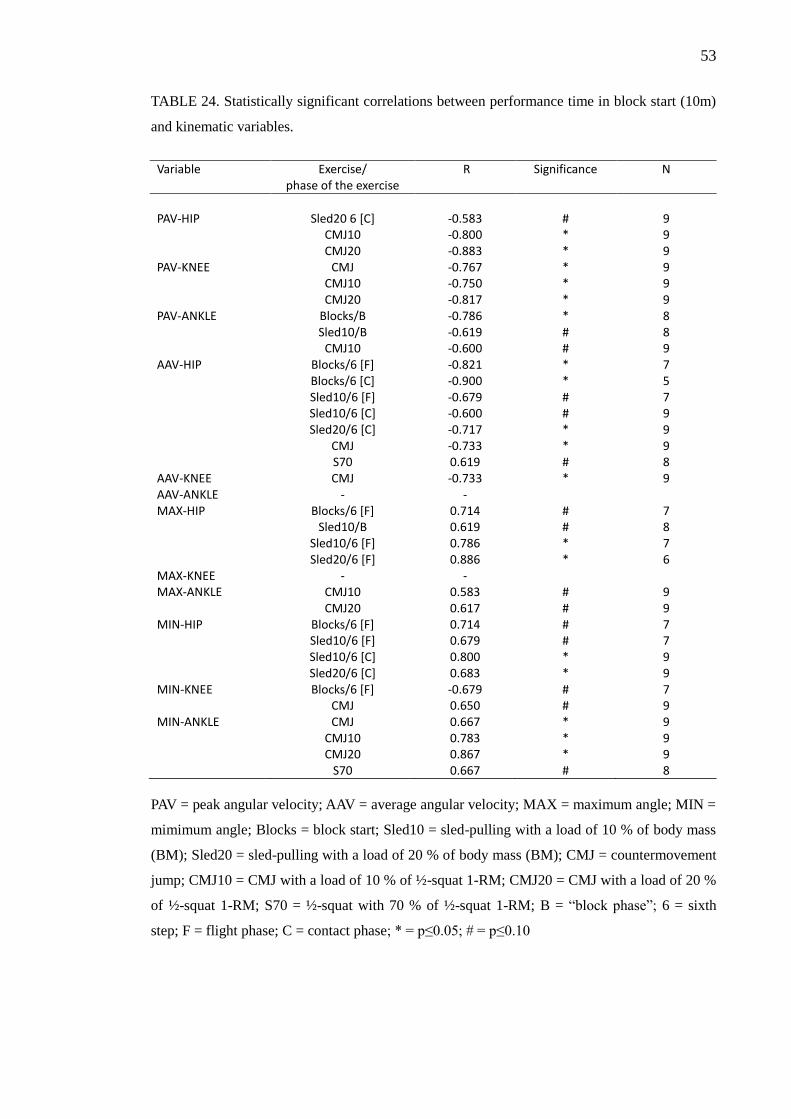
53
TABLE 24. Statistically significant correlations between performance time in block start (10m)
and kinematic variables.
Variable Exercise/ R Significance N
phase of the exercise
PAV-HIP Sled20 6 [C] -0.583 # 9
CMJ10 -0.800 * 9
CMJ20 -0.883 * 9
PAV-KNEE CMJ -0.767 * 9
CMJ10 -0.750 * 9
CMJ20 -0.817 * 9
PAV-ANKLE Blocks/B -0.786 * 8
Sled10/B -0.619 # 8
CMJ10 -0.600 # 9
AAV-HIP Blocks/6 [F] -0.821 * 7
Blocks/6 [C] -0.900 * 5
Sled10/6 [F] -0.679 # 7
Sled10/6 [C] -0.600 # 9
Sled20/6 [C] -0.717 * 9
CMJ -0.733 * 9
S70 0.619 # 8
AAV-KNEE CMJ -0.733 * 9 AAV-ANKLE - -
MAX-HIP Blocks/6 [F] 0.714 # 7
Sled10/B 0.619 # 8
Sled10/6 [F] 0.786 * 7
Sled20/6 [F] 0.886 * 6
MAX-KNEE - -
MAX-ANKLE CMJ10 0.583 # 9
CMJ20 0.617 # 9
MIN-HIP Blocks/6 [F] 0.714 # 7
Sled10/6 [F] 0.679 # 7
Sled10/6 [C] 0.800 * 9
Sled20/6 [C] 0.683 * 9
MIN-KNEE Blocks/6 [F] -0.679 # 7
CMJ 0.650 # 9
MIN-ANKLE CMJ 0.667 * 9
CMJ10 0.783 * 9
CMJ20 0.867 * 9
S70 0.667 # 8
PAV = peak angular velocity; AAV = average angular velocity; MAX = maximum angle; MIN =
mimimum angle; Blocks = block start; Sled10 = sled-pulling with a load of 10 % of body mass
(BM); Sled20 = sled-pulling with a load of 20 % of body mass (BM); CMJ = countermovement
jump; CMJ10 = CMJ with a load of 10 % of ½-squat 1-RM; CMJ20 = CMJ with a load of 20 %
of ½-squat 1-RM; S70 = ½-squat with 70 % of ½-squat 1-RM; B = “block phase”; 6 = sixth
step; F = flight phase; C = contact phase; * = p≤0.05; # = p≤0.10

54
9 DISCUSSION
The primary findings of the present study were that the activity of the gluteus maximus
(GM) was higher and the activity of the biceps femoris (BF) was lower in nearly all
studied exercises when compared them to the block phase of the block start. Another
main finding was that the performance time in the block start (10 m) correlated strongly
with the CMJs. In addition, the force production (peak and average force) in the CMJs
and ½-squats was higher, and in the CMJs also the angular velocity of the knee was
higher. On the other hand, the angular velocities during the S70 were significantly
lower.
9.1 Sled-pulling vs. Block start
As expected the performance time of 10 m run and force pro-duction time (FPT) during
the “block phase” were longer in Sled10 and Sled20. Because of the longer FPTs, also
the impulses (IMP) were larger. In turn, the horizontal average force (HAF) during the
block phase and step frequency over the running distance on the force plates (~8.7 m)
were smaller in Sled10 and Sled20. It was surprising that the HAF was smaller in sled-
pulling, but on the other hand, it probably can be explained with the absence of the
starting blocks in sled-pulling.
The HAFs were larger in both sled-pullings during the 6th
contact, although the differ-
ence was not significant in Sled10. However, the resultant peak forces (RPF) and
resultant average forces (RAF) were smaller during the 6th
contact in both sled-pullings
and reason for this was the smaller vertical peak and average forces (VPF and VAF)
during the 6th
contact. Because of this more pronounced horizontal force production,
also the angle of force production (angle of FP) was smaller (more horizontal) during
the 6th
step and also during the 2nd
step in Sled20. The results of the present study
(longer performance time, FPT, and smaller step frequency and angle of FP) support the
findings of the earlier studies (Maulder et al. 2008 and Lockie et al. 2003). It can be
suggested that sled-pulling is a good exercise (especially during later steps of 10 m

55
start), if the aim is to develop horizontal force production and that heavier sled-pulling
(Sled20 in the present study) might be more efficient in this aspect.
During the block phase the activation of the gluteus maximus (GM) was substantially
higher in the sled-pulling. The integrated EMG (IEMG) was about 80 % and averaged
EMG (aEMG) about 40 % higher in the sled-pulling. The difference in the activation of
the biceps femoris (BF) and the vastus lateralis (VL) was not so obvious, although
IEMG of VL was significantly higher in Sled10 and aEMG of BF was significantly
lower in Sled20. Although some of the difference in the volume of the activation
(IEMG) of GM can be explained with the longer FPT, also the intensity of activation
(aEMG) played a big role. After all, it seems that GM is substantially more activated
and BF somewhat less activated in the sled-pulling than in the block start. The higher
aEMG value could be a result of an increased recruitment, firing rate and/or
synchronization of motor units (Komi 1986) in GM. Moreover, it seems that EMG
activation increases with strength training and the increase might be more pronounced
at the beginning phases of training (4–8 weeks) (e.g. Häkkinen & Komi 1983, Häkkinen
et al. 2000, Reeves et al. 2005). Thus, this increased activation of GM during the sled-
pulling could in long term training lead to increased activation during the block start. It
can be speculated that increased activation of GM would lead to more efficient force
production of GM, which could be beneficial since GM is thought to be important
muscle in sprint running (e.g. Hunter et al. 2004).
During the 2nd
and 6th
step, the activation of GM was not anymore so high when
compared to the block start (the only significant difference was in IEMG of GM during
the 2nd
step of the Sled20). The most obvious difference was in the BF activation and,
especially during the Sled20, aEMG of BF was significantly lower.
As expected, nearly all angular velocities were smaller during the block phase of the
sled-pulling. However, the movement pattern was quite specific to the block start,
because MIN and MAX angles were mostly nearly identical. Although statistical
differences were not computed from the 6th
step between Blocks and sled-pulling, it
seems that the PAV-hip and AAV-hip during the flight phase and AAV-knee during the
contact phase were slightly higher in the sled-pulling. Almost all other angular
velocities were somewhat lower in the sled-pulling when compared to the block start

56
and most of the angular velocities were slightly lower in Sled20 when compared to
Sled10. The most notable difference in the range of motion during the 6th
step was that
the hip of the swinging leg was 10 % more flexed (smaller MIN-hip) during the flight
phase in Sled20. Also Lockie et al. (2003) noticed more pronounced hip flexion during
the sled-pulling and it was more obvious during a heavier sled-pulling. It can be
suggested that Sled10 and Sled20 are quite velocity and movement specific when
compared to Blocks and that hip flexion is more pronounced in Sled20. Moreover,
Mann et al. (1986) suggested that flexion of the hip is the prime mover, when the aim is
to increase the speed of gait. Therefore, more pronounced hip flexion seen in sled-
pulling might be a very essential feature in this exercise.
9.2 CMJs vs. Block start
RPF and RAF were larger in CMJs and both increased as the load increased in CMJs.
These results suggest that CMJs overload the force component of the block start. It can
be speculated that a long term usage of the CMJs in training of sprint start could induce
positive changes on the force-velocity curve and consequently improve the
performance.
In the all CMJs, the clearest difference in the EMG activity to Blocks was in the activity
of BF. Both the IEMG and aEMG values were substantially lower (42–65 %) in CMJs.
On the other hand, in CMJ10 and CMJ20, the aEMG values of GM were significantly
higher. This data suggests that the activation of BF is low and the activation of GM is
high in CMJs as compared to the block phase of the block start. CMJs seem to activate
GM in a similar way as sled-pulling does and thus they could have similar positive
influence on sprint start if used in training of sprinters.
Especially the angular velocities of the knee were higher in CMJs and mean values of
the angular velocities of the hip, knee and ankle in CMJs were highest in CMJ and
lowest in CMJ20. In CMJ without a load, also the angular velocity of the hip was higher
than during the block phase of the block start. One reason for higher angular velocities
seen in CMJs (especially in CMJ without a load) could simply be that the force

57
produced toward the ground was produced by both legs, while during the block phase of
the block start, approximately the second half of the force production time is used when
the force is produced only through the front leg. These results indicate that CMJs are
supra-velocity exercises for the knee joint when compared to the block phase of the
block start and CMJ also for the hip joint. On the other hand, according to the PAV-hip
and PAV-ankle during CMJ10 and CMJ20, it can be suggested that these exercises were
velocity specific with regard to the block phase of the block start. It can be speculated
that the usage of CMJs in training of sprint start could induce positive changes on the
force-velocity curve and thus improve the performance. Moreover, the differences in
MIN and MAX angles were rather small in CMJ, so it can be suggested that CMJ is also
quite movement specific exercise.
9.3 Half squats vs. Block start
FPT, RPF and RAF were substantially larger in the ½-squats (S70 and SMAX) and the
values were larger in the SMAX than in the S70. The values of the ½-squats were also
larger than the values of CMJs. It seems that S70 and SMAX significantly overload the
force component of the block phase of the block start and, thus, if used in training,
could enhance the force component of the force-velocity curve. However, because the
angular velocities of the lower limb joints seems to be substantially lower in the squats,
it can be speculated that the enhancements on the force-velocity curve occurs especially
in lower angular velocities and changes in force production in higher angular velocities
might be less pronounced (Naciri et al. 1989; Ewing Jr. et al. 1990). Moreover, if RPF is
divided to each leg, RPF/leg in the SMAX was 1580 N. When this value is compared to
RPF of the front leg during the block phase (1378 N) the difference is not very large
anymore. Furthermore, when RPF/leg (1580 N) and RAF/leg (1330 N) of SMAX are
compared to RPF (2139 N) and RAF (1467 N) values of the 6th
step of the Blocks, it is
obvious that the GRF values/leg were larger during the 6th
step. One clear difference
between the force production in the ½-squats and 6th
contact was, for example, that
MIN-knee was much smaller in the ½-squats (~90°) than during the 6th
contact (126°).
If the squats would have been done with larger knee angles, GRFs in the squats
probably had been higher. However, this could compromise, at least a little, the EMG

58
activity of GM which has shown to be higher in deeper squats with submaximal loads
(Caterisano et al. 2002).
The IEMG values of GM and VL were remarkably higher in the squats. A lot of the
difference can be explained by longer FPTs in the squats, but in the case of SMAX, also
the aEMG value of GM was significantly higher. In turn, the aEMG value of BF was
remarkably smaller in both S70 and SMAX. Thus, it seems that the intensity of the
activation of GM was notably higher (especially in SMAX) and the intensity of the
activation of BF was notably lower in the squats. It was a bit surprising that the aEMG
value of GM was not higher in S70 than in CMJ10 and CMJ20, despite the higher force
produced in S70. The similarity in the aEMG value of GM between these exercises
could possibly be explained by higher angular velocities (Moritani et al. 2004, 7) of the
hip joint and/or smaller knee (Caterisano et al. 2002) and hip angles during CMJ10 and
CMJ20. However, like in the sled-pulling and CMJs, also in the squats the activation of
GM was higher than in Blocks and, thus, it can be speculated that also the use of the
squat exercise in training would have positive influence in long term on GM activation
during the sprint start. In addition, it seems that the intensity of the activation (aEMG)
was higher in SMAX than in the other exercises and, thus, SMAX could be the most
efficient of these exercises to induce positive intramuscular neural adaptations
(increased motor unit recruitment, firing rate and/or synchronization) in long term
training. However, according to earlier studies (Cormie et al. 2010; Andersen et al.
2005; McBride et al. 2002), transfer of these EMG adaptations to faster contraction
velocities seems to be less pronounced or nonexistent.
The angular velocities were 28–68 % lower in the S70 than in the block phase of the
block start, and although movement analysis was not done for the SMAX, it is likely
that angular velocities were even lower in the SMAX. These results indicate that the ½-
squat with rather a heavy load is not very velocity specific exercise in sprint start
training.

59
9.4 Associations between performance time in block start (10 m) and
studied exercises
Force-time variables. Most of the significant correlations existed between CMJs and
performance time in the block start (10 m). The takeoff velocity in CMJ correlated most
strongly (r=-0.95). Also, for example, the RPF (S70 and SMAX), RAF (CMJs) and
load/body mass (SMAX) correlated significantly.
These findings indicate that high force production during CMJs and squats is important
in achieving a good sprint start. In CMJs this high force production was observed in
high takeoff velocity and thus in high jump height. The takeoff velocity can be
calculated from concentric net impulse by dividing the impulse with body mass (BM)
and thus the relative force production (force/BM) is important. In earlier studies (Cronin
& Hansen 2005; Smirniotou et al. 2008; Jonsson Holm et al. 2008) correlations between
sprint start and speed-strength exercises (different kind of vertical and horizontal jumps)
have been between -0.55 and -0.66, and thus lower than in the present study. However,
in the study of Young et al. (1995) peak force in relation to bodyweight (PF/BW) and
PF/BW in 100ms during a concentric jump squat with 19 kg (knee angle 120°)
correlated quite strongly with sprint start (r=-0.86 and r=-0.73, respectively). In the
same study, also maximum force during the isometric squat (knee 120°) correlated quite
strongly with sprint start (r=-0.72, p=0.07). This correlation was very similar to that
shown in the present study with RPF of SMAX (r=-0.74).
EMG variables. There were clearly less statistically significant (p≤0.05) correlations
between the performance time in Blocks (10m) and EMG variables. The aEMG value of
BF during CMJ correlated most strongly of the EMG variables. Also the aEMG value of
BF during Blocks/B, the aEMG value of VL during Sled10/B and the IEMG value of
BF during CMJ correlated quite strongly. It is difficult to make any final conclusions
according to these correlations, but it can be speculated that high activation of BF
during the block phase might be beneficial.
Kinematic variables. Most of the strong correlations in the kinematic variables were
related to CMJs, and thus it can be speculated that many of these variables (PAV-hip,

60
PAV-knee, AAV-hip, AAV-knee and MIN-ankle) were related to a good performance in
CMJs (high velocity at takeoff → high jump height). These results confirm the
observation from the force-time correlations, where good performances (high jump
height) in CMJs, especially in CMJ and CMJ10, were related to a good performance in
the block start (10 m). In addition, some of the strong correlations were related to
Blocks. For example, high AAV-hip during the 6th
step (flight and contact phase) in
Blocks seems to be important for a good sprint start.
9.5 Limitations and strengths of the present study
From the measurement techniques used in the present study, the surface EMG is
probably the most problematic. Special problems in the measurements of surface EMG
during dynamic muscle contraction include, for example, moving of muscle in relation
to electrode (Felici 2004, 367) and changes in the magnitude of the signal with different
muscle length (decline with the increasing length) (Kamen 2004, 171). However, be-
cause ranges of motions were quite similar between exercises (especially block phase
vs. other exercises) it is possible that these things did not influence much on the results.
Because of technical problems with the EMG system and mistakes in the adjusting of
the cameras, the EMG activity of the gastrocnemius and kinematic variables from some
phases of running could not been analyzed properly. It is also possible that the results of
the present study cannot be generalized to other level male or female sprinters, and thus
it is possible that similar study, for example, with elite-sprinters could give different
results.
The strength of the present study was that sprint start and different speed-strength /
strength exercises were compared widely (force-time, EMG and kinematic variables). In
earlier studies the comparison has not been so wide and, moreover, there has been a lack
of studies comparing sprinting and squat type movements.

61
10 CONCLUSIONS
The exercises of the present study offer some kind of overload when compared to the
block start and, on the other hand, for some variables they offer less loading. It can be
suggested that when the aim is to activate GM intensively and to produce high forces,
SMAX could be the best choice of the exercises analyzed in the present study. However,
it is important to notice that force production through one leg to the ground seems to be
higher during the 6th
step than during the SMAX or all other exercises. If the aim is to
overload the speed-component of the block start, CMJs seem to be the best choices.
Especially CMJ without a load could be a good exercise because, in addition to the
angular velocity of the knee, also the angular velocity of the hip seems to be
substantially higher in CMJ than during the block phase of the block start. Also the
correlation data indicates the importance of CMJs in a good block start (10 m).
Therefore, training which improves the performance in CMJs could improve the
performance in the block start (10 m). The ranges of motions of the lower limb joints
were quite similar in the sled-pulling (Sled10 and Sled20) and CMJ when compared to
the block start. Thus, these exercises seem to be movement specific when compared to
the block phase and the sled-pulling also to the later phase of the block start (10 m). In
the future, similar comparing studies could be done between strength / speed-strength
exercises and acceleration / maximum velocity phase of sprint running. Information
from these exercises could probably be utilized in sprint training.

62
11 REFERENCES
Ahtiainen, J. & Häkkinen, K. 2007. Hermo-lihas-järjestelmän toiminnan mittaaminen.
In: Keskinen, K.L., Häkkinen, K. & Kallinen, M. (ed.) Kuntotestauksen käsikirja. Lii-
kuntatieteellinen seura, Helsinki.
Andersen, L.L., Andersen, J.L., Magnusson, S.P., Suetta, C., Madsen, J.L., Christensen,
L.R. & Aagaard, P. 2005. Changes in the human force-velocity relationship in response
to resistance training and subsequent detraining. Journal of applied physiology 99, 87–
94.
Bezodis, I.N, Kerwin, D.G & Salo, A.I.T. 2008. Lower-limb mechanics the support
phase of maximum-velocity sprint running. Medicine and science in sports and exercise
40 (4), 707–715.
Blazevich, A.J. & Jenkins, D.G. 2002. Effect of the movement speed of resistance
training exercises on sprint and strength performance in concurrently training elite
junior sprinters. Journal of sports sciences, 20 (12), 981–990.
Caterisano, A., Moss, R.F., Pellinger, T.K., Woodruff, K., Lewis, V.C., Booth, W. &
Khadra, T. 2002. The effect of back squat depth on the EMG activity of 4 superficial hip
and thigh muscles. Journal of strength and conditioning research 16 (3), 428–432.
Coh, M., Tomazin, K. & Stuhec, S. 2006. The biomechanical model of the sprint start
and block acceleration. Physical education and sport 4 (2), 103–114.
Coh, M., Peharec, S. & Bacic, P. 2007. The sprint start: Biomechanical analysis of
kinematic, dynamic and electromyographic parameters. IAAF New studies in athletics
22 (3), 29–38.

63
Cormie, P., McBride, J.M. & McCaulley, G.O. 2008. Power-time, Force-time, and
velocity-time curve analysis during the jump squat: impact of load. Journal of applied
biomechanics 24, 112–120.
Cormie, P., McBride, J.M. & McCaulley, G.O. 2009. Power-time, Force-time, and
velocity-time curve analysis of the countermovement jump: impact of training. Journal
of strength and conditioning research 23 (1), 177–186.
Cormie, P., McGuigan M.R. & Newton, R.U. 2010. Adaptations in athletic performance
after ballistic power versus strength training. Medicine and science in sports and
exercise 42 (8), 1582–1598.
Cronin, J.B. & Hansen, K.T. 2005. Strength and power predictors of sports speed.
Journal of strength and conditioning research 19 (2), 349–357.
Cronin, J., McNair, P.J & Marshall, R.N. 2001. Velocity specificity, combination
training and sport specific tasks. Journal of science and medicine in sport 4 (2), 168–
178.
Delecluse, C., van Coppenolle, H., Willems, E., van Leemputte, M., Diels, R. & Goris,
M. 1995. Influence of high-resistance and high-velocity training on sprint performance.
Medicine and science of sports and exercise 27 (8), 1203–1209.
Delecluse, C. 1997. Influence of strength training on sprint running performance:
current findings and implications for training. Sports medicine 24 (3), 147–156.
Escamilla, R.F, Fleisig, G.S, Lowry, T.M, Barrentine, S.W. & Andrews, J.R. 2001. A
three-dimensional biomechanical analysis of the squat during varying stance widths.
Medicine and science in sports and exercise 33 (6), 984–998.
Ewing Jr., J.L., Wolfe, D.R., Rogers, M.A., Amundson, M.L. & Stull, G.A. 1990. Ef-
fects of velocity of isokinetic training on strength, power, and quadriceps muscle fibre
characteristics. European journal of applied physiology and occupational physiology 61,
159–162.

64
Felici, F. 2004. Applications in exercise physiology. In: Merletti, R. & Parker P.A. (ed.)
Electromyography: physiology, engineering, and noninvasive applications. John Wiley
& Sons, New Jersey, USA.
Hales, M.E., Johnson, B.F. & Johnson, J.T. 2009. Kinematic analysis of the powerlifting
style squat and the conventional deadlift during competition: is there a cross-over effect
between lifts? Journal of strength and conditioning research 23 (9), 2574–2580.
Harland, M.J. & Steele, J.R. 1997. Biomechanics of the sprint start. Sports medicine 23
(1), 11–20.
Harris, N.K., Cronin, J.B., Hopkins, W.G & Hansen, K.T. 2008a. Relationship between
sprint times and the strength/power outputs of a machine squat jump. Journal of strength
and conditioning research 22 (3), 691–698.
Harris, N.K., Cronin, J.B., Hopkins, W.G & Hansen, K.T. 2008b. Squat jump training at
maximal power loads vs. heavy loads: effect on sprint ability. Journal of strength and
conditioning research 22 (6), 1742–1749.
Hunter, J.P., Marshall, R.N. & McNair, P.J. 2004. Segment-interaction analysis of the
stance limb in sprint running. Journal of biomechanics 37, 1439–1446.
Häkkinen, K. & Komi, P.V. 1983. Electromyographic changes during strength training
and detraining. Medicine and science in sports and exercise 15, 455–460.
Häkkinen, K., Alen, M., Kallinen, M., Newton, R.U. & Kreamer, W.J. 2000. Neuro-
muscular adaptations during prolonged strength training, detraining and re-strength-
training in middle-aged and elderly people. European journal of applied physiology 83
(1), 51–62.
Ito, A., Fukuda, K & Kijima, K. 2008. Mid-phase sprinting movements of Tyson Gay
and Asafa Powell in the 100-m race during the 2007 IAAF World Championships in
Athletics. IAAF New studies in athletics 23 (2), 39–43.

65
Jonsson Holm, D., Stålbom, M, Keogh, J.W.L. & Cronin, J. 2008. Relationship between
the kinetics and kinematics of a unilateral horizontal drop jump to sprint performance.
Journal of strength and conditioning research 22 (5), 1589–1596.
Kamen, G. 2004. Electromyographic kinesiology. In: Robertson, D.G.E., Caldwell,
G.E., Hamill, J., Kamen,G. & Whittlesey, S.N. (ed.) Research methods in biomechanics.
Human Kinetics, Champaign, IL, USA.
Kellis, E., Arambatzi, F. & Papadopoulos, C. 2005. Effects of load on ground reaction
force and lower limb kinematics during concentric squats. Journal of sports sciences 23
(10), 1045–1055.
Kristensen, G.O., van den Tillaar, R. & Ettema, G.J.C. 2006. Velocity specificity in
early-phase sprint training. Journal of strength and conditioning research 20 (4), 833–
837.
Komi, P.V. 1986. Training of muscle strength and power: interaction of neuromotoric,
hypertrophic, and mechanical factors. International journal of sports medicine 7
(supplement), 10–15.
Komi, P.V. 1991. Stretch-shortening cycle. In: Komi, P.V. (ed.) Strength and power in
sport. Blackwell scientific publications, Oxford.
Kyröläinen, H. 2004. Nopeusvoima. In: Keskinen, K.L., Häkkinen, K. & Kallinen,
M. (ed.) Kuntotestauksen käsikirja. Liikuntatieteellinen seura, Helsinki.
Lockie, R.G., Murphy, A.J. & Spinks C.D. 2003. Effects of resisted sled towing on
sprint kinematics in field-sport athletes. Journal of strength and conditioning research
17 (4), 760–767.
Malisoux, L., Francaux, M. Nielsen, H. & Theisen, D. 2006. Stretch-shortening cycle
exercises: an effective training paradigm to enhance power output of human single
muscle fibers. Journal of applied physiology 100 (3), 771–779.

66
Mann, R.A., Moran, G.T. & Dougherty, S.E. 1986. Comparative electromyography of
the lower extremity in jogging, running, and sprinting. American journal of sports
medicine 14 (6), 501–510.
Maulder, P.S., Bradshaw, E.J. & Keogh, J.W.L. 2008. Kinematic alterations due to
different loading schemes in early acceleration sprint performance from starting blocks.
Journal of strength and conditioning research, 22 (6), 1992–2002.
McBride, J.M., Triplett-McBride, T., Davie, A. & Newton, R.U. 2002. The effect of
heavy- vs. light-load jump squats on the development of strength, power, and speed.
Journal of strength and conditioning research 16(1), 75–82.
Mero, A. 1988. Force-time characteristics and running velocity of male sprinters during
the acceleration phase of sprinting. Research quarterly for exercise and sport 59 (2), 94–
98.
Mero, A. & Komi, P.V. 1990. Reaction time and electromyographic activity during a
sprint start. European journal of applied physiology and occupational physiology 61,
73–80.
Mero, A. & Komi, P.V. 1994. EMG, force, and power analysis of sprint-specific strength
exercises. Journal of applied biomechanics 10, 1–13.
Miletello, W.M, Beam, J.R & Cooper, Z.C. 2009. A biomechanical analysis of the squat
between competitive collegiatem competitive high school, and novice power lifters.
Journal of strength and conditioning research, 23 (5), 1611–1617.
Moritani, T., Stegeman, D. & Merletti, R. 2004. Basic physiology and biophysics of
EMG signal generation. In: Merletti, R. & Parker P.A. (ed.) Electromyography: physi-
ology, engineering, and noninvasive applications. John Wiley & Sons, New Jersey,
USA.

67
Narici, M.V., Roi, G.S., Landoni, L., Minetti, A.E. & Cerretelli, P. 1989. Changes in
force, cross-sectional area and neural activation during strength training and detraining
of the human quadriceps.
Reeves, N.D., Maganaris, C.N. & Narici, M.V. 2005. Plasticity of dynamic muscle
performance with strength training in elderly humans. Muscle nerve 31, 355–364.
Rimmer, E. & Sleivert, G. 2000. Effects of a plyometrics intervention program on sprint
performance. Journal of strength and conditioning research 14 (3), 295–301.
Salo, A.I.T, Keränen, T. & Viitasalo, J.T. 2005. Force production in the first four steps of
sprint running. http://w4.ub.uni-konstanz.de/cpa/article/view/766/689. 13.1.2009.
Sale, D.G. 1991. Neural adaptation to strength training. In: Komi, P.V. (ed.) Strength
and power in sport. Blackwell scientific publications, Oxford.
Schmidtbleicher, D. 1991. Training for power events. In: Komi, P.V. (ed.) Strength and
power in sport. Blackwell scientific publications, Oxford.
Slawinski, J., Bonnefoy, A., Leveque, J.M., Ontanon, G., Riquet, A., Dumas, R. &
Cheze, L. 2010. Kinematic and kinetic comparisons of elite and well-trained sprinters
during sprint start. Journal of strength and conditioning research 24 (4), 896–905.
Slawinski, J., Bonnefoy, A., Ontanon, G., Leveque, J.M., Miller, C., Riquet, A., Cheze,
L. & Dumas, R. 2010. Segment-interaction in sprint start: Analysis of 3D angular
velocity and kinetic energy in elite sprinters. Journal of biomechanics (2010),
doi:10.1016/j.jbiomechanics.2010.01.044.
Smirniotou, A., Katsikas, C., Paradisis, G., Argeitaki, P., Zacharogiannis, E. & Tziortzis,
S. 2008. Strength-power predictors of sprinting performance. Journal of sports medicine
and physical fitness 48, 447–454.
Young, W., McLean, B. & Ardagna, J. 1995. Relationship between strength qualities
and sprinting performance. Journal of sports medicine and physical fitness 35, 13–19.

68
Young, W.B. 2006. Transfer of strength and power training to sports performance.
International journal of sports physiology and performance 1, 74–83.
Zafeiridis, A., Saraslanidis, P., Manou, V., Ioakimidis, P., Dipla, K. & Kellis, S. 2005.
The effects of resisted sled-pulling sprint training on acceleration and maximum speed
performance. Journal of sports medicine and physical fitness, 45 (3), 284–290.

69
ACKNOWLEDGEMENTS
At first I would like to thank Professor Keijo Häkkinen for supervising my master’s
thesis and giving valuable advices during the process. I also would like to thank Laura
Kajovaara who did the measurements with me, Juha Isolehto for helping with the move-
ment analysis, Simon Walker for helping in the familiarization to the EMG measure-
ments, Professor Antti Mero for helping with administrative issues, Professor Heikki
Kyröläinen for constructive advices and all others who helped during the study. At last I
would like to thank the subjects, because without them the present study could not have
been performed.