bioresources physical and contract information thames
TRANSCRIPT

Bioresources physical and contract information Thames Water Utilities Limited (TWUL)
Purpose
This spreadsheet provides information about water and sewerage
company sewage sludge production sites (known as wastewater
treatment works (WwTWs) and sludge treatment facilities (STCs). It
is provided in line with guidelines published by Ofwat on its website.
Companies are required to provide data under the columns marked
mandatory. Any additional information can be provided on a voluntary
basis. The water and sewerage company areas in England and Wales
Water and Sewerage Company name Thames Water Utilities Limited (TWUL)
Financial Year the data relates to 2017-18
Date the spreadsheet was published 31st July 2018
Contact details for anyone wanting to discuss
commercial opportunities arising from this
information
Garry Strange
Sludge Strategy Manager
Brief description of geographical boundary of
data included hereAll current sludge operations within TWUL boundary
Brief description of level of data assurance
This information has been assured as part of company annual performance review.
As such it has undergone an internal check, review and sign off process of the
methodology undertaken and the data produced. The information has then been
externally audited by KMPG. The final data tables have been signed off through a
Board approval process, so that the Board is fully aware of the information being
released.
Summary of significant changes since the most
recently previously published version of the
information and this version
1) Volumes updated with current year.
2) Details of tanker sizes are those currently used for operational issues & road
haulage - see WWTW column V. A potentially larger vehicle could be used if routed
to site differently and access modifications undertaken on site.
3) Sites that don't generally export have been given a nominal 3%DS thickened
sludge figure, but this could vary depending on where in the process the sludge is
tankered from.
4) Volatile matter content given nominal 75% for chemically dosed and 80% for other
sites.
5) Site manned opening times are normally 7am-3pm, Mon-Fri but tanker access
hours shown in WWTW column U and STC column M for STC access hours.
Key: Input cell colour
Spreadsheet template version 1, April 2017
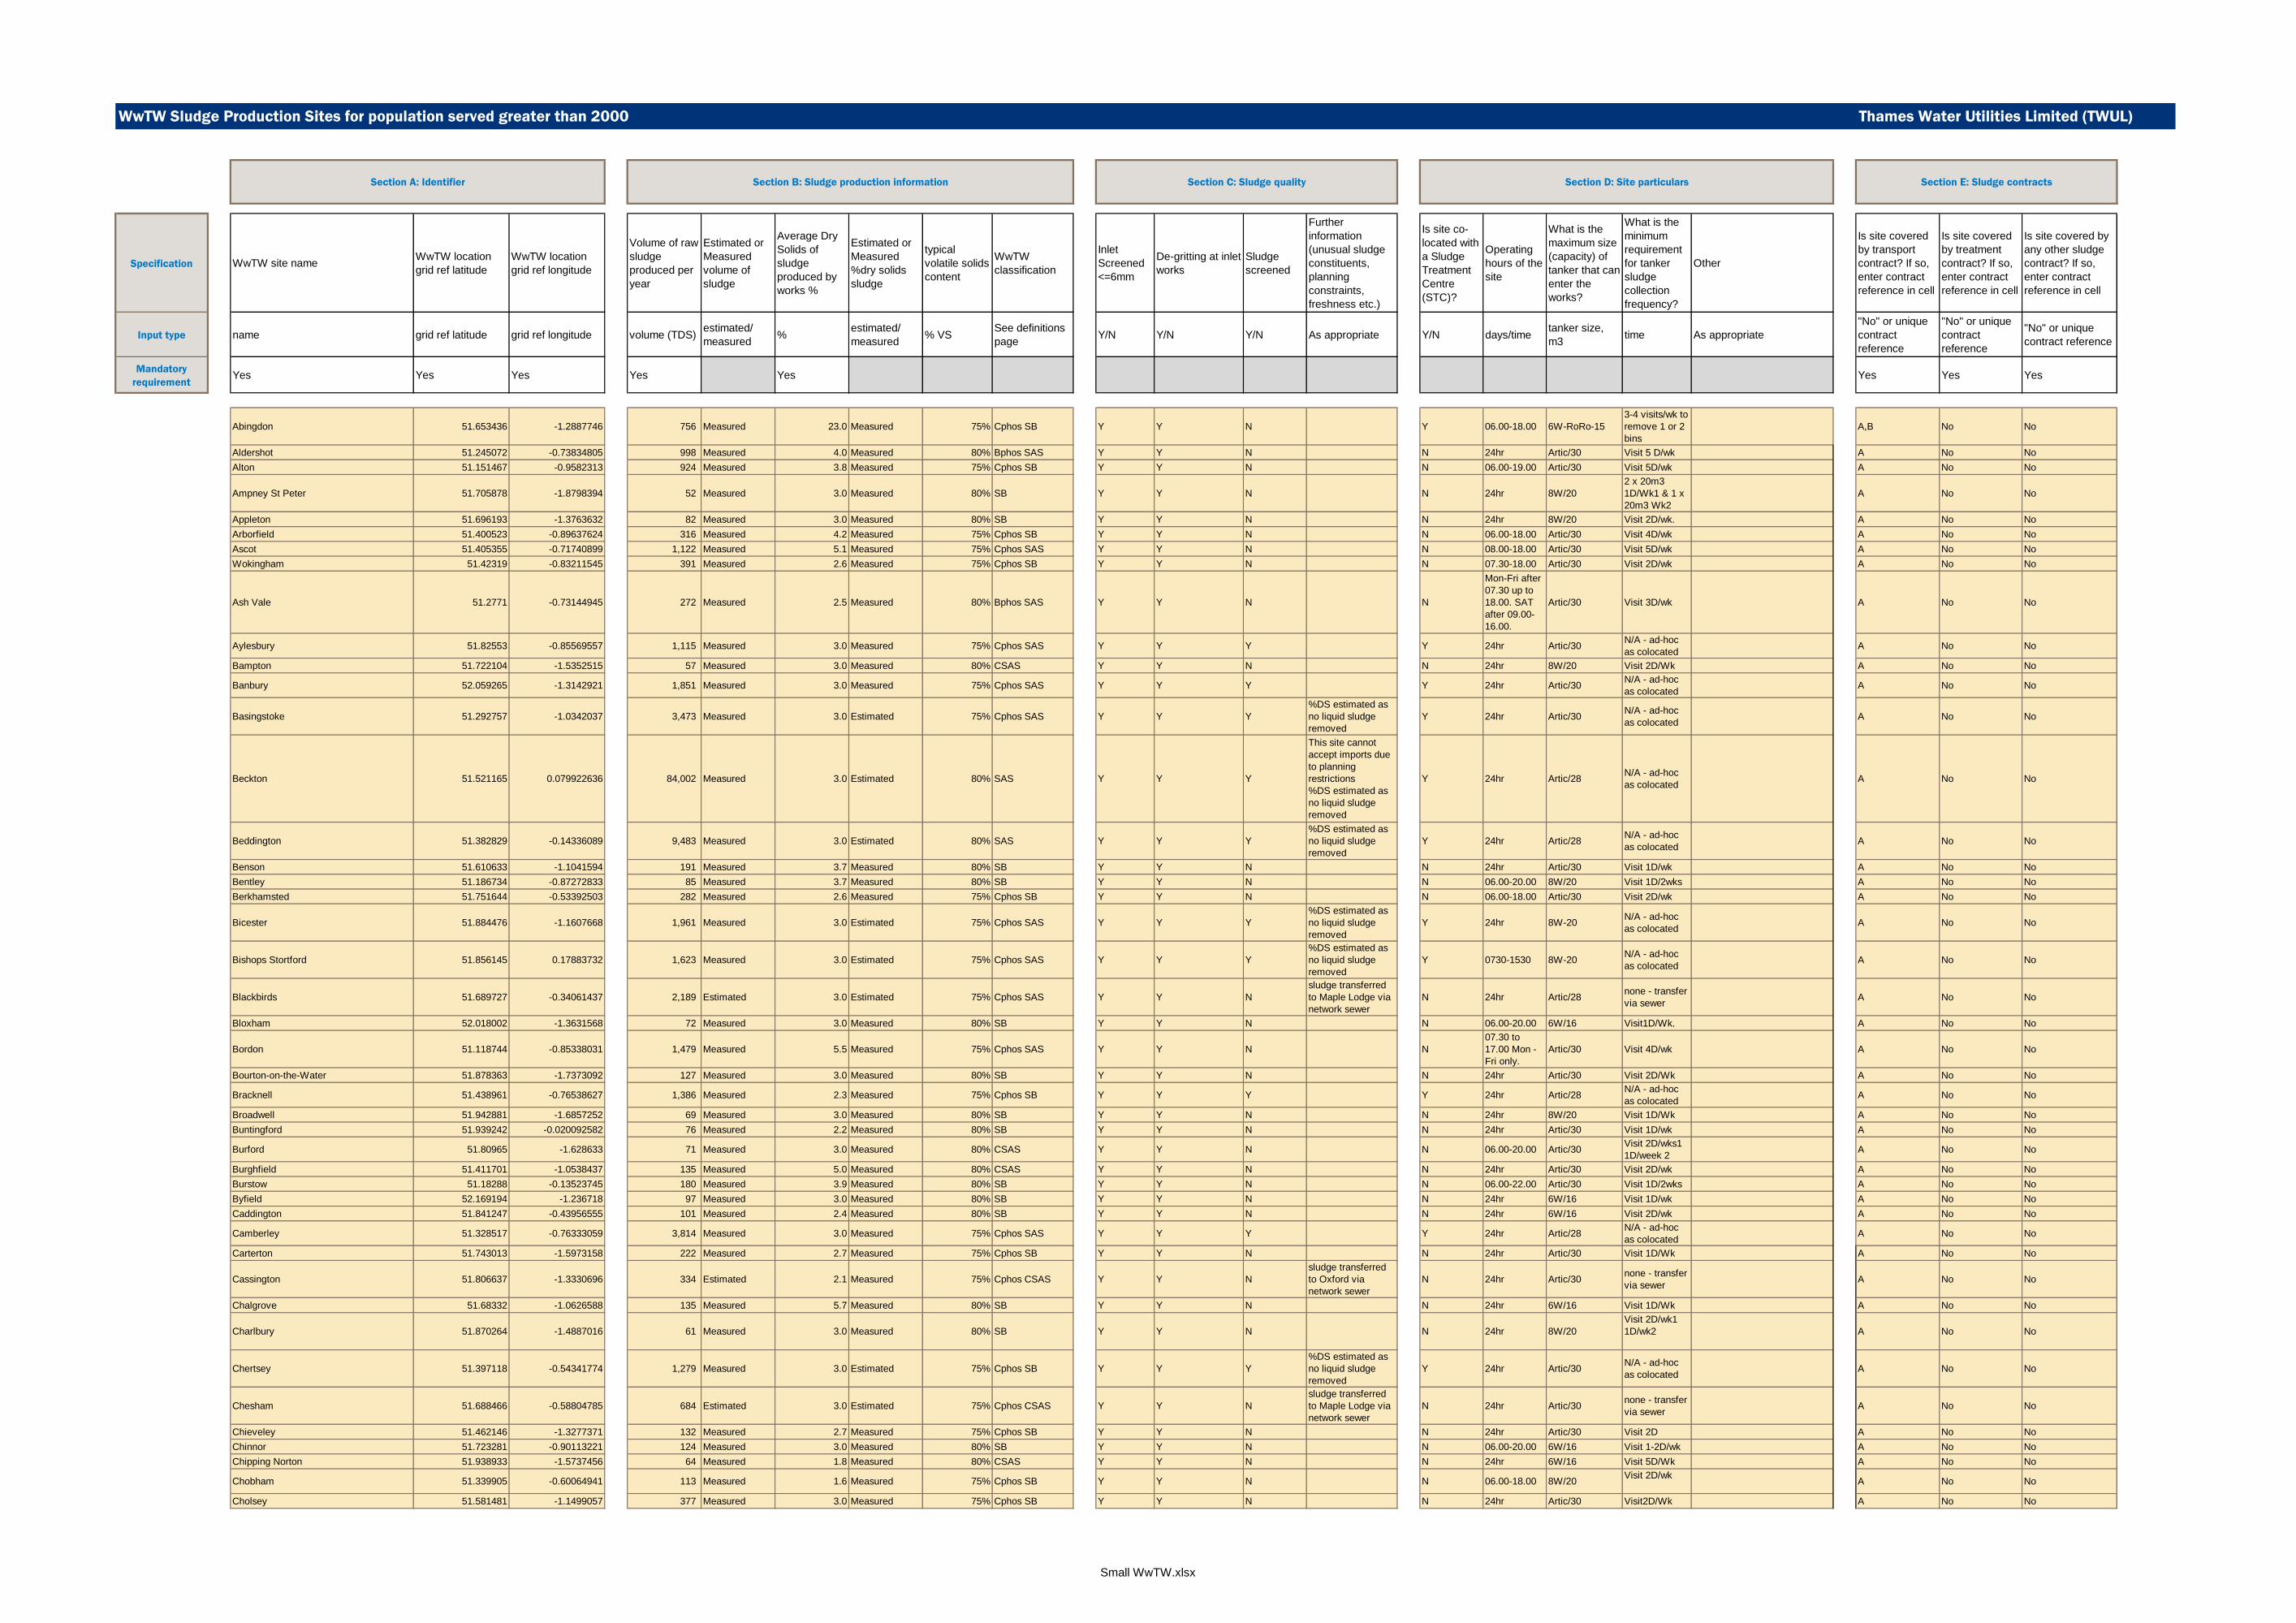
WwTW Sludge Production Sites for population served greater than 2000 Thames Water Utilities Limited (TWUL)
Specification WwTW site nameWwTW location
grid ref latitude
WwTW location
grid ref longitude
Volume of raw
sludge
produced per
year
Estimated or
Measured
volume of
sludge
Average Dry
Solids of
sludge
produced by
works %
Estimated or
Measured
%dry solids
sludge
typical
volatile solids
content
WwTW
classification
Inlet
Screened
<=6mm
De-gritting at inlet
works
Sludge
screened
Further
information
(unusual sludge
constituents,
planning
constraints,
freshness etc.)
Is site co-
located with
a Sludge
Treatment
Centre
(STC)?
Operating
hours of the
site
What is the
maximum size
(capacity) of
tanker that can
enter the
works?
What is the
minimum
requirement
for tanker
sludge
collection
frequency?
Other
Is site covered
by transport
contract? If so,
enter contract
reference in cell
Is site covered
by treatment
contract? If so,
enter contract
reference in cell
Is site covered by
any other sludge
contract? If so,
enter contract
reference in cell
Input type name grid ref latitude grid ref longitude volume (TDS)estimated/
measured%
estimated/
measured% VS
See definitions
pageY/N Y/N Y/N As appropriate Y/N days/time
tanker size,
m3time As appropriate
"No" or unique
contract
reference
"No" or unique
contract
reference
"No" or unique
contract reference
Mandatory
requirementYes Yes Yes Yes Yes Yes Yes Yes
Abingdon 51.653436 -1.2887746 756 Measured 23.0 Measured 75% Cphos SB Y Y N Y 06.00-18.00 6W-RoRo-15
3-4 visits/wk to
remove 1 or 2
bins
A,B No No
Aldershot 51.245072 -0.73834805 998 Measured 4.0 Measured 80% Bphos SAS Y Y N N 24hr Artic/30 Visit 5 D/wk A No No
Alton 51.151467 -0.9582313 924 Measured 3.8 Measured 75% Cphos SB Y Y N N 06.00-19.00 Artic/30 Visit 5D/wk A No No
Ampney St Peter 51.705878 -1.8798394 52 Measured 3.0 Measured 80% SB Y Y N N 24hr 8W/20
2 x 20m3
1D/Wk1 & 1 x
20m3 Wk2
A No No
Appleton 51.696193 -1.3763632 82 Measured 3.0 Measured 80% SB Y Y N N 24hr 8W/20 Visit 2D/wk. A No No
Arborfield 51.400523 -0.89637624 316 Measured 4.2 Measured 75% Cphos SB Y Y N N 06.00-18.00 Artic/30 Visit 4D/wk A No No
Ascot 51.405355 -0.71740899 1,122 Measured 5.1 Measured 75% Cphos SAS Y Y N N 08.00-18.00 Artic/30 Visit 5D/wk A No No
Wokingham 51.42319 -0.83211545 391 Measured 2.6 Measured 75% Cphos SB Y Y N N 07.30-18.00 Artic/30 Visit 2D/wk A No No
Ash Vale 51.2771 -0.73144945 272 Measured 2.5 Measured 80% Bphos SAS Y Y N N
Mon-Fri after
07.30 up to
18.00. SAT
after 09.00-
16.00.
Artic/30 Visit 3D/wk A No No
Aylesbury 51.82553 -0.85569557 1,115 Measured 3.0 Measured 75% Cphos SAS Y Y Y Y 24hr Artic/30N/A - ad-hoc
as colocatedA No No
Bampton 51.722104 -1.5352515 57 Measured 3.0 Measured 80% CSAS Y Y N N 24hr 8W/20 Visit 2D/Wk A No No
Banbury 52.059265 -1.3142921 1,851 Measured 3.0 Measured 75% Cphos SAS Y Y Y Y 24hr Artic/30N/A - ad-hoc
as colocatedA No No
Basingstoke 51.292757 -1.0342037 3,473 Measured 3.0 Estimated 75% Cphos SAS Y Y Y
%DS estimated as
no liquid sludge
removed
Y 24hr Artic/30N/A - ad-hoc
as colocatedA No No
Beckton 51.521165 0.079922636 84,002 Measured 3.0 Estimated 80% SAS Y Y Y
This site cannot
accept imports due
to planning
restrictions
%DS estimated as
no liquid sludge
removed
Y 24hr Artic/28N/A - ad-hoc
as colocatedA No No
Beddington 51.382829 -0.14336089 9,483 Measured 3.0 Estimated 80% SAS Y Y Y
%DS estimated as
no liquid sludge
removed
Y 24hr Artic/28N/A - ad-hoc
as colocatedA No No
Benson 51.610633 -1.1041594 191 Measured 3.7 Measured 80% SB Y Y N N 24hr Artic/30 Visit 1D/wk A No No
Bentley 51.186734 -0.87272833 85 Measured 3.7 Measured 80% SB Y Y N N 06.00-20.00 8W/20 Visit 1D/2wks A No No
Berkhamsted 51.751644 -0.53392503 282 Measured 2.6 Measured 75% Cphos SB Y Y N N 06.00-18.00 Artic/30 Visit 2D/wk A No No
Bicester 51.884476 -1.1607668 1,961 Measured 3.0 Estimated 75% Cphos SAS Y Y Y
%DS estimated as
no liquid sludge
removed
Y 24hr 8W-20N/A - ad-hoc
as colocatedA No No
Bishops Stortford 51.856145 0.17883732 1,623 Measured 3.0 Estimated 75% Cphos SAS Y Y Y
%DS estimated as
no liquid sludge
removed
Y 0730-1530 8W-20N/A - ad-hoc
as colocatedA No No
Blackbirds 51.689727 -0.34061437 2,189 Estimated 3.0 Estimated 75% Cphos SAS Y Y N
sludge transferred
to Maple Lodge via
network sewer
N 24hr Artic/28none - transfer
via sewerA No No
Bloxham 52.018002 -1.3631568 72 Measured 3.0 Measured 80% SB Y Y N N 06.00-20.00 6W/16 Visit1D/Wk. A No No
Bordon 51.118744 -0.85338031 1,479 Measured 5.5 Measured 75% Cphos SAS Y Y N N
07.30 to
17.00 Mon -
Fri only.
Artic/30 Visit 4D/wk A No No
Bourton-on-the-Water 51.878363 -1.7373092 127 Measured 3.0 Measured 80% SB Y Y N N 24hr Artic/30 Visit 2D/Wk A No No
Bracknell 51.438961 -0.76538627 1,386 Measured 2.3 Measured 75% Cphos SB Y Y Y Y 24hr Artic/28N/A - ad-hoc
as colocatedA No No
Broadwell 51.942881 -1.6857252 69 Measured 3.0 Measured 80% SB Y Y N N 24hr 8W/20 Visit 1D/Wk A No No
Buntingford 51.939242 -0.020092582 76 Measured 2.2 Measured 80% SB Y Y N N 24hr Artic/30 Visit 1D/wk A No No
Burford 51.80965 -1.628633 71 Measured 3.0 Measured 80% CSAS Y Y N N 06.00-20.00 Artic/30Visit 2D/wks1
1D/week 2A No No
Burghfield 51.411701 -1.0538437 135 Measured 5.0 Measured 80% CSAS Y Y N N 24hr Artic/30 Visit 2D/wk A No No
Burstow 51.18288 -0.13523745 180 Measured 3.9 Measured 80% SB Y Y N N 06.00-22.00 Artic/30 Visit 1D/2wks A No No
Byfield 52.169194 -1.236718 97 Measured 3.0 Measured 80% SB Y Y N N 24hr 6W/16 Visit 1D/wk A No No
Caddington 51.841247 -0.43956555 101 Measured 2.4 Measured 80% SB Y Y N N 24hr 6W/16 Visit 2D/wk A No No
Camberley 51.328517 -0.76333059 3,814 Measured 3.0 Measured 75% Cphos SAS Y Y Y Y 24hr Artic/28N/A - ad-hoc
as colocatedA No No
Carterton 51.743013 -1.5973158 222 Measured 2.7 Measured 75% Cphos SB Y Y N N 24hr Artic/30 Visit 1D/Wk A No No
Cassington 51.806637 -1.3330696 334 Estimated 2.1 Measured 75% Cphos CSAS Y Y N
sludge transferred
to Oxford via
network sewer
N 24hr Artic/30none - transfer
via sewerA No No
Chalgrove 51.68332 -1.0626588 135 Measured 5.7 Measured 80% SB Y Y N N 24hr 6W/16 Visit 1D/Wk A No No
Charlbury 51.870264 -1.4887016 61 Measured 3.0 Measured 80% SB Y Y N N 24hr 8W/20
Visit 2D/wk1
1D/wk2 A No No
Chertsey 51.397118 -0.54341774 1,279 Measured 3.0 Estimated 75% Cphos SB Y Y Y
%DS estimated as
no liquid sludge
removed
Y 24hr Artic/30N/A - ad-hoc
as colocatedA No No
Chesham 51.688466 -0.58804785 684 Estimated 3.0 Estimated 75% Cphos CSAS Y Y N
sludge transferred
to Maple Lodge via
network sewer
N 24hr Artic/30none - transfer
via sewerA No No
Chieveley 51.462146 -1.3277371 132 Measured 2.7 Measured 75% Cphos SB Y Y N N 24hr Artic/30 Visit 2D A No No
Chinnor 51.723281 -0.90113221 124 Measured 3.0 Measured 80% SB Y Y N N 06.00-20.00 6W/16 Visit 1-2D/wk A No No
Chipping Norton 51.938933 -1.5737456 64 Measured 1.8 Measured 80% CSAS Y Y N N 24hr 6W/16 Visit 5D/Wk A No No
Chobham 51.339905 -0.60064941 113 Measured 1.6 Measured 75% Cphos SB Y Y N N 06.00-18.00 8W/20Visit 2D/wk
A No No
Cholsey 51.581481 -1.1499057 377 Measured 3.0 Measured 75% Cphos SB Y Y N N 24hr Artic/30 Visit2D/Wk A No No
Section A: Identifier Section B: Sludge production information Section C: Sludge quality Section D: Site particulars Section E: Sludge contracts
Small WwTW.xlsx
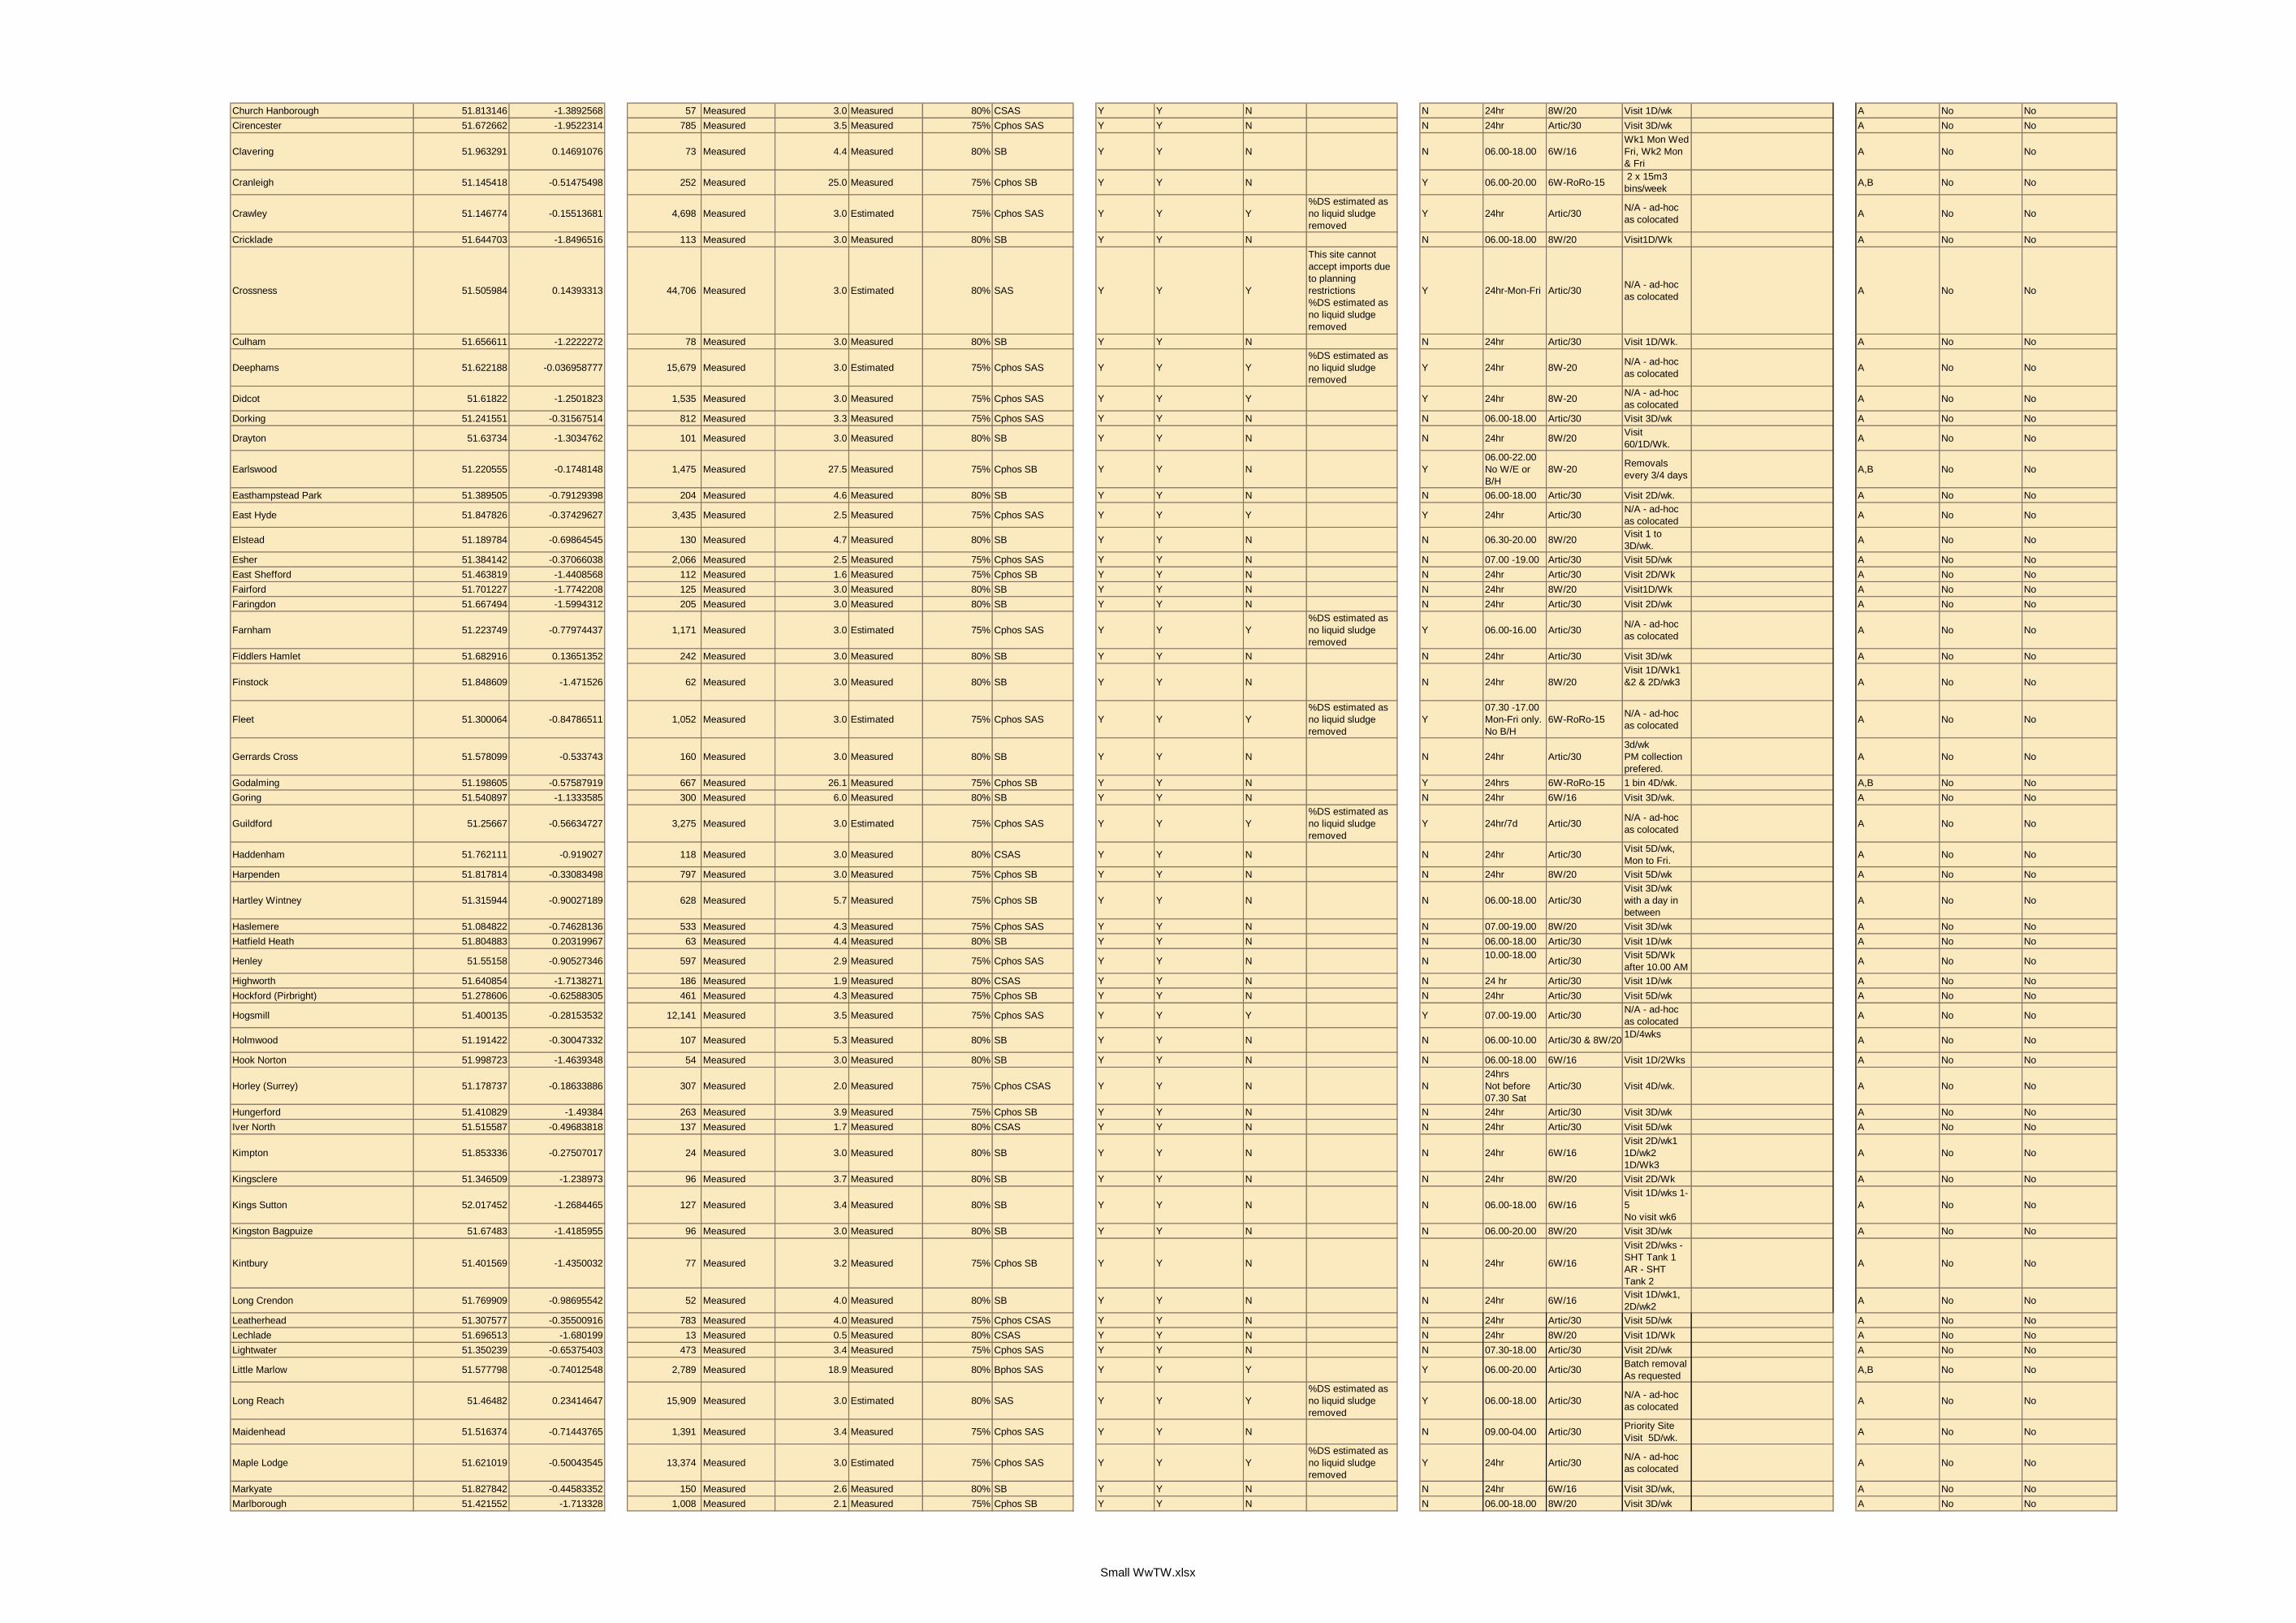
Church Hanborough 51.813146 -1.3892568 57 Measured 3.0 Measured 80% CSAS Y Y N N 24hr 8W/20 Visit 1D/wk A No No
Cirencester 51.672662 -1.9522314 785 Measured 3.5 Measured 75% Cphos SAS Y Y N N 24hr Artic/30 Visit 3D/wk A No No
Clavering 51.963291 0.14691076 73 Measured 4.4 Measured 80% SB Y Y N N 06.00-18.00 6W/16
Wk1 Mon Wed
Fri, Wk2 Mon
& Fri
A No No
Cranleigh 51.145418 -0.51475498 252 Measured 25.0 Measured 75% Cphos SB Y Y N Y 06.00-20.00 6W-RoRo-15 2 x 15m3
bins/weekA,B No No
Crawley 51.146774 -0.15513681 4,698 Measured 3.0 Estimated 75% Cphos SAS Y Y Y
%DS estimated as
no liquid sludge
removed
Y 24hr Artic/30N/A - ad-hoc
as colocatedA No No
Cricklade 51.644703 -1.8496516 113 Measured 3.0 Measured 80% SB Y Y N N 06.00-18.00 8W/20 Visit1D/Wk A No No
Crossness 51.505984 0.14393313 44,706 Measured 3.0 Estimated 80% SAS Y Y Y
This site cannot
accept imports due
to planning
restrictions
%DS estimated as
no liquid sludge
removed
Y 24hr-Mon-Fri Artic/30N/A - ad-hoc
as colocatedA No No
Culham 51.656611 -1.2222272 78 Measured 3.0 Measured 80% SB Y Y N N 24hr Artic/30 Visit 1D/Wk. A No No
Deephams 51.622188 -0.036958777 15,679 Measured 3.0 Estimated 75% Cphos SAS Y Y Y
%DS estimated as
no liquid sludge
removed
Y 24hr 8W-20N/A - ad-hoc
as colocatedA No No
Didcot 51.61822 -1.2501823 1,535 Measured 3.0 Measured 75% Cphos SAS Y Y Y Y 24hr 8W-20N/A - ad-hoc
as colocatedA No No
Dorking 51.241551 -0.31567514 812 Measured 3.3 Measured 75% Cphos SAS Y Y N N 06.00-18.00 Artic/30 Visit 3D/wk A No No
Drayton 51.63734 -1.3034762 101 Measured 3.0 Measured 80% SB Y Y N N 24hr 8W/20Visit
60/1D/Wk. A No No
Earlswood 51.220555 -0.1748148 1,475 Measured 27.5 Measured 75% Cphos SB Y Y N Y
06.00-22.00
No W/E or
B/H
8W-20Removals
every 3/4 days A,B No No
Easthampstead Park 51.389505 -0.79129398 204 Measured 4.6 Measured 80% SB Y Y N N 06.00-18.00 Artic/30 Visit 2D/wk. A No No
East Hyde 51.847826 -0.37429627 3,435 Measured 2.5 Measured 75% Cphos SAS Y Y Y Y 24hr Artic/30N/A - ad-hoc
as colocatedA No No
Elstead 51.189784 -0.69864545 130 Measured 4.7 Measured 80% SB Y Y N N 06.30-20.00 8W/20Visit 1 to
3D/wk. A No No
Esher 51.384142 -0.37066038 2,066 Measured 2.5 Measured 75% Cphos SAS Y Y N N 07.00 -19.00 Artic/30 Visit 5D/wk A No No
East Shefford 51.463819 -1.4408568 112 Measured 1.6 Measured 75% Cphos SB Y Y N N 24hr Artic/30 Visit 2D/Wk A No No
Fairford 51.701227 -1.7742208 125 Measured 3.0 Measured 80% SB Y Y N N 24hr 8W/20 Visit1D/Wk A No No
Faringdon 51.667494 -1.5994312 205 Measured 3.0 Measured 80% SB Y Y N N 24hr Artic/30 Visit 2D/wk A No No
Farnham 51.223749 -0.77974437 1,171 Measured 3.0 Estimated 75% Cphos SAS Y Y Y
%DS estimated as
no liquid sludge
removed
Y 06.00-16.00 Artic/30N/A - ad-hoc
as colocatedA No No
Fiddlers Hamlet 51.682916 0.13651352 242 Measured 3.0 Measured 80% SB Y Y N N 24hr Artic/30 Visit 3D/wk A No No
Finstock 51.848609 -1.471526 62 Measured 3.0 Measured 80% SB Y Y N N 24hr 8W/20
Visit 1D/Wk1
&2 & 2D/wk3 A No No
Fleet 51.300064 -0.84786511 1,052 Measured 3.0 Estimated 75% Cphos SAS Y Y Y
%DS estimated as
no liquid sludge
removed
Y
07.30 -17.00
Mon-Fri only.
No B/H
6W-RoRo-15N/A - ad-hoc
as colocatedA No No
Gerrards Cross 51.578099 -0.533743 160 Measured 3.0 Measured 80% SB Y Y N N 24hr Artic/30
3d/wk
PM collection
prefered.
A No No
Godalming 51.198605 -0.57587919 667 Measured 26.1 Measured 75% Cphos SB Y Y N Y 24hrs 6W-RoRo-15 1 bin 4D/wk. A,B No No
Goring 51.540897 -1.1333585 300 Measured 6.0 Measured 80% SB Y Y N N 24hr 6W/16 Visit 3D/wk. A No No
Guildford 51.25667 -0.56634727 3,275 Measured 3.0 Estimated 75% Cphos SAS Y Y Y
%DS estimated as
no liquid sludge
removed
Y 24hr/7d Artic/30N/A - ad-hoc
as colocatedA No No
Haddenham 51.762111 -0.919027 118 Measured 3.0 Measured 80% CSAS Y Y N N 24hr Artic/30Visit 5D/wk,
Mon to Fri.A No No
Harpenden 51.817814 -0.33083498 797 Measured 3.0 Measured 75% Cphos SB Y Y N N 24hr 8W/20 Visit 5D/wk A No No
Hartley Wintney 51.315944 -0.90027189 628 Measured 5.7 Measured 75% Cphos SB Y Y N N 06.00-18.00 Artic/30
Visit 3D/wk
with a day in
between
A No No
Haslemere 51.084822 -0.74628136 533 Measured 4.3 Measured 75% Cphos SAS Y Y N N 07.00-19.00 8W/20 Visit 3D/wk A No No
Hatfield Heath 51.804883 0.20319967 63 Measured 4.4 Measured 80% SB Y Y N N 06.00-18.00 Artic/30 Visit 1D/wk A No No
Henley 51.55158 -0.90527346 597 Measured 2.9 Measured 75% Cphos SAS Y Y N N10.00-18.00
Artic/30Visit 5D/Wk
after 10.00 AMA No No
Highworth 51.640854 -1.7138271 186 Measured 1.9 Measured 80% CSAS Y Y N N 24 hr Artic/30 Visit 1D/wk A No No
Hockford (Pirbright) 51.278606 -0.62588305 461 Measured 4.3 Measured 75% Cphos SB Y Y N N 24hr Artic/30 Visit 5D/wk A No No
Hogsmill 51.400135 -0.28153532 12,141 Measured 3.5 Measured 75% Cphos SAS Y Y Y Y 07.00-19.00 Artic/30N/A - ad-hoc
as colocatedA No No
Holmwood 51.191422 -0.30047332 107 Measured 5.3 Measured 80% SB Y Y N N 06.00-10.00 Artic/30 & 8W/201D/4wks
A No No
Hook Norton 51.998723 -1.4639348 54 Measured 3.0 Measured 80% SB Y Y N N 06.00-18.00 6W/16 Visit 1D/2Wks A No No
Horley (Surrey) 51.178737 -0.18633886 307 Measured 2.0 Measured 75% Cphos CSAS Y Y N N
24hrs
Not before
07.30 Sat
Artic/30 Visit 4D/wk. A No No
Hungerford 51.410829 -1.49384 263 Measured 3.9 Measured 75% Cphos SB Y Y N N 24hr Artic/30 Visit 3D/wk A No No
Iver North 51.515587 -0.49683818 137 Measured 1.7 Measured 80% CSAS Y Y N N 24hr Artic/30 Visit 5D/wk A No No
Kimpton 51.853336 -0.27507017 24 Measured 3.0 Measured 80% SB Y Y N N 24hr 6W/16
Visit 2D/wk1
1D/wk2
1D/Wk3
A No No
Kingsclere 51.346509 -1.238973 96 Measured 3.7 Measured 80% SB Y Y N N 24hr 8W/20 Visit 2D/Wk A No No
Kings Sutton 52.017452 -1.2684465 127 Measured 3.4 Measured 80% SB Y Y N N 06.00-18.00 6W/16
Visit 1D/wks 1-
5
No visit wk6
A No No
Kingston Bagpuize 51.67483 -1.4185955 96 Measured 3.0 Measured 80% SB Y Y N N 06.00-20.00 8W/20 Visit 3D/wk A No No
Kintbury 51.401569 -1.4350032 77 Measured 3.2 Measured 75% Cphos SB Y Y N N 24hr 6W/16
Visit 2D/wks -
SHT Tank 1
AR - SHT
Tank 2
A No No
Long Crendon 51.769909 -0.98695542 52 Measured 4.0 Measured 80% SB Y Y N N 24hr 6W/16Visit 1D/wk1,
2D/wk2 A No No
Leatherhead 51.307577 -0.35500916 783 Measured 4.0 Measured 75% Cphos CSAS Y Y N N 24hr Artic/30 Visit 5D/wk A No No
Lechlade 51.696513 -1.680199 13 Measured 0.5 Measured 80% CSAS Y Y N N 24hr 8W/20 Visit 1D/Wk A No No
Lightwater 51.350239 -0.65375403 473 Measured 3.4 Measured 75% Cphos SAS Y Y N N 07.30-18.00 Artic/30 Visit 2D/wk A No No
Little Marlow 51.577798 -0.74012548 2,789 Measured 18.9 Measured 80% Bphos SAS Y Y Y Y 06.00-20.00 Artic/30Batch removal
As requestedA,B No No
Long Reach 51.46482 0.23414647 15,909 Measured 3.0 Estimated 80% SAS Y Y Y
%DS estimated as
no liquid sludge
removed
Y 06.00-18.00 Artic/30N/A - ad-hoc
as colocatedA No No
Maidenhead 51.516374 -0.71443765 1,391 Measured 3.4 Measured 75% Cphos SAS Y Y N N 09.00-04.00 Artic/30Priority Site
Visit 5D/wk.A No No
Maple Lodge 51.621019 -0.50043545 13,374 Measured 3.0 Estimated 75% Cphos SAS Y Y Y
%DS estimated as
no liquid sludge
removed
Y 24hr Artic/30N/A - ad-hoc
as colocatedA No No
Markyate 51.827842 -0.44583352 150 Measured 2.6 Measured 80% SB Y Y N N 24hr 6W/16 Visit 3D/wk, A No No
Marlborough 51.421552 -1.713328 1,008 Measured 2.1 Measured 75% Cphos SB Y Y N N 06.00-18.00 8W/20 Visit 3D/wk A No No
Small WwTW.xlsx
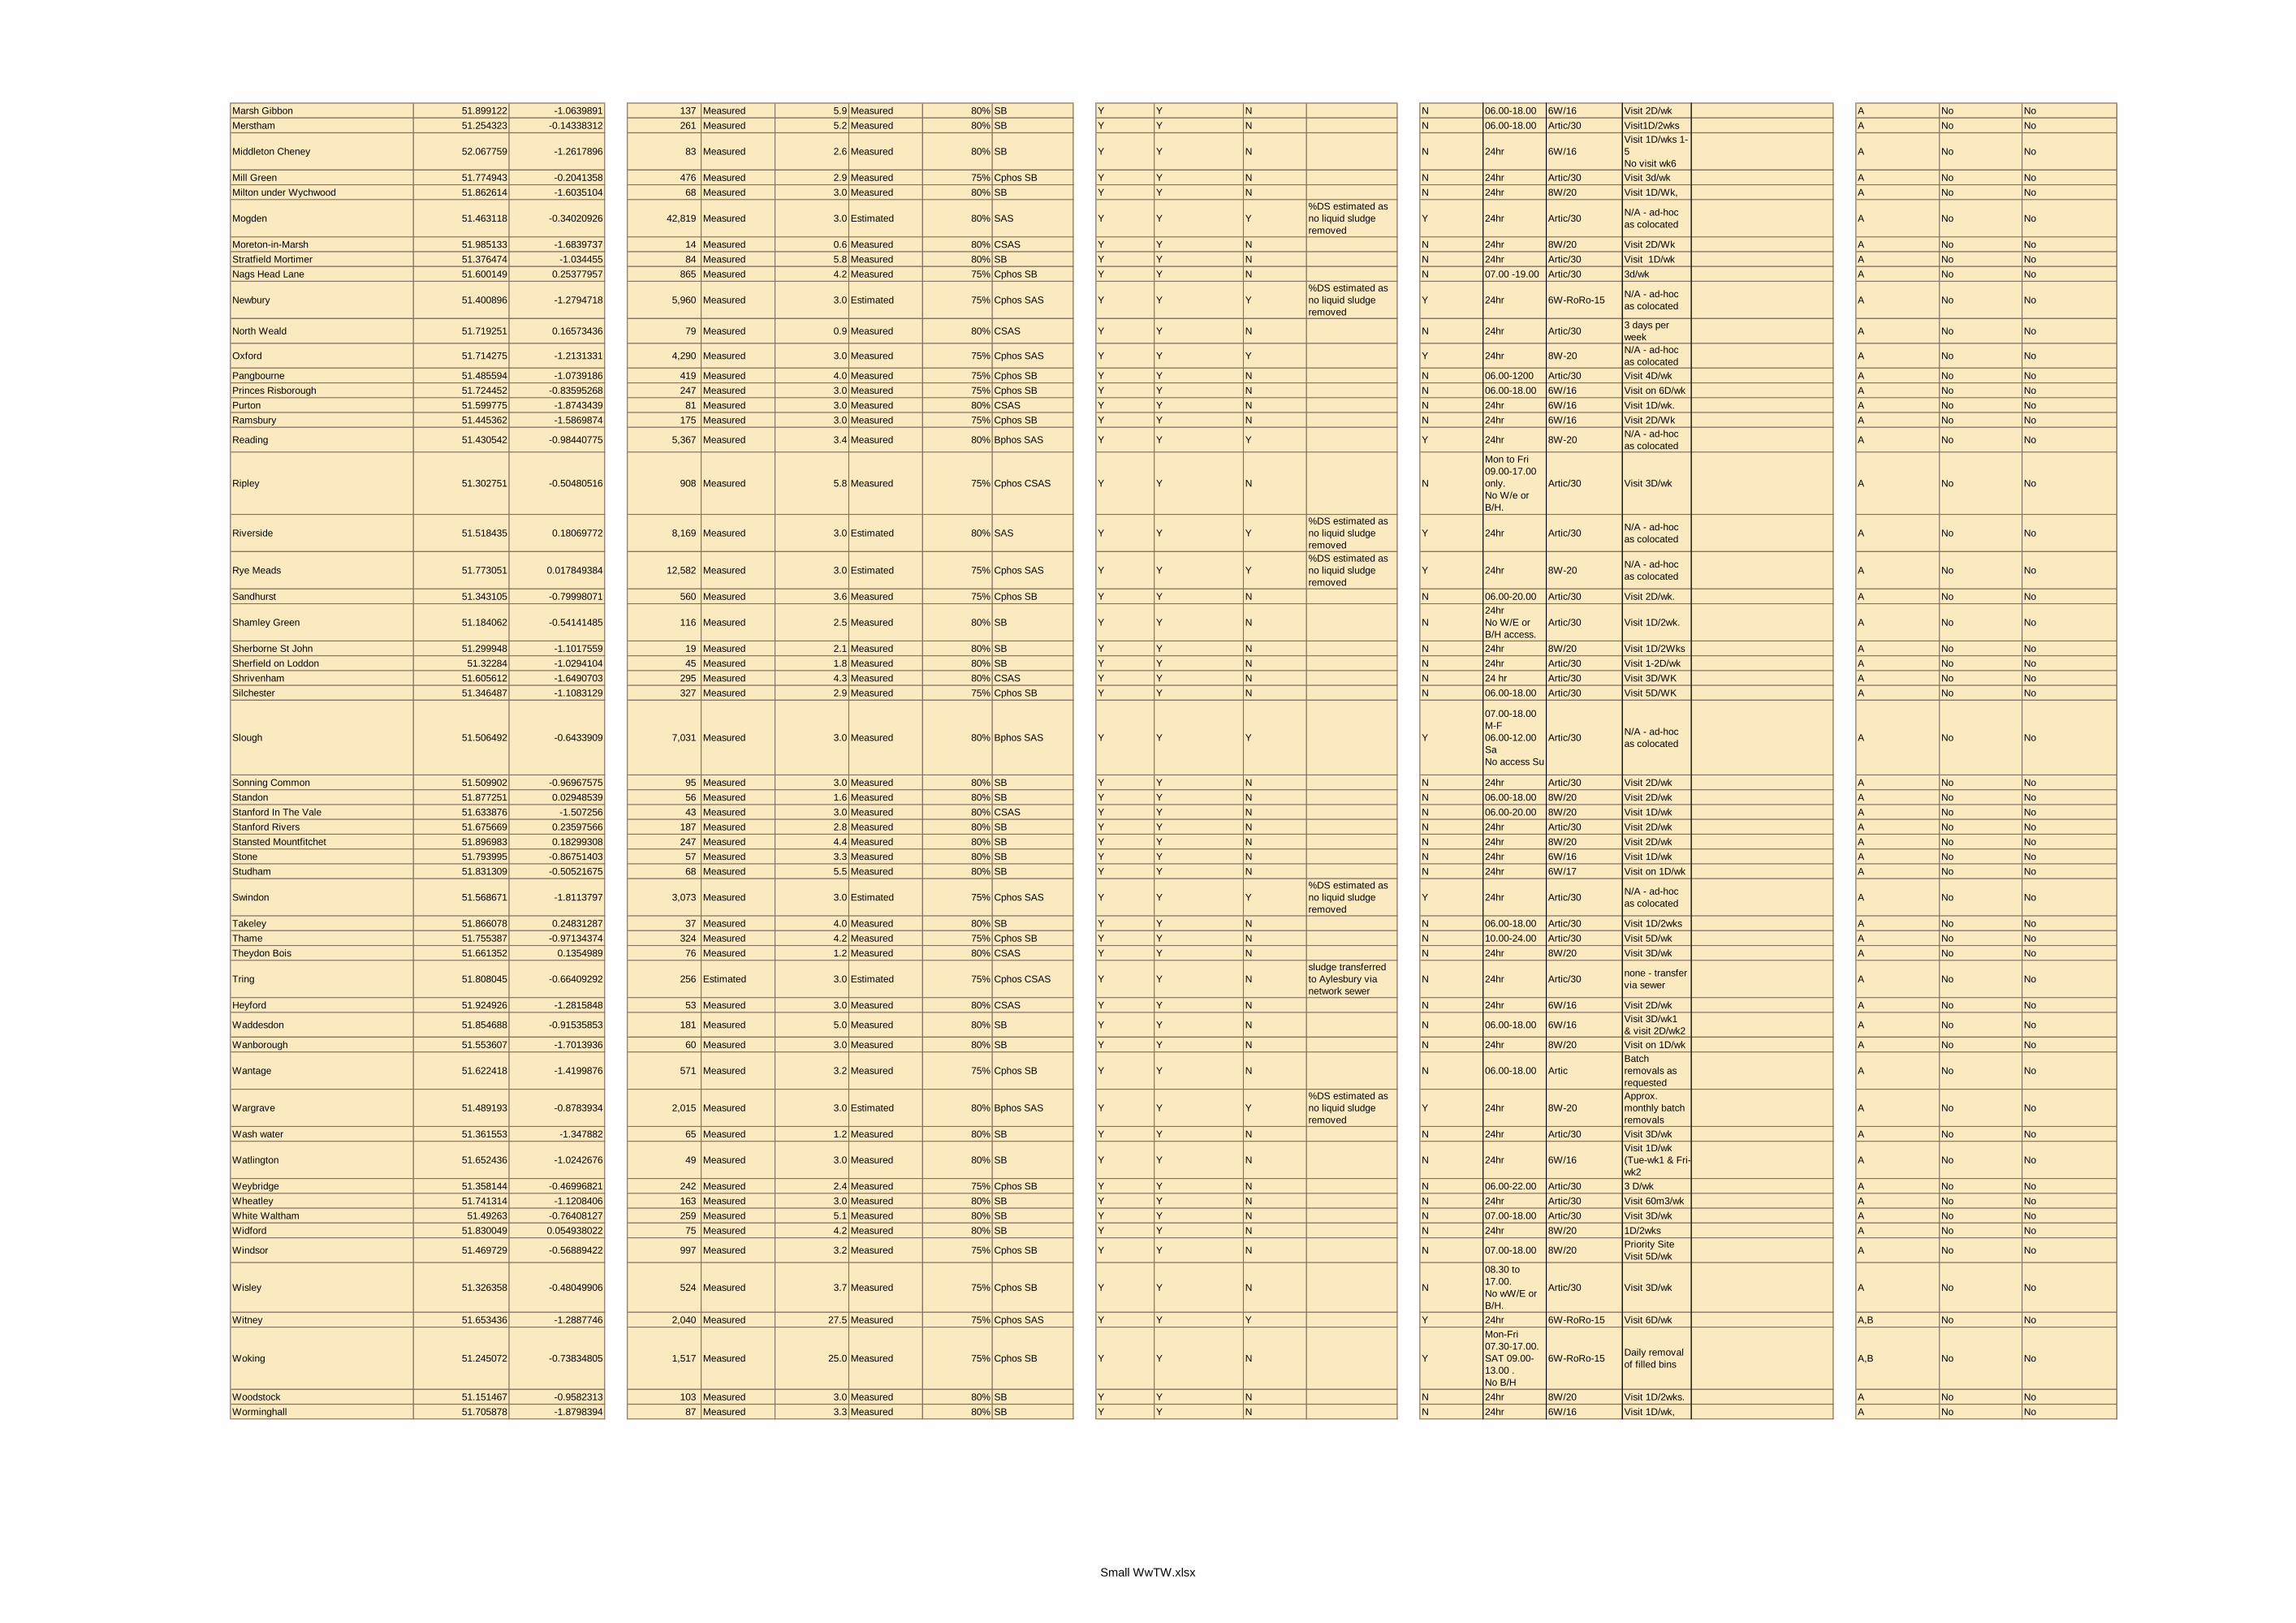
Marsh Gibbon 51.899122 -1.0639891 137 Measured 5.9 Measured 80% SB Y Y N N 06.00-18.00 6W/16 Visit 2D/wk A No No
Merstham 51.254323 -0.14338312 261 Measured 5.2 Measured 80% SB Y Y N N 06.00-18.00 Artic/30 Visit1D/2wks A No No
Middleton Cheney 52.067759 -1.2617896 83 Measured 2.6 Measured 80% SB Y Y N N 24hr 6W/16
Visit 1D/wks 1-
5
No visit wk6
A No No
Mill Green 51.774943 -0.2041358 476 Measured 2.9 Measured 75% Cphos SB Y Y N N 24hr Artic/30 Visit 3d/wk A No No
Milton under Wychwood 51.862614 -1.6035104 68 Measured 3.0 Measured 80% SB Y Y N N 24hr 8W/20 Visit 1D/Wk, A No No
Mogden 51.463118 -0.34020926 42,819 Measured 3.0 Estimated 80% SAS Y Y Y
%DS estimated as
no liquid sludge
removed
Y 24hr Artic/30N/A - ad-hoc
as colocatedA No No
Moreton-in-Marsh 51.985133 -1.6839737 14 Measured 0.6 Measured 80% CSAS Y Y N N 24hr 8W/20 Visit 2D/Wk A No No
Stratfield Mortimer 51.376474 -1.034455 84 Measured 5.8 Measured 80% SB Y Y N N 24hr Artic/30 Visit 1D/wk A No No
Nags Head Lane 51.600149 0.25377957 865 Measured 4.2 Measured 75% Cphos SB Y Y N N 07.00 -19.00 Artic/30 3d/wk A No No
Newbury 51.400896 -1.2794718 5,960 Measured 3.0 Estimated 75% Cphos SAS Y Y Y
%DS estimated as
no liquid sludge
removed
Y 24hr 6W-RoRo-15N/A - ad-hoc
as colocatedA No No
North Weald 51.719251 0.16573436 79 Measured 0.9 Measured 80% CSAS Y Y N N 24hr Artic/303 days per
weekA No No
Oxford 51.714275 -1.2131331 4,290 Measured 3.0 Measured 75% Cphos SAS Y Y Y Y 24hr 8W-20N/A - ad-hoc
as colocatedA No No
Pangbourne 51.485594 -1.0739186 419 Measured 4.0 Measured 75% Cphos SB Y Y N N 06.00-1200 Artic/30 Visit 4D/wk A No No
Princes Risborough 51.724452 -0.83595268 247 Measured 3.0 Measured 75% Cphos SB Y Y N N 06.00-18.00 6W/16 Visit on 6D/wk A No No
Purton 51.599775 -1.8743439 81 Measured 3.0 Measured 80% CSAS Y Y N N 24hr 6W/16 Visit 1D/wk. A No No
Ramsbury 51.445362 -1.5869874 175 Measured 3.0 Measured 75% Cphos SB Y Y N N 24hr 6W/16 Visit 2D/Wk A No No
Reading 51.430542 -0.98440775 5,367 Measured 3.4 Measured 80% Bphos SAS Y Y Y Y 24hr 8W-20N/A - ad-hoc
as colocatedA No No
Ripley 51.302751 -0.50480516 908 Measured 5.8 Measured 75% Cphos CSAS Y Y N N
Mon to Fri
09.00-17.00
only.
No W/e or
B/H.
Artic/30 Visit 3D/wk A No No
Riverside 51.518435 0.18069772 8,169 Measured 3.0 Estimated 80% SAS Y Y Y
%DS estimated as
no liquid sludge
removed
Y 24hr Artic/30N/A - ad-hoc
as colocatedA No No
Rye Meads 51.773051 0.017849384 12,582 Measured 3.0 Estimated 75% Cphos SAS Y Y Y
%DS estimated as
no liquid sludge
removed
Y 24hr 8W-20N/A - ad-hoc
as colocatedA No No
Sandhurst 51.343105 -0.79998071 560 Measured 3.6 Measured 75% Cphos SB Y Y N N 06.00-20.00 Artic/30 Visit 2D/wk. A No No
Shamley Green 51.184062 -0.54141485 116 Measured 2.5 Measured 80% SB Y Y N N
24hr
No W/E or
B/H access.
Artic/30 Visit 1D/2wk. A No No
Sherborne St John 51.299948 -1.1017559 19 Measured 2.1 Measured 80% SB Y Y N N 24hr 8W/20 Visit 1D/2Wks A No No
Sherfield on Loddon 51.32284 -1.0294104 45 Measured 1.8 Measured 80% SB Y Y N N 24hr Artic/30 Visit 1-2D/wk A No No
Shrivenham 51.605612 -1.6490703 295 Measured 4.3 Measured 80% CSAS Y Y N N 24 hr Artic/30 Visit 3D/WK A No No
Silchester 51.346487 -1.1083129 327 Measured 2.9 Measured 75% Cphos SB Y Y N N 06.00-18.00 Artic/30 Visit 5D/WK A No No
Slough 51.506492 -0.6433909 7,031 Measured 3.0 Measured 80% Bphos SAS Y Y Y Y
07.00-18.00
M-F
06.00-12.00
Sa
No access Su
Artic/30N/A - ad-hoc
as colocatedA No No
Sonning Common 51.509902 -0.96967575 95 Measured 3.0 Measured 80% SB Y Y N N 24hr Artic/30 Visit 2D/wk A No No
Standon 51.877251 0.02948539 56 Measured 1.6 Measured 80% SB Y Y N N 06.00-18.00 8W/20 Visit 2D/wk A No No
Stanford In The Vale 51.633876 -1.507256 43 Measured 3.0 Measured 80% CSAS Y Y N N 06.00-20.00 8W/20 Visit 1D/wk A No No
Stanford Rivers 51.675669 0.23597566 187 Measured 2.8 Measured 80% SB Y Y N N 24hr Artic/30 Visit 2D/wk A No No
Stansted Mountfitchet 51.896983 0.18299308 247 Measured 4.4 Measured 80% SB Y Y N N 24hr 8W/20 Visit 2D/wk A No No
Stone 51.793995 -0.86751403 57 Measured 3.3 Measured 80% SB Y Y N N 24hr 6W/16 Visit 1D/wk A No No
Studham 51.831309 -0.50521675 68 Measured 5.5 Measured 80% SB Y Y N N 24hr 6W/17 Visit on 1D/wk A No No
Swindon 51.568671 -1.8113797 3,073 Measured 3.0 Estimated 75% Cphos SAS Y Y Y
%DS estimated as
no liquid sludge
removed
Y 24hr Artic/30N/A - ad-hoc
as colocatedA No No
Takeley 51.866078 0.24831287 37 Measured 4.0 Measured 80% SB Y Y N N 06.00-18.00 Artic/30 Visit 1D/2wks A No No
Thame 51.755387 -0.97134374 324 Measured 4.2 Measured 75% Cphos SB Y Y N N 10.00-24.00 Artic/30 Visit 5D/wk A No No
Theydon Bois 51.661352 0.1354989 76 Measured 1.2 Measured 80% CSAS Y Y N N 24hr 8W/20 Visit 3D/wk A No No
Tring 51.808045 -0.66409292 256 Estimated 3.0 Estimated 75% Cphos CSAS Y Y N
sludge transferred
to Aylesbury via
network sewer
N 24hr Artic/30none - transfer
via sewerA No No
Heyford 51.924926 -1.2815848 53 Measured 3.0 Measured 80% CSAS Y Y N N 24hr 6W/16 Visit 2D/wk A No No
Waddesdon 51.854688 -0.91535853 181 Measured 5.0 Measured 80% SB Y Y N N 06.00-18.00 6W/16Visit 3D/wk1
& visit 2D/wk2A No No
Wanborough 51.553607 -1.7013936 60 Measured 3.0 Measured 80% SB Y Y N N 24hr 8W/20 Visit on 1D/wk A No No
Wantage 51.622418 -1.4199876 571 Measured 3.2 Measured 75% Cphos SB Y Y N N 06.00-18.00 Artic
Batch
removals as
requested
A No No
Wargrave 51.489193 -0.8783934 2,015 Measured 3.0 Estimated 80% Bphos SAS Y Y Y
%DS estimated as
no liquid sludge
removed
Y 24hr 8W-20
Approx.
monthly batch
removals
A No No
Wash water 51.361553 -1.347882 65 Measured 1.2 Measured 80% SB Y Y N N 24hr Artic/30 Visit 3D/wk A No No
Watlington 51.652436 -1.0242676 49 Measured 3.0 Measured 80% SB Y Y N N 24hr 6W/16
Visit 1D/wk
(Tue-wk1 & Fri-
wk2
A No No
Weybridge 51.358144 -0.46996821 242 Measured 2.4 Measured 75% Cphos SB Y Y N N 06.00-22.00 Artic/30 3 D/wk A No No
Wheatley 51.741314 -1.1208406 163 Measured 3.0 Measured 80% SB Y Y N N 24hr Artic/30 Visit 60m3/wk A No No
White Waltham 51.49263 -0.76408127 259 Measured 5.1 Measured 80% SB Y Y N N 07.00-18.00 Artic/30 Visit 3D/wk A No No
Widford 51.830049 0.054938022 75 Measured 4.2 Measured 80% SB Y Y N N 24hr 8W/20 1D/2wks A No No
Windsor 51.469729 -0.56889422 997 Measured 3.2 Measured 75% Cphos SB Y Y N N 07.00-18.00 8W/20Priority Site
Visit 5D/wkA No No
Wisley 51.326358 -0.48049906 524 Measured 3.7 Measured 75% Cphos SB Y Y N N
08.30 to
17.00.
No wW/E or
B/H.
Artic/30 Visit 3D/wk A No No
Witney 51.653436 -1.2887746 2,040 Measured 27.5 Measured 75% Cphos SAS Y Y Y Y 24hr 6W-RoRo-15 Visit 6D/wk A,B No No
Woking 51.245072 -0.73834805 1,517 Measured 25.0 Measured 75% Cphos SB Y Y N Y
Mon-Fri
07.30-17.00.
SAT 09.00-
13.00 .
No B/H
6W-RoRo-15Daily removal
of filled binsA,B No No
Woodstock 51.151467 -0.9582313 103 Measured 3.0 Measured 80% SB Y Y N N 24hr 8W/20 Visit 1D/2wks. A No No
Worminghall 51.705878 -1.8798394 87 Measured 3.3 Measured 80% SB Y Y N N 24hr 6W/16 Visit 1D/wk, A No No
Small WwTW.xlsx

Smaller WwTW (less than 2000 population equivalent served) Thames Water Utilities Limited (TWUL)
Specification WwTW site nameWwTW location (grid
ref latitude)
WwTW location
(grid ref longitude)
Volume of raw sludge
produced per yearWwTW classification
Is site covered by
transport contract? If so,
enter contract reference
in cell
Is site covered by
treatment contract? If so,
enter contract reference in
cell
Is site covered by any
other sludge contract? If
so, enter contract
reference in cell
Input type name grid ref latitude grid ref longitude
volume (TDS) per year
Average amount of sludge
produced per year: Either
stated as <70 tonnes per
annum or a more accurate
estimate if available
see definitions page"No" or unique contract
reference
"No" or unique contract
reference
"No" or unique contract
reference
Mandatory requirement Yes Yes Yes Yes Yes Yes Yes
Abbess Roding 51.775512 0.28149827 22.40 SB A No No
Aldermaston 51.385477 -1.1521042 6.46 SB A No No
Andoversford 51.876763 -1.9650903 14.58 SB A No No
Ashendon 51.82467 -0.97702174 18.10 CSAS A No No
Ashford Hill 51.349867 -1.2030192 3.37 SB A No No
Ashley Green 51.737884 -0.58505993 10.61 SB A No No
Ashton Keynes 51.63757 -1.908919 27.32 SB A No No
Aston Le Walls 52.154169 -1.2779016 1.89 SB A No No
Avon Dassett 52.141409 -1.4081585 1.44 SB A No No
Barford (St Michael) 51.991 -1.3577144 10.43 SB A No No
Barkway 51.994333 0.018753068 8.60 SB A No No
Baydon 51.496648 -1.596608 10.38 SB A No No
Beckley 51.796697 -1.181393 1.16 SB A No No
Beenham 51.419621 -1.1485965 24.60 SB A No No
Bibury 51.759751 -1.821742 17.60 SB A No No
Billingbear 51.444416 -0.79703973 4.97 SB A No No
Bishops Green 51.368351 -1.2802699 0.40 SB A No No
Bledington 51.90318 -1.6365837 12.10 SB A No No
Bletchingdon 51.852907 -1.2667611 27.99 SB A No No
Blunsdon 51.620323 -1.7832886 38.72 CSAS A No No
Boddington 52.167846 -1.3098468 3.77 SB A No No
Bourton 51.584108 -1.6752149 4.71 SB A No No
Boxford 51.443566 -1.3826865 1.91 SB A No No
Bramfield 51.818676 -0.12549809 1.64 SB A No No
Braughing 51.922302 0.024245357 40.70 SB A No No
Breachwood Green 51.887239 -0.31881905 6.93 SB A No No
Brickendon 51.758715 -0.087409961 0.81 SB A No No
Broad Hinton 51.49093 -1.8343134 12.97 SB A No No
Broughton 52.047793 -1.3860645 33.26 SB A No No
Buckland 51.685105 -1.5023609 10.93 SB A No No
Bucklebury (Upper Common) 51.424578 -1.2146651 35.36 SB A No No
Buscot 51.674898 -1.6673356 2.40 SB A No No
Castle Eaton 51.66348 -1.783083 3.90 SB A No No
Chacombe 52.093056 -1.2818077 50.78 CSAS A No No
Chadlington 51.889296 -1.5248118 12.07 SB A No No
Chapmore End 51.833769 -0.058105627 6.63 SB A No No
Charlton-on-Otmoor 51.839746 -1.179887 11.84 SB A No No
Charwelton 52.196918 -1.2142973 1.42 SB A No No
Charney Bassett 51.649802 -1.4492685 9.63 SB A No No
Chienes 51.676952 -0.52910647 5.23 SB A No No
Chilton Foliat 51.425405 -1.539704 6.71 SB A No No
Chilton 51.7962 -1.012468 5.42 SB A No No
Chipping Warden 52.129852 -1.2709903 23.72 SB A No No
Section C: ContractsSection A: Identifier Section B: Sludge production information
Please note that any WwTw that is desludged by intermittently emptied by tankering the contents to the start of another larger sewage treatment works should not be included in this list. The sludge removed
in this way should be accounted for in the sludge produced at the larger receiving sewage treatment works.

Clanfield 51.714191 -1.5830974 15.19 SB A No No
Clatford 51.419793 -1.7727323 5.17 SB A No No
Claydon 52.146422 -1.3364833 2.78 SB A No No
Clifton 51.983388 -1.2850185 0.95 SB A No No
Coates 51.709532 -2.0260031 27.08 SB A No No
Coberley 51.840792 -2.0536573 2.59 CSAS A No No
Coleshill 51.638922 -1.6632637 2.55 SB A No No
Colgate 51.08402 -0.2438739 17.25 SB A No No
Combe 51.839344 -1.413577 12.13 SB A No No
Compton 51.50839 -1.2434846 53.61 SB A No No
Cottered 51.949263 -0.082223411 10.47 SB A No No
Crondall 51.239603 -0.86284166 15.49 SB A No No
Cropredy 52.112101 -1.3092473 23.25 SB A No No
Croughton 51.994552 -1.2032788 24.15 SB A No No
Cuddesdon 51.715361 -1.1372661 12.65 SB A No No
Cuddington 51.799073 -0.92974495 26.08 SB A No No
Culworth 52.115943 -1.2054984 8.99 SB A No No
Dagnall 51.829247 -0.55607728 10.54 SB A No No
Dane End 51.870754 -0.06522852 4.48 SB A No No
Dorchester 51.648102 -1.1616686 29.15 SB A No No
East Grafton 51.344793 -1.6280924 13.89 SB A No No
East Ilsley 51.525734 -1.2849994 65.62 SB A No No
Elsfield 51.789677 -1.2213911 0.16 SB A No No
Enstone 51.924969 -1.4575424 28.95 SB A No No
Eydon 52.147407 -1.2049387 2.35 SB A No No
Farnborough (North) 52.142142 -1.376001 1.93 SB A No No
Fawley 51.526538 -1.4320171 2.77 SB A No No
Forest Hill 51.767588 -1.1478644 25.39 SB A No No
Foscot 51.893575 -1.6413113 1.28 SB A No No
Frieth 51.606791 -0.8490722 1.37 SB A No No
Froxfield 51.408431 -1.5686293 4.56 SB A No No
Furneux Pelham 51.924753 0.089803484 7.27 SB A No No
Fyfield 51.413518 -1.7828287 42.55 Cphos SB A No No
Adbury Holt 51.361356 -1.313414 1.12 SB A No No
Great Bedwyn 51.38065 -1.594754 48.50 SB A No No
Great Gaddesden 51.790845 -0.50510483 7.58 SB A No No
Great Milton 51.726744 -1.0965097 9.90 SB A No No
Greatworth 52.073642 -1.1989541 20.40 SB A No No
Greenham Common 51.366543 -1.2788617 23.37 SB A No No
Grendon Underwood 51.884323 -1.0134444 26.15 SB A No No
Guiting Power 51.922542 -1.8632679 1.64 SB A No No
Hambleden 51.559245 -0.86037046 29.90 SB A No No
Hampden Row 51.705856 -0.77564683 8.58 SB A No No
Hampstead Norreys 51.477766 -1.2353515 34.58 SB A No No
Hamstead Marshall 51.384314 -1.4007277 10.53 CSAS A No No
Hannington (Hants) 51.298754 -1.223985 0.70 SB A No No
Hanwell 52.089922 -1.3621338 3.69 SB A No No
Headley 51.27706 -0.28383761 14.01 SB A No No
Horley (Oxon) 52.087364 -1.3884408 1.42 SB A No No
Hornton 52.10012 -1.4218439 2.84 SB A No No
Horton-cum-Studley 51.804277 -1.1239677 9.03 SB A No No
Huntercombe 51.588142 -1.0237688 13.95 SB A No No
Hurley 51.545216 -0.80592072 60.08 SB A No No
Ironsbottom 51.204044 -0.21211434 12.01 SB A No No
Islip 51.819487 -1.2426397 11.98 CSAS A No No
Kempsford 51.676928 -1.7627717 14.57 SB A No No
Lower Basildon 51.503908 -1.1167708 48.70 SB A No No
Little Compton 51.969697 -1.6316794 2.19 SB A No No
Leaden Roding 51.794768 0.30857489 33.88 SB A No No
Leckhampstead 51.478531 -1.3634954 0.95 SB A No No
Lewknor 51.673555 -0.97030587 5.18 SB A No No
Little Hallingbury 51.836104 0.16843445 12.04 SB A No No
Littleworth 51.673598 -1.5473169 0.86 SB A No No
Little Milton 51.701594 -1.0999047 10.76 SB A No No
Eversley Cross (Longwater) 51.355108 -0.85826139 35.66 SB A No No
Longborough 51.967271 -1.7321325 8.96 SB A No No

Long Sutton 51.216541 -0.94473649 2.88 SB A No No
Ludgershall 51.862077 -1.0415228 1.88 SB A No No
Long Wittenham 51.646596 -1.2036098 11.17 SB A No No
Manuden 51.915194 0.17078935 9.93 SB A No No
Middle Barton 51.925339 -1.3528348 26.86 SB A No No
Middleton Stoney 51.909255 -1.2207793 2.90 SB A No No
Mollington 52.122333 -1.3704351 3.30 SB A No No
Moreton 51.73799 0.22167022 27.36 SB A No No
Moreton Pinkney 52.142608 -1.1611853 5.20 SB A No No
Naunton 51.905405 -1.8226205 5.18 SB A No No
Nettlebed 51.575679 -0.98550616 31.14 SB A No No
Eversley New Mill 51.359223 -0.91273678 24.54 SB A No No
Northleach 51.827185 -1.8229274 35.00 SB A No No
Nuneham Courtenay 51.687912 -1.1970988 4.24 SB A No No
Pike Hill Rise 51.85146 -1.9089827 0.32 SB A No No
Priors Marston 52.206336 -1.2814467 2.83 SB A No No
Ratley 52.119989 -1.4405739 2.71 SB A No No
Remenham 51.542276 -0.87233042 6.79 SB A No No
Great Rollright 51.971109 -1.5239473 9.45 SB A No No
Rowsham 51.852346 -0.7687721 3.66 SB A No No
Rusper 51.1107 -0.28429269 19.93 SB A No No
Sandford St Martin 51.932711 -1.3861812 0.96 SB A No No
Selborne 51.097581 -0.93573564 11.35 SB A No No
Sevenhampton 51.609345 -1.6981402 1.60 SB A No No
Shabbington 51.761368 -1.0407583 4.76 SB A No No
Shalbourne 51.371474 -1.5445544 10.52 SB A No No
Shellingford 51.637607 -1.5404502 4.24 SB A No No
Shotteswell 52.107988 -1.3779378 1.60 SB A No No
Shutford 52.064223 -1.4354358 21.34 SB A No No
South Leigh 51.772885 -1.4289314 6.06 CSAS A No No
South Moreton 51.590727 -1.1858211 25.41 SB A No No
Spelsbury 51.888257 -1.4914035 14.90 SB A No No
Stadhampton 51.674852 -1.1308049 26.02 SB A No No
Standlake 51.717986 -1.4180425 28.24 SB A No No
Stanton St John 51.782035 -1.15629 6.11 SB A No No
Stanton Harcourt 51.751112 -1.3900935 24.29 SB A No No
Stewkley 51.915252 -0.76559848 22.92 SB A No No
Stratfield Saye 51.34774 -1.0393665 2.65 SB A No No
Streatley 51.52481 -1.1466368 12.83 SB A No No
Ashampstead Stubbles 51.486346 -1.1747189 5.75 SB A No No
Tackley 51.871972 -1.2969536 8.04 SB A No No
Tarlton 51.691363 -2.067035 1.63 SB A No No
Temple Guiting 51.950596 -1.8655108 4.81 SB A No No
Tetsworth 51.716155 -1.0098695 19.87 SB A No No
Therfield 51.994515 -0.045331031 27.88 SB A No No
Thorpe Mandeville 52.09982 -1.2145441 4.71 SB A No No
Tiddington 51.746353 -1.0743915 8.49 SB A No No
Towersey 51.747013 -0.93966658 16.59 SB A No No
Uffington 51.600821 -1.5610347 9.45 SB A No No
Upper Winchendon 51.824217 -0.92624732 3.70 SB A No No
Warmington 52.128756 -1.3951787 2.06 SB A No No
Warwick Wold 51.258352 -0.1197161 2.43 SB A No No
Welford 51.477777 -1.3908646 5.82 SB A No No
Weston 51.950265 -0.14475369 21.09 SB A No No
Weston-On-The-Green 51.852627 -1.2232093 8.50 SB A No No
Whitchurch 51.491146 -1.0939714 83.77 SB A No No
Whitefield Farm 51.48443 -1.7248873 4.81 SB A No No
White Roding 51.800836 0.274074 23.46 SB A No No
Whittington 51.906257 -1.9809115 32.53 SB A No No
Whitwell 51.873022 -0.26850636 22.28 SB A No No
Wickham 51.446482 -1.4258157 5.28 SB A No No
Willingale 51.740052 0.30143879 22.45 SB A No No
Wilton 51.352862 -1.6208471 2.90 SB A No No
Wingrave 51.861105 -0.74675003 26.04 SB A No No
Winterbourne 51.445161 -1.3452534 0.61 CSAS A No No
Withington 51.837198 -1.9506071 3.02 SB A No No
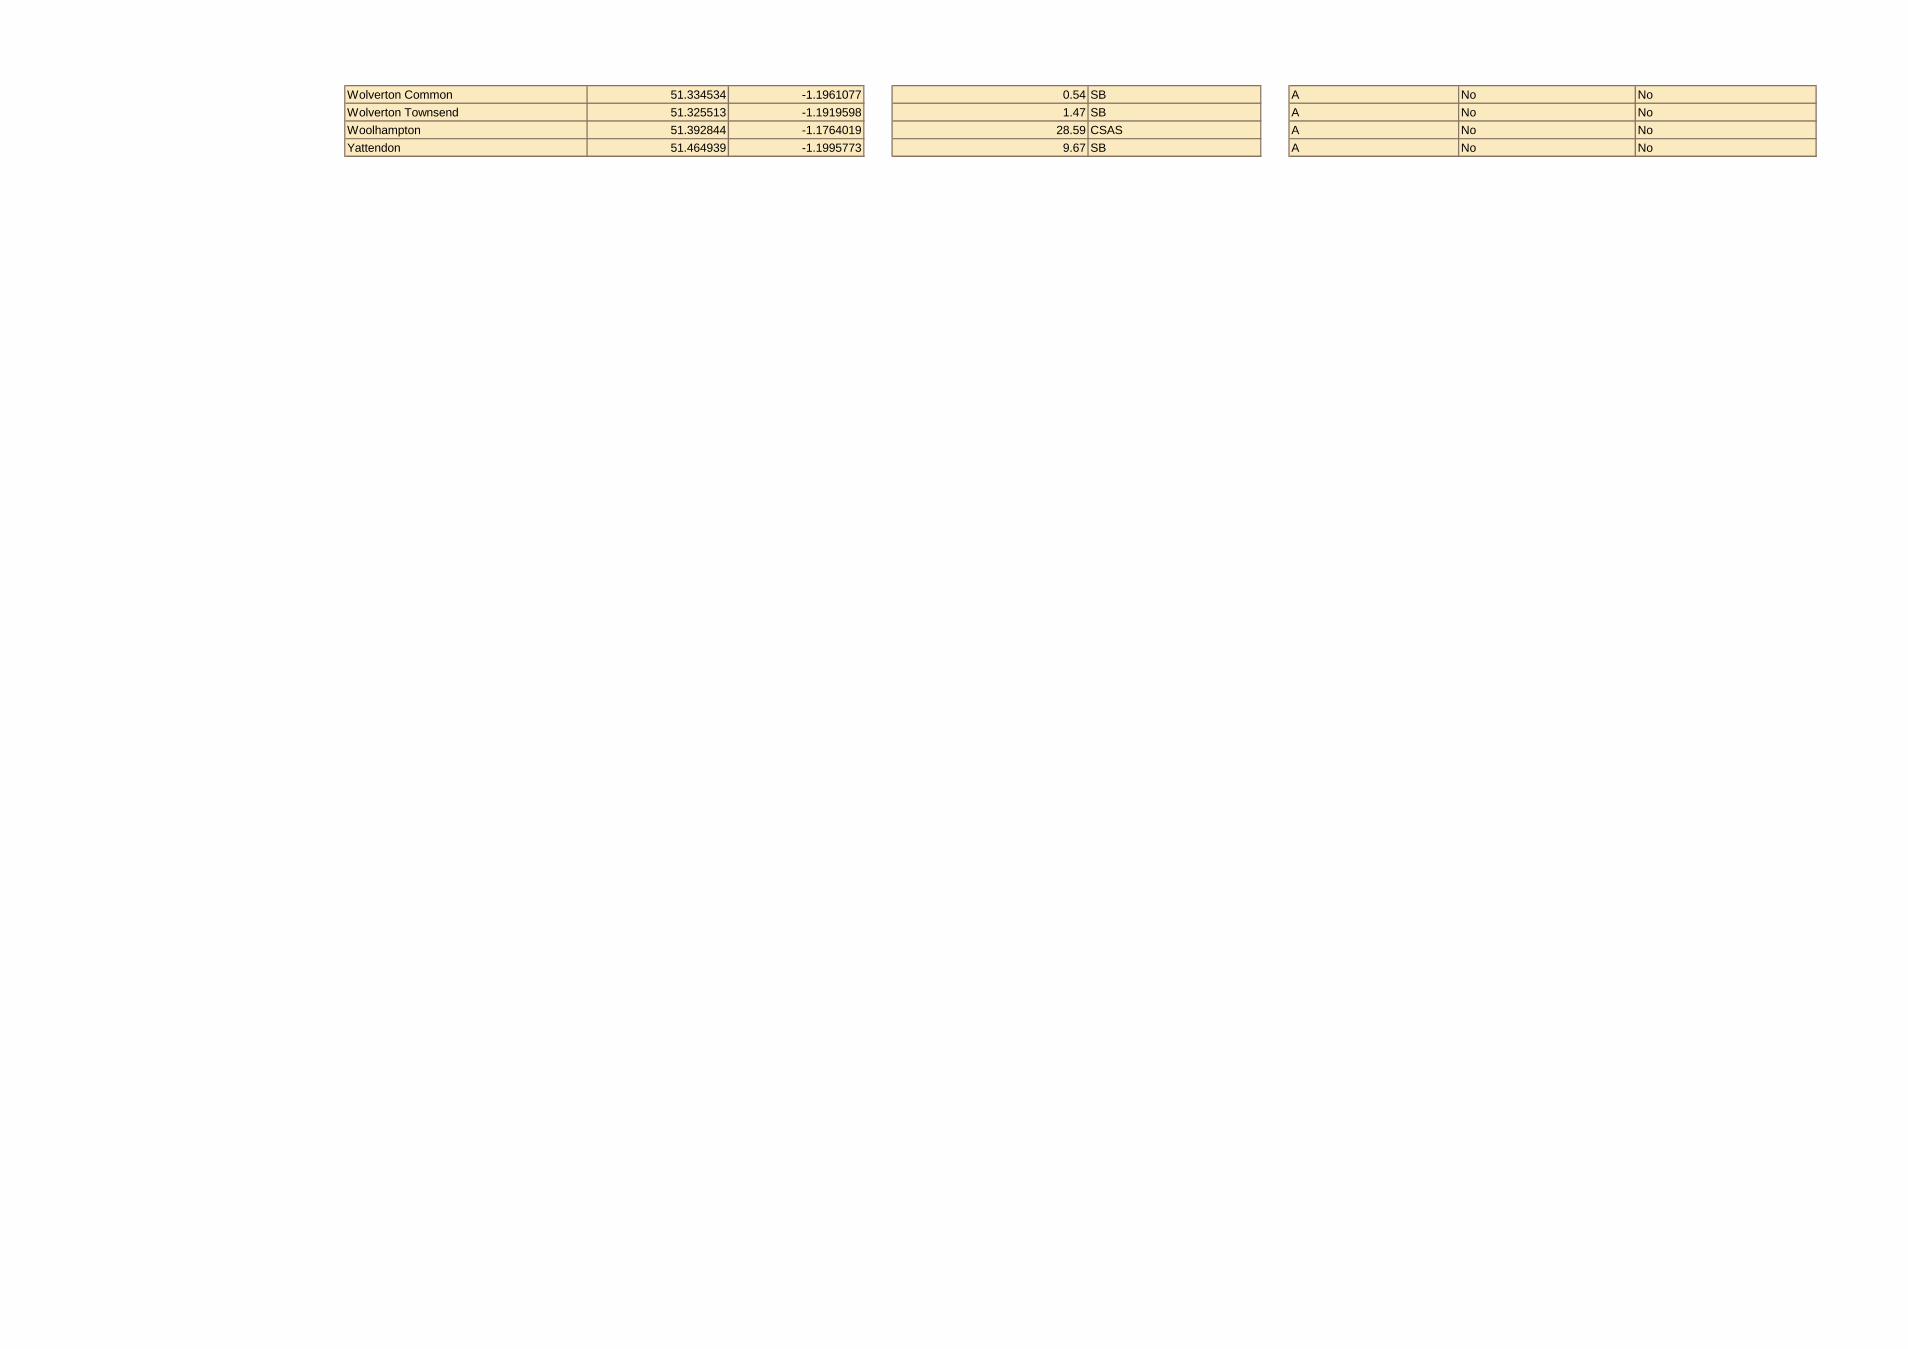
Wolverton Common 51.334534 -1.1961077 0.54 SB A No No
Wolverton Townsend 51.325513 -1.1919598 1.47 SB A No No
Woolhampton 51.392844 -1.1764019 28.59 CSAS A No No
Yattendon 51.464939 -1.1995773 9.67 SB A No No

Sludge Treatment Centres Thames Water Utilities Limited (TWUL)
Section E: Further
information
SpecificationSludge Treatment
Centre (STC) name
STC location (grid ref
latitude)
STC location (grid
ref longitude)
End product volume
per year
Estimated or
Measured volume of
treated sludge
produced
Product Dry
Solids %
Estimated or
Measured product
DS%
Sludge
screened at
STC
Usual operating
hours of the site
Acceptance
criteria for
input material
Type of site
Dry solids
range
accepted
in to site
%
Can site
receive
sludge
not de-
gritted?
Can site
receive
sludge
from sites
without
screening
?
Is the site
producing
untreated
sludge?
Is the site
producing
conventionally
treated
sludge?
Is the site
producing
enhanced
treated
sludge?
Is the site
compliant
with and
certified
under the
Biosolids
Assurance
Scheme?
Further information
(planning constraints,
operational defects that
could impact on product
quality etc.)
Is site covered by
recycling
contract? If so,
enter contract
reference in cell
Is site covered by
disposal
contract? If so,
enter contract
reference in cell
Is site covered by
any other sludge
contract? If so,
enter contract
reference in cell
Input type name grid ref latitude grid ref longitude volume (TDS)estimated or
measured%
estimated or
measuredY/N
days of week /time
(24 hr clock)Y/N
Thickening centre,
Dewatering centre,
Treatment centre, or
Incinerator.
Y/N Y/N Y/N Y/N Y/N Y/N
"No" or unique
contract
reference
"No" or unique
contract
reference
"No" or unique
contract reference
Mandatory requirement Yes Yes Yes Yes Yes Yes Yes Yes Yes
Aylesbury 51.821454 0.849117 1,917 measured 23.8 measured Y 24hr N Treatment centre <10% Y Y N Y N Y B,C,D E, F, G, H, J No
Banbury 52.058911 1.316558 1,912 measured 23.2 measured Y 24hr N Treatment centre <10% Y Y N Y N Y B,C,D E, F, G, H, J No
Basingstoke 51.292921 1.038011 6,819 measured 25.9 measured Y 24hr N Treatment centre <10% Y Y N Y N Y B,C,D E, F, G, H, J No
Beckton 51.518087 0.082708 11,455 measured 26.9 measured Y 24hr NTreatment centre and
Incineratorno imports N N N Y N Y
The site cannot receive any
imports due to planning
restrictions
B,C,D E, F, G, H, J No
Beddington 51.379294 0.1326 4,686 measured 17.5 measured Y 24hr N Treatment centre <10% Y Y N Y N Y B,C,D E, F, G, H, J No
Bicester 51.884476 -1.1607668 1,611 measured 33.9 measured Y 24hr N Treatment centre <10% Y Y N Y N Y B,C,D E, F, G, H, J No
Bishops Stortford 51.857958 0.17554 1,332 measured 21.2 measured Y 0730-1530 N Treatment centre <10% Y Y N Y N Y B,C,D E, F, G, H, J No
Bracknell 51.438549 0.764643 938 measured 24.9 measured Y
06.00-1800-M-F
0800-1700-Sat
No Sun or B/HN Treatment centre <10% Y Y N Y N Y B,C,D E, F, G, H, J No
Camberley 51.327722 0.761437 1,972 measured 18.5 measured Y 24hr N Treatment centre <10% Y Y N Y N Y B,C,D E, F, G, H, J No
Chertsey 51.39684 0.545043 3,876 measured 27.7 measured Y 06.00-22.00 N Treatment centre <10% Y Y N Y N Y B,C,D E, F, G, H, J No
Crawley 51.146472 0.154464 5,159 measured 29.9 measured Y 24hr N Treatment centre >10% Y N N Y N Y B,C,D E, F, G, H, J No
Crossness 51.505544 0.133119 13,170 measured 27.8 measured Y 24hr-Mon-Fri NTreatment centre and
Incineratorno imports N N N Y N Y
The site cannot receive any
imports due to planning
restrictions
B,C,D E, F, G, H, J No
Deephams 51.626366 0.041477 13,238 measured 23.5 measured Y 24hr N Treatment centre <10% Y Y N Y N Y B,C,D E, F, G, H, J No
Didcot 51.617232 1.25008 1,098 measured 22.4 measured Y 24hr N Treatment centre <10% Y Y N Y N Y B,C,D E, F, G, H, J No
Luton(East Hyde) 51.84954 0.375356 2,904 measured 23.8 measured Y 24hr N Treatment centre <10% Y Y N Y N Y B,C,D E, F, G, H, J No
Farnham 51.223749 -0.77974437 2,414 measured 33.0 measured Y 06.00-16.00 N Treatment centre <10% Y Y N Y N Y B,C,D E, F, G, H, J No
Fleet 51.300064 -0.84786511 1,255 measured 33.2 measured Y
07.30 -17.00 Mon-Fri
only.
No B/H
N Treatment centre <10% Y Y N Y N Y B,C,D E, F, G, H, J No
Guildford 51.25667 -0.56634727 4,064 measured 34.6 measured Y 24hr/7d N Treatment centre <10% Y Y N Y N Y B,C,D E, F, G, H, J No
Hogsmill 51.400988 0.286411 4,969 measured 18.1 measured Y 07.00-19.00 N Treatment centre no imports N N N Y N Y B,C,D E, F, G, H, J No
Long Reach 51.464515 0.232331 6,405 measured 26.0 measured Y 06.00-18.00 N Treatment centre <10% Y Y N Y N Y B,C,D E, F, G, H, J No
Maple Lodge 51.622276 0.502827 11,566 measured 22.5 measured Y 24hr N Treatment centre <10% Y Y N Y N Y B,C,D E, F, G, H, J No
Mogden 51.463118 -0.34020926 23,574 measured 21.8 measured Y 24hr N Treatment centre <10% Y Y N Y N Y B,C,D E, F, G, H, J No
Newbury 51.400896 -1.2794718 2,073 measured 27.3 measured Y 24hr N Treatment centre <10% Y Y N Y N Y B,C,D E, F, G, H, J No
Oxford (Sandford) 51.715537 1.214236 5,018 measured 35.8 measured Y 24hr N Treatment centre up to 35% Y except cake N Y N Y B,C,D E, F, G, H, J No
Reading(Manor farm) 51.431731 0.982507 4,018 measured 22.4 measured Y 24hr N Treatment centre <10% Y Y N Y N Y B,C,D E, F, G, H, J No
Riverside 51.518294 0.18451 11,073 measured 25.6 measured Y 24hr N Treatment centre no imports N N N Y N Y B,C,D E, F, G, H, J No
Rye Meads 51.775003 0.016572 8,932 measured 24.1 measured Y 24hr N Treatment centre <10% Y Y N Y N Y B,C,D E, F, G, H, J No
Slough 51.505401 0.634397 4,651 measured 19.9 measured Y
07.00-18.00 M-F
06.00-12.00 Sa
No access Su
N Treatment centre <10% Y Y N Y N Y B,C,D E, F, G, H, J No
Swindon(Rodbourne) 51.567703 1.81221 4,143 measured 21.1 measured Y 24hr N Treatment centre <10% Y Y N Y N Y B,C,D E, F, G, H, J No
Wargrave 51.489753 0.876774 1,671 measured 20.6 measured Y 24hr N Treatment centre <10% Y Y N Y N Y B,C,D E, F, G, H, J No
Abingdon 51.653436 -1.2887746 756 Measured 23.0 Measured N 06.00-18.00 N Dewatering centres no imports Y N Y N N N No E, F, G, H, J B
Cranleigh 51.145418 -0.51475498 252 Measured 25.0 Measured N 06.00-20.00 N Dewatering centres no imports Y N Y N N N No E, F, G, H, J B
Earlswood 51.389505 -0.79129398 101 Measured 27.5 Measured Y06.00-22.00
No W/E or B/HN Dewatering centres <10% Y Y Y N N N No E, F, G, H, J B
Godalming 51.198605 -0.57587919 667 Measured 26.1 Measured N 24hrs N Dewatering centres no imports Y N Y N N N No E, F, G, H, J B
Little Marlow 51.577798 -0.74012548 2,789 Measured 18.9 Measured Y 06.00-20.00 N Dewatering centres <10% Y Y Y N N N No E, F, G, H, J B
Witney 51.653436 -1.2887746 2,040 Measured 27.5 Measured Y 24hr N Dewatering centres <10% Y Y Y N N N No E, F, G, H, J B
Woking 51.245072 -0.73834805 1,517 Measured 25.0 Measured N
Mon-Fri 07.30-17.00.
SAT 09.00-13.00 .
No B/H
N Dewatering centres <10% Y N Y N N N No E, F, G, H, J B
Section A: IdentifierSection C: Nature of Material
acceptedSection D: Treated Product QualitySection B: Treated sludge product description Section F: Contracts


Contract Information Contracts Thames Water Utilities Limited (TWUL)
Specification Contract reference Contract title Description of serviceScale of contracted
activity (approx)Contract start date Contract end date Term of contract Other
Input type
unique reference
corresponding to
reference used
elsewhere in this
workbook
transport, treatment,
recycling, disposal, a
combination of these
four, or other.
Tonnes dry solids per
year, or m3, or
whatever is relevant
month/year month/year
May include more information on services
covered by contract, for example geographical
area
Mandatory requirement Yes Yes Yes Yes Yes Yes Yes
A Inter-site tankering services Transport 1,226,377.83 m3 Oct-13 Sep-18Five year initial term plus option
of a two year extensionAll regions, Exclusive agreement
B Compliant cake stockpiling and cake haulage Transport & Recyling
668,208.05 tonnes +
7,800 tonnes of
Restoration
Nov-16 Oct-21Five year initial term plus option
of two one year extensionsAll regions, Non exclusive
C Compliant cake spreading Recycling 283,766 tonnes Nov-16 Oct-21Five year initial term plus option
of two one year extensionsSouth Region, Non exclusive
D Compliant cake spreading Recycling 319,396.15 tonnes Nov-16 Oct-21Five year initial term plus option
of two one year extensionsNorth Region, Non exclusive
E Restoration of non compliant cake Transport & Disposal 24,408 tonnes *estimated
based on previous year Nov-16 Oct-21
Five year initial term plus option
of two one year extensionsAll regions, Non exclusive
F Restoration of non compliant cake Transport & Disposal 24,408 tonnes *estimated
based on previous year Nov-16 Oct-21
Five year initial term plus option
of two one year extensionsAll regions, Non exclusive
G Restoration of non compliant cake Transport & Disposal ad hoc Nov-16 Oct-21Five year initial term plus option
of two one year extensionsAll regions, Non exclusive
H Restoration of non compliant cake Transport & Disposal ad hoc Nov-16 Oct-21Five year initial term plus option
of two one year extensionsAll regions, Non exclusive
J Restoration of non compliant cake Transport & Disposal ad hoc Nov-16 Oct-21Five year initial term plus option
of two one year extensionsAll regions, Non exclusive
Section B: Bioresource service Section C: Commercial informationSection A: Identifier
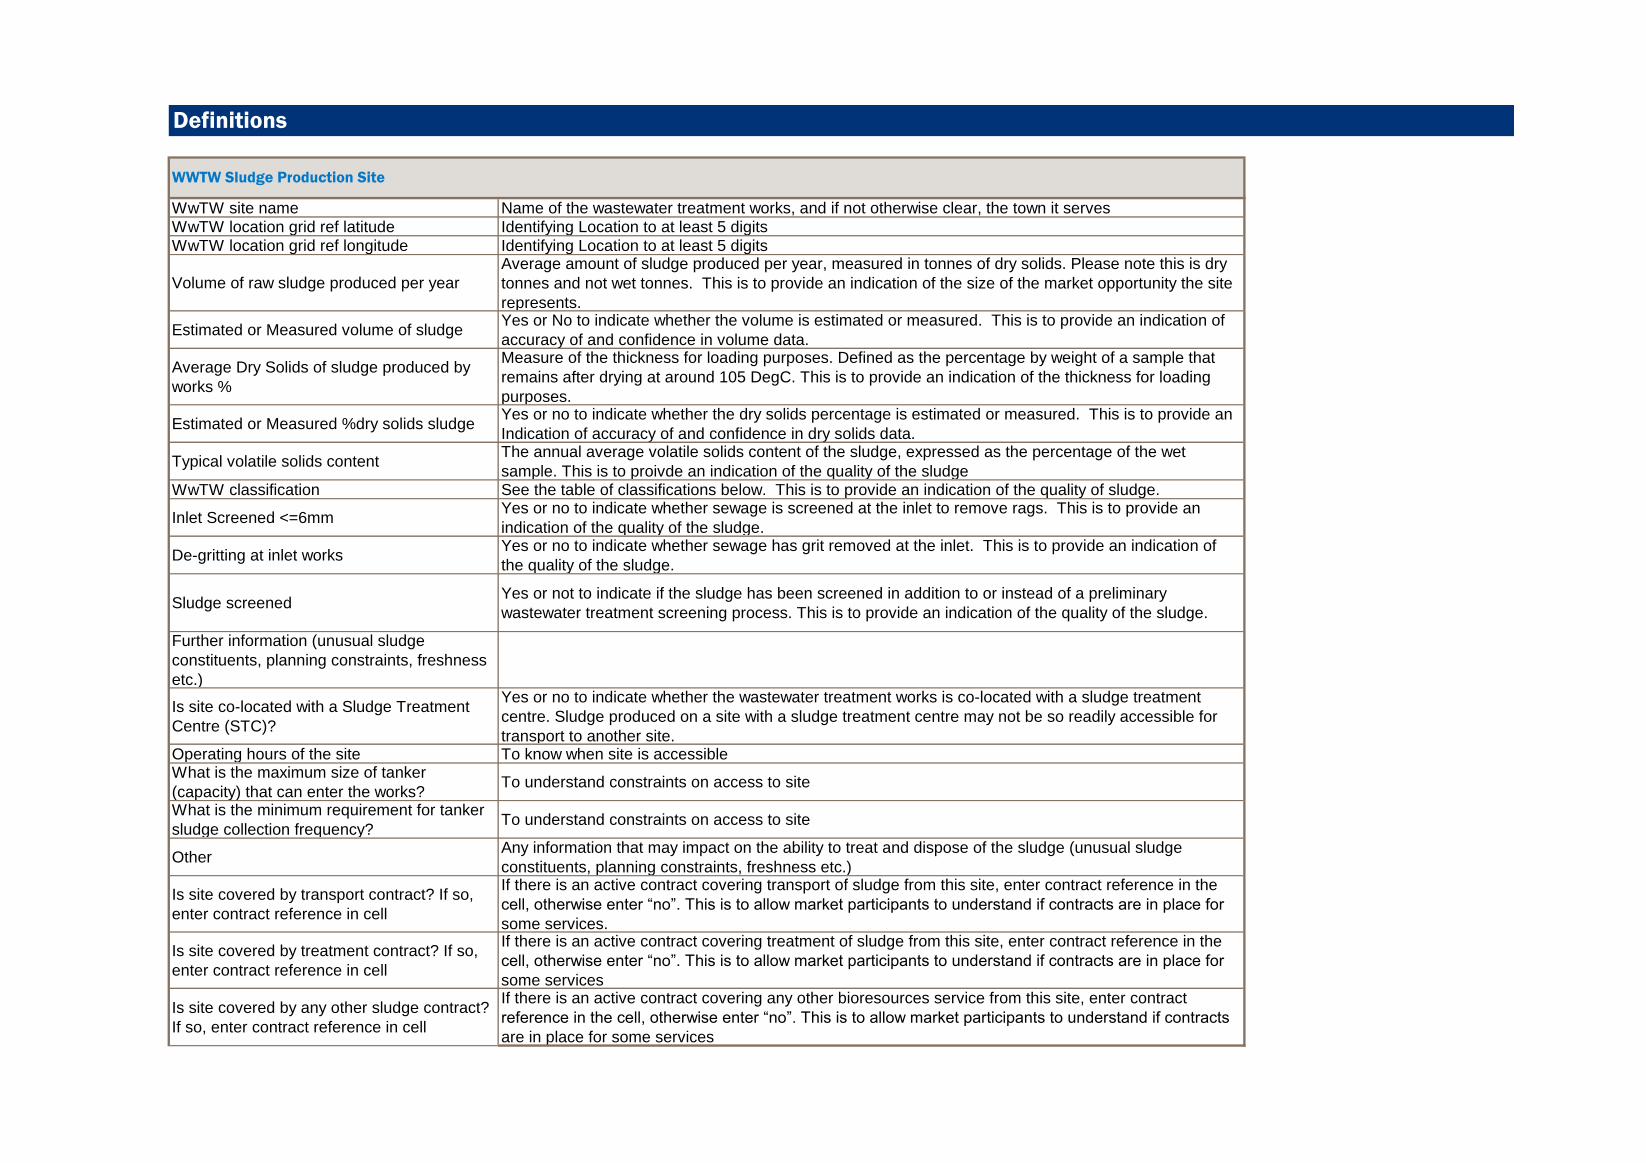
Definitions
WwTW site name Name of the wastewater treatment works, and if not otherwise clear, the town it serves
WwTW location grid ref latitude Identifying Location to at least 5 digits
WwTW location grid ref longitude Identifying Location to at least 5 digits
Volume of raw sludge produced per year
Average amount of sludge produced per year, measured in tonnes of dry solids. Please note this is dry
tonnes and not wet tonnes. This is to provide an indication of the size of the market opportunity the site
represents.
Estimated or Measured volume of sludgeYes or No to indicate whether the volume is estimated or measured. This is to provide an indication of
accuracy of and confidence in volume data.
Average Dry Solids of sludge produced by
works %
Measure of the thickness for loading purposes. Defined as the percentage by weight of a sample that
remains after drying at around 105 DegC. This is to provide an indication of the thickness for loading
purposes.
Estimated or Measured %dry solids sludgeYes or no to indicate whether the dry solids percentage is estimated or measured. This is to provide an
Indication of accuracy of and confidence in dry solids data.
Typical volatile solids contentThe annual average volatile solids content of the sludge, expressed as the percentage of the wet
sample. This is to proivde an indication of the quality of the sludgeWwTW classification See the table of classifications below. This is to provide an indication of the quality of sludge.
Inlet Screened <=6mmYes or no to indicate whether sewage is screened at the inlet to remove rags. This is to provide an
indication of the quality of the sludge.
De-gritting at inlet worksYes or no to indicate whether sewage has grit removed at the inlet. This is to provide an indication of
the quality of the sludge.
Sludge screenedYes or not to indicate if the sludge has been screened in addition to or instead of a preliminary
wastewater treatment screening process. This is to provide an indication of the quality of the sludge.
Further information (unusual sludge
constituents, planning constraints, freshness
etc.)
Is site co-located with a Sludge Treatment
Centre (STC)?
Yes or no to indicate whether the wastewater treatment works is co-located with a sludge treatment
centre. Sludge produced on a site with a sludge treatment centre may not be so readily accessible for
transport to another site.Operating hours of the site To know when site is accessibleWhat is the maximum size of tanker
(capacity) that can enter the works?To understand constraints on access to site
What is the minimum requirement for tanker
sludge collection frequency?To understand constraints on access to site
OtherAny information that may impact on the ability to treat and dispose of the sludge (unusual sludge
constituents, planning constraints, freshness etc.)
Is site covered by transport contract? If so,
enter contract reference in cell
If there is an active contract covering transport of sludge from this site, enter contract reference in the
cell, otherwise enter “no”. This is to allow market participants to understand if contracts are in place for
some services.
Is site covered by treatment contract? If so,
enter contract reference in cell
If there is an active contract covering treatment of sludge from this site, enter contract reference in the
cell, otherwise enter “no”. This is to allow market participants to understand if contracts are in place for
some services
Is site covered by any other sludge contract?
If so, enter contract reference in cell
If there is an active contract covering any other bioresources service from this site, enter contract
reference in the cell, otherwise enter “no”. This is to allow market participants to understand if contracts
are in place for some services
WWTW Sludge Production Site

Sludge Treatment Centre (STC) name The name of the site (and the town it relates to)
STC location (grid ref latitude) Identifying Location to at least 5 digits
STC location (grid ref longitude) Identifying Location to at least 5 digits
End product volume per year
Average amount of treated sludge produced, expressed in tonnes of dry solids per year. Please note
this is dry tonnes and not wet tonnes. This is to provide an indicatation of the size of the market
opportunity the site’s product representsEstimated or Measured volume of treated
sludge producedTo give an indication of accuracy of and confidence in volume data
Product Dry Solids %Measure of the thickness for loading purposes. Defined as the percentage by weight of a sample that
remains after drying at around 105 DegC.Estimated or Measured product DS% To give an indication of accuracy of and confidence in dry solids data.
Sludge screened at STCYes to indicate that there is a sludge screening process at the site. This it to give an indication of sludge
product qualityUsual operating hours of the site To know when site is accessible
Acceptance criteria for input materialIf there are specific acceptance criteria for material brought on to site, e.g. must be digested. This is to
give an understanding of what material can be taken to the site.
Type of siteThickening centre, Dewatering centre, Treatment centre. This is to give an understanding of what
material can be taken to the site.Dry solids range accepted in to site % Expressed as % Dry solids. This is to give an understanding of what material can be taken to the site.
Can site receive sludge not de-gritted? Yes/No answer. This is to give an understanding of what material can be taken to the site.Can site receive sludge from sites without
screening?Yes/No answer. This is to give an understanding of what material can be taken to the site.
Is site producing untreated sludge? Yes if dewatering process only. This is to give an indication of sludge product quality
Is site producing conventionally treated
sludge?
Yes or no answer. Definition of conventional as per safe sludge matrix. Conventionally treated sludge
gas been subjected to defined treatment processes and standards that ensure at least 99% of
pathogens have been destroyed. This is to give an indication of sludge product quality.
Is site producing enhanced treated sludge?
Yes or no answer. Definition of enhanced as per safe sludge matrix. Enhanced treatment is a term used
to describe processes which are capable of virtually eliminating any pathogens which may be present in
the original sludge. Enhanced treated sludge will be free from Salmonella and will have been treated so
as to ensure that 99.9999% pathogens have been destroyed (a 6 log reduction). This is to give an
indication of sludge product quality.
Is the site compliant and certified under the
Biosolids Assurance scheme?
The Biosolids Assurance Scheme combines legislative and non-legislative requirements and best
practice. It is audited and certified by an independent body - NSF Certification. This is to give an
indication of sludge product quality.
Is site covered by recycling contract? If so,
enter contract reference in cell
If there is an active contract covering recycling of sludge from this site, enter contract reference in the
cell, otherwise enter “no”. This is to allow market participants to understand if contracts are in place for
some services
Is site covered by disposal contract? If so,
enter contract reference in cell
If there is an active contract covering disposal of sludge from this site, enter contract reference in the
cell, otherwise enter “no”. This is to allow market participants to understand if contracts are in place for
some services.
Is site covered by any other sludge contract?
If so, enter contract reference in cell
If there is an active contract covering any other bioresources service from this site, enter contract
reference in the cell, otherwise enter “no”. This is to allow market participants to understand if contracts
are in place for some services.
Sludge Treatment Centre

WwTW site name Name of the wastewater treatment works, and if not otherwise clear the town it serves.
WwTW latitidue (grid ref) Location of Wastewater treatment site and grid reference to 5 digits
WwTW longitude (grid ref) Location of Wastewater treatment site and grid reference to 5 digits
Volume of raw sludge produced per year
An indication of the volume of sludge produced in dry tonnes of solids per year. Please note this is dry
tonnes and not wet tonnes. All sites of this size are likely to produce <70 tonnes per year and this is the
default data entry for this column unless the wastewater company is able to provide a more accurate
volume. This is to provide an indicatation of the size of the market opportunity the site represents.WwTW classification See the table of classifications below. This is to provide an indication of the quality of sludge.
Is site covered by transport contract? If so,
enter contract reference in cell
If there is an active contract covering transport of sludge from this site, enter contract reference in the
cell, otherwise enter “no”. This is to allow market participants to understand if contracts are in place for
some services.
Is site covered by treatment contract? If so,
enter contract reference in cell
If there is an active contract covering treatment of sludge from this site, enter contract reference in the
cell, otherwise enter “no”. This is to allow market participants to understand if contracts are in place for
some services
Is site covered by any other sludge contract?
If so, enter contract reference in cell
If there is an active contract covering any other bioresources service from this site, enter contract
reference in the cell, otherwise enter “no”. This is to allow market participants to understand if contracts
are in place for some services
Notes
P Primary settlement only
CSAS Crude sewage activated sludge (ie no primary sludge is generated)
SBSecondary Biological filtration - trickling filters, RBCs etc. Sludge produced will be a mixture of primary
and secondary sludge.
indicates relatively easier secondary
sludge to treat
SAS Secondary Activated sludge. Sludge produced will be a mixture of primary and secondary sludgeindicates more difficult sludge to
treat
Cphos Phosphorus removal via chemical dosingCould indicate a higher mineral
content
Bphos Phosphorus removal through biological nutrient removalCould indicate care needs to be
taken to prevent struvite etc.
Contract Reference
This unique reference should cross refer to the WwWT and STC tabs so readers can see the sites that
the contract applies to. This reference should also be the same as that used in other public
documentation such as OJEU information. This is to help readers understand which contracts apply to
which sites.Contract title A brief description of services contracted.
Contracts
Please note that sites may have more than one code, for example "SB Cphos" would be a secondary filtration site with chemical phosphorus removal
* for sites serving less than 2000 population equivalent. Please note that any sewage works that is intermittently emptied by tankering the contents to
the start of another larger sewage treatment works should not be included in this list.
Small WwTW*
WwTW classification
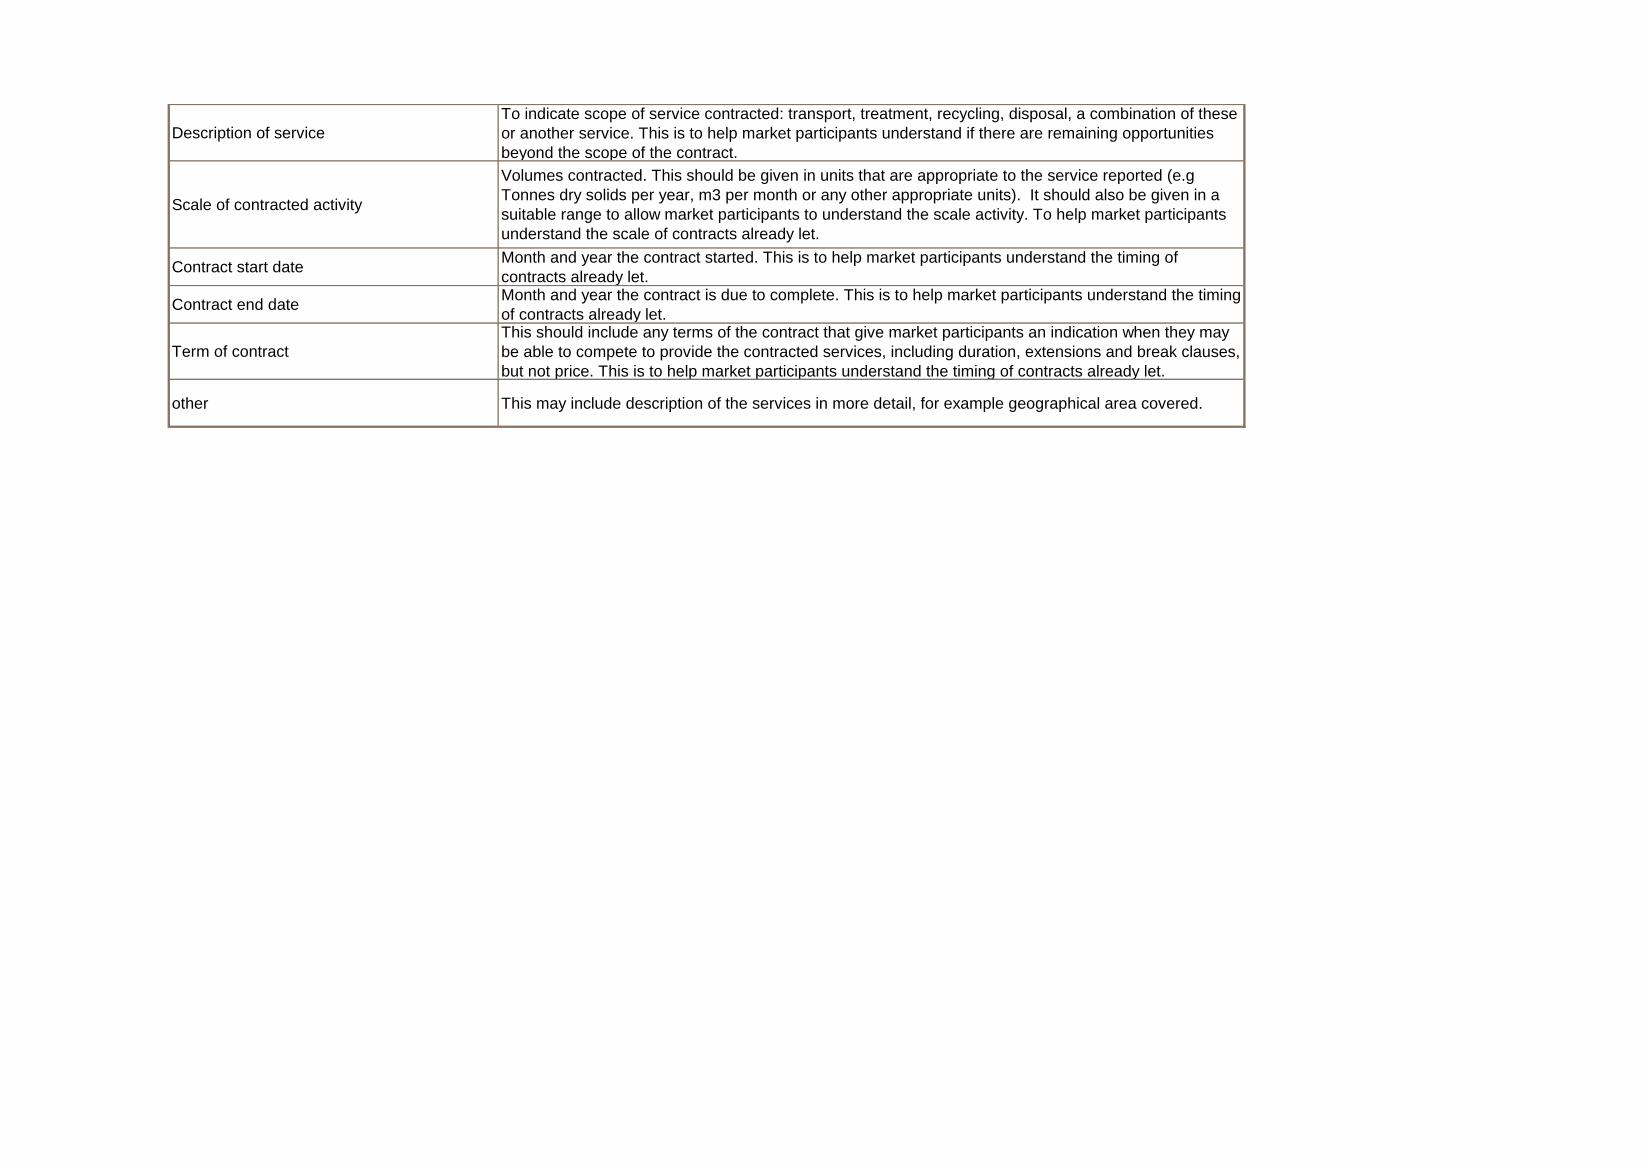
Description of service
To indicate scope of service contracted: transport, treatment, recycling, disposal, a combination of these
or another service. This is to help market participants understand if there are remaining opportunities
beyond the scope of the contract.
Scale of contracted activity
Volumes contracted. This should be given in units that are appropriate to the service reported (e.g
Tonnes dry solids per year, m3 per month or any other appropriate units). It should also be given in a
suitable range to allow market participants to understand the scale activity. To help market participants
understand the scale of contracts already let.
Contract start dateMonth and year the contract started. This is to help market participants understand the timing of
contracts already let.
Contract end dateMonth and year the contract is due to complete. This is to help market participants understand the timing
of contracts already let.
Term of contract
This should include any terms of the contract that give market participants an indication when they may
be able to compete to provide the contracted services, including duration, extensions and break clauses,
but not price. This is to help market participants understand the timing of contracts already let.
other This may include description of the services in more detail, for example geographical area covered.