review article ncsu.edu/bioresources
TRANSCRIPT

REVIEW ARTICLE ncsu.edu/bioresources
Hubbe et al. (2008). “Paper’s appearance: A review,” BioResources 3(2), 627-665. 627
PAPER’S APPEARANCE: A REVIEW Martin A. Hubbe,a Joel J. Pawlak,a and Alexander A. Koukoulasb
This review article highlights progress in understanding the optical properties of paper. Paper’s appearance can be defined in terms of its opacity, brightness, color, fluorescent properties, gloss, and various quantities related to its uniformity. The phenomena that give rise to paper’s optical properties, especially its ability to scatter and absorb visible light, are highly dependent on paper’s structure and its chemical composition. In an effort to engineer low-cost products having relative high opacity and brightness, it is necessary to optimize the material selection and processing conditions. The dimensions of solid materials and void structures within the paper are key factors for optimizing the optical properties. In addition, additives including bleaching agents, mineral particles, dyes, and fluorescent whitening agents can impact paper’s optical properties Paper’s appearance depends, in subtle ways, on the processes of its manufacture.
Keywords: Paper; Optical properties; Appearance; Light scattering; Brightness; Opacity; Absorbance; Whiteness; Color Contact information: a - Department of Forest Biomaterials Science and Engineering, North Carolina State University, Campus Box 8005, Raleigh, NC 27695-8005; b – ANLConsultants LLC, 23 Jorie LN, Walpole, MA 02081; E-mail: [email protected]; [email protected]; [email protected] INTRODUCTION Paper can be described as a sheet material that is largely composed of cellulosic fibers, which become joined together in a hydrogen-bonded structure as a consequence of the evaporation of water. At least half of the volume within a typical sheet of paper is occupied by air. The appearance of a typical sheet of paper is a function of its detailed structure, the presence and concentration of light-absorbing groups (chromophores), the refractive indices of its components, its basis weight (mass per unit area), and its surface reflective characteristics. Issues related to the presence of dirt, ink, contrasting fibers, and formation uniformity also affect the appearance of paper. Paper’s optical characteristics and their measurement have been described in previous reviews and textbooks (Corte 1976; Schmidt 1976; Brandon 1981; Hunter and Harold 1987; Scott et al. 1992, 1995; Gigac 1996; Popson and Malthouse 1996; Borch 2002; Pauler 2002). In an effort to compliment these works, the present article places emphasis on the materials, the structure, and the chemistry of a paper sheet, and how these aspects influence what people see and perceive. The goal is to describe interactions between light, the viewed object, i.e., paper, and the human eye, emphasizing physical and chemical characteristics of paper that can affect these interactions. Useful mathematical expressions are reviewed. Finally, strategies by which papermakers can achieve different targets of brightness, opacity, and color are discussed.
REVIEW ARTICLE ncsu.edu/bioresources
Hubbe et al. (2008). “Paper’s appearance: A review,” BioResources 3(2), 627-665. 628
KEY OPTICAL PROPERTIES AND THEIR MEASUREMENT In principle, the human observer ought to be making final judgments about the optical quality of a paper product. In practice, almost all sales of paper are made on the basis of instrumental measurements and their reported values. Paper producers and users both rely heavily on standardized test procedures and instruments (TAPPI 1998). Though tests in the laboratory will continue to be used for critical testing, as well as calibration, there is increasing reliance on online measurements of brightness, opacity, and color as paper is being made. Online tests make it feasible to carry out the continual adjustments in dyes, pigments, or other process conditions so that the product can reliably remain within the specification limits for appearance. Since the online measurements work by similar principles as the laboratory methods, only the latter will be considered in the following subsections. Brightness Buy a ream of copy paper and look at its cover. There is a good chance that you will find label information specifying the brightness. Brightness can be defined as the diffuse reflectance of a thick stack of paper, when considering visible light having a mean wavelength of about 457 nm and a band width of about 40 nm, i.e., blue light (Brandon 1981; Parkes 1989; Bristow 1990; Jordan 1996; Borch 2002; Pauler 2002). The word “diffuse” means that the measurement method is not designed to detect the component of light that bounces from the surface of the paper in mirror-like fashion (see Gloss, later). The word “reflectance” means that the light coming back from the observed sample is being compared as a percentage or as a fractional proportion of the amount that would be returned from a perfectly white substance, i.e., a sample that did not absorb any light at all. The reason that papermakers emphasize measurements of paper’s reflectance in the blue part of the visible spectrum can be understood based on the chromophores typically present in the cellulosic fibers. As will be outlined later, lignin and its byproducts generally absorb blue wavelengths most strongly, giving cellulosic pulp a yellowish color. This coloration is highly dependent on pulping, bleaching, exposure to light, and the passage of time, etc. Paper that does not absorb much light in the blue wavelengths is commonly perceived to have a higher intrinsic value; as a general rule its price is higher. Two main types of brightness measurement are common. On the one hand, brightness can be measured by illuminating the product with a fixed angle of 45 o relative to the angle of observation. As illustrated in Fig. 1, in TAPPI Method T 452 the incident light is 45o from the normal to the plane of the paper (Van den Akker 1965a; Parkes 1989; Jordan 1996). Alternatively, brightness can be evaluated by means of diffuse illumination, detecting the light that is reflected along a normal to the surface as described in T 571 and ISO Standard 2470 (Parkes 1989; Jordan 1996; Leskelä 1998; Bristow 1999). As illustrated in Fig. 2, the latter measurement requires the use of an integrating sphere, a spherical cavity that is lined with a non-glossy, white coating, such as Spectralon®. Though there is no such thing as a “perfect diffuser” of light, the integrating sphere approaches this conditions. A sufficient number of sheets must be

REVIEW ARTICLE ncsu.edu/bioresources
Hubbe et al. (2008). “Paper’s appearance: A review,” BioResources 3(2), 627-665. 629
used such that doubling the number of sheets does not change the results of the measurement signficantly. By definition (Hunter and Harold 1987), any measurement of the reflectance of a thick stack of single-ply paper is called the “reflectivity” of the paper.
Optical filter
Photocell
Lenses
SampleTAPPI Test T-452“GE Brightness”
45o
Lamp
Fig. 1. Basic configuration for tests of paper brightness, when using directional illumination (45/0o), as in TAPPI Method T 452
Photocell
Sample
Lamp Lamp
White Lining
TAPPI Test T-525“ISO Brightness with Integrating Sphere”
M. Hubbe
Fig. 2. Basic test equipment for evaluation of paper reflectivity (which is called “brightness” if the wavelength of light is centered at 457 nm, in the blue region) by diffuse illumination (d/0o) Measurements of brightness by means of directional vs. diffuse illumination can be expected to give slightly different results. Results from the directional type of brightness measurements can differ by one or two percentage points, depending on the orientation of the sample. This effect has been attributed to specular reflection from the edges of fibers, which often have a preferred orientation in machine-made paper (Koukoulas and Jordan 1994a,b). Instruments employing directional illumination tend to be simpler to construct and easier to keep clean, especially under the dusty conditions that can be found in a paper mill (Van den Akker 1965a). The diffuse illumination measurements, on the other hand, give results that are independent of sample orientation, and it is easier to relate the results to the most widely used theories of reflectance and color (see Color, later). Table 1 lists commonly measured optical properties and their corresponding ISO and TAPPI standard method for measurement.

REVIEW ARTICLE ncsu.edu/bioresources
Hubbe et al. (2008). “Paper’s appearance: A review,” BioResources 3(2), 627-665. 630
Table 1. ISO and TAPPI Measurement Standards for Commonly Used Optical Properties *
Property ISO TAPPI Brightness ISO 2470 – Measurement of diffuse
reflectance factor (ISO brightness) T 452 – Brightness of pulp, paper and paperboard (directional reflectance at 457 nm) T 571 – Diffuse brightness of paper and paperboard (d/0) T 525 – Diffuse brightness of pulp (d/0o)
Color ISO 5631 – Determination of color (C/2°) – Diffuse reflectance method
T 524 – Color of paper and paperboard (45/0, C/2) T 527 – Color of paper and paperboard (d/0, C/2)
Gloss ISO 8254-1 – Measurement of specular gloss Part 1: 75° gloss with a converging beam. TAPPI method. ISO 8254-3 – Measurement of specular gloss Part 2: 75° gloss with a parallel beam. DIN method. ISO 8254-2 – Measurement of specular gloss Part 3: 20° gloss with a converging beam. TAPPI method
T 480 – Specular gloss of paper and paperboard at 75 degrees T 653 – Specular gloss of paper and paperboard at 20-degrees
Kubelka-Munk Coefficients
ISO 9416 – Paper-determination of light scattering and absorption coefficients (using Kubelka-Munk theory)
T 1214 - Interrelation of reflectance; reflectivity; TAPPI opacity; scattering, s; and absorption, k
Opacity ISO 2471 – Determination of opacity (paper backing) – diffuse reflectance method
T 425 – Opacity of paper (15/d geometry, illuminant A/2°, 89% reflectance backing and paper backing T 519 – Diffuse opacity of paper (d/O paper backing)
Whiteness ISO 11476 – Determination of CIE whiteness, C/2°
T 560 – CIE Whiteness and tint of paper and paperboard (Using d/0°, diffuse illumination and normal viewing) T 562 – CIE whiteness and tint of paper and paperboard (Using 45°/0°, directional illumination and normal viewing)
* See Wysecki and Stiles (2000) for definitions of C and D65 illuminants, etc.

REVIEW ARTICLE ncsu.edu/bioresources
Hubbe et al. (2008). “Paper’s appearance: A review,” BioResources 3(2), 627-665. 631
Opacity Paper’s opacity can be briefly described as its ability to hide whatever is printed on its back side or on subsequent sheets (Scott et al. 1992). Publishers require certain levels of opacity to meet the expectations of their advertisers and readers. The TAPPI method (T 425) for evaluation of opacity involves diffuse illumination (see previous section) of the sample with light having a mean wavelength of 572 nm, i.e., green light. The percentage of reflection is measured under two conditions. First, a single sheet of paper is tested with a white porcelain material, having a reflectance of 89%, pressed against the back of it, giving a quantity defined as R0.89. A second measurement is made of the single sheet when it is backed by a black-lined cup, giving essentially zero reflectance of the backing. The result is labeled R0. The TAPPI opacity is then defined as R0 / R0.89. Alternatively, one may define opacity in terms of diffuse reflectance, from which a “diffuse opacity” can be measured as described in T 519 and ISO Standard 2471. The diffuse opacity test employs a different mean wavelength of light (557 nm) and a different backing (a thick stack of sample, not porcelain). Gloss Gloss can be described as paper’s relative ability to reflect light at a mirror angle (Leekley and Tyler 1975; Scott et al. 1992). The most frequently used TAPPI test (T 480) employs white light having an incident angle that is 75o relative to the normal to the plane of the sheet. Readers occasionally complain about excessive glare and reading difficulty when viewing highly glossy papers. But on the other hand, glossy paper can convey an impression of quality. In addition, if the printed image has high gloss, then the printing image will appear to have deeper blacks and more intense colors.
Aqueous coatings and calendering operations, in which the paper is squeezed between steel rolls and compliant rolls under high pressure, can be used to increase not only paper’s gloss, but also the tendency for printed images to develop high gloss levels. One can understand the effects of coating and calendering on gloss by considering the wavelength range of visible light, i.e. approximately 400 to 700 nm. In order for light to “bounce” in mirror-like fashion from the surface, there has to be considerable uniformity down at least to the wavelengths of light (Gate et al. 1973; Chinga 2004). Factors affecting gloss development include the colloidal stability of the coating formulation, such as the balance of attractive and repulsive forces between particles in the coating suspension (Alince and Lepoutre 1980), as well as base-sheet properties that influence the local coating structure (Tomimasu et al. 1990). Though, as mentioned, paper’s gloss has been attributed mainly to the mirror-like nature of its surface microstructure, there also can be a significant contribution to gloss originating in sub-surface reflection or scattering of light. Leekley et al. (1970) showed that the two components of light – due to surface reflection or sub-surface effects, can be separately distinguished if one uses polarized incident light. Image analysis methods, such as those first developed by MacGregor and Johansson (1990), have been used to characterize gloss uniformity over a wide range of dimensions down to the microscale (below 100 μm).

REVIEW ARTICLE ncsu.edu/bioresources
Hubbe et al. (2008). “Paper’s appearance: A review,” BioResources 3(2), 627-665. 632
Color With the exception of fluorescence effects (see next item), paper’s color can be specified based on the reflected light within the visual spectrum (Scott et al. 1992). But the human eye is not a spectrophotometer. From a physiological standpoint, color is related to the absorption of light by different chromophores present in three kinds of pigments in retinal cells called cone cells (Wyszecki and Stiles 2000). In humans with typical vision, the brain interprets colors by judging the relative amounts of light absorbed by the three types of chromophores in the eye, each having maximum absorbance within a characteristic range of wavelengths. The subject of color is considered in more detail later in this article. Fluorescence The principle of fluorescence is illustrated in Fig. 3 (see Wyszecki and Stiles 2000). Briefly stated, when light strikes a fluorescent material, some of the electrons acquire energy. In the case of ordinary, non-fluorescent materials, such energy either would be completely absorbed and converted to heat, or it would be immediately released again, producing light having the same wavelength as the incident light. But in the case of fluorescent materials just a portion of the energy transferred to electrons becomes dissipated as heat. Thus, when light is emitted, it has a lower energy, resulting in longer wavelengths in comparison to the incident light.
Higher energy & vibration state
First excited state
Second excited state
relaxation
Fluo
resc
ence
Abs
orpt
ion
of
light
ene
rgy
S2
S1
S0Ground state
Lowest energy singlet state
Fig. 3. Simplified description of energy transmissions within electronic orbitals when light strikes a fluorescent material
Papermakers commonly deal with two types of fluorescence. Fluorescent dyes can be used to produce glaringly colored papers, which can be useful in attracting attention. Though such effects of fluorescent dyes are highly noticeable, they are restricted to a relatively small fraction of colored specialty papers. Fluorescent whitening agents, which are sometimes called “optical brighteners” or “optical brightening agents,” are used much more widely, especially in office paper products. Fluorescent whiteners function by absorbing high-energy ultraviolet light and re-emitted light in the blue range of the visible spectrum (Pauler 2002). A common way of assessing the amount of fluorescent whitening effect in a sheet of paper is to compare the results of reflectance

REVIEW ARTICLE ncsu.edu/bioresources
Hubbe et al. (2008). “Paper’s appearance: A review,” BioResources 3(2), 627-665. 633
tests (for instance, brightness tests) measured with and without an ultraviolet component of light in the incident beam (Haddad 1967; Malthouse and Popson 1995). In addition to these effects of additives, one also needs to consider any intrinsic fluorescent effects of fibers themselves, resulting from their detailed chemical composition.
The presence of any kind of fluorescence in paper can make it more challenging to evaluate certain other characteristics of paper, such as brightness. Progress has been made both in terms of standards and in terms of instrumentation to deal with such issues (Caruso 1987; Bristow and Karipidis 1999).
Formation Uniformity Paper’s uniformity is often evaluated by viewing a sheet in transmitted light. Nonuniformities that are observed in this way actually are due to local variations in opacity. The phenomenon can result from a non-uniform distribution of fibers within the plane of the sheet (Cutshall 1990). Additionally, it can be expected that non-uniformity in the thickness of the sheet, independent of the mass distribution, can contribute to the non-uniformity of paper’s opacity. Variations in paper’s opacity can be detected instrumentally (Komppa 1988; Leewenberg 1998; Corscadden and Parker 1998; Keller et al. 1999). Except in a few unusual cases, such as certain art paper products, non-uniform paper is considered to be undesirable. Jordan (1985) showed that, on average, paper with non-uniform formation tends to have a lower average opacity value than similar paper having higher uniformity.
Bernie and Douglas (1996) were able to fit formation data by assuming that local opacity is proportional to the local basis weight. In other words, one expects there to be more scattering of light occurring in parts of the sheet where the light has to pass through more solid matter. Serious deviations from this rule can be expected, however, at the limit of high apparent density. Paper sometimes becomes more translucent in high basis weight areas, which can become highly compressed during calendering operations (Ratto and Rigdahl 2001), an effect referred to as “calender blackening”.
The nonuniformity of paper’s basis weight can have various consequences. Johansson and Norman (1996) showed that beta radiographic techniques can be used to directly measure the coefficient of variation in basis weight and its relationship to paper’s non-uniform appearance. In addition to affecting the appearance of paper itself, various researchers have documented ways in which non-uniform basis weight can affect the quality of coated papers, as well as the appearance of printed images (Engström 1994; Hua et al. 1996; Bernie et al. 2000). Local variations in gloss, giving the paper a mottled appearance, are often attributed to non-uniformity of base-paper formation (Parsons et al. 1999). The influence of formation and surface topography on printability has been discussed by Popil (1996).
Resolution, Print Density, and Print Uniformity Until quite recently, paper has remained by far the most effective and efficient means of storing large amounts of textual or graphic information, distributing that information, and communicating it to large numbers of people. Paper’s dominion, as a communications giant, started as early as the first century in China and completed its world domination over 500 years ago (Hunter 1947). In retrospect, paper’s success as a

REVIEW ARTICLE ncsu.edu/bioresources
Hubbe et al. (2008). “Paper’s appearance: A review,” BioResources 3(2), 627-665. 634
communications medium may be due to the fact that, though paper is not completely uniform, paper’s most significant deviations from uniformity, if it is well made, occur within a size range that is small relative to what the eye can detect. Thus, paper’s value, in terms of communication, can be affected by the limits of fine detail in a printed image, i.e., the resolution. As noted by Heikkilä (1996), the quality of a print job can be judged by examining ultra-high resolution images. Intentional differences between printed and non-printed areas can be judged relative to the prevailing “noise” of the optical background, due to any non-uniformity in formation, dirt, or the spreading of ink at the margins of imaged areas. Though paper never can be expected to provide the information density of a silicon chip device or magnetic hard drive, Oittinen (1993) showed how many of the same information storage concepts apply in both frames of reference. Subjective Aspects of Paper’s Appearance Despite impressive advances in instrumental methods, there still are many aspects of paper’s appearance that remain in the eye of the beholder. Corte (1976) provides excellent descriptions of optical illusions, as well as the ability of the eye and brain to adjust to widely differing conditions of illumination and context. For example, an instrumental comparison of two translucent paper samples, one with a rough surface, and the other very smooth, can give the same opacity measurements. However, when the sheets are held a small distance away from a written message, one of the sheets obscures the message and the other does not. The eye and brain also respond in non-ideal ways to flickering lights and patterns of shadows. Analytical methods have been developed to better understand the influence of perception on appearance. For instance, Ferwarda et al. (2001) developed a psycho-physical-based model of surface gloss, which involves quantitative studies of gloss perception and incorporates spatial or goniometric gloss variation to the analysis of surface appearance. While this method has been applied to synthetic surfaces with high gloss levels, it is considered general enough to be applicable to paper surfaces. Indeed, if shadow effects are cleverly arranged, the observer may be fooled into thinking that a non-glossy sample has a glossy surface.
EVALUATION AND PREDICTION OF OPTICAL CHARACTERISTICS Scattering and Absorption of Light The reflectance characteristics and opacity of non-glossy paper products can be fit, with reasonable accuracy, to a set of equations derived by Kubelka and Munk (1931). These authors carried out a simplified analysis in which a layer of material, such as a layer of paint, was envisioned as a stack of thin, parallel layers, each composed of particles that are much smaller than the layers. The material is envisioned as being uniform, isotropic (meaning “the same in all directions”), non-fluorescent, and non-glossy. The sample is assumed to be illuminated by diffuse, monochromatic light, and the majority of light (> 50%) is assumed to be diffusely reflected from the material, and less than 20% of the light is transmitted through the material.

REVIEW ARTICLE ncsu.edu/bioresources
Hubbe et al. (2008). “Paper’s appearance: A review,” BioResources 3(2), 627-665. 635
Figure 4 illustrates a beam of light i(x) entering a representative layer from above and a returning beam j(x) entering the same layer from below. The light is expected to interact in two ways as it passes through each layer of material (Leskelä 1998; Pauler 2000). The light may be either scattered backward in the direction from which the light originally came, or the light could be transmitted through the layer, or the light could be absorbed by the layer. The relative amount of scattering taking place within a layer is characterized by the scattering coefficient, s, while the relative amount of absorption taking place in a layer is characterized by the absorption coefficient, k. Strictly speaking, light that is scattered perpendicular from the incident beam also may contribute to the absorption coefficient, and this is a likely contribution to various deviations to be discussed. The Kubelka-Munk theory differs from various other theoretical approaches to these issues in that it does not deal with how the scattering takes place. The theory only takes into account the abilities of different materials to reflect light, a subtle, but important distinction. Light is assumed to be scattered diffusely, resulting in an equal energy of light going out from each scattering site, in much the same way as the waves produced when a rock is tossed into a pond. The absorption of light is assumed to involve the conversion of light energy into heat.
IIncident beam J
Diffusely reflected beam
i (x)
j (x)
Rg
R
x
} dx
Background (reflectance = Rg)
Paper sample
Thin layer
Fig. 4. Model of a paper sheet on a background of reflectance Rg for the derivation by Kubelka and Munk According to the derivation by Kubelka and Munk, the change in the intensity of the beam that is progressing downward through the sample, -di, and the change in intensity of the beam that is progressing upwards through the sample, dj, as the light beams pass through the thin layer in question can be given by the following expressions: - di = - (s + k) i dx + s j dx (1) dj = - (s + k) j dx + s i dx (2)
Though real paper never completely satisfies all of the underlying assumptions,
and it sometimes deviates greatly from them, the Kubelka Munk equations have become

REVIEW ARTICLE ncsu.edu/bioresources
Hubbe et al. (2008). “Paper’s appearance: A review,” BioResources 3(2), 627-665. 636
widely used in the paper industry over many years (Steele 1935; Judd 1938; Adrian 1944; Van den Akker 1949, 1982; Stenius 1951; Hillend 1966; Borch and Scallan 1975; Robinson 1975; Mosher 1978; Krolopp 1979; Olf 1980; Scott et al. 1992). Van den Akker (1949) introduced a subtle variation in the interpretation of the formulas by considering the mass, rather than the thickness of each infinitesimal layer. Such an approach makes sense in the case of paper because of paper’s inherent compressibility, as well as the difficulty in determining its exact thickness. Though paper’s optical characteristics do generally depend on its state of compression, papermakers tend to be mainly concerned about the optical characteristics of paper at a specified basis weight. This modification leads to an important point regarding the units of s and k. In the original derivation of this model, s and k have the units of inverse thickness, e.g. m-1. In the modified approach, capital letters are used, and the parameters S and K have units of reciprocal basis weight, e.g. m2/g. One should be careful not to confuse the inverse basis weight units with any theoretical relationship to specific surfaces area, which has the same units.
The scattering S and absorption K coefficients can be defined as follows, S = 0.5 ln [( c + 1) / (c – 1)] / (W b ) (3) K = a S - S , (4)
where a = 0.5 [( 1/R∞) + R∞ ] b = 0.5 [( 1/R∞) - R∞ ] c = (1 – a Ro ) / ( b Ro) and R∞ is the proportion of incident light that is diffusely reflected from an infinitely thick stack of the material (i.e., the reflectivity), Ro is the proportion of light that is diffusely reflected from a single sheet of the material that is backed by a perfect black (see earlier discussion), and W is the basis weight of the single sheet or ply of the material. An infinitely thick stack of the material is typically defined as a stack sufficiently thick such that when its thickness is doubled, the measured reflectivity does not change. Figure 5 illustrates the sample arrangements used for evaluation of the quantities Ro and R∞.
Once the S and K values have been determined for a uniform sheet material, these values then can be plugged back into the following equations, first of all, to make some rather elementary estimates: R∞ = 1 + K / S - [( K/S )2 + ( 2 K/S ) ]0.5 (5) Ro = [ -1 + exp(q) ] / [ -R∞ + ( 1/R∞) exp(q) ] (6)

REVIEW ARTICLE ncsu.edu/bioresources
Hubbe et al. (2008). “Paper’s appearance: A review,” BioResources 3(2), 627-665. 637
RoPaper sheet
Black cavity
Incident light(diffuse) Reflected light
R∞
Paper sheets
Incident light(diffuse) Reflected light
Fig. 5. Arrangement of samples when evaluating the quantities Ro and R∞. [(0.89 - R∞)/ R∞] – [R∞ (0.89 – (1/R∞)) exp(q)] R0.89 = ⎯⎯⎯⎯⎯⎯⎯⎯⎯⎯⎯⎯⎯⎯⎯⎯⎯⎯⎯ (7) (0.89 - R∞) – [( 0.89 – (1/R∞)) exp(q)]
where q = s W [(1/R∞) - R∞] (8) Equation (7) has a practical utility, since TAPPI opacity (TAPPI Method T425) is defined by the ratio of the reflectance values of a single sheet backed by a perfect black, Ro, and the reflectance of the same sample backed by a ceramic material having a reflectance of 89%, R0.89, i.e., TAPPI Opacity = Ro / R0.89 (9) By using equations (5) through (8) it is possible to estimate the opacity for any arbitrary basis weight, as long as one continues to accept on all of the underlying assumptions, including the assumption that the optical properties of the materials are not affected by changes in basis weight, at least not in the case under consideration. Paper products with more than one ply or layer Let’s suppose that the product development engineers working for a paper company want to make a product in which a white ply of paper, designed for good optical properties, is backed by a series of plies comprised of unbleached kraft pulp (for strength and low cost). Or let’s suppose that they are developing coated products. In either case, it is possible to estimate the reflectance of the resulting product by using the same mathematical approach (Leskelä 1995). The opacity (either TAPPI opacity or printing opacity), as well as the brightness of the material can be estimated by applying the following generalized equation for the reflectance:
REVIEW ARTICLE ncsu.edu/bioresources
Hubbe et al. (2008). “Paper’s appearance: A review,” BioResources 3(2), 627-665. 638
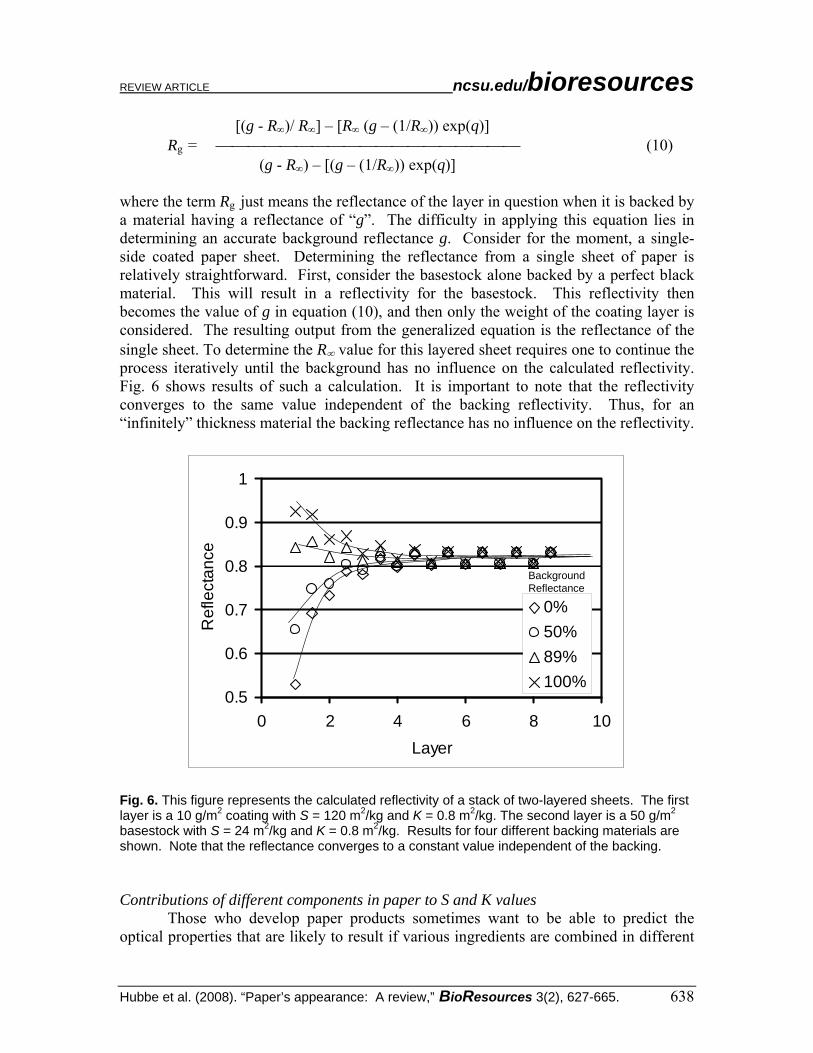
[(g - R∞)/ R∞] – [R∞ (g – (1/R∞)) exp(q)] Rg = ⎯⎯⎯⎯⎯⎯⎯⎯⎯⎯⎯⎯⎯⎯⎯⎯⎯⎯⎯ (10) (g - R∞) – [(g – (1/R∞)) exp(q)] where the term Rg just means the reflectance of the layer in question when it is backed by a material having a reflectance of “g”. The difficulty in applying this equation lies in determining an accurate background reflectance g. Consider for the moment, a single-side coated paper sheet. Determining the reflectance from a single sheet of paper is relatively straightforward. First, consider the basestock alone backed by a perfect black material. This will result in a reflectivity for the basestock. This reflectivity then becomes the value of g in equation (10), and then only the weight of the coating layer is considered. The resulting output from the generalized equation is the reflectance of the single sheet. To determine the R∞ value for this layered sheet requires one to continue the process iteratively until the background has no influence on the calculated reflectivity. Fig. 6 shows results of such a calculation. It is important to note that the reflectivity converges to the same value independent of the backing reflectivity. Thus, for an “infinitely” thickness material the backing reflectance has no influence on the reflectivity.
0.5
0.6
0.7
0.8
0.9
1
0 2 4 6 8 10Layer
Ref
lect
ance
0%50%89%100%
Background Reflectance
0.5
0.6
0.7
0.8
0.9
1
0 2 4 6 8 10Layer
Ref
lect
ance
0%50%89%100%
Background Reflectance
Fig. 6. This figure represents the calculated reflectivity of a stack of two-layered sheets. The first layer is a 10 g/m2 coating with S = 120 m2/kg and K = 0.8 m2/kg. The second layer is a 50 g/m2 basestock with S = 24 m2/kg and K = 0.8 m2/kg. Results for four different backing materials are shown. Note that the reflectance converges to a constant value independent of the backing. Contributions of different components in paper to S and K values Those who develop paper products sometimes want to be able to predict the optical properties that are likely to result if various ingredients are combined in different

REVIEW ARTICLE ncsu.edu/bioresources
Hubbe et al. (2008). “Paper’s appearance: A review,” BioResources 3(2), 627-665. 639
ways. As a first step in such an analysis one assumes that the scattering and adsorption coefficients can be expressed as a linear series of terms, Spaper = S1 x1 + S2 x2 + S3 x3 … (11) Kpaper = K1 x1 + K2 x2 + K3 x3 … (12) where the coefficients indicate different ingredients, such as fibers, calcium carbonate, and titanium dioxide, etc. The terms xi indicate the mass fraction of the ith component. To make use of Eqs. (11) and (12), it is first necessary to obtain values for S1 and K1, which correspond to the fiber component. These values usually are obtained by evaluating unfilled paper sheets that are prepared under the same conditions of pressing, calendering, etc., as the samples of interest. Equations (3) and (4) are used for these calculations. A second set of handsheets is then prepared in the presence of a known fraction x2 of a selected filler, and a second set of data is obtained. The values of S2 and K2, corresponding to the filler component, then can be calculated as follows: S2 = ( 1/x2 ) [ Sfilled - ( 1 – x2 ) S1 ] (13) K2 = ( 1/x2 ) [ Kfilled - ( 1 – x2 ) K1 ] (14) where the values of Sfilled and Kfilled are again calculated from equations (3) and (4), except that the data for filled paper sheets are used. Specific scattering and absorption coefficient, obtained in basically this way, have been published (Middleton et al. 1994), and Table 2 shows some approximate ranges for common ingredients of paper. Table 2. Typical Ranges of Specific Light Scattering and Absorption Coefficients in Paper Products (blue or green light) Component of Paper Specific Light Scattering
Coefficient S (cm2/g) Specific Light Absorption
Coefficient K (cm2/g) Bleached hardwood kraft pulp 250 – 400 1 – 10 Bleached softwood kraft pulp 200 – 350 1 – 10 Thermomechanical pulp (TMP) 400 – 700 4 – 20 Kaolin clay 900 – 2000 5 – 20 Ground calcium carbonate (GCC) 1200 – 2500 1 – 10 Precipitated calcium carbonate (PCC) 2000 – 3300 1 – 5 Titanium dioxide (rutile or anatase) 4000 – 7000 1 – 20 Although the approach just described can make sense from a mathematical standpoint, potential users should be aware of some limitations and some complications. As will be discussed in more detail later, it is not quite realistic to attribute light scattering effects to a linear sum of effects due to fibers and other effects due to fillers. Rather, some of the increase in light scattering that results from the addition of fillers to paper is a consequence of filler-induced changes in paper’s structure. By occupying spaces between adjacent fibers, the filler particles brace parts of the fiber surfaces apart from each other, thus increasing the proportion of non-bonded surface area. As a result of how Eqs. (13) and (14) have been defined, any additional component of light scatter-

REVIEW ARTICLE ncsu.edu/bioresources
Hubbe et al. (2008). “Paper’s appearance: A review,” BioResources 3(2), 627-665. 640
ing due to interactions between minerals and fibers gets assigned to the fillers. Another complication is that the values that one obtains for S2 tend to decrease as the amount of filler in the paper increases, i.e., S2 cannot be treated as a constant, except as a gross approximation. The latter effect has been called “optical crowding.” Concerns regarding the precision of the Kubelka-Munk equations When one considers the assumptions underlying the derivation of the Kubelka-Munk equations, it should not come as a surprise that inconsistencies are sometimes found when applying these equations to real paper samples. Specifically, the Kubelka-Munk coefficients are assumed to be linear and independent quantities. However, it has been observed that the values of S tend to be shifted whenever the value of K is greatly increased, at a given wavelength, as when a high level of dye has been added (Nordman et al. 1965; Rundlof and Bristow 1997). Van den Akker (1965b) attributed such deviations to paper’s nonuniformity at a submicroscopic level, which violates a strict interpretation of assumptions underlying the Kubelka-Munk analysis, i.e., the material is considered to be featureless and isotropic. Olf (1989a,b) suggested that the deviation also could be expected as a result of basis weight nonuniformities at a macroscopic level, i.e., non-uniform formation. While considerable effort has been made to explain this phenomenon, Koukoulas and Jordan (1997) showed that K and S are actually dependent quantities that can be related to the real and imaginary part of the refractive index. Using an analysis based on the Kramers-Krönig relations they were able to fully explain the anomalous behavior of the Kubelka-Munk coefficients in regions of strong absorption.
In practical terms, papermaking fibers are much larger, in all dimensions, than wavelengths of visible light. In an attempt to achieve more realistic results an alternative approach was developed based on the work of Stokes (1862). Scallan and Borch (1972) found that such an approach was able to more closely predict the optical properties of real paper, compared to the Kubelka-Munk system. Scallan (1985) and Olf (1989a,b) compared calculated results based on each of these general approaches and identified circumstances under which the predictions were in agreement. One practical drawback, when using equations based on the Stokes model, is that the parameters in the equations are not generally available in the literature (Scallan and Borch 1972). The optically active features within the paper structure may not be the fibers themselves, but they may be features of the ultra-structure of the fibers themselves, i.e. uncollapsed internal pores, defects, and non-uniformities in the refractive index.
Those who insist on the utmost accuracy and realism of optical analyses may prefer an approach based on three-dimensional radiative transfer theory, which was applied in the case of papers by Leskelä (1993, 1994a,b). Predictions based on radiative transfer theory were shown to be in reasonable agreement with the full Mie theory (1908), which takes a detailed approach to determining optical properties, based on microstructure. Evaluation and Specification of Paper’s Color The discussion up to this point has skirted the subject of different wavelengths, and the optical characteristics have been described in terms of monochromatic light, or, as an approximation, by treating white light as a single entity. White light is composed of

REVIEW ARTICLE ncsu.edu/bioresources
Hubbe et al. (2008). “Paper’s appearance: A review,” BioResources 3(2), 627-665. 641
many wavelengths. Because the refractive index values of most materials change signifi-cantly as a function of wavelength, it is not strictly accurate to apply Kubelka-Munk analyses to white light. In addition, any description of paper’s appearance without con-sidering its color cannot be complete. Fortunately, some of the same principles already outlined can be extended across the whole visible spectrum. In order to start the analysis it is first necessary to give a mathematical interpretation of human vision. To describe the function of a human eye, with respect to color, one begins with a description of the relative sensitivities of the three types of cone cells. When presented in graphical form, this description is called a tristimulus diagram. As shown in Fig. 6, one of the sensors, denoted , has a maximum sensitivity at about 450 nm, in the blue region of light. Tristimulus parameters are written with a horizontal line over the respective letter. The tristimulus value corresponds to a maximum sensitivity near 550 nm, in the green region. The tristimulus value corresponds to a maximum sensitivity near to 600 nm, in the red region. Notably, the tristimulus function has a small secondary maximum in the blue part of the spectrum. A mathematical representation of color can be obtained by means of the following three equations, X = k ∑ (λ) • s(λ) • R(λ) Δλ (15) Y = k ∑ (λ) • s(λ) • R(λ) Δλ (16)
Z = k ∑ • s(λ) • R(λ) Δλ (17) where k = 100 / [∑ (λ) • s(λ) Δλ] is the normalizing factor, R(λ) is the spectral reflectance of the sample, as a function of wavelength, s(λ) is the spectral energy of the chosen illuminant, and (λ), (λ), and (λ) are the color matching functions of the type represented in Fig. 7.
400 500 600 700
1.0
2.0
Tris
timul
usVa
lues
per
Wat
t of
Inci
dent
Lig
ht
Wavelength of Light (nm)
z
y x
Fig. 7. Plot of the spectral distribution of the three tristimulus functions that represent the sensitivity of the cone cells in the average human eye

REVIEW ARTICLE ncsu.edu/bioresources
Hubbe et al. (2008). “Paper’s appearance: A review,” BioResources 3(2), 627-665. 642
In order to represent color space in a two-dimensional diagram, an additional transformation is required. The values that result from the following calculations are called the chromaticity coordinates of the object’s color: x = X / [ X + Y + Z ] (18) y = Y / [ X + Y + Z ] (19) Although color information can be specified in an unambiguous manner either with X, Y, and Z values or with x and y values, color scientists have put a lot of effort into trying to find a way to express colors such that numerical differences in color can give an indication of how similar or different two different colors appear to an average viewer. For instance, in the coordinate system defined by the chromaticity coordinates x and y, a large amount of the plot is devoted to shades of green, whereas colors such as orange and blue are crowded into narrower segments of the plot. Although there are several such systems in current use, one of the most commonly used is the CIE L*, a*, b* system (Ohno 2000; Pauler 2000; Borch 2002). The following equations are used to define these quantities, L* = 116 [ Y / Yn ]1/3 - 16 (20) a* = 500 { [X / Xn ]1/3 - Y / Yn ]1/3 } (21) b* = 200 { [Y / Yn ]1/3 - Z / Zn ]1/3 } (22) where the values of the constants Xn , Yn , and Zn are equal to 98.07, 100, and 118.2, respectively in the case of the C Illuminant and 94.8, 100, and 107.3 according to the D65 standard illuminant (Pauler 2002). Figure 8 illustrates the L*-a*-b* coordinate system.
White
Black
Green
Blue
Yellow
Red
L* = 100
L* = 0
+a*
+b*
- b*
- a*ChromaHue
Fig. 8. Coordinate system for L*-a*-b* color space

REVIEW ARTICLE ncsu.edu/bioresources
Hubbe et al. (2008). “Paper’s appearance: A review,” BioResources 3(2), 627-665. 643
The parameter L*, which is often called the “light-ness” of the sample, can be taken as a measure of the sample’s reflectance in the mid-range of the visible spectrum. Likewise, a* can be taken as a measure of the redness (positive values of a*) versus green-ness (negative values of a*), and b* can be taken as a measure of the yellowness (positive values of b*) versus blueness (negative values of b*).
Metamerism A pair of samples are said to be “metameric” with each other if their color appears to be a good match under one specified condition of illumination, but they fail to match when viewed under at least one other illuminant. Metamerism can have serious conse-quences when publishers attempt to use paper that was prepared in different batches or in different locations, and the sheets are being used together in a printed product. The good news, from a papermaker’s perspective, is that this kind of problem usually can be resolved. In principle, metamerism can be avoided by making sure that the reflectance curve of a product matches the standard color throughout the visual spectrum. In practice this can be achieved by using red, blue, and yellow dyes having the same hue characteristics as the dyes that were used in preparing the standards. Metamerism can be expected if a “canary yellow” dye is being used in place of a “mustard yellow,” or a “cyan blue” is being used in place of a “dull blue”, etc. Metamerism also can result if significantly different levels of fluorescent whitening effect are present in the sample vs. the standard (see later discussion). Color tolerance Color technologists have spent considerable effort to develop single-valued criteria by which to accept or reject colored products, in terms of how closely they match to a selected standard color. Within the CIE L*, a*, b* system, a color tolerance value can be calculated as follows (Kuehni 1976; Ohno 2000; Pauler 2002), ΔE = [ (L*1 - L*2 )2 + (a*1 - a*2 )2 + (b*1 - b*2 )2 ]0.5 (23) where the subscript 1 refers to the sample data and subscript 2 refers to the standard. Although many papermakers and their customers continue to rely on Eq. (26) for their color acceptance decisions (even if they do not realize it, since the instrument takes care of all of the calculations), progress has continued in color science, and it is possible now to make color acceptance decisions that are much more closely matched to the judgments of panels of observers. Among color specialists, there is almost a consensus that color acceptability decisions ought to be based on a set of criteria called the CMC system (Clarke et al. 1984; Kuehni 1987, 1990; McDonald 1990; Jay 1991; Anon. 1991). A yet more precise, but considerably more complicated set of color acceptability equations, called the BFD formula, also has been developed (Luo and Rigg 1987a,b), but it does not appear to have come into common use (McDonald 1990). Whiteness As one might expect from the fact that most printing and writing paper products can be described as “white,” there has been much emphasis on specifying and

REVIEW ARTICLE ncsu.edu/bioresources
Hubbe et al. (2008). “Paper’s appearance: A review,” BioResources 3(2), 627-665. 644
maximizing whiteness (MacAdam 1955; Ganz 1979; Ganz and Greisser 1981; Parkes 1989; Bristow 1990, 1994; Jordan and O’Neill 1991; Puebla 1996; Griesser 1996; Pauler 2000; Sturm and Chen 2005; Bohman 2005). Though it may be tempting to think of “white” as just being the absence of color, it has been difficult to come up with a technical description that reliably agrees with the judgments of human observers. When they are presented with pairs of near-white samples, there has been a tendency for people to choose samples having a bluer tint as being “whiter” (Ganz and Griesser 1981; Jordan and O’Neill 1991; Greisser 1996). To make matters more troublesome, people’s preference for different white shades may shift, depending on the context.
One of the most widely used whiteness quantities, the CIE whiteness, is defined as follows for the D65 Illuminant and 10o observer (D65/10o) (Pauler 2000), W = Y + 800 (xD65 – x) + 1700 (yD65 – y) (24) where xD65 and yD65 are the chromaticity coordinates of the D65 Standard Illuminant that is being used for the evaluation. The test standards also specify that the tint of the sample should not be so blue (or other hue) that it no longer can be described as white. The tint equation is given by T = 900(xD65 – X) – 650(yD65 – y), and the tolerance levels are set as follows: 5Y – 280 > W > 40; -3 < T < 3. Though whiteness values sometimes are used to promote the sale of high-brightness paper products, one must bear in mind that it is not possible to fully characterize the appearance of paper by just one scalar value. In principle, since the average human eye has three types of pigments in the cone cells, three values are needed to specify appearance. One way to rectify this situation is to specify the tint of different white paper products, in addition to specifying the whiteness value. From a scientific standpoint, it makes more sense just to specify the color of white products, using either the chromaticity coordinates (Bohman 2005) or the CIE L*, a*, b* system, etc. Brightness and whiteness specification has continued to become more challenging with the increased usage of fluorescent whitening agents in high-bright grades. The brightness and tint of such grades can appear significantly different, depending on the content of ultraviolet light in the illuminant. If the whitening effect is significantly different, when comparing the test sample to the standard, then one can expect to encounter metamerism, meaning that the sample will appear to match the standard only under certain conditions of illumination (Praast and Göttsching 1996; Bristow and Karipidis 1999). In particular, it is necessary to standardize and calibrate the amount of ultraviolet light in the beam that is used to illuminate samples in brightness detectors. Any remnant colorants and other fluorescent materials in recycled fibers can contribute to metamerism, when attempting to match a standard.
Metamerism problems also can be significant in cases where papermakers attempt to achieve approximate color matches with the use of just two dyes, as is sometimes done when producing newsprint paper, rather than the more conventional practice of using three dyes.
REVIEW ARTICLE ncsu.edu/bioresources
Hubbe et al. (2008). “Paper’s appearance: A review,” BioResources 3(2), 627-665. 645
MECHANISMS BY WHICH MATERIAL CHARACTERISTICS CAN AFFECT PAPER’S APPEARANCE Absorption of Light The chemical nature of paper’s components, as well as those of dirt and ink, can provide a basis for understanding the absorption coefficient (K), i.e., paper’s ability to absorb light, as summarized in the previous section. Any organic material that absorbs a significant amount of visible light can be called a “chromophore.” When considering paper’s appearance, therefore, it is meaningful to ask, “What are the most important chromophoric groups, and how are those groups affected by various processes associated with manufacturing and using paper?” Dyes Papermakers can change the product’s color by adding various dyes, thereby absorbing some of the incident light. By controlling the amounts and proportions of different dyes, the papermaker can achieve a wide range of colors. Conventional papermaking dyes can be called “subtractive,” meaning that they can only decrease the reflectance of paper at any given wavelength. Only in the case of fluorescent dyes is some of the light energy re-emitted at a longer wavelength. Although violet, green, orange, and brown dyes (or mixtures of dyes) can be used in special circumstances, papermakers most frequently rely on combinations of the primary colors: blue, red, and yellow dyes. In addition, black dyes, which are usually based on carbon black, are commonly used when manufacturing very dark shades. To aid in the selection of dyestuffs for different applications, colorists have classified dyes into Color Index categories, including direct, cationic direct, basic, acid, and pigment dyes (Lips 1981). Of these, the direct dyes are the most widely used in modern paper mills. The word “direct” implies that the dye molecules are sufficiently large and planar that they have a tendency, on their own, to adsorb onto cellulosic surfaces. Sulfonate groups on typical direct dyes confer a degree of solubility. In some cases it may be helpful to use a cationic additive, such as alum or poly-aluminum chloride (PAC) as a mordant, to increase the retention efficiency of the dye onto solid surfaces. Fluorescent whitening agents (FWAs) can be considered to be a special category of direct dyes. Dye suppliers also provide various cationic direct dyes, which can be very similar to ordinary (anionic) direct dyes, except that additional amine functions have been added as side-groups of the molecule, giving a net positive charge. Because of the predom-inantly negative charge of untreated cellulosic fibers of various types, cationic direct dyes usually adsorb very strongly. Acid dyes also typically have sulfonic acid groups, but the molecules are not sufficiently large for them to stay “fast” on the surface of cellulosic fibers in suspension. Rather, it is necessary to treat the system with a fixative, such as aluminum sulfate or an amine, in order to bind the dye onto the surfaces. Due to the generally poor retention efficiency of acid dyes, even in the presence of fixatives, they have become uncommon in paper mills.

REVIEW ARTICLE ncsu.edu/bioresources
Hubbe et al. (2008). “Paper’s appearance: A review,” BioResources 3(2), 627-665. 646
Basic dyes (if one excludes the cationic direct dyes, which technically fall within this category) are similar in size with the acid dyes, except they have a positive charge in solution. Basic dyes are commonly used with highly anionic furnishes, such as those that contain mechanical pulp. Papermakers employ colored pigments in a few exceptional circumstances, such as when they require a very high level of light-fastness, or when using carbon black to make very dark products.
Because essentially all dyes used in papermaking have either acidic or basic ionizable groups on them, their performance is affected by charged additives that are used during papermaking. Not only do charge interactions affect the degree to which dyes and dye-containing fine matter are retained in the paper during its formation, but they also can affect the hue of a dye product. Complexation of a direct dye molecule with a strongly cationic amine product often results in a dulling of the color. In the case of fluorescent whitening agents, the fluorescent effect can be partly “quenched” (rendered ineffective) by such interactions. Scattering of Light In principle, light can be scattered when it passes between two phases that have significantly different refractive index values. In the case of macroscopic phases with a smooth interface the refractive index n2 of a uniform material, relative to the surrounding medium having a refractive index n1 is given by the following expression, n2 = n1 [ sin φ1 / sin φ2 ], (25) where φ1 is the angle of the incident beam, relative to the normal, and φ2 is the angle of the refracted beam, relative to the normal to a planar surface. The greater the difference between n2 and n1, the greater will be the bending of light at the interface. Likewise, the ratio of refractive indices at phase boundaries also governs how much of the light is reflected, and how much of it is refracted, entering the other phase. Because there is a big difference in refractive index between cellulosic material (n ≈ 1.5) and air (n ≈ 1), much of the light scattering that occurs when light passes through an unfilled paper sheet occurs at the surfaces of fibers. By definition, very little scatter-ing of light occurs if light passes directly from one fiber to another, since no significant differences in refractive index are expected. Swanson and Steber (1959) were among the first to explain this effect. They proposed that the ability of fibers to scatter light ought to be proportional to their unbonded surface area. Consistent with these ideas, various authors have observed a strong inverse relationship between paper’s density and its ability to scatter light (El-Hosseiny and Abson 1979; Batchelor and He 2005). Because of the relationship between bonding and the scattering of light, a lot can be learned by evaluating both strength and optical characteristics together, in the same study. Page (1969) developed a semi-empirical equation to relate both tensile strength and light scattering characteristics to the structural characteristics of paper. The analysis begins by recognizing that paper can fail either by breakage of fibers or by separation of the bonds between fibers. In Page’s equation the inter-fiber bonding strength is given by a series of geometric terms, which are multiplied by the relative bonded area (RBA) and
REVIEW ARTICLE ncsu.edu/bioresources
Hubbe et al. (2008). “Paper’s appearance: A review,” BioResources 3(2), 627-665. 647
the specific shear strength per unit of bonded area. The RBA is defined as the proportion of fiber surface area involved in bonding, compared to the total external area of the fibers. One of the great successes of this type of analysis is that it can help answer questions related to the role of cationic starch, a wet-end additive that is commonly used to increase the strength of paper. Howard and Jowsey (1989) used an analysis based on the Page equation to show that wet-end addition of cationic starch did not have a significant effect on paper’s structure, i.e., paper’s relative bonded area remained about the same in handsheets prepared with and without cationic starch. The observed strength increases, therefore, had to be attributed to increases in the shear strength per unit of bonded area.
Dimensions are expected to play a key role in determining the degree to which light becomes scattered as it passes through a composite structure. Solids and/or void spaces that are quite small relative to a wavelength of light are not expected to contribute significantly to light scattering. On the other hand, if the solid phases and void spaces through which the light passes are very large, relative to a wavelength of light, it follows that that the number of phase changes must be relatively low. Bown (1998) demonstrated consequences of these competing trends in a study of different types of mineral fillers for paper. Commonly used fillers, such as kaolin clay and calcium carbonate products, have refractive index values in the range 1.55 to 1.6, i.e., relatively near to that of cellulosic fibers. Bown’s results showed that optimal particle sizes of filler particles can maximize the light scattering effect. In the case of filler particles having relatively simple shapes, the optimum particle sizes were generally in the range of about 0.5 to 1 μm. More complex types of fillers, involving composite structures, did not fit the same rules with respect to particle size, since light can encounter multiple solid-air interfaces as it passes through a single composite particle.
The importance of void spaces in paper, relative to light scattering, was demonstrated in a particularly persuasive manner by Bown (1985). In one series of tests, handsheets were prepared with different types of levels of filler materials. Then, by using various solvents, the fillers were removed in such a way that the surrounding structure of the paper was left unchanged. Void spaces were left behind in locations where the fillers had been. Such spaces contributed greatly to the opacity of the paper.
Alince and Lepoutre (1980a,b) demonstrated the importance of void spaces in paper coating layers, relative to their ability to scattering light. In an initial set of tests they showed that maximum light scattering could be achieved if the size of stiff latex particles was between 0.4 and 0.5 μm (Alince and Lepoutre 1980a). They calculated that the resulting void spaces would be about 0.2 to 0.3 μm, i.e., a large enough fraction of a wavelength of light to have a big effect. In a second set of tests (Alince and Lepoutre 1980b), the same authors varied the colloidal stability of aqueous coating formulations, there were able to systematically vary the coating structure and density. Coatings prepared with increasing bulk (lower density) contributed to greater brightness and opacity. However, the changes in formulation necessary to achieve such effects tended to make the coating formations more challenging to run, and it was expected to be more likely that the resulting coatings would have insufficient pick strength to be suitable for lithographic printing applications.

REVIEW ARTICLE ncsu.edu/bioresources
Hubbe et al. (2008). “Paper’s appearance: A review,” BioResources 3(2), 627-665. 648
PAPERMAKING PRACTICES AFFECTING PAPER’S APPEARANCE The circumstances under which the components of paper are obtained, processed, assembled, and then pressed and calendered can be expected to influence paper’s appearance, often in ways that can be rationalized based on theory (Giertz 1966). The emphasis in this section will be on paper’s main components, their mechanical processing, and various chemical additives and chemical changes. Paper’s Main Components Fiber source selection Though, as will be discussed in the following subsections, the optical properties of paper can be profoundly affected by such processes as bleaching and refining, there are certain ways in which the length, width, and wall thickness of the original fibers still can play a dominant role relative to paper’s appearance. A high light scattering coefficient, contributing toward the opacity of paper products, tends to be favored by a bulky structure. In other words, the goal is to maximize the amount of interfacial area between the solid phase and open spaces within the sheet.
In theory it might make sense to employ relatively thin-walled fibers, taking advantage of the fact that essentially all woody fibers have cell walls that are substantially thicker than a wavelength of light (Scallan and Borch 1976). Kibblewhite (1973), in an unusual study, showed that juvenile, early-wood bleached kraft fibers, when carefully obtained by fractionation, had the potential to achieve very high light scattering performance. Such results were obtained in the absence of refining, such that the large lumens of the unusually thin-walled fibers remained uncollapsed. Unfortunately, under realistic conditions of papermaking, thin-walled fibers have a strong tendency to collapse into ribbons, even with just a small amount of refining. Thus, the selection of thin-walled fibers, even if it were economically feasible, would not necessarily contribute to a bulky paper structure. In particular, if thin-walled fibers are subjected to typical levels of refining, they are likely to become so conformable that the relative bonded area in the paper becomes high and the light scattering becomes relatively low. Ironically, papermakers often used almost the opposite strategy when attempting to maximize the light-scattering ability of the fiber component of paper. Rather than focus on the cell wall thickness, they select fiber types that offer high resistance to collapse. Mechanical pulp fibers tend to be relatively stiff and resistant to collapsing into ribbon-like shapes, due to their high content of lignin. Mechanical pulping also tends to produce a diverse mixture of relatively rigid fiber fragments. Such fragments offer many solid-air interfaces in the paper structure, and the opacity can be reasonably high, as in the case of newsprint paper. Today, many paper grades, including so-called “freesheet” papers, can contain varying levels of mechanical pulp fiber to impart higher bulk and opacity to the sheet (Reis and Neilson 2001). Chemical pulping and bleaching practices As was illustrated partly in Fig. 3, the absorption of UV and visible light requires changes in the occupancy of energy levels in the electronic orbitals of molecules. In the case of ordinary hydrocarbons and carbohydrates, such electronic transitions lie at energy
REVIEW ARTICLE ncsu.edu/bioresources
Hubbe et al. (2008). “Paper’s appearance: A review,” BioResources 3(2), 627-665. 649
levels substantially higher than what is needed to absorb visible wavelengths of light. Relatively pure cellulose and hemicellulose fractions, therefore, absorb only in the ultraviolet. Lignin, however, usually has a sufficiently developed conjugation of alternating single C-C and double C=C bonds as to absorb visible light, especially in the blue part of the spectrum. Accordingly, the yellowish color in natural wood has been partly attributed to the presence of coniferaldehyde end groups (Gellerstedt 1996).
Ironically, when papermakers use the kraft pulping process in an attempt to remove much of the lignin, one of the most noticeable effects is a considerable darkening of the pulp (Minor 1996; Bajpai 2005). As lignin is being removed to a progressive extent by kraft pulping, the brightness of typical pulp can decrease from about 60% to a minimum of about 10%, coinciding with a yield of about 70% (Minor 1996). Further delignification increases the brightness again, but nowhere near to the starting level of the wood material. The dark color of unbleached kraft pulp has been attributed to double bonds conjugated with aromatic rings, as well as quinones and quinone methides (Gellerstedt 1996). Complexes between ferric and ferrous ions with catechol groups in the residual lignin-related structures are expected to be another contributor to the dark color of unbleached kraft pulps (Gellerstedt 1996).
Though the bleaching of kraft pulp is often thought of as a continuation of the removal of lignin, a further aim of bleaching is to sufficiently change the byproducts of lignin molecules so that they no longer act as significant chromophores. In terms of the Kubelka-Munk calculations, the effect of bleaching is to reduce the value of K, especially in the blue region of the spectrum (Jordan 1996; Popson et al. 1997).
A much different strategy is typically used for bleaching of mechanical pulps, such as thermomechanical pulp (TMP). Rather than remove lignin, which would reduce the yield of the pulping process and require larger consumption of chemicals, the object of the treatment is merely to convert chromophores into non-light-absorbing entities. Hydrogen peroxide, a relatively mild oxidizing agent, can be effective in this role, especially under mildly alkaline conditions in the presence of phosphates or chelating agents (Presley and Hill 1996). Bleaching of high-yield pulps also can be achieved by addition of reducing agents, such as sodium hydrosulfite (dithionite) or borohydride (Ellis 1996).
Aging Gradual changes in the light-absorbing ability of paper can occur during its storage, even under relatively ideal conditions. For instance Abadie (1987) observed changes in bleached and unbleached spruce mechanical pulp sheets during 15 years of storage (1987). In one case the ISO brightness fell from 61.6% to 48.1% during that time period. Despite noticeable yellowing and reduced brightness, it was concluded that such changes were not likely to affect readability to a significant degree. Samples of paper in which the mechanical pulp had been peroxide-bleached tended to retain their brightness to a degree that was greater than what had been predicted on the basis of accelerated aging tests at elevated temperature. Exposure to light and other environmental conditions also can affect the color of mechanical pulp over the course of time (Leary and Zou 1994; Bird 1999). It has been observed that thermal yellowing occurred in a variety of paper types, regardless of their
REVIEW ARTICLE ncsu.edu/bioresources
Hubbe et al. (2008). “Paper’s appearance: A review,” BioResources 3(2), 627-665. 650
lignin content (Leary and Zou 1994). Łojewska et al. (2007) found evidence recently that cellulose can become air-oxidized at elevated temperature while in the presence of humidity, giving rise to conjugated carbonyl species, which absorb blue light. The suggested mechanism helps to explain why even lignin-free paper can become yellowed during protracted storage.
Light-induced yellowing was much more significant in samples that contained an appreciable amount of lignin (Leary and Zou 1994). Stilbene functional groups in lignin are expected to be a major contributor to yellowing when paper is exposed to light (Gellerstedt 1996). In general, phenoxy radical intermediates created by the photo-degradation of lignin are oxidized to produce yellow chromophores (Heitner and Scaiano 1993). One way of inhibiting yellowing is by stabilizing phenoxy radicals using free radical “traps”. Chemical additives that possess hindered amine groups, such as nitroxides or their salts, have been shown to be particularly effective in this regard (McGarry et al. 1999). It has also been found that yellowing effects can be minimized, to some degree, by bleaching with hydrogen peroxide (Leary and Giampaolo 1999). Refining’s effects on optical properties As already noted when discussing the Kubelka-Munk equations, increased bonding between the fibers in paper can be expected to result in less scattering of light, and thus generally lower opacity and brightness. Refining can be defined as a process by which papermaking fibers are subjected to repeated compression and shearing forces, which tend to loosen the fibrils within the fibers from one another, making the fibers more flexible and conformable in their wet condition. It follows that paper’s density tends to increase with increasing refining, and that light scattering tends to decrease (Giertz 1966; Nordman et al. 1966; El-Hosseiny and Abson 1979). Ironically, refining may increase the degree surface area of the wet pulp, but upon drying the resulting paper sheet has less surface area per unit mass. Minerals and the filling of paper The subject of mineral fillers already was introduced as an example when describing how the dimensions of solid materials and voids in a piece of paper can be expected to affect the light scattering coefficient S of the sheet. In fact, the Kubelka-Munk equations can be used, at least as an approximation, to predict the types of levels of mineral products, such as calcium carbonate, kaolin, and titanium dioxide that will be needed to achieve different opacity specifications (Hemstock 1962; Hughes 1962; Kwoka 1990; Middleton et al. 1994). Considerable effort has been devoted to improving the optical performance of
various calcium carbonate filler products used in paper. In the case of ground calcium carbonate (GCC) products, higher opacifying ability can be achieved by fractionation of the mineral powder, such that the papermaker receives a narrower particle size distribution, more nearly corresponding to the optimum particle size for light scattering (Burri et al. 1997).
Substantially higher light scattering performance can be achieved if the size and shape of calcium carbonate particles is optimized by a precipitation process. Precipitated calcium carbonate (PCC) products usually are formed by first adding water to burnt lime

REVIEW ARTICLE ncsu.edu/bioresources
Hubbe et al. (2008). “Paper’s appearance: A review,” BioResources 3(2), 627-665. 651
(CaO) to form Ca(OH)2 (i.e., the “slaking” process), then adding pressurized CO2 to carbonize the Ca(OH)2 and form CaCO3. By controlling the conditions of temperature, pressure, reaction time, and other variables, it is possible to obtain a uniform suspension of rosette-shaped particles, which are technically called scalenohedral calcite. A high light scattering ability of the rosette particles (Gill and Scott 1987; Gill 1989) can be attributed to the relatively high surface area between CaCO3 and air, and also the ability of such particles to create air spaces within the paper product.
Potential disadvantages of using high-bulking mineral products, such as scalenohedral PCC, include major loss in inter-fiber bonding, as well as a tendency for more water to remain in the sheet after wet-pressing. Fairchild (1992) showed that both problems can be reduced, while still maintaining reasonably favorable optical effects, by the use of a different type of composite PCC particle, having a somewhat less bulky structure.
Another approach to minimize strength loss resulting from filler addition is by chemically modifying the surface of the filler particle so as to promote inter-fiber bonding. For example, Yoon and Deng (2006) showed that the use of starch-clay composites can allow the papermaker to achieve a high degree of filler loading, while preserving tensile strength. Yet another approach is through the in-situ precipitation of inorganic fillers onto cellulose fibers (Cousin and Mora 1998; Silenius 2000). In this method, pressurized CO2 is added directly to a slurry of Ca(OH)2 and papermaking fibers. As free calcium ions are generated during the reaction, microfibrils on the surface of the fibers create nucleation sites that promote the growth of calcium carbonate. The resulting fiber-filler complex has been shown to preserve stiffness at higher filler levels relative to conventional filler addition (Koukoulas et al. 2003). Titanium dioxide has a very high refractive index, compared to other commercially important mineral products used in paper. The rutile and anatase mineral forms of TiO2 have refractive index values of 2.7 and 2.55, respectively. Because TiO2 products tend to be relatively expensive, on a mass basis, a significant amount of attention has been given to maximizing their effectiveness. For instance, it has been proposed that high opacity levels might be achieved less expensively by coating less expensive silica particles with a thin layer of TiO2. Work by Johnson et al. (1997) showed just the opposite; it is necessary to use relatively pure TiO2 in order to achieve the most economical effect. Another surprising observation, when TiO2 is being used, is that increased refining sometimes can result in higher opacity (Alince 1987). The reason is that TiO2 is very sensitive to optical crowding. Refining increases the externally accessible surface area of fibers, providing more space for the pigment to become individually attached, rather than being grouped together. Bovin and Carnö (1977) showed that the optical efficiency of TiO2 can be increased still further by using aqueous conditions leading to more nearly ideal dispersion of the pigment particles over the fiber surfaces. Likewise, Kwoka and Logan (1994) showed that higher opacity gains often can be achieved by loading at least part of the TiO2 into the base-stock of coated paper, rather than putting all of it in the coating, where the amount of air interfaces is lower. Because TiO2 strongly absorbs ultraviolet light, caution is required when considering the use of TiO2 in systems where fluorescent whitening agents (FWAs) are also being used. Since the FWAs make use of the UV light energy to achieve their effect,

REVIEW ARTICLE ncsu.edu/bioresources
Hubbe et al. (2008). “Paper’s appearance: A review,” BioResources 3(2), 627-665. 652
they can become inefficient when combined in products with UV-absorbing materials. One strategy to minimize this problem, while still using TiO2 as a filler, involves adding at least a major portion of the FWA with starch solution at a size press of the paper machine. The idea is that the light can encounter the FWA molecules first, before passing through TiO2. A more common strategy is just to employ calcium carbonate, or other mineral filler products that do not absorb ultraviolet light to a significant extent. In addition to inorganic fillers and organic/inorganic composite fillers, a number of investigators have begun exploring the use of purely organic fillers (Saari et al. 2006; El-Tahlawy et al. 2007; Krogerus 1999; Bolivar et al. 2007). Major work in this area has been related to the creation of micrometer scale foam structures in starch materials. By manipulating the internal pore structure of the starch materials, the brightness can be raised from 75 % to 95 % without any chemical modifications. Work is still ongoing in this area and a number of technical challenges need to be overcome. However, Saari et al. (2006) have added starch acetate foams to paper to create sheets with superior strength properties when compared to papers filled with inorganic fillers (Penttilä et al. 2006). Mechanical Manipulation of Paper’s Components Even if the components to be used in manufacturing a paper product have been determined, the resulting appearance can depend on how the ingredients are assembled. Important factors include the ratio of the different ingredients, the forming process, the possibility of multi-ply forming, drying conditions, and calendering. In the discussion that follows, the reader should keep in mind that variations in paper structure greatly influence the overall appearance of paper and that these variations occur over a very wide range of scales: microscale (< 0.1 mm), small scale (0.1-40 mm), medium scale (40 mm - 10 m) and macroscale (> 10 m) (Norman and Söderberg 2001). Moreover, these variations can be directly related to the “mechanical history” of the fibers and the forces experienced by the papermaking slurry during the forming process. In this regard, the microscale structure is dominated by the morphology of the papermaking fibers, the type of fillers used, and the impact of micro flows and colloidal interactions within the papermaking slurry. Most of these structures are invisible to the naked eye. Small scale structures, which can be seen, are the result of the hydrodynamic forces experienced by the papermaking slurry during forming. Here, stock consistency, turbulence, headbox design, and other papermachine-related factors will influence both the hydrodynamic forces impacting the fibers and the structure of flocs. Medium scale features will arise from instabilities in headbox flow and forming section dewatering. Most of the actual appearance one interprets and refers to as “formation” is due to paper features and structures that are found at the small and medium scale. Lastly, the large macroscale variations, which are normally seen in the machine direction, can be attributed to pulsations in the incoming thick stock. These are generally too subtle to be observed by visual inspection alone. Blend optimization Regarding paper’s fibrous component, recent trends are favoring higher amounts of either higher-yield pulps or recycled fibers in many cases. High-yield fibers, such as thermomechanical pulps, tend to have higher light scattering coefficients than the

REVIEW ARTICLE ncsu.edu/bioresources
Hubbe et al. (2008). “Paper’s appearance: A review,” BioResources 3(2), 627-665. 653
bleached kraft fibers that they sometimes can partly replace (Mackie and Joyce 2000). De-inked stock also can be optimized by application of a Kubelka-Munk approach, though the presence of fluorescent whitening agents in such pulp can make it more difficult to predict the resulting optical properties (Praast and Göttsching 1996). The paper forming process As discussed above, the papermaking process can have a profound influence on paper’s appearance. For example, because of the ways in which paper is formed on different types of paper machines, it can have a somewhat different composition from one side to the other (Hansen 1951; Tanaka et al. 1982; Zeilinger and Klein 1995), and the outer surfaces of paper tend to be denser than paper’s interior (MacGregor 1983a,b; Szikla and Paulapuro 1989). The latter effect tends to be amplified due to application of starch at size presses; such starch partly penetrates the surface layers of the paper, filling in some of the void volume and making the surface layers denser and more translucent. A cursory observation of paper’s surface, even when using sophisticated microscopic methods or profilometry, can give the impression of a totally random arrangement of hills and valleys, as well as variations between higher and lower opacity. But a typical piece of machine-made paper also bears subtle repeating features, which are related to how it was formed against one or more fabric screens. In a method pioneered by I’Anson and Kropholler (1991), frames of a microscopic image of paper, taken with illumination at a grazing angle, are repeatedly superimposed on one another, with a slight offset. When the offset distance just matches that of the repeating pattern in the forming fabric, the “wire mark” becomes sharply apparent. At the same time, non-repeating features such as the effects of fiber flocs, tend to cancel each other out, when averaging the repeated images. Pressing The newly consolidated sheet may also develop surface structures or texture during wet pressing. These so-called “felt marks” are periodic, medium-scale surface features that can be difficult to detect. Until recently, the relationship between press felt design and pressing conditions, and their influence on felt marking remained elusive. However, Dowling et al. (2005) were able to map the pressure distribution in the press nip and directly measure the coefficient of pressure variation (COPV). They found, somewhat counter-intuitively, that higher press pressures reduce felt marking. This is observed because at higher press pressures the COPV is often lower. In general, marking will tend to increase with basis weight and the ratio of in-going to out-going moisture content. The authors also confirmed that old papermaking adage that “the surface is made at the last press”, meaning that visible marking is more likely to have been imparted at later press nips. Coating and multi-ply forming Papermakers often can achieve more effective use of their materials, relative to optical properties, by organizing those materials into layers. For example, papermakers often attempt to “leverage” their investment in high-brightness components by putting them near to the surface of their product. The validity of such approaches has been

REVIEW ARTICLE ncsu.edu/bioresources
Hubbe et al. (2008). “Paper’s appearance: A review,” BioResources 3(2), 627-665. 654
confirmed by means of Kubelka-Munk analyses (Borch and Scallan 1975; Bristow and Pauler 1986). A similar approach can be used to show the potential, as well as the limitations, of a strategy to “hide” ink specks within the interior ply of a paper or paperboard product (Walmsley et al. 1994). The rule of “putting bright materials toward the surface” is not necessarily the best strategy for maximizing opacity, however. Especially when TiO2 is being used to increase opacity, it can be advantageous to distribute the pigment relatively uniformly throughout the structure, minimizing optical crowding. Also, the TiO2 can be expected to have a larger effect if it is adjacent to air spaces, rather than being within a dense coating layer. Drying of paper Two key variables that can affect the resulting paper’s appearance during the drying process are the temperature and the applied tension (Giertz 1966). In the case of high-yield fibers the temperature of drying can affect the extent to which plastic flow takes place, especially within the lignin and hemicellulose phases (Poirier and Pikulik 1997; Juppi and Kaihovirta 2002). A higher temperature generally induces more plastic flow, resulting in somewhat decreased opacity, as the fibers conform more closely to each other. Tension that is applied during drying can affect to degree to which micro-compressions can form, due to shrinkage of fibers in their transverse and radial directions (Page and Tydeman 1962; Galley 1973). In other words, one can expect that applied tension during drying will have a subtle effect in reducing the relative bonded area within paper; a somewhat higher light scattering coefficient can be expected, as a consequence. Calendering of paper Calendering is a process by which paper passes between smooth rolls at high pressure. The resulting compaction and shearing action, in the presence of relatively high temperatures, tends to squash air-spaces out of the paper. As a consequence, brightness and opacity values tend to be decreased by calendering (Praast and Göttsching 1996). As mentioned earlier, the smoothing effect of calendering can achieve a wide range of gloss characteristics. Relatively high gloss levels of coated products are favored by fine pigment particle size, platy particles, such as fine clay, the use of plastic pigments capable of deforming when the paper passes through calender nips, and the use of binders that soften under the high-temperature and stress of calendering.
Soft calendering operations, in which paper passes between a hot steel roll and a roll covered by either a polymer or by paper, often can achieve smoothness increases with less densification of the paper, so that the resulting brightness and opacity do not decrease as much as in conventional calendering between steel rolls. In extended soft-nip calendering the dwell time between the paper surface and the hot steel roll is further increased to impart perhaps the greatest level of gloss uniformity to the paper surface (Endres and Engström 2005). The local stress concentrations in the calender nip are substantially reduced. As a result, smoothness of the paper surface can be obtained with little or no increase in the local variation of the surface properties (Wikström et al. 1997). In addition, the process can achieve high levels of gloss and surface uniformity without substantial densification of the sheet (Mohan et al. 2001).

REVIEW ARTICLE ncsu.edu/bioresources
Hubbe et al. (2008). “Paper’s appearance: A review,” BioResources 3(2), 627-665. 655
Chemical Changes and Additives Affecting Paper’s Appearance Coating Various issues tend to make it challenging to predict the appearance of coated paper products (Clark and Ramsay 1965). These issues include the roughness and porosity of the base sheet upon which the coating is applied. It can be difficult to predict the degree to which the coating materials penetrate into the base sheet, and such penetration is often uneven, due to differences in the local apparent density. Some of the base-sheet nonuniformity results from fiber flocs in the sheet. It is also difficult to predict the degree to which binders in the coating will migrate either into the base stock or towards the surface of the coating in the course of drying (Bushhouse 1992; Yamazaki et al. 1993; Pan et al. 1995). Finally, the calendering or supercalendering of coated paper products can be expected to change the light scattering coefficients of both the base stock and the coating layer, making it difficult to accurately apply the Kubelka-Munk equations. In order to compare coating formulations in isolation, without having to deal with the complexities of their interaction with a paper substrate, coating “drawdowns” can be prepared by spreading the aqueous formulation on a smooth surface of black glass (Trader 1971; Starr and Young 1975). The coating layer often is formed by using a wire-wound rod (Meyer rod) to spread the formulation. Such tests make it possible to compare the hiding ability of different coating layers, on a relative basis. Tests of this type have been used to demonstrate the importance of keeping the binder as low as feasible, as long as pick resistance requirements can be met. Also, it has been possible to find optimum particle sizes of minerals (Trader 1971). Dye addition and color control With the exception of fluorescent dyes, which are sometimes used to create paper products with glaring colors, papermaking dyes achieve their effects by means of subtracting some of the light that is diffusely reflected from paper. This concept is illustrated in Fig. 9. In this relatively simple example, a blue dye and a yellow dye are used together to produce a green coloration. The blue dye absorbs light very efficiently at wavelengths greater than about 600 nm, whereas the yellow dye absorbs light strongly in the blue region of the visible spectrum. As a consequence, the greatest emission of light can be expected at wavelengths near to 540 nm, corresponding to green light.
Because coloration of paper generally is achieved by subtraction of reflected light, papermakers operate under restraints imposed by the reflectance characteristics of the undyed furnish that they start with. Thus, the reflectance curve of the undyed furnish needs to be at least as high, throughout the visible range so that it is physically possible to achieve each color of paper that one wants to produce. Various strategies have been developed to achieve good retention of dyes onto fibers, overcoming issues related to poor affinity of some dyes. There is a need to balance ionic charges in the papermaking system, helping to keep water-soluble dye products from building up in the process water. Such practices can help to minimize color in the water discharged from the wastewater treatment system at a paper mill (Lips 1981).

REVIEW ARTICLE ncsu.edu/bioresources
Hubbe et al. (2008). “Paper’s appearance: A review,” BioResources 3(2), 627-665. 656
100%
400 500 600 700Wavelength (nm)
Ref
lect
ance
80%
60%
40%
20%
0%
Paper with just blue dye
Paper with just yellow dye
Undyed paper
Reflectance curve with some blue & yellow dyes
Fig. 9. Illustration of the concept of subtractive coloration when papermakers use a combination of yellow and blue dyes to reduce reflectance in the blue and red parts of the visible spectrum, resulting in a maximum reflectance in the green wavelengths Though it is possible to monitor and control paper’s color by using laboratory-based reflectance meters, as described near the beginning of this article, there has been a widespread adoption of online color-control equipment (Newton 1983). Online color measurements pose special challenges and require frequent calibration. Since online tests almost always involve a single sheet of paper, they do not even begin to approach the requirement of an “infinite stack” of paper sheets, as is called for in the definition of reflectivity (see Fig. 2). Thus, if there is any appreciable change in the opacity of a colored paper product, such a change can be expected to cause an apparent shift in the instrumental measure of the paper’s color (Lisnyansky and Hubbe 1991). A further problem arises due to the thermochromic nature of many of the dyes used in paper manufacturing; the absorbance characteristics of such dyes shift when the material is hot. Further errors can be caused by the buildup of dust on online monitoring equipment. Nevertheless, carefully calibrated online color equipment can significantly reduce the amount of off-shade product coming from a paper machine. Strategies to produce high-brightness grades Market competition related to white paper products can have a pernicious effect of inflating the expectations of customers. To compete in various high-brightness product categories, papermakers have a seemingly impossible task, to make their paper products yet brighter and whiter than they were able to achieve in earlier years. Usually the first step that paper technologists considers, when setting forth to maximize brightness or whiteness, is to bleach the kraft fibers to a very high level. In addition, very bright mineral products are used, such as precipitated calcium carbonate (Gill and Scott 1987). Fluorescent whitening agents are used at high levels, sometimes requiring the use of specialized fixing agents that can minimize the quenching of the desired fluorescent effect (Crouse and Snow 1981; Roltsch and Lloyd 1987). Alternatively, papermakers use relatively insoluble di-sulfonated, rather than the usual tetra-sulfonated whitening agents in order to improve their retention efficiency during the formation of paper.
REVIEW ARTICLE ncsu.edu/bioresources
Hubbe et al. (2008). “Paper’s appearance: A review,” BioResources 3(2), 627-665. 657
Contaminants and components of white water As described in a recent series of articles, components of the process water can affect the brightness and color of paper products (Hubbe 2007a-c). The fresh water, depending on how well it has been purified, can be a source of iron and manganese ions, as well as algae and humic acids, all of which tend to decrease brightness. Additional organic and inorganic substances, as well as bacterial slime can build up during the recirculation of white water. If there is a high level of recirculation of process water, various types of internal clarification or purification of water can be considered to remove bacteria, reduced the biological oxygen demand, and keep salts from reaching excessive levels.
Although the build-up of salts can be quite dramatic, especially when paper-making operations are carried out such that there is no liquid effluent (Pietschker 1996; Xu and Deng 2004), the effects of “water system closure” on paper’s optical properties are not necessarily significant. For instance, Dobbins and Alexander (1977) did not observe any changes in the appearance of paper made with 70% groundwood and 30% bleached kraft as salt was increased up to 20,000 ppm.
The effect of pH of the process water, however, can be significant. Poirier et al. (1996) documented a net brightness drop of 4 points as the pH was increased from 4 to 10 in the presence of various mechanical pulp furnishes. Such effects help remind papermakers that the chemical nature of cellulosic fibers should not be ignored, since it can affect paper’s final appearance. CLOSING COMMENTS The published work cited in this article has shown that paper’s optical properties can be understood based on scientific principles, such as light scattering and absorption. Even colored products can be interpreted by means of well-chosen equations that emulate what is happening in the human eye. Though there is only an inexact relationship between paper’s composition and its optical properties, the underlying science is well enough understood to provide technologists with a reliable platform to carry out product development.
On the other hand, papermakers face a challenge to simultaneously meet optical requirements, while still staying within a series of other constraints that define each paper product. A given sheet of paper must match not only the required brightness, opacity, and color, etc., but it also has to achieve the required strength, basis weight, apparent density, smoothness, and above all else, a minimization of costs. The challenges related to meeting paper’s optical requirements can be expected to demand further research in the years ahead. REFERENCES CITED Abadie, F. (1987). “Prolonged natural aging – Effect on the natural properties of a paper
made from mechanical pulp,” ATIP 41(9), 468, 493-498.

REVIEW ARTICLE ncsu.edu/bioresources
Hubbe et al. (2008). “Paper’s appearance: A review,” BioResources 3(2), 627-665. 658
Adrian, A. P. (1944). “New procedure for evaluating the opacifying properties of pigments,” Tech. Assoc. Papers 27, 465-471.
Alince, B. (1987). “The effect of fiber beating on TiO2 pigment performance,” Tappi J. 70 (10), 114-117.
Alince, B., and Lepoutre, P. (1980a). “Light-scattering of coatings formed from polystyrene pigment particles,” J. Colloid Interface Sci. 76(1), 182-187.
Alince, B., and Lepoutre, P. (1980b). “Porosity and optical properties of clay coatings,” J. Colloid Interface Sci. 76(2), 439-444.
Anon. (1991). “CMC: Calculation of small color differences for acceptability,” AATCC Technical Method 173-1990, in AATC Test Manual, Amer. Assoc. Textile Chemists Colorists, RTP, NC.
Bajpai, P. (2005). Environmentally Benign Approaches for Pulp Bleaching, Devel. Environ. Sci. Ser., Vol. 1, Elsevier, New York, 277 pp.
Batchelor, W., and He, J. (2005). “A new method for determining the relative bonded area,” Tappi J. 4(6), 23-28.
Bernie, J.-P., and Douglas, W. J. M. (1996). “Local grammage distribution and formation of paper by light transmission image analysis,” Tappi J. 79(1), 193-202.
Bernie, J.-P., Hurd, P., Sutton, P., and Douglas, W. J. M. (2000). “How the components of formation of fine paper affect printability for different printing processes,” Proc. TAPPI 2000 Technol. Summit, TAPPI Press, Atlanta, 1-15.
Bird, A. J. (1999). “Addressing the real issues for permanent papers, brightness reversion, and lignin-containing pulps,” Tappi J. 82(5), 159-164.
Bohman, J. S. (2005). “The appearance of ‘white’ papers,” Appita Journal 59(6), 446-451.
Bolivar, A. L., Venditti, R. A., Pawlak, J. J, et al. (2007). “Development and characterization of novel starch and alkyl ketene dimer microcellular foam particles,” Carbohydrate Polymers 69(2), 262-271.
Borch, J. (2002). “Optical and appearance properties,” in Handbook of Physical Testing of Paper, 2nd Ed., J. Borch, M. B. Lyne, R. E. Mark, and C. C. Haberger, Jr. (eds.), Vol. 1 (incorrect information on cover says “Vol. 2,” Ch. 4, 95-148.
Borch, J., and Scallan, A. M. (1975). “A comparison between the optical properties of coated and loaded paper sheets,” Tappi 58(2), 134-135.
Bovin, A., and Carnö, B. (1977). “Factors influencing efficiency of TiO2 in paper,” Svenk Papperstidn. 80(15), 483-486.
Bown, R. (1985). “The relationship between strength and light scattering coefficient for filled papers,” in Papermaking Raw Materials, V. Punton (ed.), Trans. 8th Fundamental Research Symp., Oxford, Mechanical Engineering Publications, Ltd., London, Vol. 2, 543-577.
Bown, R. (1998). “Particle size, shape, and structure of paper fillers and their effect on paper properties,” Paper Technol. 39(2), 44-48.
Brandon, C. E. (1981). “Properties of paper,” in Pulp and Paper Chemistry and Chemical Technology, Casey, J. P. (ed.), Third Ed., Wiley-Interscience, New York, Vol. 3, Ch. 21, 1715-1972.
Bristow, J. A. (1990). “Brightness and whiteness – Definition and measurement,” Adv. Print. Sci. Technol. 20, 193-217.

REVIEW ARTICLE ncsu.edu/bioresources
Hubbe et al. (2008). “Paper’s appearance: A review,” BioResources 3(2), 627-665. 659
Bristow, J. A. (1994). “The calibration of instruments for the measurement of paper whiteness,” Color Research and Application 19(6), 475-483.
Bristow, J. A. (1999). “ISO brightness – A more complete definition,” Tappi J. 82(10), 54-56.
Bristow, J. A., and Karipidis, C. (1999). “ISO brightness and fluorescent papers and indoor whiteness – Proposal for illuminant,” Tappi J. 82(1), 183-193.
Bristow, J. A., and Pauler, N. (1983). “Multi-layer structures in printing papers,” Svensk Papperstidning 86 (15), R164-R172.
Burri, P., Naydowski, C., Spielmann, D. C., and Swanson, E. T. (1997). “Using classical theory to design a pigment with improved optical properties,” Tappi J. 80(11), 193-199.
Bushhouse, S. G. (1992). “The effect of coating viscosity on surface latex concentration,” Tappi J. 75(3), 231-237.
Caruso, M. G. (1987). “Special instrument is required to measure optically whitened paper,” Pulp Paper 61(3), 132-135.
Chinga, G. (2004). “Detailed characterization of paper surface structure for gloss assessment,” J. Pulp Paper Sci. 30(8), 222-227.
Clark, H. B., and Ramsay, H. L. (1965). “Predicting optical properties of coated papers,” Tappi 48(11), 609-612.
Clarke, F. J. J., McDonald, R., and Rigg, B. (1984). “Modification of the JPC79 color-difference formula,” ISDC 100, 128-___.
Corscadden, K. W., and Parker, J. R. (1998). “A new approach to the analysis of formation,” Proc. Measurement and Control of Papermaking, Edinburgh, Pira International, Leatherhead, Surrey, UK, Paper 8.
Corte, H. (1976). “Perception of the optical properties of paper,” in The Fundamental Properties of Paper Related to its Uses, F. Bolam (ed.), British Paper and Board Industry Federation, London, 626-658.
Crouse, B. W., and Snow, G. H. (1981). “Fluorescent whitening agents in the paper industry,” Tappi 64(7), 87-89,
Cutshall, K. (1990). “The nature of paper variation,” Tappi J. 73(6), 81-90. Dobbins, R. J., and Alexander, S. D. (1977). “Physical and optical properties of paper
made at high salt concentrations,” Tappi J. 60(12), 121-124. El-Hosseiny, F., and Abson, D. (1979). “Light scattering and sheet density,” Tappi 62
(10), 127-129. Ellis, M. E. (1996). “Hydrosulfite (dithionite) bleaching,” in Dence, C. W., and Reeve, D.
W. (eds.) Pulp Bleaching, Principles and Practice, TAPPI Press, Atlanta, Sec. V., Ch. 2, 491-512.
El-Tahlawy, K., Venditti, R. A., and Pawlak, J. J. (2007). “Aspects of the preparation of starch microcelluar foam particles crosslinked with glutaraldehyde using a solvent exchange technique,” Carbohydrate Polymers 67(3), 319-331.
Engström, G. (1994). “Formation and consolidation of a coating layer and the effect on offset-print mottle,” Tappi J. 77(4), 160-172.
Ganz, E. (1979). “Whiteness formulas: A selection,” Applied Optics 18(7), 1073-1078. Ganz, E., and Greisser, R. (1981). “Whiteness: Assessment of tint,” Applied Optics 20(8),
1395-1396.
REVIEW ARTICLE ncsu.edu/bioresources
Hubbe et al. (2008). “Paper’s appearance: A review,” BioResources 3(2), 627-665. 660
Gate, L., Windle, W., and Hine, H. (1973). “The relationship between gloss and surface microtexture of coatings,” Tappi 56(3), 61-65.
Gellerstedt, G. (1996). “Chemical structure of pulp components,” in Dence, C. W., and Reeve, D. W. (eds.) Pulp Bleaching, Principles and Practice, TAPPI Press, Atlanta, Sec. III, Ch. 1, 93-111.
Giertz, H. W. (1966). "Some optical consequences of the consolidation of paper," in Consolidation of the Paper Web, F. Bolam (ed.), The British Paper and Board Industry Federation, London, 928-941.
Gigac, J. (1996). “Using optical methods in the assessment of pulp and paper,” Bulletin 32(2), 23 pp.
Gill, R. A. (1989). “The behavior of on-site synthesized precipitated calcium carbonates and other calcium carbonate fillers on paper properties,” Nordic Pulp Paper Res. J. 4(2), 120-127.
Gill, R., and Scott, W. (1987). “The relative effects of different calcium carbonate filler pigments on optical properties,” Tappi J. 70(1), 93-99.
Griesser, R. (1996). “CIE whiteness and tint: Possible improvements,” Wochenbl. Papierfabr. 124(19), 842-853.
Haddad, S. J. (1967). “Measurement of optical brightener in paper,” Tappi 50(12), 90A-91A.
Hansen, E. (1951). “The distribution of filler in paper,” Tappi 34(4), 180-185. Heikkilä, I. (1996). “Measurement of visual noise,” Ann. Report Lab Graphic Arts
Technol., Helsinki Univ. Technol., 38 Hemstock, G. A. (1962). “The effect of clays upon the optical properties of paper,” Tappi
45(2), 158A-159A. Hillend, W. J. (1966). “Opacity problems in printing papers: Kubelka-Munk theory gives
good, quick answers,” Tappi 49(7), 41A-47A. Howard, R. C., and Jowsey, C. J. (1989). “Effect of cationic starch on the tensile strength
of paper,” J. Pulp Paper Sci. 15(6), J225-229. Hua, X., Tanguy, P. A., Li, R., and van Wagner, J. S. (1996). “Effect of basestock
formation on paper coating,” Tappi J. 79(5), 112-115. Hubbe, M. A. (2007a). “Water and papermaking. 1. Fresh water components,” Paper
Technol. 48 (1), 18-24. Hubbe, M. A. (2007b). “Water and papermaking. 2. White water components,” Paper
Technol. 48(2), 31-40. Hubbe, M. A. (2007c). “Water and papermaking. 3. Measures to clean up process water,”
Paper Technol. 48(3), 23-30. Hughes, D. A. (1962). “Methods of obtaining the optical properties of papers containing
titanium dioxide and mixtures of titanium dioxide and other fillers,” Tappi 45(2), 159A-163A.
Hunter, D. (1947). Papermaking: The History and Technique of an Ancient Craft, 2nd Ed., Alfred Knopf, New York.
Hunter, R. S., and Harold, R. W. (1987). The Measurement of Appearance, 2nd Ed., Wiley, New York.
Jay, S. L., Jr. (1991). “Color control for the paper producer in the 90’s,” Proc. TAPPI 1991 Papermakers Conf., 93-99.
REVIEW ARTICLE ncsu.edu/bioresources
Hubbe et al. (2008). “Paper’s appearance: A review,” BioResources 3(2), 627-665. 661
Johnson, R. W., Thiele, E. S., and French, R. H. (1997). “Light scattering efficiency of white pigments: An analysis of model core-shell pigment vs. optimized rutile TiO2,” Tappi J. 80(11), 233-238.
Jordan, B. D. (1985). “Predicting the effect of formation on opacity and scattering coefficient,” J. Pulp Paper Sci. 11(2), J56-J59.
Jordan, B. (1996). “Brightness: Basic principles and measurement,” in Pulp Bleaching Principles and Practice, TAPPI Press, Atlanta, 695-716.
Jordan, B. D., and O’Neill, M. A. (1991). “The whiteness of paper – Colorimetry and visual ranking,” Tappi J. 74(5), 93-101.
Judd, D. B. (1938). “Optical specification of light scattering materials,” Tech. Assoc. Papers. 21, 474-481.
Juppi, K., and Kaihovirta, J. (2002). “The effect of the dryer section on paper quality,” 88th Annual Meeting - Technical Section, Canadian Pulp and Paper Association, Preprints, v B, p B23-B26.
Keller, D. S., Lewalle, J., and Luner, P. (1999). “Analysis of paper variability using the continuous wavelet transform,” Paperi Puu 81(6), 440-446.
Kibblewhite, R. P. (1973). “Effects of beating and wood quality on radiata pine kraft paper properties,” New Zealand J. Forestry Sci. 3(2), 220-239.
Koukoulas, A. A., and Jordan, B. D. (1994a). “Understanding gloss anisotropy in machine-made papers,” J. Pulp Paper Sci. 20(2), J55-J60.
Koukoulas, A. A., and Jordan, B. D. (1994b). “MD/CD reflectance anisotropy in machine-made papers observed with the 45/0 reflectance geometry,” J. Pulp Paper Sci. 20(3), J77-J82.
Koukoulas, A. A., and Jordan, B. D. (1997). “Effect of strong absorption on the Kubelka-Munk scattering coefficient,” J. Pulp Paper Sci. 23(5), J224-J231.
Kubelka, P., and Munk, F. (1931). “A contribution to the optics of colorant layers,” Z. tech. Physik 12 (11A), 593-601.
Kuehni, R. G. (1976). “Color-tolerance data and the tentative CIE 1976 L*a*b* formula,” J. Opt. Soc. Am. 66(5), 497-500.
Kuehni, R. G. (1987). “Progress in color-difference evaluation,” J. Coatings Technol. 59(748), 75-79.
Kuehni, R. G. (1990). “Industrial color differences: Progress and Problems,” Color Research and Application 15(5), 261-265.
Krogerus, B. (1999). “Modified starch pigments as paper additives,” Proc. Minerals in Papermaking – Scientific and Technological Advances in Fillers, Pira International, Leatherhead, Surrey, UK, Paper 14.
Krolopp, W. (1979). “Possibility of applying the Kubelka-Munk theory to quantitative study of light scattering and absorption within paper,” Przeglad Papierniczy 35(9), 327-330; (10), 359-363.
Kwoka, R. A. (1990). “Strategies for cost effective optical performance,” TAPPI 1990 Dyes, Fillers & Pigments Course Notes, TAPPI Press, Atlanta, 21-29.
Kwoka, R. A., and Logan, T. W. (1994). “Titanium dioxide performance comparison between coated paper basesheets and coatings,” Tappi J. 77(10), 136-144.
I’Anson, S. J., and Kropholler, H. W. (1991). “Enhancing visibility of wire-mark by image analysis,” J. Pulp Paper Sci. 17(1), J22-J26.

REVIEW ARTICLE ncsu.edu/bioresources
Hubbe et al. (2008). “Paper’s appearance: A review,” BioResources 3(2), 627-665. 662
Leary, G., and Giampaolo, D. (1999). “The darkening reactions of TMP and BTMP during alkaline peroxide bleaching,” J. Pulp Paper Sci. 25(4), 141-147.
Leary, G. J., and Zou, X. (1994). “Optical properties of lignin-containing papers as they related to paper permanence,” Proc. ASTM Inst. for Standards Res. Workship on the Effects of Aging on Printing and Writing Papers, July 6-8, Philadelphia, 86-101.
Leekley, R. M., Denzer, C. W., and Tyler, R. F. (1970). “Measurement of surface reflection from papers and prints,” Tappi 53(4), 615-621.
Leekley, R. M., and Tyler, R. F. (1975). “The measurement of optical unevenness,” Tappi 58(3), 124-127.
Leewenberg, L. (1998). “A new on-line formation sensor on the paper machine,” Proc. Measurement and Control of Papermaking, Edinburgh, Pira International, Leatherhead, Surrey, UK, Paper 20.
Leskelä, M. (1993). “Model for the optical properties of paper. (1). Theory,” Paperi Puu 75(9/10), 683-688.
Leskelä, M. (1994a). “A model for the optical properties of paper. Part 1. The theory,” Paperi Puu 75(8), 683-688
Leskelä, M. (1994b). “A model for the optical properties of paper. Part 2. The simulation model,” Paperi Puu 76(1-2), 67-73.
Leskelä, M. (1995). “Optical calculations for multilayer papers,” Tappi J. 78(10), 167-172.
Leskelä, M. (1998). “Optical properties,” in Niskanen, K., Paper Physics, Papermaking Sci. Technol. Ser. No. 16, Fapet Oy, Helsinki, Ch. 4, 117-137.
Lips, H. A. (1981). “Dyeing,” in Casey, J. P. (ed.), Pulp and Paper Chemistry and Chemical Technology, 3rd Ed., Vol. 3, Ch. 19, 1627-1666.
Lisnyansky, K., and Hubbe, M. A. (1991). “System for on-line measurement of color, opacity, and reflectance of translucent moving web,” U.S. Pat. 5,047,652.
Łojewska, J., Missori, M., Lubańska, A., Grimaldi, P., Zięba, K., Proniewica, L. M., and Congiu Castellano, A. (2007). “Carbonyl groups development on degraded cellulose. Correlation between spectroscopic and chemical results,” Appl.Phys. A 89, 883-887.
Luo, M. R., and Rigg, B. (1987a). “BFD (l:c) color-difference formula. Part 1. Development of the formula,” J. Soc. Dyers Colourists 103(2), 86-94.
Luo, M. R., and Rigg, B. (1987b). “BFD (l:c) color-difference formula. Part 2. Performance of the formula,” J. Soc. Dyers Colourists 103(3), 126-132.
MacAdam, D. L. (1955). “Color measurement and whiteness,” Tappi 38(2), 78-87. MacGregor, M. A. (1983). “A description of sheet stratification caused by wet pressing,”
Tappi J. 66(6), 53-57. MacGregor, M. A. (1983b). “Practical effects of sheet stratification caused by wet
pressing,” Tappi J. 66(7), 65-69. Mackie, D. M., and Joyce, P. (2000). “Effect of paper machine drying conditions on the
optical properties of paper containing mechanical pulp,” 86th Annual Meeting - Technical Section, Canadian Pulp Paper Assoc., Preprints, v B, p B195-B202.
Malthouse, D. D., and Popson, S. J. (1995). “A new way of measuring the effect of fluorescent whitening agents,” Appita 48(1), 56-58.
McDonald, R. (1990). “European practices and philosophy in industrial color-difference evaluation,” Color Research Application 15(6), 249-260.

REVIEW ARTICLE ncsu.edu/bioresources
Hubbe et al. (2008). “Paper’s appearance: A review,” BioResources 3(2), 627-665. 663
Middleton, S. R., Desmeules, J., and Scallan, A. M. (1994). “The Kubelka-Munk coefficients of fillers,” J. Pulp Paper Sci. 20(8), J231-J235.
Mie, G. (1908). “Contributions to the optical of diffuse media,” Ann. Phys. 25, 377-445. Minor, J. L., (1996), “Production of unbleached pulp,” in Dence, C. W., and Reeve, D.
W. (eds.) Pulp Bleaching, Principles and Practice, TAPPI Press, Atlanta, Sec. II, Ch. 1, 27-57.
Mosher, C. (1978). “Optical properties of paper. Calculated from single-sheet reflectance data Ro, R, and Rg,” Tappi 61(10), 123-125.
Newton, R. J. (1983). “Continuous dyeing: Theory and practice,” Paper Technol. Ind. 24(4), 140-144,
Nordman, L., Aaltonen, P., and Makkonen, T. (1966). “Relationship between mechanical and optical properties of paper affected by web consolidation,” in Consolidation of the Paper Web, F. Bolam (ed.), Brit. Paper Board Ind. Federation, London, 909-927.
Norman, B., and Söderberg, D. (2001). “Overview of forming literature: 1990-2000,” Transac. 12th Fundamental Res. Symp., 431-558.
Oittinen, P. (1993). “Characterization of paper as an information carrier,” in Products of Papermaking, C. F Baker (ed.), Pira International, Leatherhead, Surrey, UK, 311-349.
Olf, H. G. (1980). “Printing opacity as a function of basis weight,” Tappi 63(9), 149-150. Olf, H. G. (1989a). “Correspondence between the Kubelka-Munk and the Stokes model
or strongly light-scattering materials. Part 1. Theory,” Tappi J. 72(5), 222-227. Olf, H. G. (1989b). “Correspondence between the Kubelka-Munk and the Stokes model
or strongly light-scattering materials. Part 2. Implications,” Tappi J. 72(7), 159-163. Page, D. H. (1969). “A theory of the tensile strength of paper,” Tappi 52(4), 674-681. Page, D. H., and Tydeman, P. A. (1962). “A new theory of the shrinkage, structure and
properties of paper,” in Bolam, F. (ed.) Formation and Structure of Paper, Tech. Sec. British Paper and Board Makers’ Assoc., London, Vol. 1, 397-425.
Pan, S. X., Davis, H. T., and Scriven, L. E. (1995). “Modeling moisture distribution and binder migration in drying paper coatings,” Tappi J. 78(8), 127-143.
Parkes, D. (1989). “Instrumental methods for evaluating whiteness, brightness, and fluorescence,” Tappi J. 69(9), 95-100.
Pauler, N. (1986). “Opacity and reflectivity of multilayer structures,” in Paper Structure and Properties, J. A. Bristow and P. Kolseth (eds.), Marcel Dekker, Inc., New York, Ch. 10.
Pauler, N. (2002). Paper Optics, Lorentzen and Wettre, Corp. Communications Dept., Kista, Sweden.
Penttilä, A., Lumme, K., and Kuutti, L. (2006). “Light-scattering efficiency of starch acetate poigments as a function of size and packing density,” Appl. Optics 45(12), 3501-3509.
Pietschker, D. A. (1996). “The 100% closed water system – What to expect,” Proc. TAPPI 1996 Papermakers Conf., TAPPI Press, Atlanta, 521-528.
Poirier, N., and Pikulik, I. (1997). “Effect of drying temperature on the quality of paper,” Drying Technology 15(6-8), 1869-1879.
Poirer, N. A., Pikulik, I. I., Labadie, M., and Pageau, A. (1996). “Effect of pH on the optical properties of paper,” 82nd Annual Meeting Technical Sec. Canadian Pulp and Paper Association: Creating an Environment for the Future: Preprints A, A149-153.

REVIEW ARTICLE ncsu.edu/bioresources
Hubbe et al. (2008). “Paper’s appearance: A review,” BioResources 3(2), 627-665. 664
Popson, S. J., and Malthouse, D. D. (1996). Measurement and Control of the Optical Properties of Paper, 2nd Ed., Technidyne Corp.
Popson, S. J., Malthouse, D. D., and Robertson, P. C. (1997). “Applying brightness, whiteness and color measurements to color removal,” Tappi J. 80(9), 137-147.
Praast, H., and Göttsching, L. (1996). “Modeling the optical properties of paper of varied composition,” Das Papier 50(5), 221-232.
Presley, J. R., and Hill, R. T. (1996). “Peroxide bleaching of (chemi)mechanical pulps,” in Dence, C. W., and Reeve, D. W. (eds.) Pulp Bleaching, Principles and Practice, TAPPI Press, Atlanta, Sec. V., Ch. 1, 457-489.
Puebla, C., (1996). “Predicting whiteness from first principles: Further step toward developing a recipe for white paper,” Proc. 29o Contresso Annual de Celulose e Papel, Nov. 4-8, Sao Paulo, 629-636.
Ratto, P., and Rigdahl, M. (2001). “The influence of temperature on the compression behaviour of paper in the thickness direction,” Nordic Pulp Paper Res. J. 16(3), 178-182.
Robinson, J. V. (1975). “A summary of reflectance equations for application of the Kubelka-Munk theory of optical properties of paper,” Tappi 58 (10), 152-153.
Roltsch, C. C., and Lloyd, T. A. (1987). “The efficient use of fluorescent whitening agents in the paper industry,” Proc. TAPPI 1987 Papermakers Conf., TAPPI Press, Atlanta, 87-99.
Rundlof, M., and Bristow, J. A. (1997). “A note concerning the interaction between light scattering and light absorption in the application of the Kubelka-Munk equations,” J. Pulp Paper Sci. 23(5), J220-J223.
Saari, J., Kataja, K., Qvintus-Leino, P., Mikkonen, H., and Joyce, M. (2006). “Organic starch based pigments in paper coatings,” TAPPI Advanced Coating Fundamentals Symp., Turku, Finland, TAPPI Press, Atlanta, 21-31.
Scallan, A. M. (1985). “An alternative approach to the Kubelka-Munk theory,” J. Pulp Paper Sci. 11(3), J80-J84.
Scallan, A. M., and Borch, J. (1972). “An interpretation of paper reflectance based upon morphology. 1. Initial considerations,” Tappi 55(4), 583-588.
Scallan, A. M., and Borch, J. (1976). “Fundamental parameters affecting the opacity and brightness of uncoated paper,” in The Fundamental Properties of Paper Related to its Uses, F. Bolam (ed.), British Paper and Board Industry Federation, London, 152-163.
Schmidt, G. (1976). Optical Properties of Paper, Verlag Dr. Martin Saendig GbmH. (D-6229 Walluf 1/Wiesbaden, Germany), 160 pp.
Scott, W. E., Abbot, J. C., and Trosset, S. (1995). Properties of Paper: Introduction, TAPPI Press, Atlanta, 191 pp.
Scott, W. E., Dearth, L. R., and Jordan, B. D. (1992). “Optical properties of paper,” in Pulp and Paper Manufacture, Vol. 9, Mill Control and Control Systems: Quality and Testing, Environmental, Corrosion, Electrical,” Thorp, B. A., and Kocurk, M. J. (eds.), Ch. 6, 152-191.
Starr, R. E., and Young, R. H. (1975). “An improvement in the determination of R∞ and scattering coefficients for paper, pigments, and coatings,” Tappi 58 (5), 74-78.

REVIEW ARTICLE ncsu.edu/bioresources
Hubbe et al. (2008). “Paper’s appearance: A review,” BioResources 3(2), 627-665. 665
Steele, F. A. (1935). “The optical characteristics of paper. 1. The mathematical relationships between basis weight, reflectance, contrast ratio, and other optical properties,” Paper Trade J. 100(12), 37-42.
Stenius, Å. S., (1951). “The application of the Kubelka-Munk theory to the diffuse reflection of light from paper. I and II. A critical study,” Svensk Papperstidn. 54(19), 663-709.
Stokes, G. G. (1862). “On the intensity of the light reflected from or transmitted through a pile of plates,” Proc. Royal Soc. (London) 11, 454-556.
Sturm, S., and Chen, S.-C. (2005). “Advances in color measurement and control of high-white shades,” Proc. TAPPI 2005 Practical Papermaking Conf., TAPPI Press, Atlanta, 61-81.
Swanson, J. W., and Steber, A. J. (1959). “Fiber surface area and bonded area,” Tappi 42(12), 986-994.
Szikla, Z., and Paulapuro, H. (1989). “Changes in Z-direction density distribution of paper in wet pressing,” J. Pulp Paper Sci. 15(1), J11-J17.
Tanaka, H., Luner, P., and Coté, W. (1982). “How retention aids change the distribution of filler in paper,” Tappi 65(4), 95-99.
TAPPI (1998). “Optical measurement terminology related to appearance evaluation of paper,” TAPPI Method T 1213 so-98.
Trader, C. D. (1971). “Laboratory studies relating coating structure and coating performance,” Tappi 54(10), 1709-1713.
Van den Akker, J. A. (1949). “Scattering and absorption of light in paper and other diffusing media,” Tappi 32 (11), 498-501.
Van den Akker, J. A. (1965a). “Standard brightness, color, and spectrophotometry with emphasis on recent information,” Tappi 48(12), 57A-62A.
Van de Akker, J. A. (1965b). “Discussion,” in Bolem, F. (ed.), Consolidation of the Paper Web, Trans. Symp. Cambridge, Tech. Section British Paper and Board Makers’ Assoc., London, 948-950.
Van den Akker, J. A. (1982). “Optical properties of paper,” in The Structure and Physical Properties of Paper, H. F. Rance (ed.), Elsevier, Amsterdam, 127-174.
Walmsley, M. R. W., Chapman, J. B., and Silveri, L. (1994). “Predicting brightness levels of multilayered sheets containing ink-specked wastepaper in the center ply,” Proc. 48th Appita Ann. Gen. Conf., Carlton, Australia, 571-578.
Wyszecki, G., and Stiles, W. S. (2000). Color Science, 2nd Ed., Wiley-Interscience, New York.
Xu, Y., and Deng, Y. (2004). “The buildup of dissolved solids in closed white water systems,” Tappi J. 3(8), 17-21 (2004).
Yamazaki, K., Nishioka, T., Hattori, Y., and Fujita, K. (1993). “Print mottle effect of binder migration and latex film formation during coating consolidation,” Tappi J. 76(5), 79-84.
Yoon, S. Y., and Deng, Y. (2006). “Clay-starch composites and their application in papermaking,” J. Appl. Polymer Sci. 100, 1032-1038.
Zeilinger, M., and Klein, M. (1995). “Modern measurement methods for determining the filler distribution of paper in its thickness direction,” Wochenbl. Papierfabr. 123(20), 903-910.