biostatistics collaboration center basic biostatistics in medical research: emerging trends...
TRANSCRIPT

Biostatistics Collaboration Centerhttp://www.feinberg.northwestern.edu/sites/bcc/
Basic Biostatistics in Medical Research: Emerging Trends
November 14, 2013Leah J. Welty, PhD
Biostatistics Collaboration Center

http://www.newyorker.com/reporting/2010/12/13/101213fa_fact_lehrer

From The Economist

Emerging Trends in Biostatistics
Power:What is it?How do you compute it?Are we having a “power failure”?
Reproducible research:How did it start?What it is?Why practice it?

Why is power important?
• Most granting agencies now require some sort of justification of sample size.
• A study with too much power will usually be costly, and will occasionally claim “significant” results that are not clinically relevant.
• A study that lacks power will not be “significant” – even if results are clinically meaningful. There is a known publication bias against studies with negative findings.
Slide credit: Dr. Mary Kwasny

Fundamental point
• [Studies] should have sufficient statistical power (usually 80%) to detect (clinically meaningful) differences between groups.
• To be assured of this without compromising levels of significance, a sample size calculation should be considered early in the planning stages.
Friedman LM, Furberg CD, and DeMets DL. Fundamentals of Clinical Trials, 4th Edition. New York: Springer-Verlag, 2010.
Slide credit: Dr. Mary Kwasny
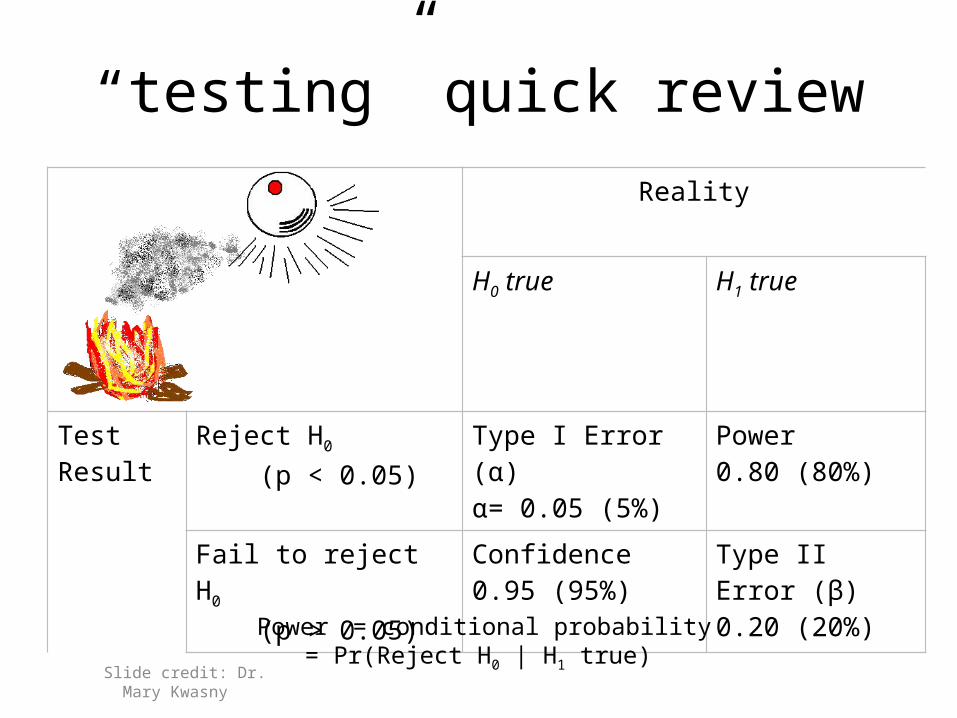
“testing” quick reviewReality
H0 true H1 true
Test Result Reject H0 (p < 0.05)
Type I Error (α)α= 0.05 (5%)
Power0.80 (80%)
Fail to reject H0 (p > 0.05)
Confidence0.95 (95%)
Type II Error (β)0.20 (20%)
Power = conditional probability= Pr(Reject H0 | H1 true)
Slide credit: Dr. Mary Kwasny
8
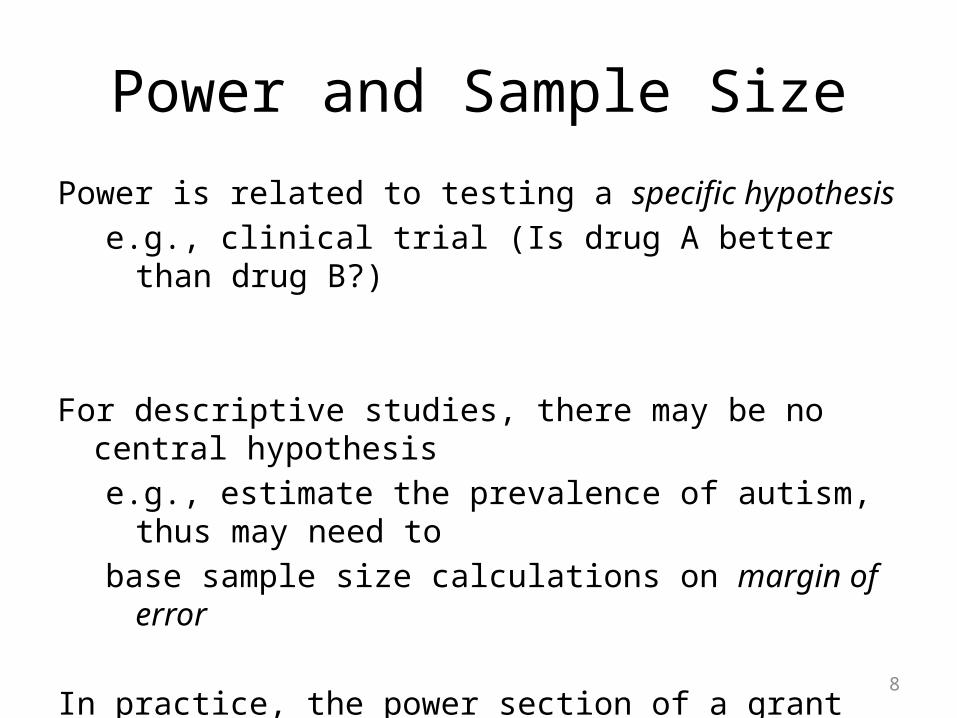
Power and Sample Size
Power is related to testing a specific hypothesise.g., clinical trial (Is drug A better than drug B?)
For descriptive studies, there may be no central hypothesis e.g., estimate the prevalence of autism, thus may need tobase sample size calculations on margin of error
In practice, the power section of a grant is typically some combination of both.
9
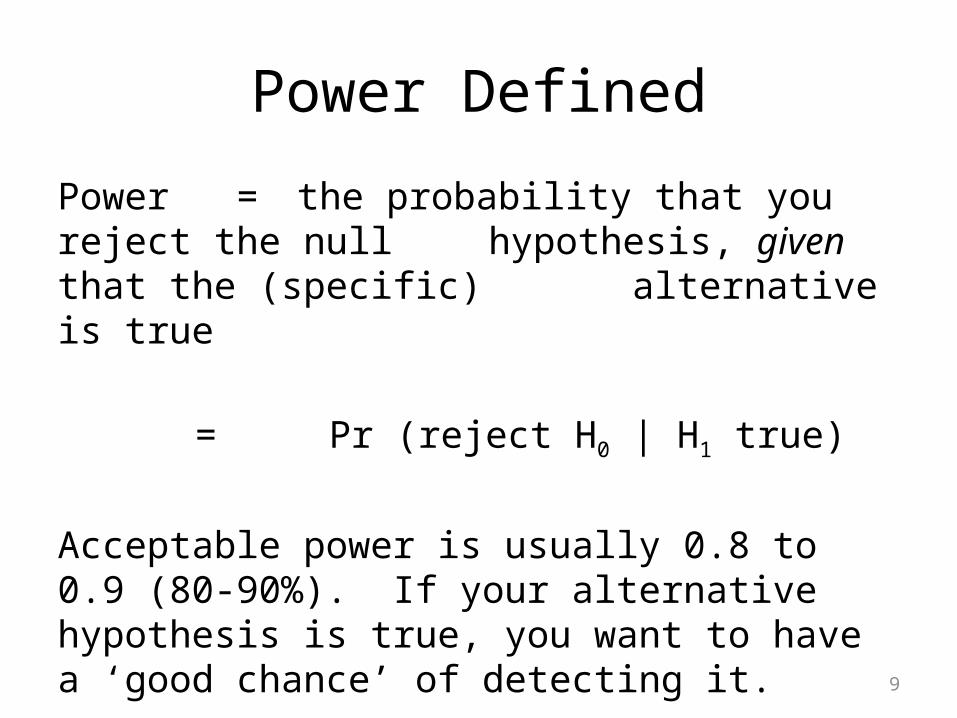
Power Defined
Power = the probability that you reject the null hypothesis, given that the (specific) alternative is true
= Pr (reject H0 | H1 true)
Acceptable power is usually 0.8 to 0.9 (80-90%). If your alternative hypothesis is true, you want to have a ‘good chance’ of detecting it.

Note• Power is vague (conditional on what, exactly?)• In defining a “reality” we have either no effect
(the null) or some effect (the alternative)• This is OK, but makes the investigator decide
some specific alternative under which to estimate power.
Slide credit: Dr. Mary Kwasny

11
What you need for power/sample size
1. Null hypothesis and (a specific) alternative hypothesis
2. The appropriate statistical method to test the null hypothesis
3. Effect size, or variability
4. Level of statistical significance (usually α = 0.05; this should be decided before starting a study)
5. EITHER power or sample size (solve for the other)
12
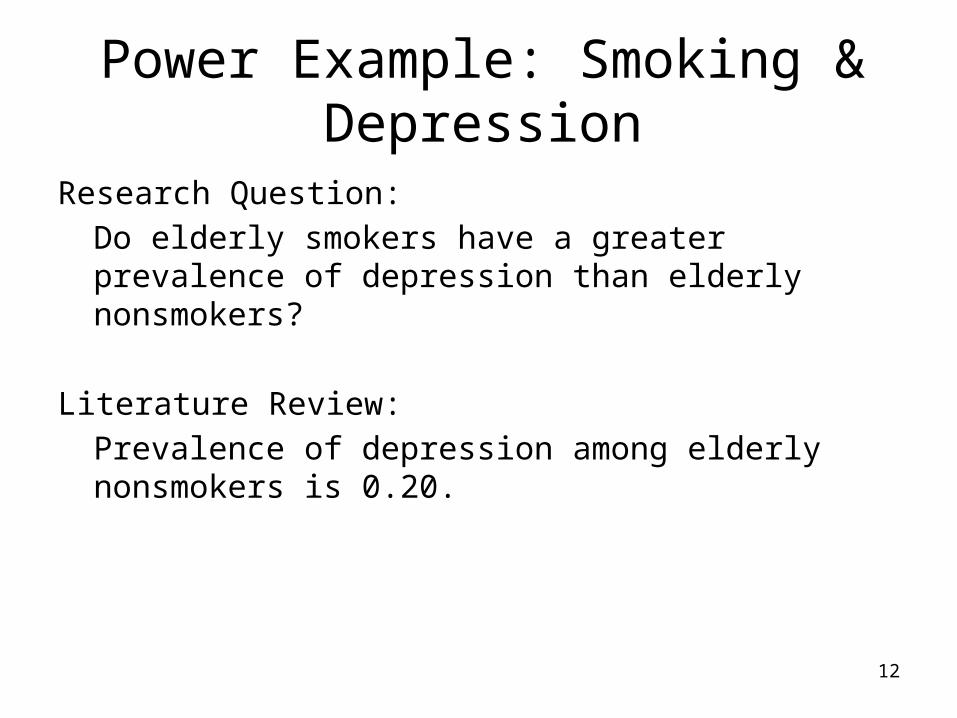
Power Example: Smoking & Depression
Research Question:
Do elderly smokers have a greater prevalence of depression than elderly nonsmokers?
Literature Review:
Prevalence of depression among elderly nonsmokers is 0.20.

13
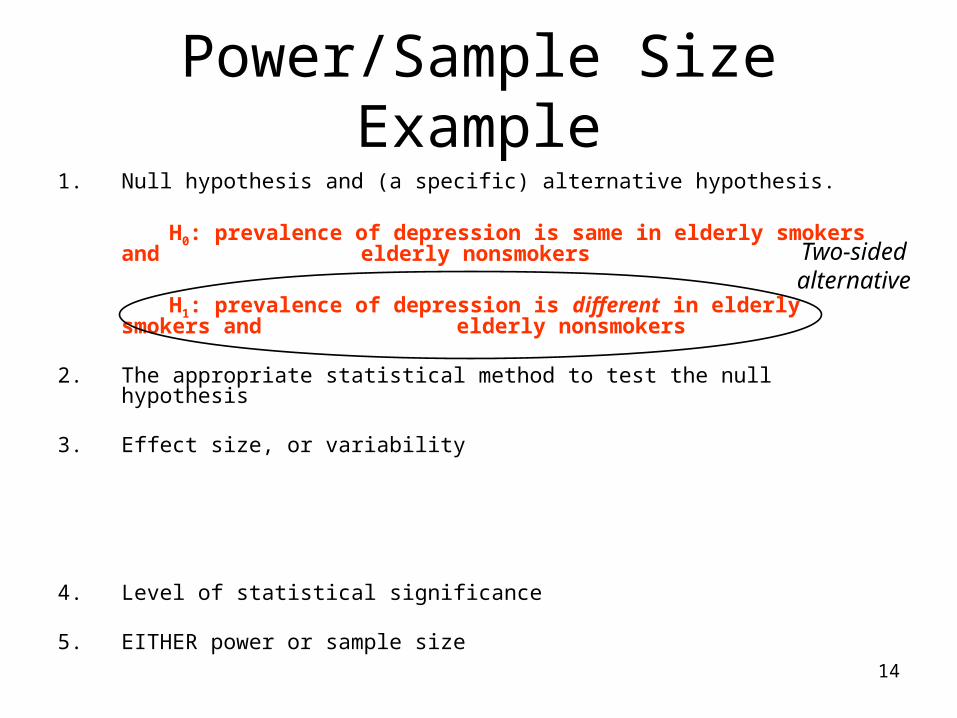
Power/Sample Size Example1. Null hypothesis and (a specific) alternative hypothesis.
H0: prevalence of depression is same in elderly smokers and elderly nonsmokers
H1: prevalence of depression is different in elderly smokers and elderly nonsmokers
2. The appropriate statistical method to test the null hypothesis
3. Effect size, or variability
prevalence among elderly nonsmokers = 0.2prevalence among elderly smokers = 0.3
4. Level of statistical significance α = 0.05
5. EITHER power or sample size 80% power (1 – power = β = 20%)
14
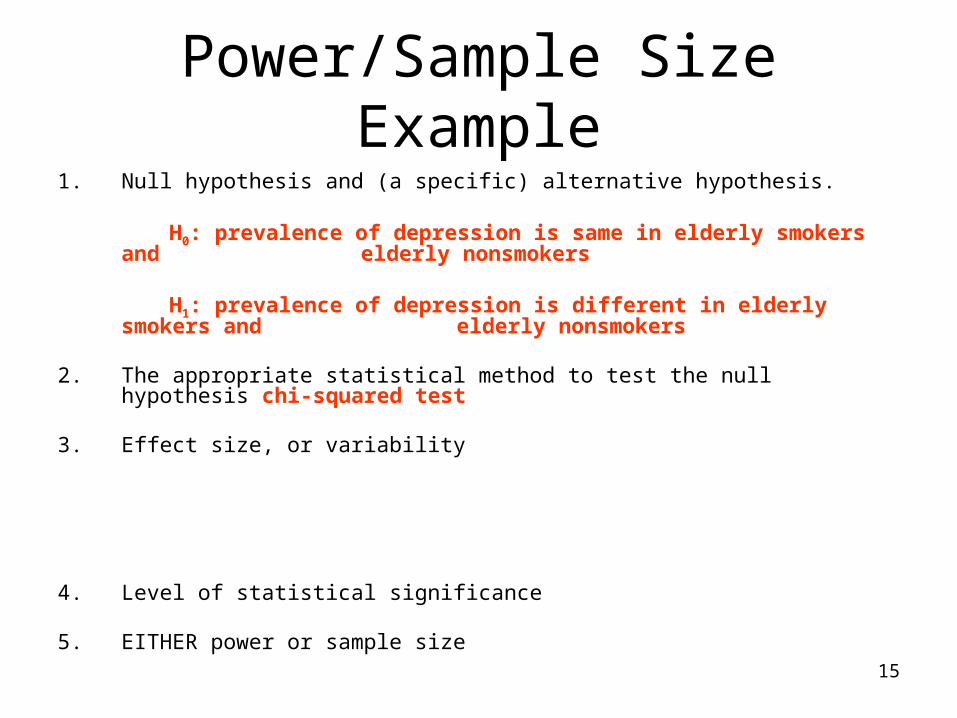
Power/Sample Size Example1. Null hypothesis and (a specific) alternative hypothesis.
H0: prevalence of depression is same in elderly smokers and elderly nonsmokers
H1: prevalence of depression is different in elderly smokers and elderly nonsmokers
2. The appropriate statistical method to test the null hypothesis chi-squared test
3. Effect size, or variability
prevalence among elderly non-smokers = 0.2prevalence among elderly smokers = 0.3
4. Level of statistical significance α = 0.05
5. EITHER power or sample size 80% power (1 – power = β = 20%)
Two-sided alternative
15
Power/Sample Size Example1. Null hypothesis and (a specific) alternative hypothesis.
H0: prevalence of depression is same in elderly smokers and elderly nonsmokers
H1: prevalence of depression is different in elderly smokers and elderly nonsmokers
2. The appropriate statistical method to test the null hypothesis chi-squared test
3. Effect size, or variability
prevalence among elderly non-smokers = 0.2prevalence among elderly smokers = 0.3
4. Level of statistical significance α = 0.05
5. EITHER power or sample size 80% power (1 – power = β = 20%)

16
Power/Sample Size Example1. Null hypothesis and (a specific) alternative hypothesis.
H0: prevalence of depression is same in elderly smokers and elderly nonsmokers
H1: prevalence of depression is different in elderly smokers and elderly nonsmokers
2. The appropriate statistical method to test the null hypothesis chi-squared test
3. Effect size, or variability
prevalence among elderly non-smokers = 0.2prevalence among elderly smokers = 0.3
4. Level of statistical significance α = 0.05
5. EITHER power or sample size 80% power (1 – power = β = 20%)
Talk to your friendly neighborhood
statistician

17
Power/Sample Size Example1. Null hypothesis and (a specific) alternative hypothesis.
H0: prevalence of depression is same in elderly smokers and elderly nonsmokers
H1: prevalence of depression is different in elderly smokers and elderly nonsmokers
2. The appropriate statistical method to test the null hypothesis chi-squared test
3. Effect size, or variability
prevalence among elderly non-smokers = 0.2prevalence among elderly smokers = 0.3
4. Level of statistical significance α = 0.05
5. EITHER power or sample size 80% power (1 – power = β = 20%)
18
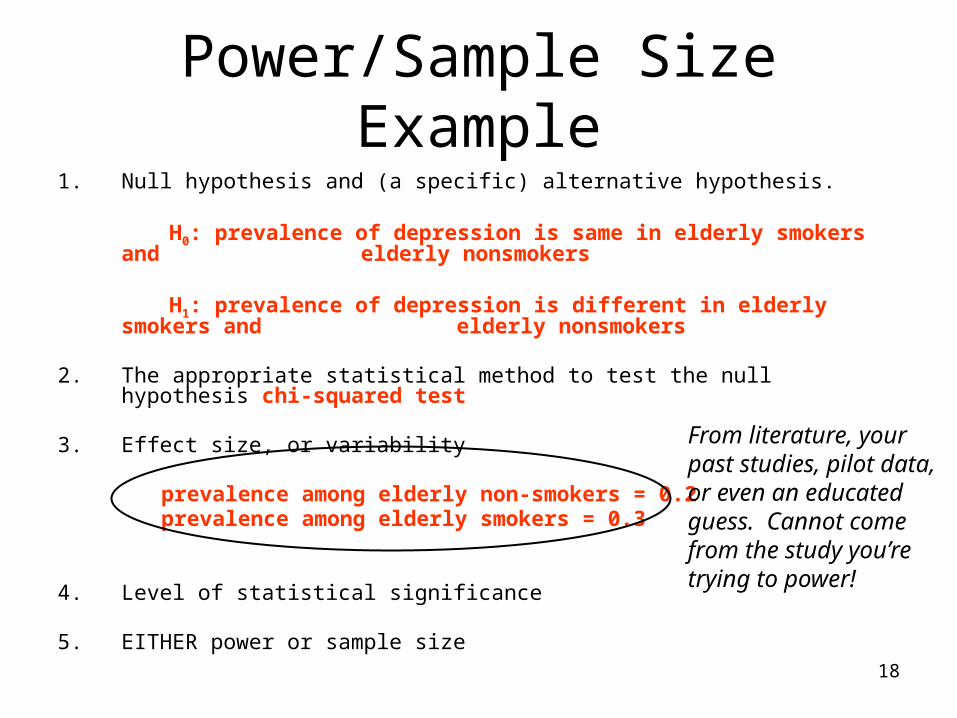
Power/Sample Size Example1. Null hypothesis and (a specific) alternative hypothesis.
H0: prevalence of depression is same in elderly smokers and elderly nonsmokers
H1: prevalence of depression is different in elderly smokers and elderly nonsmokers
2. The appropriate statistical method to test the null hypothesis chi-squared test
3. Effect size, or variability
prevalence among elderly non-smokers = 0.2prevalence among elderly smokers = 0.3
4. Level of statistical significance α = 0.05
5. EITHER power or sample size 80% power (1 – power = β = 20%)
From literature, your past studies, pilot data, or even an educated guess. Cannot come from the study you’re trying to power!
19
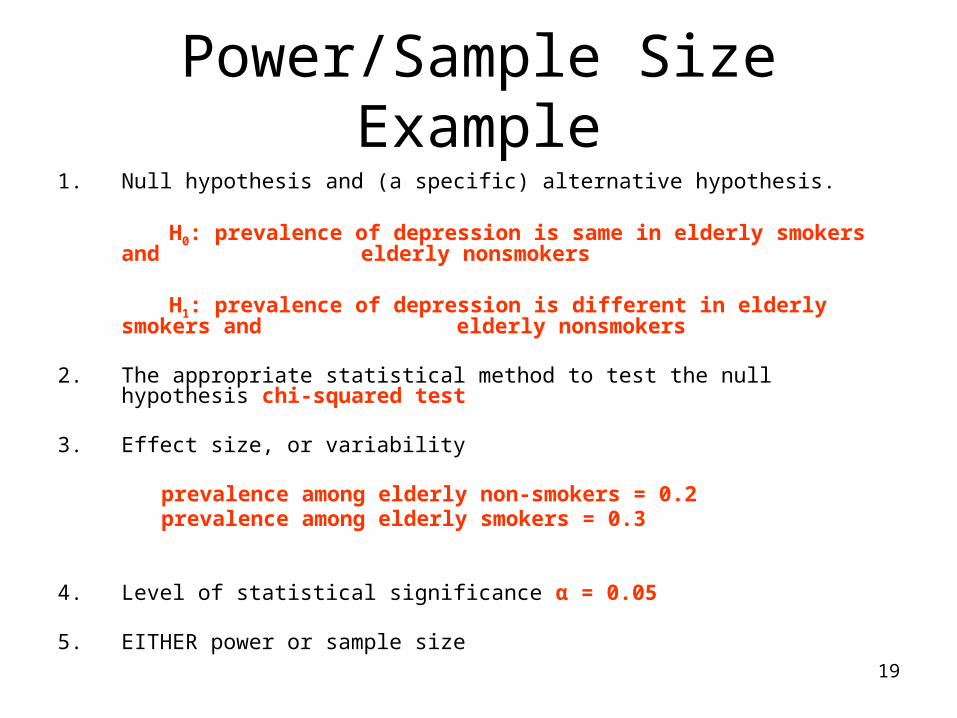
Power/Sample Size Example1. Null hypothesis and (a specific) alternative hypothesis.
H0: prevalence of depression is same in elderly smokers and elderly nonsmokers
H1: prevalence of depression is different in elderly smokers and elderly nonsmokers
2. The appropriate statistical method to test the null hypothesis chi-squared test
3. Effect size, or variability
prevalence among elderly non-smokers = 0.2prevalence among elderly smokers = 0.3
4. Level of statistical significance α = 0.05
5. EITHER power or sample size 80% power (1 – power = β = 20%)
20
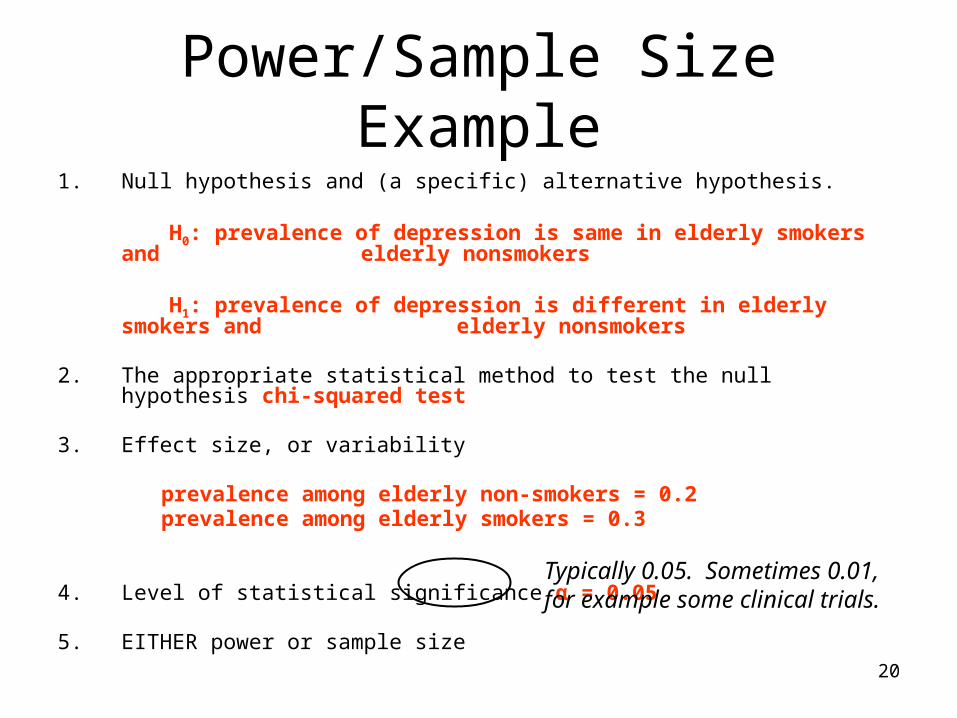
Power/Sample Size Example1. Null hypothesis and (a specific) alternative hypothesis.
H0: prevalence of depression is same in elderly smokers and elderly nonsmokers
H1: prevalence of depression is different in elderly smokers and elderly nonsmokers
2. The appropriate statistical method to test the null hypothesis chi-squared test
3. Effect size, or variability
prevalence among elderly non-smokers = 0.2prevalence among elderly smokers = 0.3
4. Level of statistical significance α = 0.05
5. EITHER power or sample size 80% power (1 – power = β = 20%)
Typically 0.05. Sometimes 0.01, for example some clinical trials.

21
Power/Sample Size Example1. Null hypothesis and (a specific) alternative hypothesis.
H0: prevalence of depression is same in elderly smokers and elderly nonsmokers
H1: prevalence of depression is different in elderly smokers and elderly nonsmokers
2. The appropriate statistical method to test the null hypothesis chi-squared test
3. Effect size, or variability
prevalence among elderly non-smokers = 0.2prevalence among elderly smokers = 0.3
4. Level of statistical significance α = 0.05
5. EITHER power or sample size 80% power (1 – power = β = 20%)

22
Power/Sample Size Example1. Null hypothesis and (a specific) alternative hypothesis.
H0: prevalence of depression is same in elderly smokers and elderly nonsmokers
H1: prevalence of depression is different in elderly smokers and elderly nonsmokers
2. The appropriate statistical method to test the null hypothesis chi-squared test
3. Effect size, or variability
prevalence among elderly non-smokers = 0.2prevalence among elderly smokers = 0.3
4. Level of statistical significance α = 0.05
5. EITHER power or sample size 80% power (1 – power = β = 20%)
Usually 80% or 90%.
23
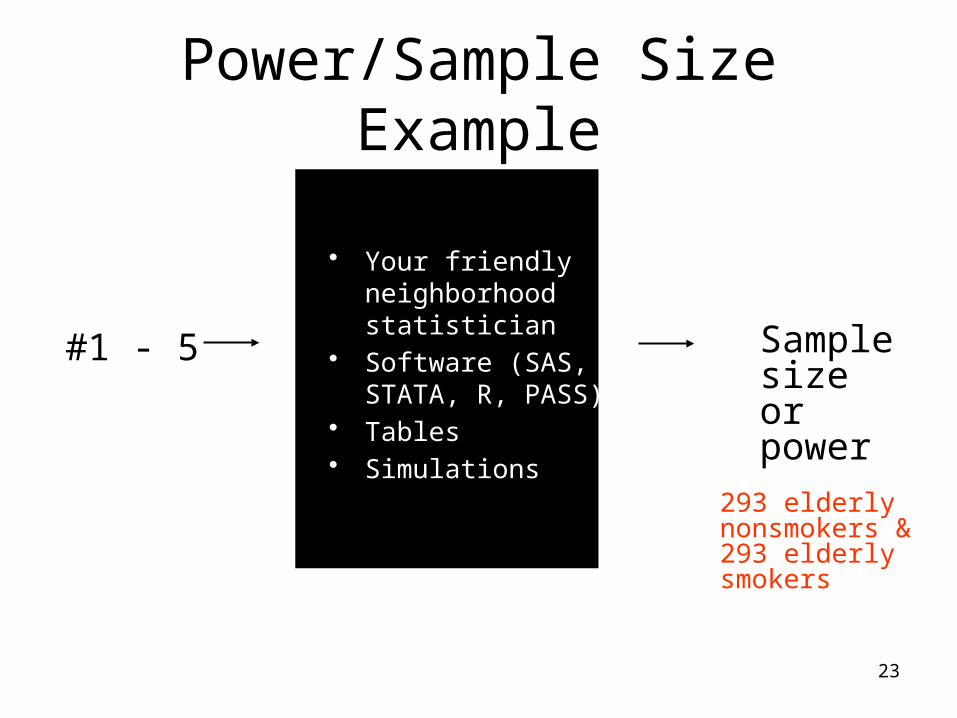
Power/Sample Size Example
• Your friendly neighborhood statistician
• Software (SAS, STATA, R, PASS)
• Tables • Simulations
#1 - 5 Sample size or power
293 elderly nonsmokers & 293 elderly smokers
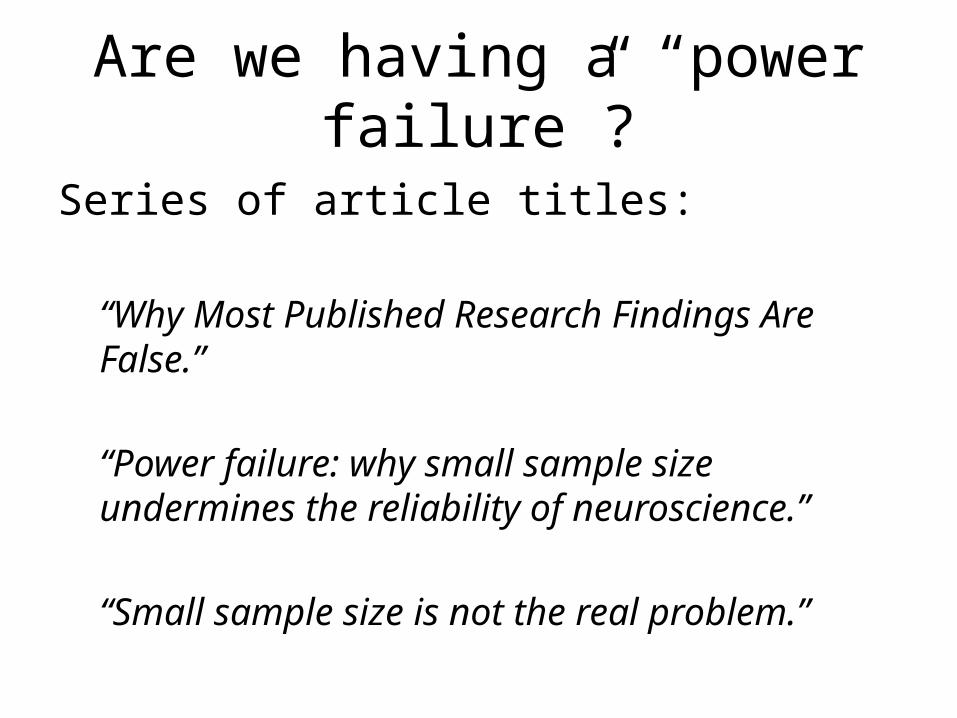
Are we having a “power failure”?
Series of article titles:
“Why Most Published Research Findings Are False.”
“Power failure: why small sample size undermines the reliability of neuroscience.”
“Small sample size is not the real problem.”
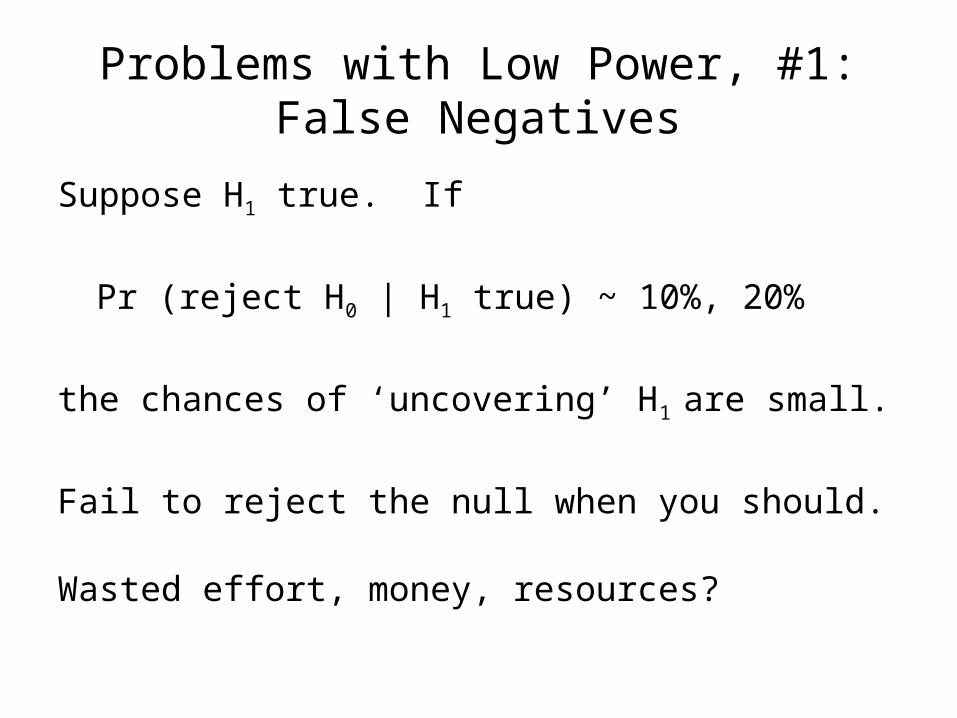
Problems with Low Power, #1:False Negatives
Suppose H1 true. If
Pr (reject H0 | H1 true) ~ 10%, 20%
the chances of ‘uncovering’ H1 are small.
Fail to reject the null when you should.
Wasted effort, money, resources?
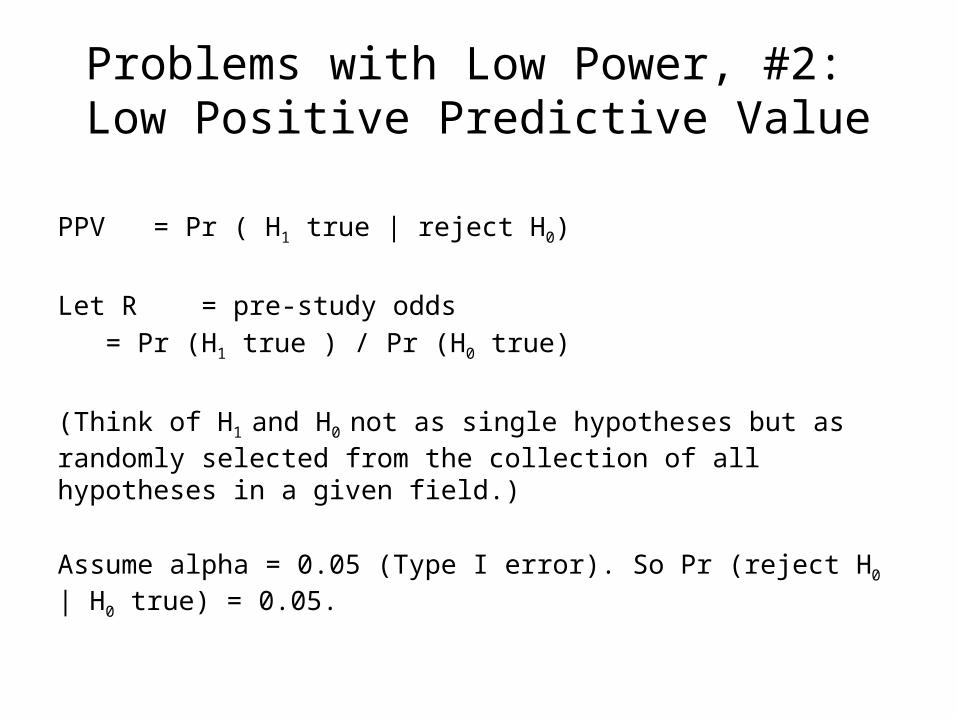
Problems with Low Power, #2: Low Positive Predictive Value
PPV = Pr ( H1 true | reject H0)
Let R = pre-study odds = Pr (H1 true ) / Pr (H0 true)
(Think of H1 and H0 not as single hypotheses but as randomly selected from the collection of all hypotheses in a given field.)
Assume alpha = 0.05 (Type I error). So Pr (reject H0 | H0 true) = 0.05.
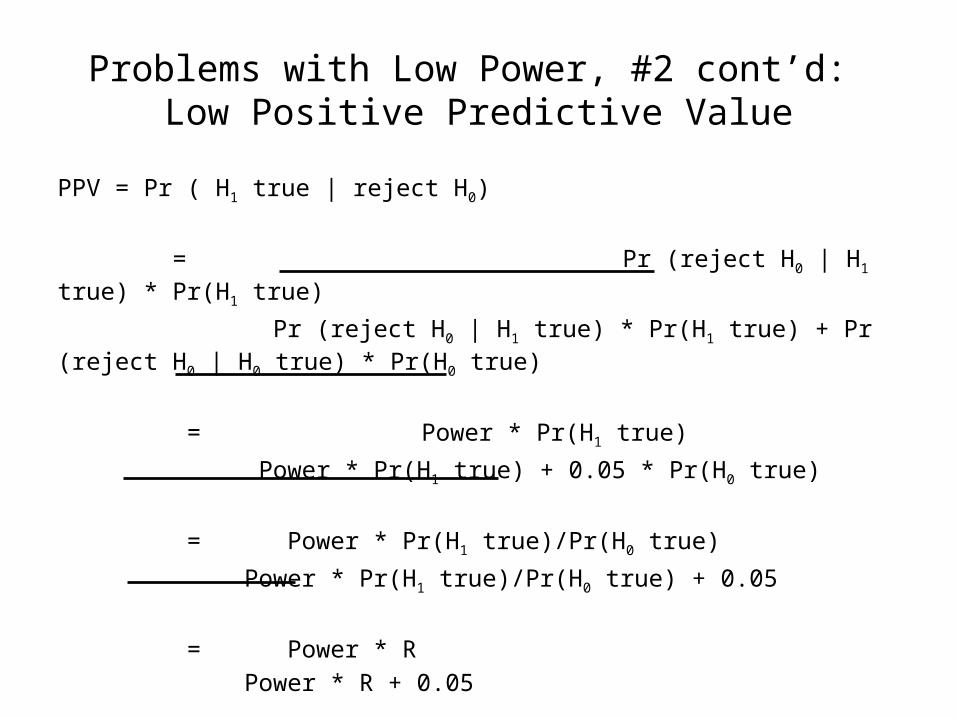
Problems with Low Power, #2 cont’d: Low Positive Predictive Value
PPV = Pr ( H1 true | reject H0)
= Pr (reject H0 | H1 true) * Pr(H1 true)
Pr (reject H0 | H1 true) * Pr(H1 true) + Pr (reject H0 | H0 true) * Pr(H0 true)
= Power * Pr(H1 true)
Power * Pr(H1 true) + 0.05 * Pr(H0 true)
= Power * Pr(H1 true)/Pr(H0 true)
Power * Pr(H1 true)/Pr(H0 true) + 0.05
= Power * R Power * R + 0.05
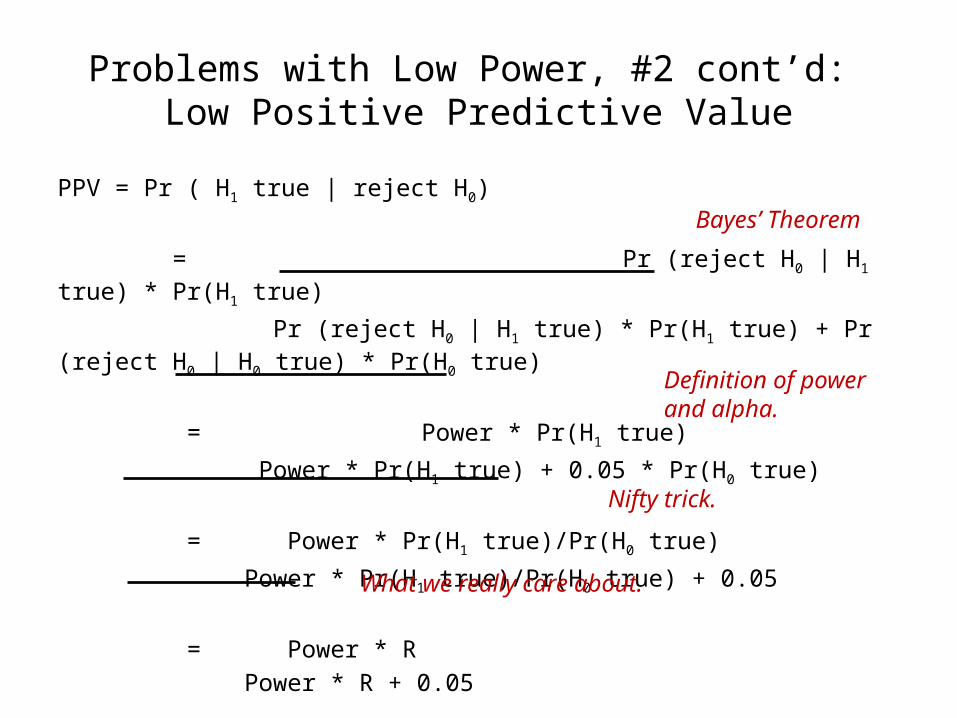
Bayes’ Theorem
Definition of power and alpha.
Nifty trick.
What we really care about.
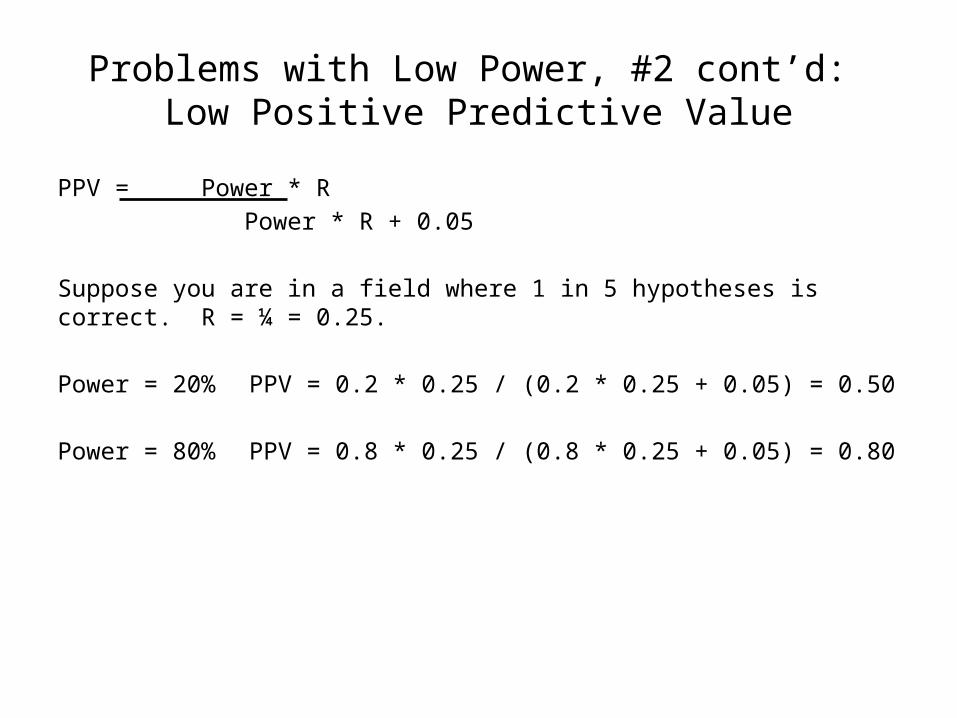
Problems with Low Power, #2 cont’d: Low Positive Predictive Value
PPV = Power * R Power * R + 0.05
Suppose you are in a field where 1 in 5 hypotheses is correct. R = ¼ = 0.25.
Power = 20% PPV = 0.2 * 0.25 / (0.2 * 0.25 + 0.05) = 0.50
Power = 80% PPV = 0.8 * 0.25 / (0.8 * 0.25 + 0.05) = 0.80

Problems with Low Power, #3:Winner’s Curse
If you conduct a low powered study, but you (correctly) reject H0, it is likely that your estimated effect is actually larger than the true effect.
Called “effect inflation.”

Is it really a power failure?We have an extraordinary problem with selective reporting and publication bias.
We may also (sub)consciously manipulate the design, analysis, and interpretation of studies.
There is an over-reliance on p-values:
Preferable to look at confidence intervals.
Winner’s Curse is also a problem of selection, and even occurs in adequately powered studies. Think about regression to the mean.
Power calculations are more nuanced than this discussion: selection of ‘true’ H1, 80% is arbitrary, results in studies are rarely yes/no.
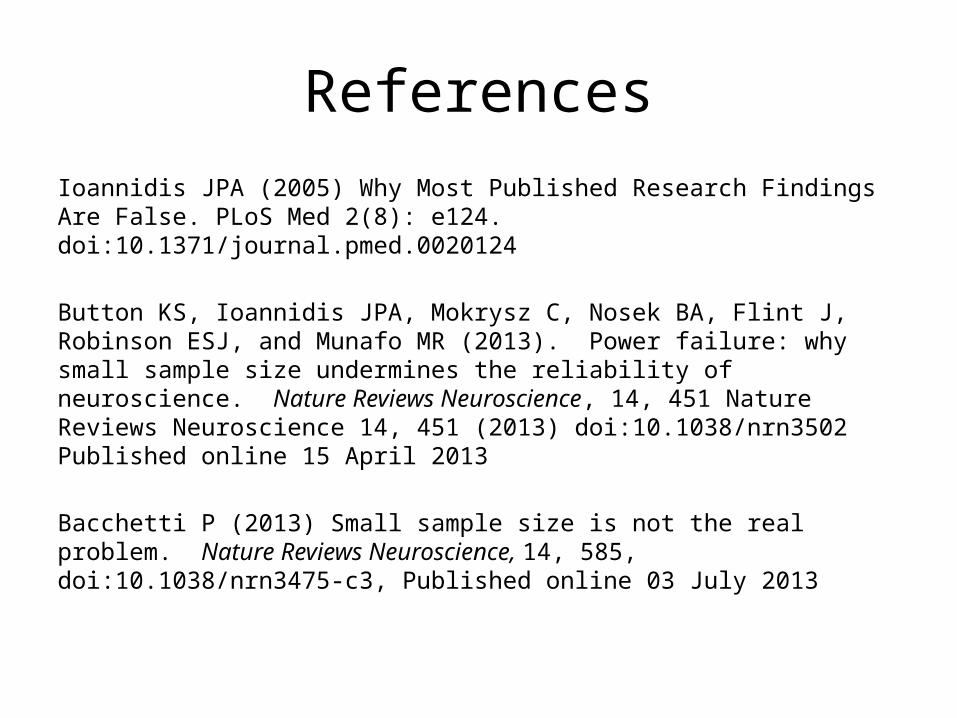
ReferencesIoannidis JPA (2005) Why Most Published Research Findings Are False. PLoS Med 2(8): e124. doi:10.1371/journal.pmed.0020124
Button KS, Ioannidis JPA, Mokrysz C, Nosek BA, Flint J, Robinson ESJ, and Munafo MR (2013). Power failure: why small sample size undermines the reliability of neuroscience. Nature Reviews Neuroscience, 14, 451 Nature Reviews Neuroscience 14, 451 (2013) doi:10.1038/nrn3502 Published online 15 April 2013
Bacchetti P (2013) Small sample size is not the real problem. Nature Reviews Neuroscience, 14, 585, doi:10.1038/nrn3475-c3, Published online 03 July 2013

Reproducible Research(McClelland, Elkington, Teplin, & Abram, 2004)
(Teplin, Welty, Abram, Dulcan, & Washburn, 2012)
(Cottle, Lee, & Heilbrun, 2001; McReynolds, Schwalbe, & Wasserman, 2010; Stoolmiller & Blechman, 2005)
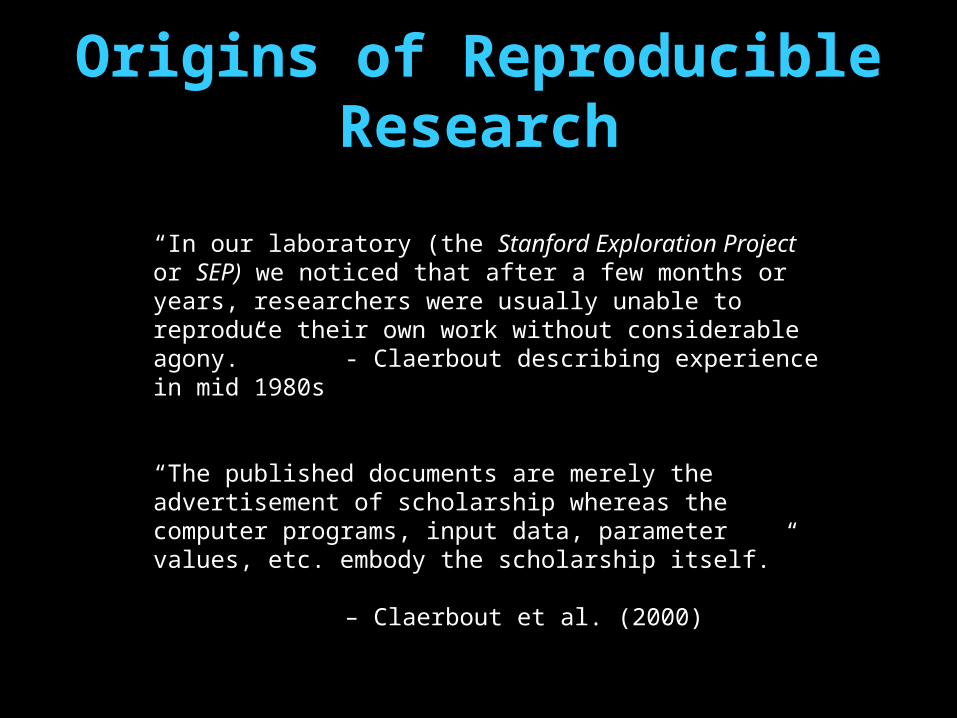
Origins of Reproducible Research
(McClelland, Elkington, Teplin, & Abram, 2004)
(Teplin, Welty, Abram, Dulcan, & Washburn, 2012)
(Cottle, Lee, & Heilbrun, 2001; McReynolds, Schwalbe, & Wasserman, 2010; Stoolmiller & Blechman, 2005)
“In our laboratory (the Stanford Exploration Project or SEP) we noticed that after a few months or years, researchers were usually unable to reproduce their own work without considerable agony.”
- Claerbout describing experience in mid 1980s
“The published documents are merely the advertisement of scholarship whereas the computer programs, input data, parameter values, etc. embody the scholarship itself.”
– Claerbout et al. (2000)
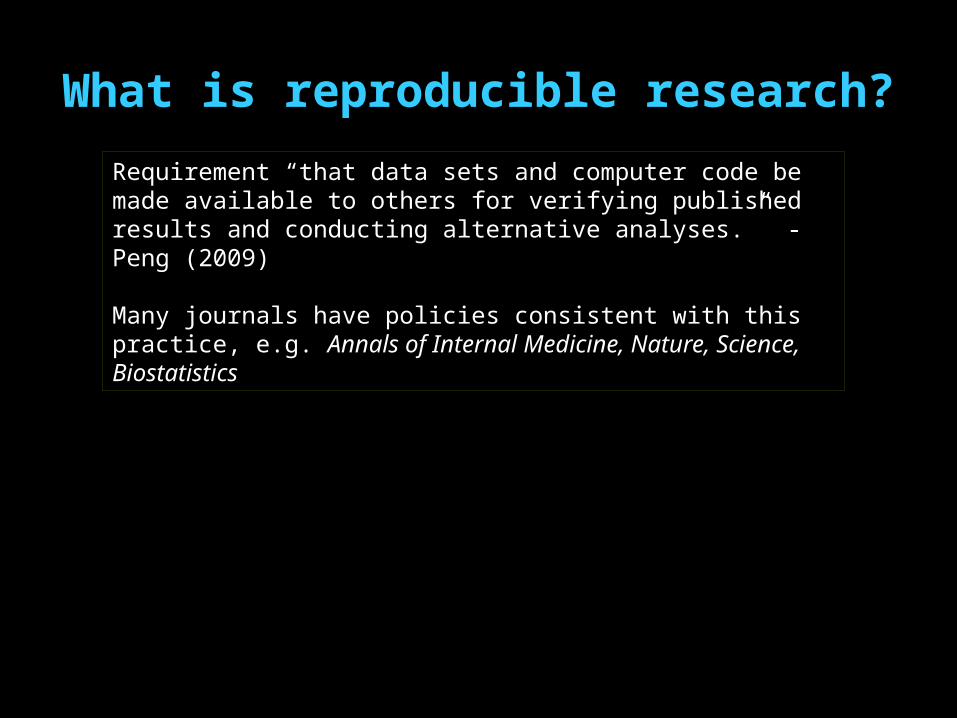
What is reproducible research?
(Cottle, Lee, & Heilbrun, 2001; McReynolds, Schwalbe, & Wasserman, 2010; Stoolmiller & Blechman, 2005)
Requirement “that data sets and computer code be made available to others for verifying published results and conducting alternative analyses.” - Peng (2009)
Many journals have policies consistent with this practice, e.g. Annals of Internal Medicine, Nature, Science, Biostatistics

What is reproducible research?
(Cottle, Lee, & Heilbrun, 2001; McReynolds, Schwalbe, & Wasserman, 2010; Stoolmiller & Blechman, 2005)
Requirement “that data sets and computer code be made available to others for verifying published results and conducting alternative analyses.” - Peng (2009); also Buckheit & Donoho (1995)
Many journals have policies consistent with this practice, e.g. Biostatistics, Annals of Internal Medicine, Nature, Science
‘Electronic lab notebook’ containing final product as well as research workflow process
The final product (dynamic document) AND archive of what other approaches were pursued and
abandoned, as well as research decisions along the way. - Nolan (2010)
This is a work in progress for medical research!

Reproducible vs Replicable Research
(Cottle, Lee, & Heilbrun, 2001; McReynolds, Schwalbe, & Wasserman, 2010; Stoolmiller & Blechman, 2005)
Reproducible:
Start with the same “raw” data. Repeat cleaning, manipulation, analyses, and end up with all the same exact results (parameter estimates, numbers in tables, and figures).
Test: Give someone else your “raw” data, programs, and methods section of the manuscript. Would they be able to reproduce your findings?
From Nature:. . . we will more systematically ensure that key methodological details are reported, and we will give more space to methods sections. We will examine statistics more closely and encourage authors to be transparent, for example by including their raw data.
Replicable:
Duplicate general findings in different environment, i.e. in a different lab, research group, or slightly different experimental conditions.
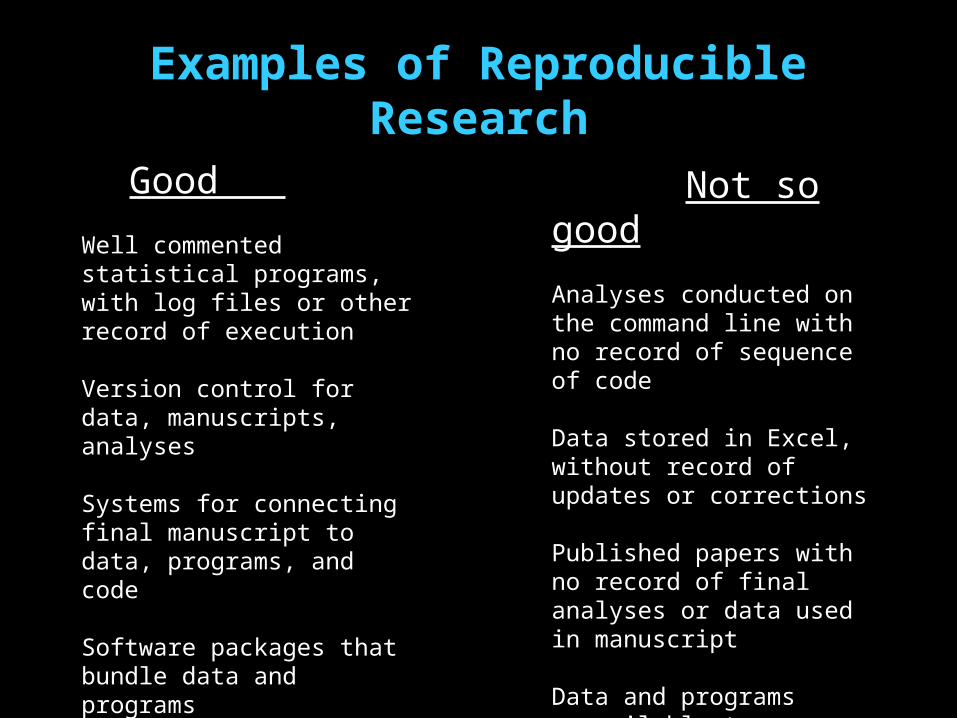
Examples of Reproducible Research
(Teplin, Welty, Abram, Dulcan, & Washburn, 2012)
(Cottle, Lee, & Heilbrun, 2001; McReynolds, Schwalbe, & Wasserman, 2010; Stoolmiller & Blechman, 2005)
Good
Well commented statistical programs, with log files or other record of execution
Version control for data, manuscripts, analyses
Systems for connecting final manuscript to data, programs, and code
Software packages that bundle data and programs
Not so good
Analyses conducted on the command line with no record of sequence of code
Data stored in Excel, without record of updates or corrections
Published papers with no record of final analyses or data used in manuscript
Data and programs unavailable to investigator, reviewers, or colleagues for replication or review

Problems with MS Excel
(Teplin, Welty, Abram, Dulcan, & Washburn, 2012)
(Cottle, Lee, & Heilbrun, 2001; McReynolds, Schwalbe, & Wasserman, 2010; Stoolmiller & Blechman, 2005)
Using Excel or (other interactive approaches) for data capture, manipulation or analysis results in little or no documentation of data provenance or analysis!
“The most simple problems are common.” When using Excel, it is especially easy to make off-by-one errors (e.g. accidentally deleting a cell in one column), or mixing up group labels (e.g. swapping sensitive/resistant).
-Baggerly and Coombes (2009)
Do you have an Excel disaster story?

Alternatives to Excel for Data Capture
(Teplin, Welty, Abram, Dulcan, & Washburn, 2012)
(Cottle, Lee, & Heilbrun, 2001; McReynolds, Schwalbe, & Wasserman, 2010; Stoolmiller & Blechman, 2005)
REDCap (Research Electronic Data Capture)
REDCap is a secure web application “designed exclusively to support data capture for research studies.” http://project-redcap.org/
Northwestern is part of the REDCap consortium. REDCap is free!
REDCap features:
• Rapid set-up• Web-based data collection• Data Validation• Export to statistical programs• Supports HIPAA compliance

Alternatives to Excel for Data Analysis
(Teplin, Welty, Abram, Dulcan, & Washburn, 2012)
(Cottle, Lee, & Heilbrun, 2001; McReynolds, Schwalbe, & Wasserman, 2010; Stoolmiller & Blechman, 2005)
Statistical Programs: SAS, Stata, R, SPSS
Should keep a record of any and all manipulations to the data. If you have to correct an error in the data, write it in your code! All your analyses should exist as a set of programming commands, or at least a copy of the execution of commands.
e.g. “log” files in Stata

Alternatives to Excel for Data Analysis
(Teplin, Welty, Abram, Dulcan, & Washburn, 2012)
“R” is freely available, open-source statistical software. It is one of the main (if not main) programs in use by statisticians.
It has many add-on ‘packages’ for analyzing particular types of data.Very popular for genomics, bioinformatics.
See http://cran.us.r-project.org/
R may not be quite as user friendly as Stata or SPSS, but it’s getting better.
RStudio is helping – it’s a nice environment for working with R.

Why strive for reproducible research?
(McClelland, Elkington, Teplin, & Abram, 2004)
(Teplin, Welty, Abram, Dulcan, & Washburn, 2012)
Reproducible research is becoming part of ethical statistical and scientific practice.
After the start-up cost, actually makes life a LOT easier.
Not conducting reproducible research may have serious consequences.
Damage to career and professional reputationRetraction of scientific papersLoss of public confidence in medical researchHarm to patients
Why strive for reproducible research?
(McClelland, Elkington, Teplin, & Abram, 2004)
(Teplin, Welty, Abram, Dulcan, & Washburn, 2012)
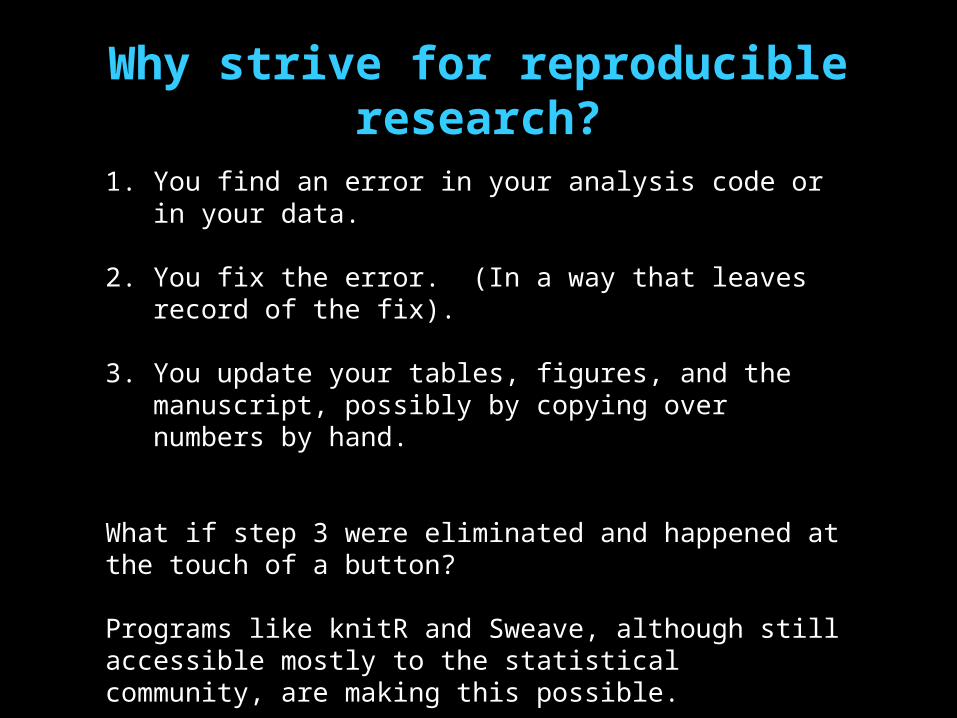
1. You find an error in your analysis code or in your data.
2. You fix the error. (In a way that leaves record of the fix).
3. You update your tables, figures, and the manuscript, possibly by copying over numbers by hand.
What if step 3 were eliminated and happened at the touch of a button?
Programs like knitR and Sweave, although still accessible mostly to the statistical community, are making this possible.

The future of reproducible research in collaborative medical environment?
E.g. GenePattern-Word RRS system, developed in collaboration with Microsoft ResearchJill Mesirov (2010)
Reproducible Research System (RSS)
Reproducible Research Environment (RRE)Computational toolsTrack data, analysesPackage results (tables, figures)
Reproducible Research Publisher (RRP)Document preparation systemEasy link to RRE

References and Links
(McClelland, Elkington, Teplin, & Abram, 2004)
(Teplin, Welty, Abram, Dulcan, & Washburn, 2012)
(Cottle, Lee, & Heilbrun, 2001; McReynolds, Schwalbe, & Wasserman, 2010; Stoolmiller & Blechman, 2005)
Series of articles in Nature:http://www.nature.com/news/announcement-reducing-our-irreproducibility-1.12852
“Simply Statistics” blog has many excellent posts, references, and discussions of many topics, including reproducibility: http://simplystatistics.org/?s=reproducibility
Keith A. Baggerly and Kevin R. Coombes. Deriving chemosensitivity from cell lines: Forensic bioinformatics and reproducible research in high-throughput biology, Ann. Appl. Stat. Volume 3, Number 4 (2009), 1309-1334.
More technical references:
Deborah Nolan, Roger D. Peng, and Duncan Temple Lang. “Enhanced Dynamic Documents for Reproducible Research” (2010) Biomedical Informatics for Cancer Research, pp. 335-345
Jill P. Mesirov. “Accessible Reproducible Research” (2010) Science, pp. 415-416Matthias Schwab, Martin Karrenback, and Jon Claerbout “Making scientific computations reproducible” (2000) Computing in Science and Engineering, 2, pp. 61 – 67.
Friedrich Leisch. Sweave: Dynamic generation of statistical reports using literate data analysis. In Wolfgang Härdle and Bernd Rönz, editors, Compstat 2002 – Proceedings in Computational Statistics, pp. 575 – 580. Physica Verlag, Heidelberg, 2002.
Russell Lenth and Soren Hojsgaard, “SASweave: Literate Programming Using SAS” (2007) Journal of Statistical Software, 19, 8, pp. 1-20.
Roger D. Peng. “Reproducible research and Biostatistics.” (2009) Biostatistics, pp. 405-408.
Paul Thompson and Andrew Burnett. “Reproducible Research” CORE Issues in Professional and Research Ethics, Volume 1, Paper 6, 2012. Accessed from http://nationalethicscenter.org/content/article/175
Jonathan Buckheit and David Donoho. “WaveLab and Reproducible Research.” (1995) Technical Report No. 474, Department of Statistics, Stanford Univeristy. Accessed from http://statistics.stanford.edu/~ckirby/techreports/NSF/EFS%20NSF%20474.pdf, February 2013.

A plug for EpiBio 560
EpiBio 560: Statistical Consulting is a ‘statistics practicum’ offered in winter quarter for students in the Master of Science in Epidemiology and Biostatistics (MSEB) program.
The instructor, Dr. Kwang-Youn Kim, is on the lookout for real projects to help these students hone their consultation and analysis skills. The consultation and analysis are provided free of charge.
If you’re interested in volunteering your project, please contact Dr. Kim at [email protected].
49

Biostatistics Collaboration Centerhttp://www.feinberg.northwestern.edu/sites/bcc/
Thank you!
Evaluation forms!