bis working papers - uni-corvinus.hu
TRANSCRIPT

BIS Working Papers No 869 How well-anchored are long-term inflation expectations? by Richhild Moessner and Előd Takáts
Monetary and Economic Department
June 2020
JEL classification: E31, E58.
Keywords: inflation expectations, anchoring, ZLB, monetary policy credibility.

BIS Working Papers are written by members of the Monetary and Economic Department of the Bank for International Settlements, and from time to time by other economists, and are published by the Bank. The papers are on subjects of topical interest and are technical in character. The views expressed in them are those of their authors and not necessarily the views of the BIS.
This publication is available on the BIS website (www.bis.org).
© Bank for International Settlements 2020. All rights reserved. Brief excerpts may be reproduced or translated provided the source is stated.
ISSN 1020-0959 (print) ISSN 1682-7678 (online)
1
How well-anchored are long-term inflation expectations?1
Richhild Moessner2 and Előd Takáts3
July 2020
Abstract
We study the anchoring properties of long-term inflation expectations in emerging and advanced economies, as a measure of monetary policy credibility. We proxy anchoring by how short-term expectations relate to long-term inflation expectations. We find that long-term inflation expectations are less well anchored in emerging than in advanced economies for the period 1996-2019. These findings do not significantly differ between before and after the global financial crisis or away from and at the effective lower bound. We also find that persistent deviations of inflation from target affect long-term inflation expectations in advanced economies. Yet, persistent deviations do not have a stronger impact at the effective lower bound. Moreover, we find evidence for asymmetry: higher than targeted inflation has a larger impact on long-term inflation expectations.
JEL classification: E31, E58.
Keywords: inflation expectations, anchoring, ZLB, monetary policy credibility.
1 The views expressed are those of the authors and do not necessarily reflect those of the BIS. We would like to thank Stijn Claessens, Fiorella de Fiore, Madhusudan Mohanty, Benoit Mojon, Nikola Tarashev, Christian Upper, Egon Zakrajsek, an anonymous referee and seminar participants at the BIS for helpful comments and discussions, and Nicolas Lemercier for excellent research assistance.
2 Bank for International Settlements, CESifo and NIESR; e-mail: [email protected] 3 Bank for International Settlements and LSE; e-mail: [email protected]

2
1. Introduction
In this paper we study how well-anchored long-term Consensus survey inflation
expectations are, as a measure of monetary policy credibility. We compare developments
between emerging market economies (EMEs) and advanced economies (AEs). We also
study how these anchoring properties of long-term inflation expectations have changed
since the global financial crisis and at the effective lower bound (ELB).
Anchoring of inflation expectations has been at the centre of the monetary policy
debate (see eg Coeuré, 2019). Some major central banks have had inflation persistently
below their inflation target since the global financial crisis, including during periods of
relatively strong economic expansion since then. This has led to concerns whether central
banks are able to achieve their inflation target, particularly during a downturn. Such
concerns may have weakened the credibility of the inflation target, and thereby that of
monetary policy. This, in turn, may have led to less well-anchored long-term inflation
expectations.
We investigate these issues by examining survey based long-term inflation
expectations.4 We investigate in two ways how well-anchored long-term inflation
expectations are: First, we consider how short-term inflation expectations relate to long-
term inflation expectations. Our hypothesis is that for well-anchored long-run inflation
expectations, long-run expectations should not react to short-term expectations, since
shocks affecting short-term expectations should not influence expectations over long
horizons. Second, we explore how well-anchored long-term expectations are around the
inflation target. The intuition is that even if long-term expectations are unresponsive to
short-term expectations, they may still not be well anchored if they are significantly below
or above the target. Our test is based on the notion that long-term inflation expectations
are well-anchored if their deviation from the inflation target does not respond to the
deviation of short-term inflation expectations from the target. Conversely, they are less
4 Alternatively, one could investigate market based measures of long-term inflation expectations. Market-based and
survey-based measures of inflation expectations need not coincide. Market based measures are available at a higher frequency, therefore, they are better suited to examine short-term changes. In contrast, survey based measures are not affected by inflation risk and liquidity premia. Therefore, their investigation can proceed directly, without estimating inflation risk and liquidity premia separately. For a discussion of survey- versus market-based inflation expectations see Galati et al (2011).
3
well-anchored if the deviation of long-term inflation expectations from target responds
more to the deviation of the short-term inflation expectations from the target.
We find that long-term inflation expectations are less-well anchored in EMEs than in
AEs for the period 1996-2019, and that the degree of anchoring is not significantly
different post-crisis or at the ELB. We also find that persistent deviations of inflation from
target affect long-term inflation expectations in advanced economies, but that this effect
is not stronger at the ELB. Moreover, we find evidence for asymmetry, with positive
persistent deviations of inflation from target affecting long-term inflation expectations
more than negative deviations for advanced economies. These results suggest that
persistent deviations of inflation from target have the potential to de-anchor long-term
inflation expectations and therefore warrant close monitoring by policymakers.
Our results suggest that long-term inflation expectations have remained well-
anchored in advanced economies at the ELB, suggesting that central bank credibility has
not been adversely affected by the ELB. For EMEs we do not find robust results regarding
the effect of the ELB, probably since there have only been much fewer instances of
reaching the ELB in EMEs than in AEs in our sample.
Our paper contributes to the literature on the anchoring of inflation expectations by
considering the effects of short-term inflation expectations and of persistent deviations
of inflation from target on long-term inflation expectations in a panel framework,
separately for EMEs and advanced economies.5 In particular, we build on the works of
Buono and Formai (2018), Yetman (2020) and Apokoritis et al. (2019) and complement
their analysis, among others, by focussing on deviations from inflation targets. Thereby,
we refine the interpretation of well-anchored expectations as not only stable but also
5 Mehrotra and Yetman (2018) consider another way to analyse the anchoring of inflation expectations using multiple-
horizon fixed-event forecasts from Consensus surveys. They show that longer-term forecasts are better anchored than shorter-term forecasts. Ehrmann (2015) studies the anchoring of short-term inflation expectations (current and next calendar year fixed-event forecasts, ie varying from one to 23 months ahead) from Consensus surveys in ten inflation-targeting AEs until 2014, using the following measures: the dependence of inflation expectations on lagged realised inflation, disagreement among forecasters, and the revision of short-term inflation expectations in response to news about inflation. Based on these measures, he finds that under persistently low inflation, some disanchoring of short-term inflation expectations occurs compared to situations where inflation is around target. Given that Ehrmann (2015) only studies the anchoring of inflation expectations with short horizons (fixed-event expectations with varying horizons of one to 23 months ahead), his results are not comparable with our study of long-term inflation expectations (constant-horizon expectations 6-10 years ahead). The literature and monetary policymakers commonly consider the anchoring of long-term, not short-term, inflation expectations as a measure of monetary policy credibility, as we do in this paper.
4
around the inflation target. By contrast, Buono and Formai (2018) consider only inflation
expectations, and Yetman (2020) and Apokoritis et al. (2019) only consider changes in
inflation expectations, rather than deviations of inflation expectations from target.
Moreover, while Buono and Formai (2018) and Apokoritis et al. (2019) consider
regressions for individual economies, we use panel regressions for a large panel of
advanced and emerging economies.
There is some recent evidence on the determinants of the anchoring of long-term
inflation expectations in the group of advanced and emerging economies. IMF (2018)
finds that inflation targeting has contributed to better-anchored long-term inflation
expectations in EMEs.6 Kose et al (2019) find for a group of emerging and developing
economies that inflation targeting, high central bank transparency, strong trade
integration and a low level of public debt are associated with better-anchored long-term
inflation expectations.7 Yetman (2020) finds for a combined sample of EMEs and
advanced economies that inflation targeting has played a modest role in affecting the
anchoring of long-term inflation expectations.8 Moreover, he finds that recent periods
with low inflation are correlated with decreased effects of short-term on long-term
inflation expectations, suggesting that longer-term expectations have remained well-
anchored.
Evidence on the anchoring of long-term inflation expectations is also available for
individual countries using survey-based expectations. Buono and Formai (2018) study the
effects of short-term on long-term expectations from Consensus surveys, using time-
varying parameter regressions. They find that after the global financial crisis long-term
expectations have been well-anchored in the United States, and to a lesser extent in the
United Kingdom. The find that in the euro area long-term expectations have been de-
anchored shortly after the global financial crisis and again starting from 2014, and that in
Japan de-anchoring is more pervasive during the sample period of 1989-2017. Using
6 IMF (2018) considers the following measures for the anchoring of long-term inflation expectations: absolute
deviations in inflation forecasts from a target, the variability of inflation forecasts over time, the dispersion of inflation forecasts across individual forecasters, and the sensitivity of inflation forecasts to surprises about current inflation.
7 As a measure of the anchoring of long-term inflation expectations, Kose et al (2019) consider the reactions of long-term inflation expectations to domestic and global inflation surprises.
8 Yetman (2020) considers the effects of short-term on long-term inflation expectations since the 1990s.

5
micro evidence from a survey at weekly frequency, Apokoritis et al. (2019) find that long-
term euro area inflation expectations remained well anchored at the ECB’s inflation aim.
Evidence on the anchoring of long-term inflation expectations is also available for
individual countries using market-based expectations. Several studies found signs of less
well-anchored long-term inflation expectations in the euro area around 2014, in the wake
of the euro area sovereign debt crisis (Galati et al., 2018; Cecchetti et al., 2015). Natoli and
Sigalotti (2018) find that the risk of less well-anchored inflation expectations in the euro
area, as well as in the United States and the United Kingdom, increased in 2014 but
decreased somewhat subsequently.9
Consistent with our results, several other recent studies using a range of measures of
anchoring based on the responses of long-term inflation expectations to inflation
surprises and to short-term inflation expectations, have found that inflation expectations
are less-well anchored in EMEs than in AEs (see IMF, 2016; Kose et al, 2019; and Yetman,
2020).
The remainder of the paper is organised as follows. Section 2 introduces the data.
Section 3 presents the benchmark specification and results, while Section 4 presents
robustness results. Finally, Section 5 concludes.
2. Data
We analyse semi-annual time-series data for emerging and advanced10 economies over
the period 1994H1–2019H1, in April and October each year (for CZ, HU, PL, RU and TR in
March and September until 2014H1 each year due to the forecast data structure as
explained below).
9 See also Scharnagl and Stapf (2015) for a study using distributions derived from inflation-linked options for the euro
area. 10 EMEs: AR, BR, CL, CN, CO, CZ, HK, HU, ID, IN, KR, MX, MY, PE, PH, PL, RU, SG, TH, TR. AEs: AU, CA, CH, GB, JP, NZ, SE,
US, DE, FR, IT, ES, NL. Inflation-targeting EMEs: BR, CL, CO, CZ, HU, ID, IN, KR, MX, PE, PH, PL, RU, TH, TR. Inflation-targeting AEs: AU, CA, CH, GB, JP, NZ, SE, US, DE, FR, IT, ES, NL (see appendix Table B3 for the list of abbreviations).

6
We use long-term inflation expectations (6-10 years ahead) from Consensus surveys,
as our dependent variable, taken in April and October each year (for CZ, HU, PL, RU and
TR in March and September until 2014H1 each year), in percent. We also use short-term
Consensus inflation survey expectations, one-year ahead, interpolated from monthly
current-year and next-year Consensus surveys to create a constant horizon one-year
ahead series, in percent;11 we take differences between the dates of the long-term
Consensus surveys of April and October (for CZ, HU, PL, RU and TR between March and
September until 2014H1) each year, in percentage points.
We study the effects of short-term inflation expectations from Consensus surveys on
long-term inflation expectations from Consensus surveys, as a measure of anchoring.
Short-term inflation expectations are at a constant horizon of one year ahead, obtained
by interpolating current-year and next-year Consensus survey expectations in April and
October (for CZ, HU, PL, RU and TR March and September until 2014H1) each year.
The raw data shows that interpolated long-term inflation expectations on average
are very close to inflation targets (Table B2). However, there is some dispersion, which is
larger for emerging economies than for advanced economies. Furthermore, there are
some outliers, due to disinflationary programs. A key example is Turkey: long-term
inflation expectations there were much below the current inflation targets in Q2 2002
(see minimum for long-term inflation expectations minus inflation target).12 As expected,
short-term inflation expectations show a larger variance and follow the inflation target
less closely.
We also study the effects of persistent deviations of inflation from target on long-
term inflation expectations, using year-on-year changes in the consumer price index.
11 For short-term Consensus survey expectations, we interpolate between the current-year, πitc , and next-year, πitn , survey
responses, in order to obtain constant-horizon one-year ahead short-term expectation, 𝑆𝑆𝑆𝑆𝑖𝑖𝑖𝑖𝑖𝑖𝑖𝑖𝑖𝑖𝑖𝑖𝑖𝑖𝑖𝑖 , according to 𝑆𝑆𝑆𝑆𝑖𝑖𝑖𝑖𝑖𝑖𝑖𝑖𝑖𝑖𝑖𝑖𝑖𝑖𝑖𝑖=(1-m/12)∗ πitc +m/12∗ πitn , with m=1,…,12, and m=1 for January, m=2 for February etc.
12 As these inflation targets were transitory, we check that our results remain robust when these observations are excluded.

7
3. Method and results
As a measure of the anchoring of long-term inflation expectations we consider the effects
of deviations of short-term inflation expectations from target on deviations of long-term
inflation expectations from target.13 Long-term inflation expectations are better anchored
if they respond less to short-term inflation expectations. This measure can be estimated
from the panel regression in equation (1):14
(𝐿𝐿𝑆𝑆𝑖𝑖𝑖𝑖𝑖𝑖𝑖𝑖𝑖𝑖𝑖𝑖𝑖𝑖𝑖𝑖 − 𝐼𝐼𝑆𝑆𝑖𝑖𝑖𝑖) = 𝛼𝛼𝑖𝑖 + 𝛽𝛽𝑖𝑖 + δ(𝐿𝐿𝑆𝑆𝑖𝑖𝑖𝑖𝑖𝑖𝑖𝑖𝑖𝑖𝑖𝑖𝑖𝑖𝑖𝑖−1 − 𝐼𝐼𝑆𝑆𝑖𝑖𝑖𝑖−1) + γ(𝑆𝑆𝑆𝑆𝑖𝑖𝑖𝑖𝑖𝑖𝑖𝑖𝑖𝑖𝑖𝑖𝑖𝑖𝑖𝑖 − 𝐼𝐼𝑆𝑆𝑖𝑖𝑖𝑖) + 𝜀𝜀𝑖𝑖𝑖𝑖 (1)
Here, 𝐿𝐿𝑆𝑆 𝑖𝑖𝑖𝑖𝑖𝑖𝑖𝑖𝑖𝑖𝑖𝑖𝑖𝑖𝑖𝑖 denotes long-term inflation expectations in country i in period t; t
denotes the semi-annual period, since the long-term Consensus surveys are conducted
semi-annually, in April and October each year (for CZ, HU, PL, RU and TR in March and
September until 2014H1 each year); 𝑆𝑆𝑆𝑆 𝑖𝑖𝑖𝑖𝑖𝑖𝑖𝑖𝑖𝑖𝑖𝑖𝑖𝑖𝑖𝑖 denotes short-term inflation
expectations in country i in period t; and 𝐼𝐼𝑆𝑆𝑖𝑖𝑖𝑖 denotes the inflation target in country i at
time t.
The dynamic specification captures the persistence of long-run inflation expectations
(with parameter δ capturing the degree of persistence). We also include country fixed
effects (αi) to control for any observed or unobserved time-invariant country
heterogeneity. We apply time fixed effects to capture all potential global effects, such as
oil price changes. We estimate equation (1) separately for inflation targeting advanced
and emerging economies. We use within-group fixed effects panel regressions in our
benchmark specification. The estimation period is 1994H1–2019H1.
The results of equation (1) show that long-term inflation expectations are less-well
anchored in EMEs (Table 1, column 1) than in advanced economies (column 2). This is
consistent with the results of IMF (2016), Bems et al (2018), Kose et al (2019) and Yetman
(2020). We then turn to investigate whether the reactions of long-term inflation
13 A measure of anchoring based on the effects of short-term inflation expectations on long-term inflation expectations
is also considered for example in Buono and Formai (2018), Yetman (2020) and Apokoritis et al. (2019). 14 Adapted from Jašová et al. (2019, 2020). If there is a target range, the deviations from target are calculated with
respect to the midpoint of the target range.
8
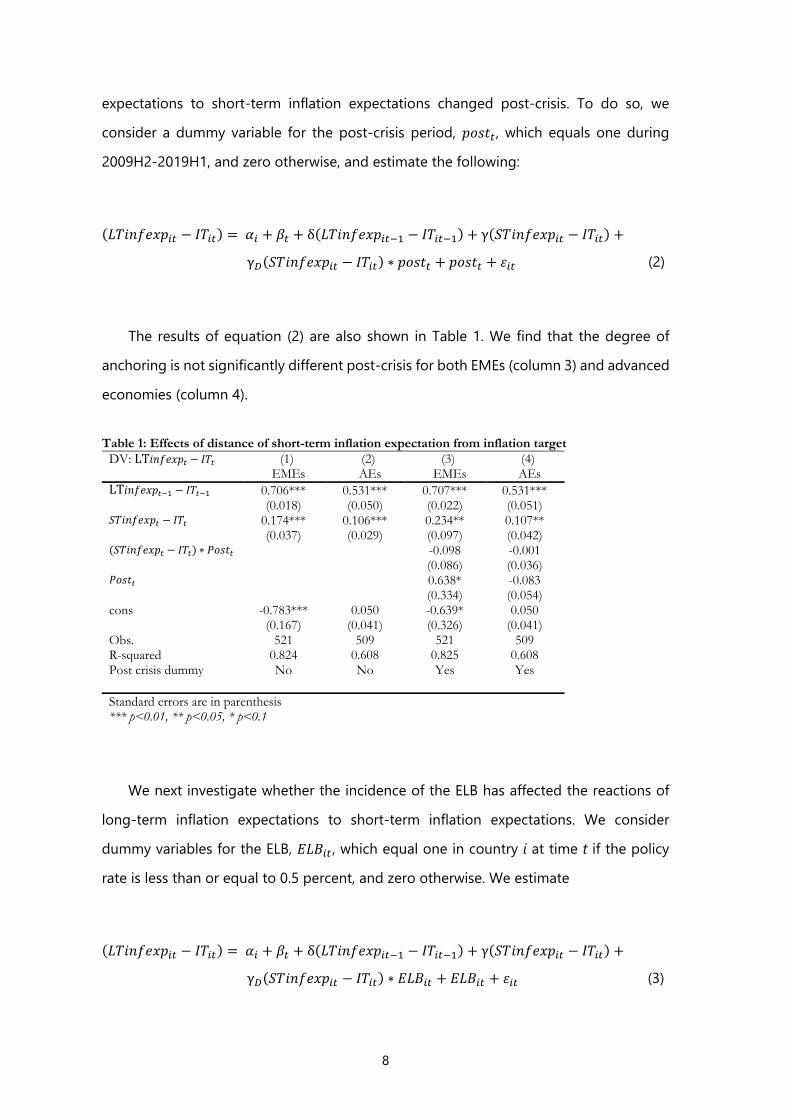
expectations to short-term inflation expectations changed post-crisis. To do so, we
consider a dummy variable for the post-crisis period, 𝑖𝑖𝑝𝑝𝑝𝑝𝑝𝑝𝑖𝑖 , which equals one during
2009H2-2019H1, and zero otherwise, and estimate the following:
(𝐿𝐿𝑆𝑆𝑖𝑖𝑖𝑖𝑖𝑖𝑖𝑖𝑖𝑖𝑖𝑖𝑖𝑖𝑖𝑖 − 𝐼𝐼𝑆𝑆𝑖𝑖𝑖𝑖) = 𝛼𝛼𝑖𝑖 + 𝛽𝛽𝑖𝑖 + δ(𝐿𝐿𝑆𝑆𝑖𝑖𝑖𝑖𝑖𝑖𝑖𝑖𝑖𝑖𝑖𝑖𝑖𝑖𝑖𝑖−1 − 𝐼𝐼𝑆𝑆𝑖𝑖𝑖𝑖−1) + γ(𝑆𝑆𝑆𝑆𝑖𝑖𝑖𝑖𝑖𝑖𝑖𝑖𝑖𝑖𝑖𝑖𝑖𝑖𝑖𝑖 − 𝐼𝐼𝑆𝑆𝑖𝑖𝑖𝑖) +
γ𝐷𝐷(𝑆𝑆𝑆𝑆𝑖𝑖𝑖𝑖𝑖𝑖𝑖𝑖𝑖𝑖𝑖𝑖𝑖𝑖𝑖𝑖 − 𝐼𝐼𝑆𝑆𝑖𝑖𝑖𝑖) ∗ 𝑖𝑖𝑝𝑝𝑝𝑝𝑝𝑝𝑖𝑖 + 𝑖𝑖𝑝𝑝𝑝𝑝𝑝𝑝𝑖𝑖 + 𝜀𝜀𝑖𝑖𝑖𝑖 (2)
The results of equation (2) are also shown in Table 1. We find that the degree of
anchoring is not significantly different post-crisis for both EMEs (column 3) and advanced
economies (column 4).
Table 1: Effects of distance of short-term inflation expectation from inflation target
DV: LT𝑖𝑖𝑖𝑖𝑖𝑖𝑖𝑖𝑖𝑖𝑖𝑖𝑖𝑖 − 𝐼𝐼𝑆𝑆𝑖𝑖 (1) (2) (3) (4) EMEs AEs EMEs AEs
LT𝑖𝑖𝑖𝑖𝑖𝑖𝑖𝑖𝑖𝑖𝑖𝑖𝑖𝑖−1 − 𝐼𝐼𝑆𝑆𝑖𝑖−1 0.706*** 0.531*** 0.707*** 0.531*** (0.018) (0.050) (0.022) (0.051) 𝑆𝑆𝑆𝑆𝑖𝑖𝑖𝑖𝑖𝑖𝑖𝑖𝑖𝑖𝑖𝑖𝑖𝑖 − 𝐼𝐼𝑆𝑆𝑖𝑖 0.174*** 0.106*** 0.234** 0.107** (0.037) (0.029) (0.097) (0.042) (𝑆𝑆𝑆𝑆𝑖𝑖𝑖𝑖𝑖𝑖𝑖𝑖𝑖𝑖𝑖𝑖𝑖𝑖 − 𝐼𝐼𝑆𝑆𝑖𝑖) ∗ 𝑃𝑃𝑝𝑝𝑝𝑝𝑝𝑝𝑖𝑖 -0.098 -0.001 (0.086) (0.036) 𝑃𝑃𝑝𝑝𝑝𝑝𝑝𝑝𝑖𝑖 0.638* -0.083 (0.334) (0.054) cons -0.783*** 0.050 -0.639* 0.050 (0.167) (0.041) (0.326) (0.041) Obs. 521 509 521 509 R-squared 0.824 0.608 0.825 0.608 Post crisis dummy No No Yes Yes Standard errors are in parenthesis *** p<0.01, ** p<0.05, * p<0.1
We next investigate whether the incidence of the ELB has affected the reactions of
long-term inflation expectations to short-term inflation expectations. We consider
dummy variables for the ELB, 𝐸𝐸𝐿𝐿𝐸𝐸𝑖𝑖𝑖𝑖 , which equal one in country i at time t if the policy
rate is less than or equal to 0.5 percent, and zero otherwise. We estimate
(𝐿𝐿𝑆𝑆𝑖𝑖𝑖𝑖𝑖𝑖𝑖𝑖𝑖𝑖𝑖𝑖𝑖𝑖𝑖𝑖 − 𝐼𝐼𝑆𝑆𝑖𝑖𝑖𝑖) = 𝛼𝛼𝑖𝑖 + 𝛽𝛽𝑖𝑖 + δ(𝐿𝐿𝑆𝑆𝑖𝑖𝑖𝑖𝑖𝑖𝑖𝑖𝑖𝑖𝑖𝑖𝑖𝑖𝑖𝑖−1 − 𝐼𝐼𝑆𝑆𝑖𝑖𝑖𝑖−1) + γ(𝑆𝑆𝑆𝑆𝑖𝑖𝑖𝑖𝑖𝑖𝑖𝑖𝑖𝑖𝑖𝑖𝑖𝑖𝑖𝑖 − 𝐼𝐼𝑆𝑆𝑖𝑖𝑖𝑖) +
γ𝐷𝐷(𝑆𝑆𝑆𝑆𝑖𝑖𝑖𝑖𝑖𝑖𝑖𝑖𝑖𝑖𝑖𝑖𝑖𝑖𝑖𝑖 − 𝐼𝐼𝑆𝑆𝑖𝑖𝑖𝑖) ∗ 𝐸𝐸𝐿𝐿𝐸𝐸𝑖𝑖𝑖𝑖 + 𝐸𝐸𝐿𝐿𝐸𝐸𝑖𝑖𝑖𝑖 + 𝜀𝜀𝑖𝑖𝑖𝑖 (3)

9
The results of equation (3) are shown in Table 2. We find that the degree of anchoring
is not significantly different at the ELB for both EMEs (column 3) and advanced economies
(column 4). Our results suggest that long-term inflation expectations have remained well-
anchored in advanced economies at the ELB, suggesting that central bank credibility has
not been adversely affected by the ELB.
Table 2: Effects of distance of short-term inflation expectation from inflation target DV: LT𝑖𝑖𝑖𝑖𝑖𝑖𝑖𝑖𝑖𝑖𝑖𝑖𝑖𝑖 − 𝐼𝐼𝑆𝑆𝑖𝑖 (1) (2) (3) (4)
EMEs AEs EMEs AEs LT𝑖𝑖𝑖𝑖𝑖𝑖𝑖𝑖𝑖𝑖𝑖𝑖𝑖𝑖−1 − 𝐼𝐼𝑆𝑆𝑖𝑖−1 0.706*** 0.531*** 0.706*** 0.513*** (0.018) (0.050) (0.018) (0.051) 𝑆𝑆𝑆𝑆𝑖𝑖𝑖𝑖𝑖𝑖𝑖𝑖𝑖𝑖𝑖𝑖𝑖𝑖 − 𝐼𝐼𝑆𝑆𝑖𝑖 0.174*** 0.106*** 0.174*** 0.112*** (0.037) (0.029) (0.037) (0.036) (𝑆𝑆𝑆𝑆𝑖𝑖𝑖𝑖𝑖𝑖𝑖𝑖𝑖𝑖𝑖𝑖𝑖𝑖 − 𝐼𝐼𝑆𝑆𝑖𝑖) ∗ 𝐸𝐸𝐿𝐿𝐸𝐸𝑖𝑖 -0.058 0.002 (0.071) (0.030) 𝐸𝐸𝐿𝐿𝐸𝐸𝑖𝑖 -0.039 0.048 (0.096) (0.028) cons -0.783*** 0.050 -0.782*** 0.060 (0.167) (0.041) (0.167) (0.041) Obs. 521 509 521 509 R-squared 0.824 0.608 0.824 0.613 Post crisis dummy No No Yes Yes Standard errors are in parenthesis *** p<0.01, ** p<0.05, * p<0.1
We then turn to estimate the effects of persistent deviations of inflation from target
on long-term inflation expectations, according to equation (4):
(𝐿𝐿𝑆𝑆𝑖𝑖𝑖𝑖𝑖𝑖𝑖𝑖𝑖𝑖𝑖𝑖𝑖𝑖𝑖𝑖 − 𝐼𝐼𝑆𝑆𝑖𝑖𝑖𝑖) = 𝛼𝛼𝑖𝑖 + 𝛽𝛽𝑖𝑖 + δ(𝐿𝐿𝑆𝑆𝑖𝑖𝑖𝑖𝑖𝑖𝑖𝑖𝑖𝑖𝑖𝑖𝑖𝑖𝑖𝑖−1 − 𝐼𝐼𝑆𝑆𝑖𝑖𝑖𝑖−1) + γ∆𝑆𝑆𝑆𝑆𝑖𝑖𝑖𝑖𝑖𝑖𝑖𝑖𝑖𝑖𝑖𝑖𝑖𝑖𝑖𝑖 +
𝜇𝜇(𝐼𝐼𝑖𝑖𝑖𝑖𝐼𝐼𝑛𝑛𝑛𝑛 − 𝐼𝐼𝑆𝑆𝑛𝑛𝑛𝑛)𝑖𝑖𝑖𝑖 + 𝜀𝜀𝑖𝑖𝑖𝑖 (4)
Here, averages of deviations of inflation from target, (𝐼𝐼𝑖𝑖𝑖𝑖𝐼𝐼𝑛𝑛𝑛𝑛 − 𝐼𝐼𝑆𝑆𝑛𝑛𝑛𝑛)𝑖𝑖𝑖𝑖, are taken over
n=2, 3, 4 or 5 years, starting with t-1. We control for ∆𝑆𝑆𝑆𝑆𝑖𝑖𝑖𝑖𝑖𝑖𝑖𝑖𝑖𝑖𝑖𝑖𝑖𝑖𝑖𝑖 , changes in short-term
inflation expectations.
The results of equation (4) are shown in Table 3. We find that persistent deviations of
inflation from target statistically significantly affect long-term inflation expectations in
advanced economies. These results remain in all investigated persistence time horizons:
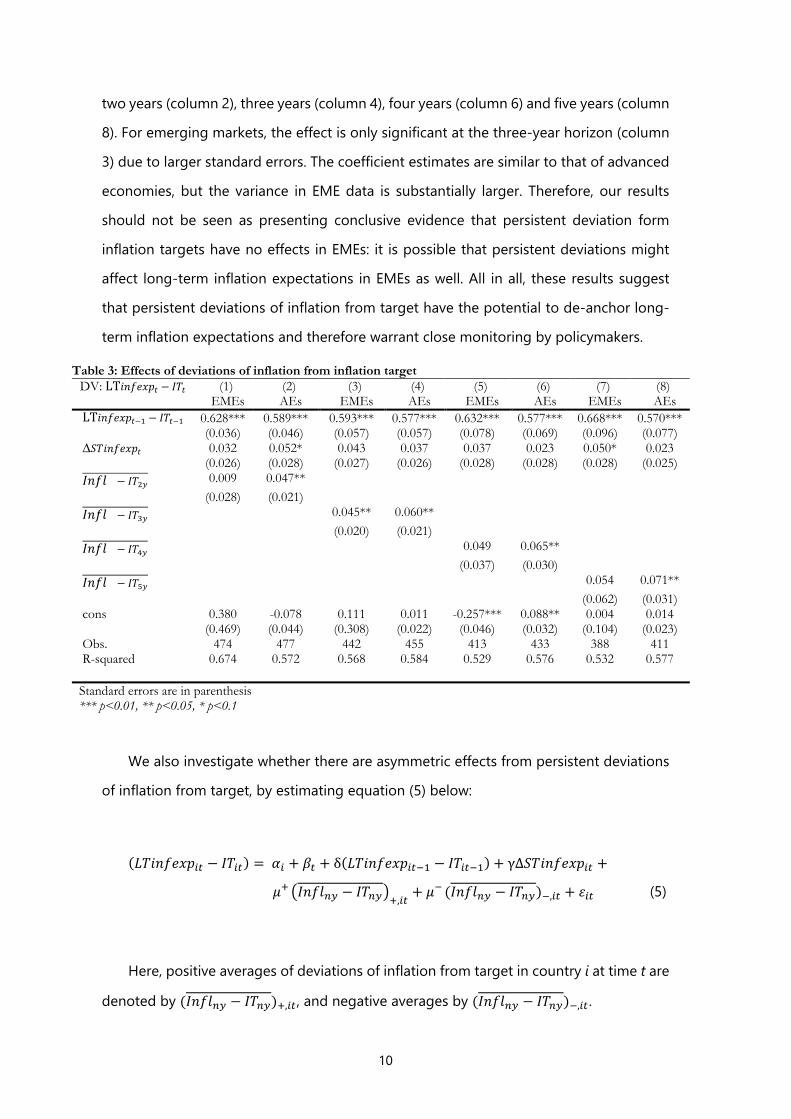
10
two years (column 2), three years (column 4), four years (column 6) and five years (column
8). For emerging markets, the effect is only significant at the three-year horizon (column
3) due to larger standard errors. The coefficient estimates are similar to that of advanced
economies, but the variance in EME data is substantially larger. Therefore, our results
should not be seen as presenting conclusive evidence that persistent deviation form
inflation targets have no effects in EMEs: it is possible that persistent deviations might
affect long-term inflation expectations in EMEs as well. All in all, these results suggest
that persistent deviations of inflation from target have the potential to de-anchor long-
term inflation expectations and therefore warrant close monitoring by policymakers.
Table 3: Effects of deviations of inflation from inflation target DV: LT𝑖𝑖𝑖𝑖𝑖𝑖𝑖𝑖𝑖𝑖𝑖𝑖𝑖𝑖 − 𝐼𝐼𝑆𝑆𝑖𝑖 (1) (2) (3) (4) (5) (6) (7) (8)
EMEs AEs EMEs AEs EMEs AEs EMEs AEs LT𝑖𝑖𝑖𝑖𝑖𝑖𝑖𝑖𝑖𝑖𝑖𝑖𝑖𝑖−1 − 𝐼𝐼𝑆𝑆𝑖𝑖−1 0.628*** 0.589*** 0.593*** 0.577*** 0.632*** 0.577*** 0.668*** 0.570*** (0.036) (0.046) (0.057) (0.057) (0.078) (0.069) (0.096) (0.077) ∆𝑆𝑆𝑆𝑆𝑖𝑖𝑖𝑖𝑖𝑖𝑖𝑖𝑖𝑖𝑖𝑖𝑖𝑖 0.032 0.052* 0.043 0.037 0.037 0.023 0.050* 0.023 (0.026) (0.028) (0.027) (0.026) (0.028) (0.028) (0.028) (0.025) 𝐼𝐼𝑖𝑖𝑖𝑖𝐼𝐼 − 𝐼𝐼𝑆𝑆2𝑛𝑛 0.009 0.047** (0.028) (0.021) 𝐼𝐼𝑖𝑖𝑖𝑖𝐼𝐼 − 𝐼𝐼𝑆𝑆3𝑛𝑛 0.045** 0.060** (0.020) (0.021) 𝐼𝐼𝑖𝑖𝑖𝑖𝐼𝐼 − 𝐼𝐼𝑆𝑆4𝑛𝑛 0.049 0.065** (0.037) (0.030) 𝐼𝐼𝑖𝑖𝑖𝑖𝐼𝐼 − 𝐼𝐼𝑆𝑆5𝑛𝑛 0.054 0.071** (0.062) (0.031) cons 0.380 -0.078 0.111 0.011 -0.257*** 0.088** 0.004 0.014 (0.469) (0.044) (0.308) (0.022) (0.046) (0.032) (0.104) (0.023) Obs. 474 477 442 455 413 433 388 411 R-squared 0.674 0.572 0.568 0.584 0.529 0.576 0.532 0.577 Standard errors are in parenthesis *** p<0.01, ** p<0.05, * p<0.1
We also investigate whether there are asymmetric effects from persistent deviations
of inflation from target, by estimating equation (5) below:
(𝐿𝐿𝑆𝑆𝑖𝑖𝑖𝑖𝑖𝑖𝑖𝑖𝑖𝑖𝑖𝑖𝑖𝑖𝑖𝑖 − 𝐼𝐼𝑆𝑆𝑖𝑖𝑖𝑖) = 𝛼𝛼𝑖𝑖 + 𝛽𝛽𝑖𝑖 + δ(𝐿𝐿𝑆𝑆𝑖𝑖𝑖𝑖𝑖𝑖𝑖𝑖𝑖𝑖𝑖𝑖𝑖𝑖𝑖𝑖−1 − 𝐼𝐼𝑆𝑆𝑖𝑖𝑖𝑖−1) + γ∆𝑆𝑆𝑆𝑆𝑖𝑖𝑖𝑖𝑖𝑖𝑖𝑖𝑖𝑖𝑖𝑖𝑖𝑖𝑖𝑖 +
𝜇𝜇+ �𝐼𝐼𝑖𝑖𝑖𝑖𝐼𝐼𝑛𝑛𝑛𝑛 − 𝐼𝐼𝑆𝑆𝑛𝑛𝑛𝑛�+,𝑖𝑖𝑖𝑖+ 𝜇𝜇− (𝐼𝐼𝑖𝑖𝑖𝑖𝐼𝐼𝑛𝑛𝑛𝑛 − 𝐼𝐼𝑆𝑆𝑛𝑛𝑛𝑛)−,𝑖𝑖𝑖𝑖 + 𝜀𝜀𝑖𝑖𝑖𝑖 (5)
Here, positive averages of deviations of inflation from target in country i at time t are
denoted by (𝐼𝐼𝑖𝑖𝑖𝑖𝐼𝐼𝑛𝑛𝑛𝑛 − 𝐼𝐼𝑆𝑆𝑛𝑛𝑛𝑛)+,𝑖𝑖𝑖𝑖, and negative averages by (𝐼𝐼𝑖𝑖𝑖𝑖𝐼𝐼𝑛𝑛𝑛𝑛 − 𝐼𝐼𝑆𝑆𝑛𝑛𝑛𝑛)−,𝑖𝑖𝑖𝑖.
11
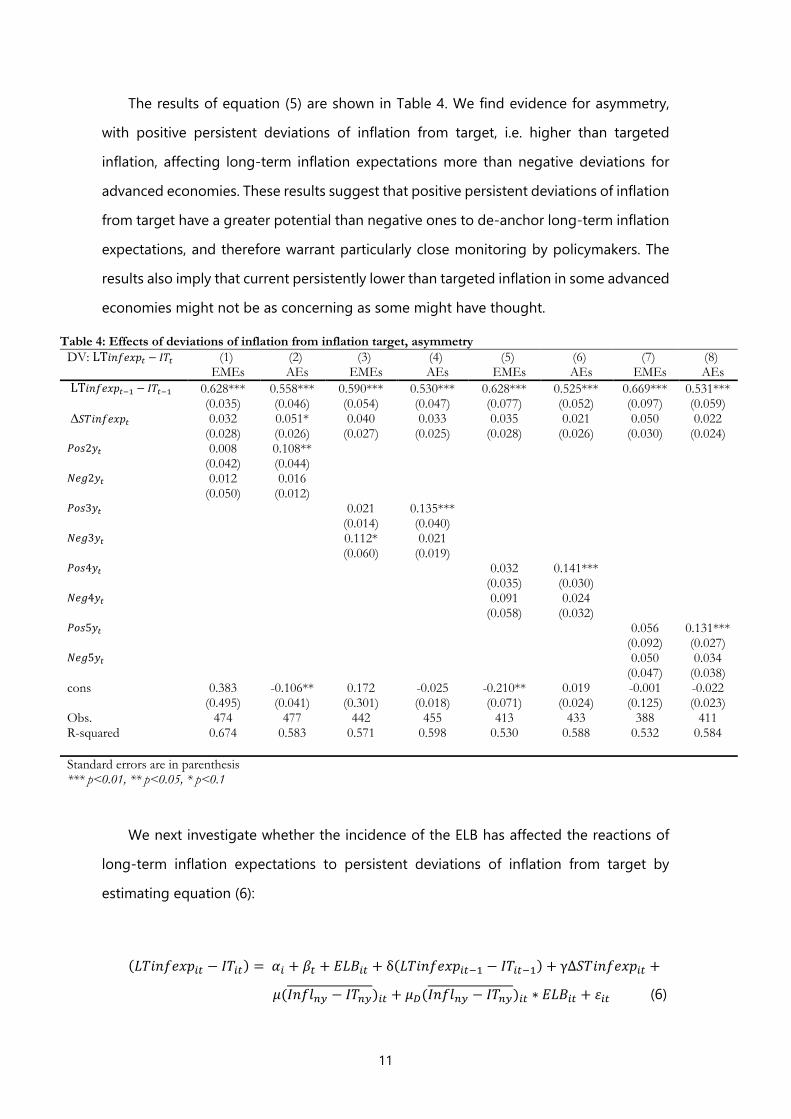
The results of equation (5) are shown in Table 4. We find evidence for asymmetry,
with positive persistent deviations of inflation from target, i.e. higher than targeted
inflation, affecting long-term inflation expectations more than negative deviations for
advanced economies. These results suggest that positive persistent deviations of inflation
from target have a greater potential than negative ones to de-anchor long-term inflation
expectations, and therefore warrant particularly close monitoring by policymakers. The
results also imply that current persistently lower than targeted inflation in some advanced
economies might not be as concerning as some might have thought.
Table 4: Effects of deviations of inflation from inflation target, asymmetry DV: LT𝑖𝑖𝑖𝑖𝑖𝑖𝑖𝑖𝑖𝑖𝑖𝑖𝑖𝑖 − 𝐼𝐼𝑆𝑆𝑖𝑖 (1) (2) (3) (4) (5) (6) (7) (8)
EMEs AEs EMEs AEs EMEs AEs EMEs AEs LT𝑖𝑖𝑖𝑖𝑖𝑖𝑖𝑖𝑖𝑖𝑖𝑖𝑖𝑖−1 − 𝐼𝐼𝑆𝑆𝑖𝑖−1 0.628*** 0.558*** 0.590*** 0.530*** 0.628*** 0.525*** 0.669*** 0.531*** (0.035) (0.046) (0.054) (0.047) (0.077) (0.052) (0.097) (0.059) ∆𝑆𝑆𝑆𝑆𝑖𝑖𝑖𝑖𝑖𝑖𝑖𝑖𝑖𝑖𝑖𝑖𝑖𝑖 0.032 0.051* 0.040 0.033 0.035 0.021 0.050 0.022 (0.028) (0.026) (0.027) (0.025) (0.028) (0.026) (0.030) (0.024) 𝑃𝑃𝑝𝑝𝑝𝑝2𝑦𝑦𝑖𝑖 0.008 0.108** (0.042) (0.044) 𝑁𝑁𝑖𝑖𝑁𝑁2𝑦𝑦𝑖𝑖 0.012 0.016 (0.050) (0.012) 𝑃𝑃𝑝𝑝𝑝𝑝3𝑦𝑦𝑖𝑖 0.021 0.135*** (0.014) (0.040) 𝑁𝑁𝑖𝑖𝑁𝑁3𝑦𝑦𝑖𝑖 0.112* 0.021 (0.060) (0.019) 𝑃𝑃𝑝𝑝𝑝𝑝4𝑦𝑦𝑖𝑖 0.032 0.141*** (0.035) (0.030) 𝑁𝑁𝑖𝑖𝑁𝑁4𝑦𝑦𝑖𝑖 0.091 0.024 (0.058) (0.032) 𝑃𝑃𝑝𝑝𝑝𝑝5𝑦𝑦𝑖𝑖 0.056 0.131*** (0.092) (0.027) 𝑁𝑁𝑖𝑖𝑁𝑁5𝑦𝑦𝑖𝑖 0.050 0.034 (0.047) (0.038) cons 0.383 -0.106** 0.172 -0.025 -0.210** 0.019 -0.001 -0.022 (0.495) (0.041) (0.301) (0.018) (0.071) (0.024) (0.125) (0.023) Obs. 474 477 442 455 413 433 388 411 R-squared 0.674 0.583 0.571 0.598 0.530 0.588 0.532 0.584 Standard errors are in parenthesis *** p<0.01, ** p<0.05, * p<0.1
We next investigate whether the incidence of the ELB has affected the reactions of
long-term inflation expectations to persistent deviations of inflation from target by
estimating equation (6):
(𝐿𝐿𝑆𝑆𝑖𝑖𝑖𝑖𝑖𝑖𝑖𝑖𝑖𝑖𝑖𝑖𝑖𝑖𝑖𝑖 − 𝐼𝐼𝑆𝑆𝑖𝑖𝑖𝑖) = 𝛼𝛼𝑖𝑖 + 𝛽𝛽𝑖𝑖 + 𝐸𝐸𝐿𝐿𝐸𝐸𝑖𝑖𝑖𝑖 + δ(𝐿𝐿𝑆𝑆𝑖𝑖𝑖𝑖𝑖𝑖𝑖𝑖𝑖𝑖𝑖𝑖𝑖𝑖𝑖𝑖−1 − 𝐼𝐼𝑆𝑆𝑖𝑖𝑖𝑖−1) + γ∆𝑆𝑆𝑆𝑆𝑖𝑖𝑖𝑖𝑖𝑖𝑖𝑖𝑖𝑖𝑖𝑖𝑖𝑖𝑖𝑖 +
𝜇𝜇(𝐼𝐼𝑖𝑖𝑖𝑖𝐼𝐼𝑛𝑛𝑛𝑛 − 𝐼𝐼𝑆𝑆𝑛𝑛𝑛𝑛)𝑖𝑖𝑖𝑖 + 𝜇𝜇𝐷𝐷(𝐼𝐼𝑖𝑖𝑖𝑖𝐼𝐼𝑛𝑛𝑛𝑛 − 𝐼𝐼𝑆𝑆𝑛𝑛𝑛𝑛)𝑖𝑖𝑖𝑖 ∗ 𝐸𝐸𝐿𝐿𝐸𝐸𝑖𝑖𝑖𝑖 + 𝜀𝜀𝑖𝑖𝑖𝑖 (6)

12
The results of equation (6) are shown in Table 5. We find that the effect of persistent
deviations of inflation from target is not significantly stronger at the ELB, for both EMEs
and AEs.
Table 5: Effects of distance of inflation from inflation target (no asymmetry, interaction with ELB dummy) DV: LT𝑖𝑖𝑖𝑖𝑖𝑖𝑖𝑖𝑖𝑖𝑖𝑖𝑖𝑖 − 𝐼𝐼𝑆𝑆𝑖𝑖 (1) (2) (3) (4) (5) (6) (7) (8)
EMEs AEs EMEs AEs EMEs AEs EMEs AEs LT𝑖𝑖𝑖𝑖𝑖𝑖𝑖𝑖𝑖𝑖𝑖𝑖𝑖𝑖−1 − 𝐼𝐼𝑆𝑆𝑖𝑖−1 0.628*** 0.553*** 0.590*** 0.524*** 0.629*** 0.515*** 0.669*** 0.518*** (0.035) (0.050) (0.054) (0.055) (0.077) (0.064) (0.097) (0.072) ∆𝑆𝑆𝑆𝑆𝑖𝑖𝑖𝑖𝑖𝑖𝑖𝑖𝑖𝑖𝑖𝑖𝑖𝑖 0.032 0.052* 0.040 0.033 0.036 0.021 0.051 0.023 (0.028) (0.027) (0.027) (0.026) (0.028) (0.026) (0.030) (0.024) 𝐸𝐸𝐿𝐿𝐸𝐸𝑖𝑖 -0.061 0.030 -0.108 0.033 -0.123 0.041 -0.111 0.042 (0.078) (0.029) (0.068) (0.031) (0.083) (0.034) (0.115) (0.036) 𝐼𝐼𝑖𝑖𝑖𝑖𝐼𝐼 − 𝐼𝐼𝑆𝑆2𝑛𝑛 0.009 0.103** (0.042) (0.046) 𝐼𝐼𝑖𝑖𝑖𝑖𝐼𝐼 − 𝐼𝐼𝑆𝑆2𝑛𝑛 ∗ 𝐸𝐸𝐿𝐿𝐸𝐸𝑖𝑖 0.012 0.019 (0.050) (0.012) 𝐼𝐼𝑖𝑖𝑖𝑖𝐼𝐼 − 𝐼𝐼𝑆𝑆3𝑛𝑛 0.022 0.128** (0.015) (0.043) 𝐼𝐼𝑖𝑖𝑖𝑖𝐼𝐼 − 𝐼𝐼𝑆𝑆3𝑛𝑛 ∗ 𝐸𝐸𝐿𝐿𝐸𝐸𝑖𝑖 0.110* 0.025 (0.061) (0.021) 𝐼𝐼𝑖𝑖𝑖𝑖𝐼𝐼 − 𝐼𝐼𝑆𝑆4𝑛𝑛 0.034 0.133*** (0.036) (0.033) 𝐼𝐼𝑖𝑖𝑖𝑖𝐼𝐼 − 𝐼𝐼𝑆𝑆4𝑛𝑛 ∗ 𝐸𝐸𝐿𝐿𝐸𝐸𝑖𝑖 0.089 0.027 (0.058) (0.034) 𝐼𝐼𝑖𝑖𝑖𝑖𝐼𝐼 − 𝐼𝐼𝑆𝑆5𝑛𝑛 0.058 0.123*** (0.093) (0.033) 𝐼𝐼𝑖𝑖𝑖𝑖𝐼𝐼 − 𝐼𝐼𝑆𝑆5𝑛𝑛 ∗ 𝐸𝐸𝐿𝐿𝐸𝐸𝑖𝑖 0.048 0.038 (0.048) (0.041) cons 0.375 -0.102** 0.155 -0.024 -0.208** 0.012 0.001 -0.023 (0.502) (0.046) (0.300) (0.018) (0.070) (0.031) (0.125) (0.024) Obs. 474 477 442 455 413 433 388 411 R-squared 0.674 0.585 0.571 0.600 0.530 0.593 0.532 0.588 Standard errors are in parenthesis *** p<0.01, ** p<0.05, * p<0.1
Finally, we turn to study the stability of long-term inflation expectations irrespective
of the level. Formally, we estimate the effects of changes in short-term inflation
expectations on changes in long-term inflation expectations, according to equation (7):
∆𝐿𝐿𝑆𝑆𝑖𝑖𝑖𝑖𝑖𝑖𝑖𝑖𝑖𝑖𝑖𝑖𝑖𝑖𝑖𝑖 = 𝛼𝛼𝑖𝑖 + 𝛽𝛽𝑖𝑖 + γ∆𝑆𝑆𝑆𝑆𝑖𝑖𝑖𝑖𝑖𝑖𝑖𝑖𝑖𝑖𝑖𝑖𝑖𝑖𝑖𝑖 + 𝜀𝜀𝑖𝑖𝑖𝑖 (7)

13
The results of equation (7) are shown in Table 6, separately for EMEs, AEs, and for
inflation targeting EMEs and AEs. We can see that also on this measure long-term
inflation expectations have been better anchored in AEs than in EMEs, consistent with the
results above.
Table 6: Effects of changes in short-term on changes in long-term inflation expectations Dep. Var.: ∆𝐿𝐿𝑆𝑆𝑖𝑖𝑖𝑖𝑖𝑖𝑖𝑖𝑖𝑖𝑖𝑖𝑖𝑖 (1) (2) (3) (4)
IT-EMEs IT-AEs EMEs AEs ∆𝑆𝑆𝑆𝑆𝑖𝑖𝑖𝑖𝑖𝑖𝑖𝑖𝑖𝑖𝑖𝑖𝑖𝑖 0.223*** 0.067* 0.100* 0.053 (0.066) (0.033) (0.052) (0.033) cons -1.938*** -0.290*** -0.574** -0.147** (0.302) (0.013) (0.262) (0.057) Obs. 537 517 784 632 R-squared 0.430 0.196 0.194 0.119 Standard errors are in parenthesis *** p<0.01, ** p<0.05, * p<0.1
4. Robustness
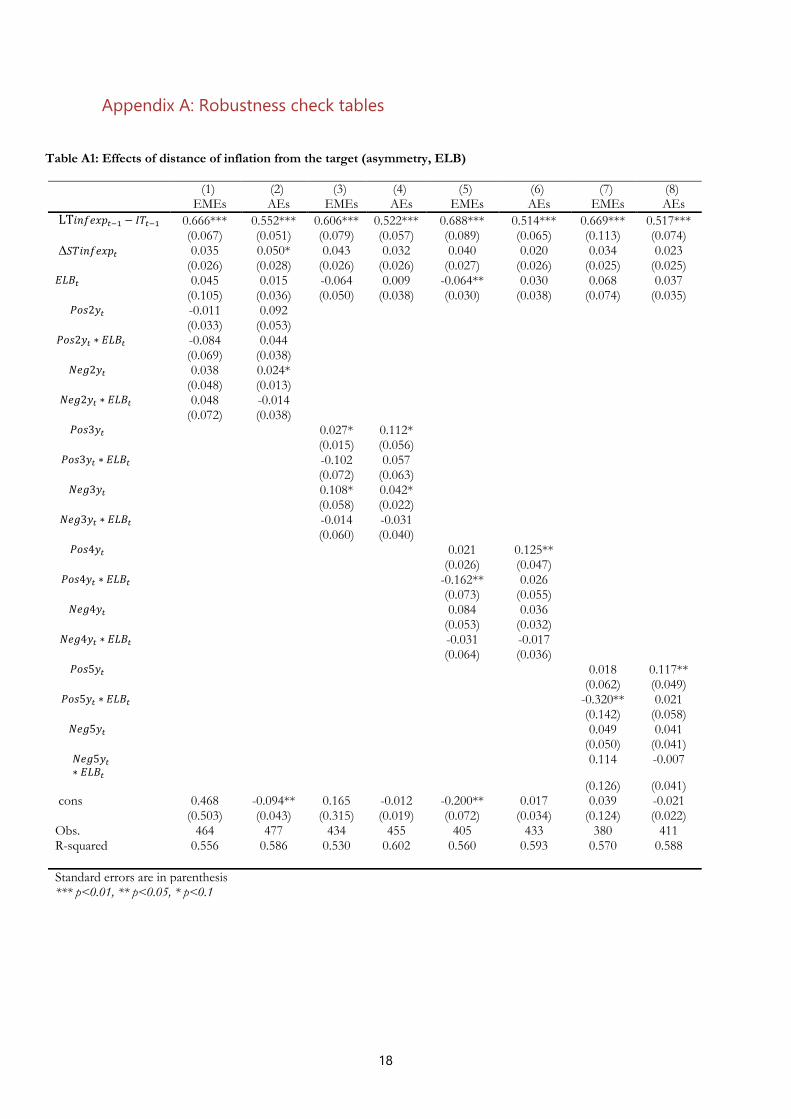
We perform extensive checks to ensure the robustness of our results. First, we allow for
interactions of positive and negative inflation deviations from target with the ELB (Table
A1). The main motivation is to uncover whether the current coincidence of low rates and
lower than targeted inflation in many advanced economies has special implications for
the behaviour of long-term inflation expectations. We find that positive inflation
deviations remain significant for AEs at most horizons (of three, four and five years),
consistent with the results of Table 4. Negative inflation deviations tend to remain
insignificant as well.15 Importantly, the interaction of the ELB with both positive and
negative persistent deviations is not significant at any horizon for AEs. This result is
consistent with the results (reported in Table 5) that the interaction of the ELB with
persistent inflation deviations (not split into positive and negative ones) is insignificant at
all horizons. Therefore, the results do not suggest additional concerns about the lower
than targeted inflation levels in the current low rate environment. Yet, we should be
15 At the two-year horizon for AEs, the coefficient on positive inflation deviations decreases slightly and becomes
insignificant, while the coefficient on negative inflation deviations increases slightly and becomes significant.

14
cautious about the interpretation: these results are based on historical data where the
combination of low rates and low inflation was much less widespread than they are today.
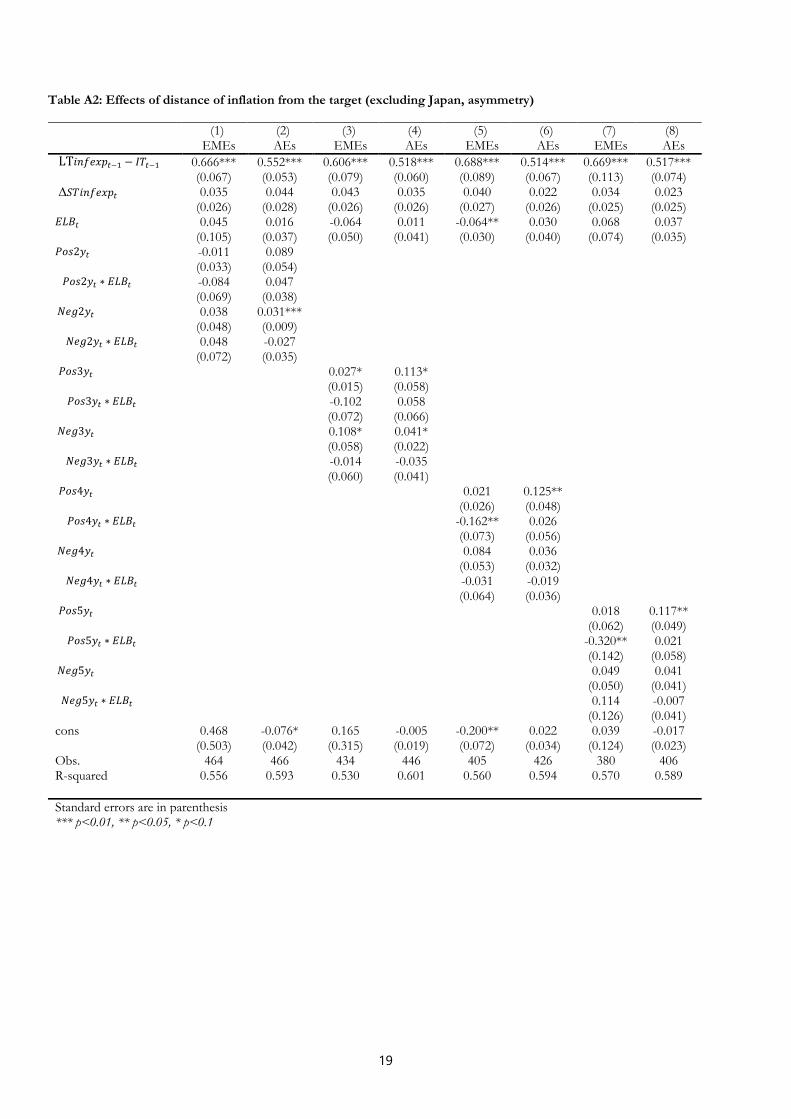
Second, we re-estimate some results without Japan. The reason is that Japan
experienced a very long period of low inflation and low interest rates with some country
specific economic developments – and we would want to understand to which degree
our broad results depend on a single country experience. In this context, first we re-
estimate the interactions of positive and negative inflation deviations from target with
the ELB estimated above in Table A1. The interaction of the ELB with both positive and
negative persistent deviations remains insignificant at any horizon for AEs (Table A2).
Thus, these interaction results are consistently insignificant irrespective of whether we
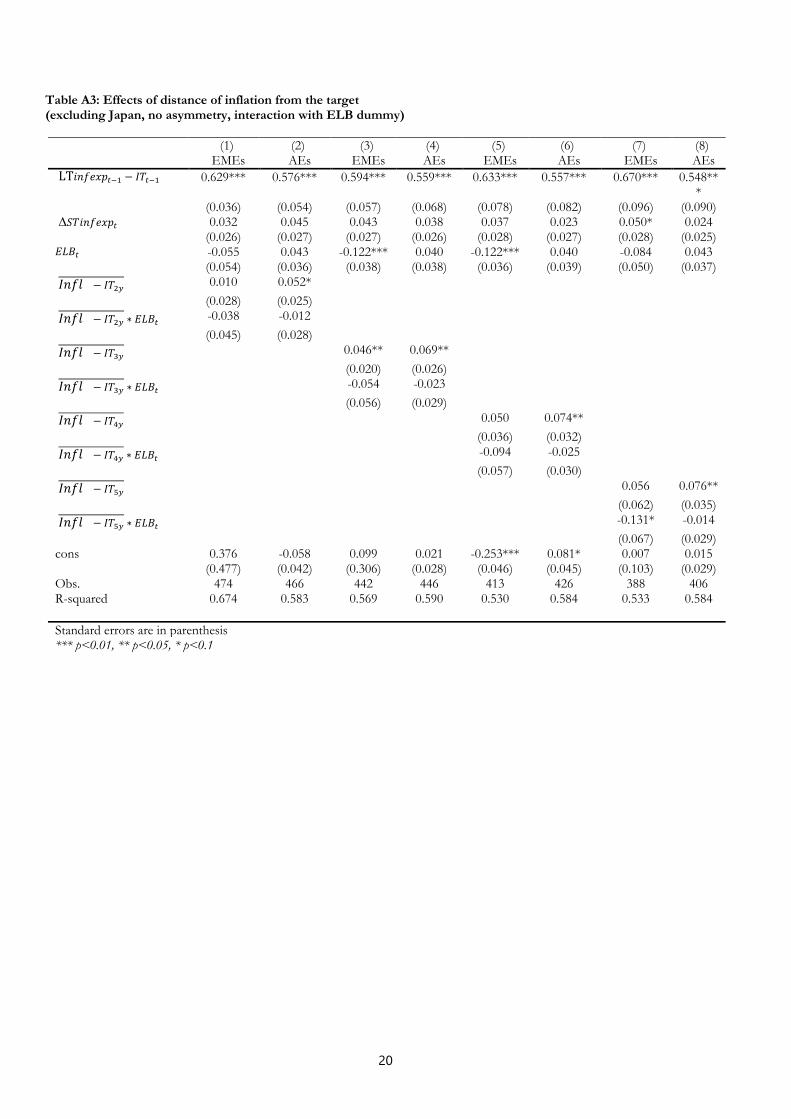
include Japan or not. Next, we re-estimate without Japan the ELB interaction results when
we do not distinguish between positive and negative deviations from inflation targets.
We find that the earlier result shown in Table 5 that the interaction of the ELB with
persistent inflation deviations is insignificant at all horizons is robust to excluding Japan
(Table A3).
Third, we address concerns about high or transitory inflation targets. Some emerging
markets, such as Turkey, used inflation targets during a period of disinflation to better
anchor the policy transition. These transitory inflation targets might work differently than
stable targets. Therefore, we re-estimate our main results (in particular Tables 1, 2 and 5)
when excluding observations where the inflation target is greater than 10% (Tables A4,
A5 and A6). The results (reported in Tables 1 and 2) that the interaction of deviations of
short-term inflation expectations from the inflation target with the post-crisis dummy
and with the ELB are insignificant for both AEs and EME remain robust to excluding
observations where the inflation target is greater than 10% (Tables A4 and A5).
Furthermore, the results (reported in Table 5) that persistent deviations of inflation from
target in AEs are significant at all horizons of 2 to 5 years remain also robust (Table A6).
Furthermore, the result that the interaction of persistent deviations of inflation from
target with the ELB are insignificant in AEs also remain robust to excluding observations
where the inflation target is greater than 10% (Table A6).
Fourth, we address concerns about the lag structure. Formally, we replace the one-
period lag of the lagged dependent variable for deviations of long-term inflation
15
expectations from target in Tables 1 to 5 by a five-year lag, in order to remove any overlap
of the horizon for the lagged long-term inflation expectations with the current long-term
inflation expectations used as left-hand side variable (Tables A7 to A11). We find that
when doing so, the coefficient on the lag of the dependent variable becomes smaller and
insignificant at all horizons for both EMEs and AEs, as would be expected, but otherwise
the results tend to remain similar. The coefficient on the interaction of deviations of short-
term inflation expectations from target with the post-crisis dummy remains insignificant
for both EMEs and AEs (Table A7), consistent with the results in Table 1, suggesting that
long-term inflation expectations have not become better anchored after the crisis. The
coefficient on the interaction of deviations of short-term inflation expectations from
target with the ELB remains insignificant for AEs, again suggesting that long-term
inflation expectations anchoring did not change at the ELB in AEs (Table A8). However,
the coefficient on the interaction of deviations of short-term inflation expectations from
target with the ELB remains negative and becomes significant for EMEs, suggesting that
long-term inflation expectations became better anchored at the ELB in EMEs (Table A8).
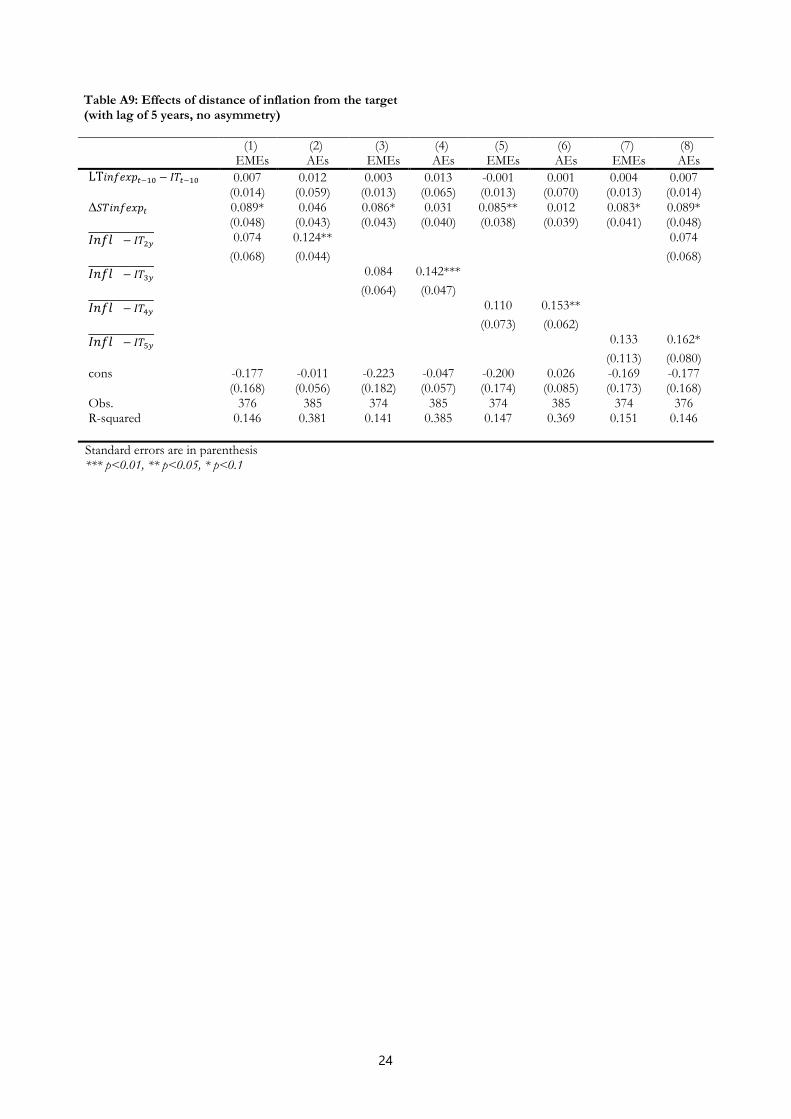
The coefficient on persistent deviations of inflation from target remains significant for
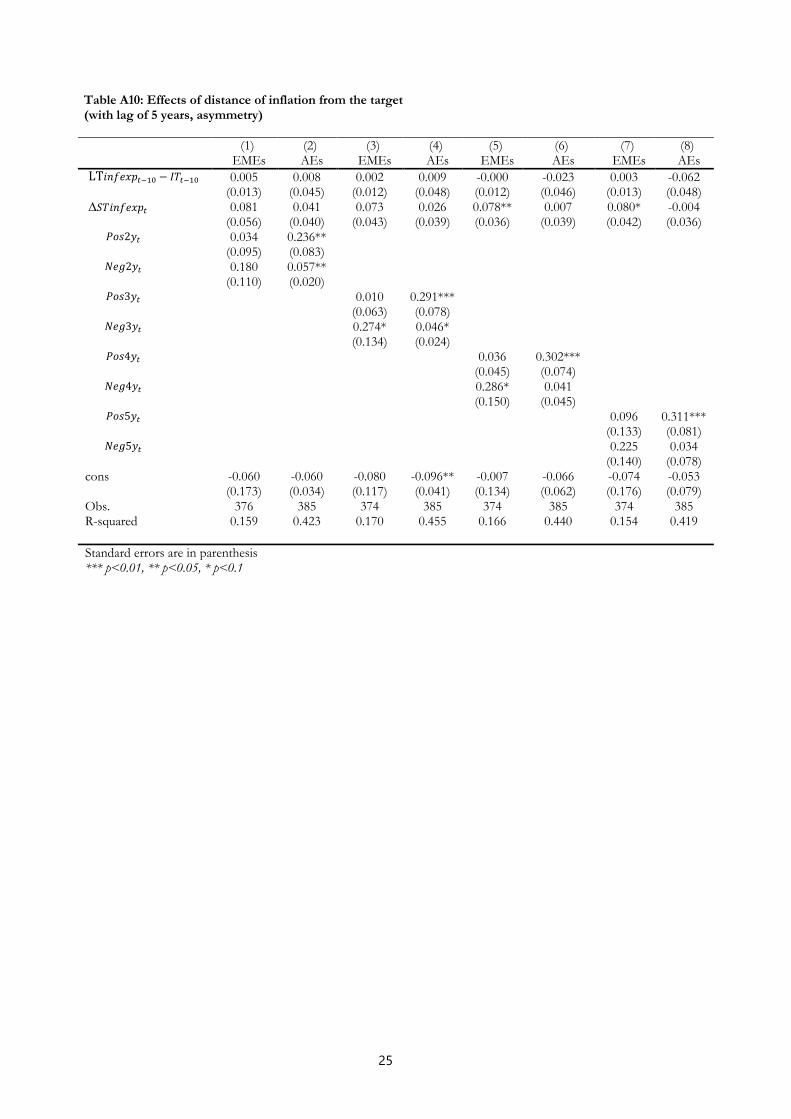
AEs at all horizons (Table A9), consistent with the results of Table 3. The effects of positive
persistent deviations of inflation from target remain significant for AEs at all horizons
(Table A10), consistent with the results of Table 4. The coefficients on negative persistent
deviations of inflation from target remain smaller than those for positive ones for AEs,
but now become slightly larger and significant at horizons of two and three years (Table
A10). Again, the ELB does not significantly affect the effect of persistent deviations of
inflation from target for AEs (Table A11), consistent with Table 5.
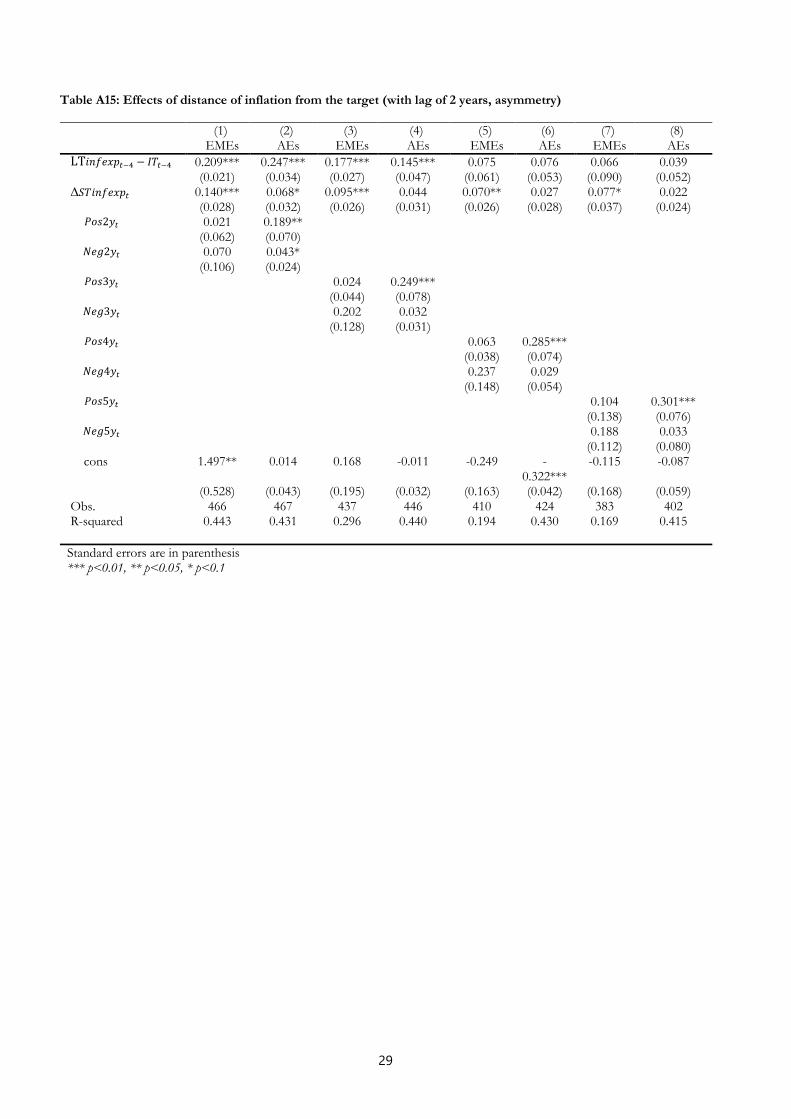
Fifth, we replace the one-period lag of the lagged dependent variable for deviations
of long-term inflation expectations from target in Tables 1 to 5 by a two-year lag. The
results are shown in Tables A12 to A16. We can see that the results of Tables 1 to 5 are
generally robust to this modification.
Finally, we check that the use of time fixed effects is not critical for our result by re-
estimating the regressions in Table 1. Our coefficient estimates remain robust to the
exclusion of time fixed effect (Table A17).
16
5. Conclusions
We studied the anchoring properties of long-term inflation expectations in emerging and
advanced economies, as a measure of monetary policy credibility, by considering the
effects of short-term expectations on long-term inflation expectations. We found that
long-term inflation expectations are less-well anchored in EMEs than in AEs for the period
1996-2019, and that the degree of anchoring is not significantly different post-crisis or at
the ELB.
We also found that persistent deviations of inflation from target affect long-term
inflation expectations in advanced economies, but that this is not stronger at the ELB.
Moreover, we found evidence for asymmetry, with positive persistent deviations of
inflation from target affecting long-term inflation expectations more than negative
deviations for advanced economies. These results suggest that persistent deviations of
inflation from target have the potential to de-anchor long-term inflation expectations
and therefore warrant close monitoring by policymakers, in particular for positive
persistent deviations of inflation from target.
Our results suggest that long-term inflation expectations have remained well-
anchored in advanced economies at the ELB, suggesting that central bank credibility has
not been adversely affected by the ELB.
17
References
Apokoritis, N., Galati, G., Moessner, R. and F. Teppa (2019), “Inflation expectations anchoring: new insights from micro evidence of a survey at high-frequency and of distributions”, DNB Working Paper No. 809.
Bems, R., Caselli, F., Grigoli, F., Gruss, B. and W. Lian (2018), “Expectations' anchoring and inflation persistence”, IMF Working Paper No. 18/280.
Buono, I. and S. Formai (2018), “The evolution of the anchoring of inflation expectations”, Journal of Macroeconomics 57(3), 39-54.
Cecchetti, S., Natoli, F. and L. Sigalotti (2015), “Tail comovement in option-implied inflation expectations as an indicator of anchoring.” Banca d’Italia Temi di discussion No. 1025, July.
Coeuré, B. (2019), “Inflation expectations and the conduct of monetary policy”, speech at an event organised by the SAFE Policy Center, Frankfurt am Main, 11 July.
Ehrmann, M. (2015), “Targeting inflation from below: How do inflation expectations behave?”, International Journal of Central Banking 11(S1), 213-49.
Galati, G., Gorgi, Z., Moessner, R. and C. Zhou (2018), “Deflation risk in the euro area and central bank credibility”, Economics Letters 167, 124-126.
Galati, G., Poelhekke, S. and C. Zhou (2011), “Did the crisis affect inflation expectations?”, International Journal of Central Banking, 7(1), 167-207.
IMF (2016): World Economic Outlook, October, Chapter 3.
IMF (2018): World Economic Outlook, October, Chapter 3.
Jašová, M., Moessner, R. and Takáts, E. (2019). “Exchange rate pass-through: What has changed since the crisis?”, International Journal of Central Banking 15(3), 27–58.
Jašová, M., Moessner, R. and Takáts, E. (2020). “Domestic and global output gaps as inflation drivers: what does the Phillips curve tell?”, Economic Modelling 87, 238-253.
Kose, A., Matsuoka, H., Panizza, U. and D. Vorisek (2019), “Inflation expectations: review and evidence”, World Bank Policy Research Working Paper no 8785.
Mehrotra, A. and J. Yetman (2018), “Decaying expectations: What inflation forecasts tell us about the anchoring of inflation expectations”, International Journal of Central Banking 11(S1), 55-101.
Natoli, F. and L. Sigalotti (2018), “Tail co-movement in inflation expectations as an indicator of anchoring”, International Journal of Central Banking 14, 35–71.
Scharnagl, M. and J. Stapf (2015), “Inflation, deflation, and uncertainty: What drives euro area option-implied inflation expectations and are they still anchored in the sovereign debt crisis?” Econonomic Modelling 48, 248–269.
Yetman, J. (2020), “Pass-through from short-term to long-term inflation expectations, and the anchoring of inflation expectations”, manuscript.
18
Appendix A: Robustness check tables
Table A1: Effects of distance of inflation from the target (asymmetry, ELB) (1) (2) (3) (4) (5) (6) (7) (8) EMEs AEs EMEs AEs EMEs AEs EMEs AEs
LT𝑖𝑖𝑖𝑖𝑖𝑖𝑖𝑖𝑖𝑖𝑖𝑖𝑖𝑖−1 − 𝐼𝐼𝑆𝑆𝑖𝑖−1 0.666*** 0.552*** 0.606*** 0.522*** 0.688*** 0.514*** 0.669*** 0.517*** (0.067) (0.051) (0.079) (0.057) (0.089) (0.065) (0.113) (0.074) ∆𝑆𝑆𝑆𝑆𝑖𝑖𝑖𝑖𝑖𝑖𝑖𝑖𝑖𝑖𝑖𝑖𝑖𝑖 0.035 0.050* 0.043 0.032 0.040 0.020 0.034 0.023 (0.026) (0.028) (0.026) (0.026) (0.027) (0.026) (0.025) (0.025) 𝐸𝐸𝐿𝐿𝐸𝐸𝑖𝑖 0.045 0.015 -0.064 0.009 -0.064** 0.030 0.068 0.037 (0.105) (0.036) (0.050) (0.038) (0.030) (0.038) (0.074) (0.035)
𝑃𝑃𝑝𝑝𝑝𝑝2𝑦𝑦𝑖𝑖 -0.011 0.092 (0.033) (0.053) 𝑃𝑃𝑝𝑝𝑝𝑝2𝑦𝑦𝑖𝑖 ∗ 𝐸𝐸𝐿𝐿𝐸𝐸𝑖𝑖 -0.084 0.044 (0.069) (0.038) 𝑁𝑁𝑖𝑖𝑁𝑁2𝑦𝑦𝑖𝑖 0.038 0.024*
(0.048) (0.013) 𝑁𝑁𝑖𝑖𝑁𝑁2𝑦𝑦𝑖𝑖 ∗ 𝐸𝐸𝐿𝐿𝐸𝐸𝑖𝑖 0.048 -0.014
(0.072) (0.038) 𝑃𝑃𝑝𝑝𝑝𝑝3𝑦𝑦𝑖𝑖 0.027* 0.112*
(0.015) (0.056) 𝑃𝑃𝑝𝑝𝑝𝑝3𝑦𝑦𝑖𝑖 ∗ 𝐸𝐸𝐿𝐿𝐸𝐸𝑖𝑖 -0.102 0.057
(0.072) (0.063) 𝑁𝑁𝑖𝑖𝑁𝑁3𝑦𝑦𝑖𝑖 0.108* 0.042*
(0.058) (0.022) 𝑁𝑁𝑖𝑖𝑁𝑁3𝑦𝑦𝑖𝑖 ∗ 𝐸𝐸𝐿𝐿𝐸𝐸𝑖𝑖 -0.014 -0.031
(0.060) (0.040) 𝑃𝑃𝑝𝑝𝑝𝑝4𝑦𝑦𝑖𝑖 0.021 0.125**
(0.026) (0.047) 𝑃𝑃𝑝𝑝𝑝𝑝4𝑦𝑦𝑖𝑖 ∗ 𝐸𝐸𝐿𝐿𝐸𝐸𝑖𝑖 -0.162** 0.026
(0.073) (0.055) 𝑁𝑁𝑖𝑖𝑁𝑁4𝑦𝑦𝑖𝑖 0.084 0.036
(0.053) (0.032) 𝑁𝑁𝑖𝑖𝑁𝑁4𝑦𝑦𝑖𝑖 ∗ 𝐸𝐸𝐿𝐿𝐸𝐸𝑖𝑖 -0.031 -0.017
(0.064) (0.036) 𝑃𝑃𝑝𝑝𝑝𝑝5𝑦𝑦𝑖𝑖 0.018 0.117**
(0.062) (0.049) 𝑃𝑃𝑝𝑝𝑝𝑝5𝑦𝑦𝑖𝑖 ∗ 𝐸𝐸𝐿𝐿𝐸𝐸𝑖𝑖 -0.320** 0.021
(0.142) (0.058) 𝑁𝑁𝑖𝑖𝑁𝑁5𝑦𝑦𝑖𝑖 0.049 0.041
(0.050) (0.041) 𝑁𝑁𝑖𝑖𝑁𝑁5𝑦𝑦𝑖𝑖∗ 𝐸𝐸𝐿𝐿𝐸𝐸𝑖𝑖
0.114 -0.007
(0.126) (0.041) cons 0.468 -0.094** 0.165 -0.012 -0.200** 0.017 0.039 -0.021 (0.503) (0.043) (0.315) (0.019) (0.072) (0.034) (0.124) (0.022) Obs. 464 477 434 455 405 433 380 411 R-squared 0.556 0.586 0.530 0.602 0.560 0.593 0.570 0.588 Standard errors are in parenthesis *** p<0.01, ** p<0.05, * p<0.1
19
Table A2: Effects of distance of inflation from the target (excluding Japan, asymmetry)
(1) (2) (3) (4) (5) (6) (7) (8) EMEs AEs EMEs AEs EMEs AEs EMEs AEs
LT𝑖𝑖𝑖𝑖𝑖𝑖𝑖𝑖𝑖𝑖𝑖𝑖𝑖𝑖−1 − 𝐼𝐼𝑆𝑆𝑖𝑖−1 0.666*** 0.552*** 0.606*** 0.518*** 0.688*** 0.514*** 0.669*** 0.517*** (0.067) (0.053) (0.079) (0.060) (0.089) (0.067) (0.113) (0.074) ∆𝑆𝑆𝑆𝑆𝑖𝑖𝑖𝑖𝑖𝑖𝑖𝑖𝑖𝑖𝑖𝑖𝑖𝑖 0.035 0.044 0.043 0.035 0.040 0.022 0.034 0.023 (0.026) (0.028) (0.026) (0.026) (0.027) (0.026) (0.025) (0.025) 𝐸𝐸𝐿𝐿𝐸𝐸𝑖𝑖 0.045 0.016 -0.064 0.011 -0.064** 0.030 0.068 0.037 (0.105) (0.037) (0.050) (0.041) (0.030) (0.040) (0.074) (0.035) 𝑃𝑃𝑝𝑝𝑝𝑝2𝑦𝑦𝑖𝑖 -0.011 0.089 (0.033) (0.054) 𝑃𝑃𝑝𝑝𝑝𝑝2𝑦𝑦𝑖𝑖 ∗ 𝐸𝐸𝐿𝐿𝐸𝐸𝑖𝑖 -0.084 0.047
(0.069) (0.038) 𝑁𝑁𝑖𝑖𝑁𝑁2𝑦𝑦𝑖𝑖 0.038 0.031*** (0.048) (0.009) 𝑁𝑁𝑖𝑖𝑁𝑁2𝑦𝑦𝑖𝑖 ∗ 𝐸𝐸𝐿𝐿𝐸𝐸𝑖𝑖 0.048 -0.027
(0.072) (0.035) 𝑃𝑃𝑝𝑝𝑝𝑝3𝑦𝑦𝑖𝑖 0.027* 0.113*
(0.015) (0.058) 𝑃𝑃𝑝𝑝𝑝𝑝3𝑦𝑦𝑖𝑖 ∗ 𝐸𝐸𝐿𝐿𝐸𝐸𝑖𝑖 -0.102 0.058
(0.072) (0.066) 𝑁𝑁𝑖𝑖𝑁𝑁3𝑦𝑦𝑖𝑖 0.108* 0.041* (0.058) (0.022) 𝑁𝑁𝑖𝑖𝑁𝑁3𝑦𝑦𝑖𝑖 ∗ 𝐸𝐸𝐿𝐿𝐸𝐸𝑖𝑖 -0.014 -0.035
(0.060) (0.041) 𝑃𝑃𝑝𝑝𝑝𝑝4𝑦𝑦𝑖𝑖 0.021 0.125**
(0.026) (0.048) 𝑃𝑃𝑝𝑝𝑝𝑝4𝑦𝑦𝑖𝑖 ∗ 𝐸𝐸𝐿𝐿𝐸𝐸𝑖𝑖 -0.162** 0.026
(0.073) (0.056) 𝑁𝑁𝑖𝑖𝑁𝑁4𝑦𝑦𝑖𝑖 0.084 0.036 (0.053) (0.032) 𝑁𝑁𝑖𝑖𝑁𝑁4𝑦𝑦𝑖𝑖 ∗ 𝐸𝐸𝐿𝐿𝐸𝐸𝑖𝑖 -0.031 -0.019
(0.064) (0.036) 𝑃𝑃𝑝𝑝𝑝𝑝5𝑦𝑦𝑖𝑖 0.018 0.117**
(0.062) (0.049) 𝑃𝑃𝑝𝑝𝑝𝑝5𝑦𝑦𝑖𝑖 ∗ 𝐸𝐸𝐿𝐿𝐸𝐸𝑖𝑖 -0.320** 0.021
(0.142) (0.058) 𝑁𝑁𝑖𝑖𝑁𝑁5𝑦𝑦𝑖𝑖 0.049 0.041 (0.050) (0.041) 𝑁𝑁𝑖𝑖𝑁𝑁5𝑦𝑦𝑖𝑖 ∗ 𝐸𝐸𝐿𝐿𝐸𝐸𝑖𝑖 0.114 -0.007
(0.126) (0.041) cons 0.468 -0.076* 0.165 -0.005 -0.200** 0.022 0.039 -0.017 (0.503) (0.042) (0.315) (0.019) (0.072) (0.034) (0.124) (0.023) Obs. 464 466 434 446 405 426 380 406 R-squared 0.556 0.593 0.530 0.601 0.560 0.594 0.570 0.589 Standard errors are in parenthesis *** p<0.01, ** p<0.05, * p<0.1
20
Table A3: Effects of distance of inflation from the target (excluding Japan, no asymmetry, interaction with ELB dummy)
(1) (2) (3) (4) (5) (6) (7) (8) EMEs AEs EMEs AEs EMEs AEs EMEs AEs
LT𝑖𝑖𝑖𝑖𝑖𝑖𝑖𝑖𝑖𝑖𝑖𝑖𝑖𝑖−1 − 𝐼𝐼𝑆𝑆𝑖𝑖−1 0.629*** 0.576*** 0.594*** 0.559*** 0.633*** 0.557*** 0.670*** 0.548***
(0.036) (0.054) (0.057) (0.068) (0.078) (0.082) (0.096) (0.090) ∆𝑆𝑆𝑆𝑆𝑖𝑖𝑖𝑖𝑖𝑖𝑖𝑖𝑖𝑖𝑖𝑖𝑖𝑖 0.032 0.045 0.043 0.038 0.037 0.023 0.050* 0.024 (0.026) (0.027) (0.027) (0.026) (0.028) (0.027) (0.028) (0.025) 𝐸𝐸𝐿𝐿𝐸𝐸𝑖𝑖 -0.055 0.043 -0.122*** 0.040 -0.122*** 0.040 -0.084 0.043 (0.054) (0.036) (0.038) (0.038) (0.036) (0.039) (0.050) (0.037) 𝐼𝐼𝑖𝑖𝑖𝑖𝐼𝐼 − 𝐼𝐼𝑆𝑆2𝑛𝑛 0.010 0.052* (0.028) (0.025) 𝐼𝐼𝑖𝑖𝑖𝑖𝐼𝐼 − 𝐼𝐼𝑆𝑆2𝑛𝑛 ∗ 𝐸𝐸𝐿𝐿𝐸𝐸𝑖𝑖 -0.038 -0.012 (0.045) (0.028) 𝐼𝐼𝑖𝑖𝑖𝑖𝐼𝐼 − 𝐼𝐼𝑆𝑆3𝑛𝑛 0.046** 0.069** (0.020) (0.026) 𝐼𝐼𝑖𝑖𝑖𝑖𝐼𝐼 − 𝐼𝐼𝑆𝑆3𝑛𝑛 ∗ 𝐸𝐸𝐿𝐿𝐸𝐸𝑖𝑖 -0.054 -0.023 (0.056) (0.029) 𝐼𝐼𝑖𝑖𝑖𝑖𝐼𝐼 − 𝐼𝐼𝑆𝑆4𝑛𝑛 0.050 0.074** (0.036) (0.032) 𝐼𝐼𝑖𝑖𝑖𝑖𝐼𝐼 − 𝐼𝐼𝑆𝑆4𝑛𝑛 ∗ 𝐸𝐸𝐿𝐿𝐸𝐸𝑖𝑖 -0.094 -0.025 (0.057) (0.030) 𝐼𝐼𝑖𝑖𝑖𝑖𝐼𝐼 − 𝐼𝐼𝑆𝑆5𝑛𝑛 0.056 0.076** (0.062) (0.035) 𝐼𝐼𝑖𝑖𝑖𝑖𝐼𝐼 − 𝐼𝐼𝑆𝑆5𝑛𝑛 ∗ 𝐸𝐸𝐿𝐿𝐸𝐸𝑖𝑖 -0.131* -0.014 (0.067) (0.029) cons 0.376 -0.058 0.099 0.021 -0.253*** 0.081* 0.007 0.015 (0.477) (0.042) (0.306) (0.028) (0.046) (0.045) (0.103) (0.029) Obs. 474 466 442 446 413 426 388 406 R-squared 0.674 0.583 0.569 0.590 0.530 0.584 0.533 0.584 Standard errors are in parenthesis *** p<0.01, ** p<0.05, * p<0.1

21
Table A4: Effects of distance of short-term inflation expectation from inflation target (excluding observations with inflation target greater than 10%)
(1) (2) (3) (4) EMEs AEs EMEs AEs
LT𝑖𝑖𝑖𝑖𝑖𝑖𝑖𝑖𝑖𝑖𝑖𝑖𝑖𝑖−1 − 𝐼𝐼𝑆𝑆𝑖𝑖−1 0.552*** 0.531*** 0.551*** 0.531*** (0.052) (0.050) (0.053) (0.051) 𝑆𝑆𝑆𝑆𝑖𝑖𝑖𝑖𝑖𝑖𝑖𝑖𝑖𝑖𝑖𝑖𝑖𝑖 − 𝐼𝐼𝑆𝑆𝑖𝑖 0.172*** 0.106*** 0.176*** 0.107** (0.026) (0.029) (0.049) (0.042) (𝑆𝑆𝑆𝑆𝑖𝑖𝑖𝑖𝑖𝑖𝑖𝑖𝑖𝑖𝑖𝑖𝑖𝑖 − 𝐼𝐼𝑆𝑆𝑖𝑖) ∗ 𝑃𝑃𝑝𝑝𝑝𝑝𝑝𝑝𝑖𝑖 -0.007 -0.001 (0.042) (0.036) 𝑃𝑃𝑝𝑝𝑝𝑝𝑝𝑝𝑖𝑖 1.576*** -0.083 (0.259) (0.054) cons -1.595*** 0.050 -1.585*** 0.050 (0.237) (0.041) (0.235) (0.041) Obs. 502 509 502 509 R-squared 0.699 0.608 0.699 0.608 Post-crisis dummy No No Yes Yes Standard errors are in parenthesis *** p<0.01, ** p<0.05, * p<0.1
Table A5: Effects of distance of short-term inflation expectation from inflation target (excluding observations with inflation target greater than 10%)
(1) (2) (3) (4) EMEs AEs EMEs AEs
LT𝑖𝑖𝑖𝑖𝑖𝑖𝑖𝑖𝑖𝑖𝑖𝑖𝑖𝑖−1 − 𝐼𝐼𝑆𝑆𝑖𝑖−1 0.552*** 0.531*** 0.551*** 0.513*** (0.052) (0.050) (0.053) (0.051) 𝑆𝑆𝑆𝑆𝑖𝑖𝑖𝑖𝑖𝑖𝑖𝑖𝑖𝑖𝑖𝑖𝑖𝑖 − 𝐼𝐼𝑆𝑆𝑖𝑖 0.172*** 0.106*** 0.172*** 0.112*** (0.026) (0.029) (0.027) (0.036) (𝑆𝑆𝑆𝑆𝑖𝑖𝑖𝑖𝑖𝑖𝑖𝑖𝑖𝑖𝑖𝑖𝑖𝑖 − 𝐼𝐼𝑆𝑆𝑖𝑖) ∗ 𝐸𝐸𝐿𝐿𝐸𝐸𝑖𝑖 -0.071 0.002 (0.064) (0.030) 𝐸𝐸𝐿𝐿𝐸𝐸𝑖𝑖 -0.050 0.048 (0.088) (0.028) cons -1.595*** 0.050 -1.595*** 0.060 (0.237) (0.041) (0.238) (0.041) Obs. 502 509 502 509 R-squared 0.699 0.608 0.699 0.613 Post-crisis dummy No No Yes Yes Standard errors are in parenthesis *** p<0.01, ** p<0.05, * p<0.1

22
Table A6: Effects of distance of inflation from the target (excluding observations with inflation target greater than 10%, no asymmetry, interaction with ELB dummy)
(1) (2) (3) (4) (5) (6) (7) (8) EMEs AEs EMEs AEs EMEs AEs EMEs AEs
LT𝑖𝑖𝑖𝑖𝑖𝑖𝑖𝑖𝑖𝑖𝑖𝑖𝑖𝑖−1 − 𝐼𝐼𝑆𝑆𝑖𝑖−1 0.664*** 0.578*** 0.607*** 0.562*** 0.690*** 0.556*** 0.670*** 0.548*** (0.068) (0.053) (0.081) (0.065) (0.091) (0.080) (0.114) (0.089) ∆𝑆𝑆𝑆𝑆𝑖𝑖𝑖𝑖𝑖𝑖𝑖𝑖𝑖𝑖𝑖𝑖𝑖𝑖 0.037 0.052* 0.046 0.035 0.042 0.021 0.035 0.024 (0.025) (0.028) (0.026) (0.026) (0.028) (0.027) (0.024) (0.025) 𝐸𝐸𝐿𝐿𝐸𝐸𝑖𝑖 -0.051 0.038 -
0.126*** 0.037 -
0.126*** 0.040 -0.084 0.042
(0.059) (0.034) (0.042) (0.036) (0.037) (0.038) (0.052) (0.036) 𝐼𝐼𝑖𝑖𝑖𝑖𝐼𝐼 − 𝐼𝐼𝑆𝑆2𝑛𝑛 0.002 0.049* (0.026) (0.024) 𝐼𝐼𝑖𝑖𝑖𝑖𝐼𝐼 − 𝐼𝐼𝑆𝑆2𝑛𝑛 ∗ 𝐸𝐸𝐿𝐿𝐸𝐸𝑖𝑖 -0.037 -0.006 (0.046) (0.028) 𝐼𝐼𝑖𝑖𝑖𝑖𝐼𝐼 − 𝐼𝐼𝑆𝑆3𝑛𝑛 0.049** 0.069** (0.022) (0.025) 𝐼𝐼𝑖𝑖𝑖𝑖𝐼𝐼 − 𝐼𝐼𝑆𝑆3𝑛𝑛 ∗ 𝐸𝐸𝐿𝐿𝐸𝐸𝑖𝑖 -0.060 -0.021 (0.053) (0.029) 𝐼𝐼𝑖𝑖𝑖𝑖𝐼𝐼 − 𝐼𝐼𝑆𝑆4𝑛𝑛 0.039 0.074** (0.031) (0.032) 𝐼𝐼𝑖𝑖𝑖𝑖𝐼𝐼 − 𝐼𝐼𝑆𝑆4𝑛𝑛 ∗ 𝐸𝐸𝐿𝐿𝐸𝐸𝑖𝑖 -0.105* -0.024 (0.054) (0.030) 𝐼𝐼𝑖𝑖𝑖𝑖𝐼𝐼 − 𝐼𝐼𝑆𝑆5𝑛𝑛 0.028 0.076** (0.042) (0.034) 𝐼𝐼𝑖𝑖𝑖𝑖𝐼𝐼 − 𝐼𝐼𝑆𝑆5𝑛𝑛 ∗ 𝐸𝐸𝐿𝐿𝐸𝐸𝑖𝑖 -0.148* -0.014 (0.078) (0.028) cons 0.417 -0.072 0.105 0.013 -
0.251*** 0.077 0.017 0.011
(0.474) (0.041) (0.316) (0.028) (0.045) (0.045) (0.119) (0.029) Obs. 464 477 434 455 405 433 380 411 R-squared 0.555 0.577 0.527 0.591 0.559 0.584 0.569 0.583 Standard errors are in parenthesis *** p<0.01, ** p<0.05, * p<0.1

23
Table A7: Effects of distance of short-term inflation expectation from inflation target (with lag of 5 years)
(1) (2) (3) (4) EMEs AEs EMEs AEs
LT𝑖𝑖𝑖𝑖𝑖𝑖𝑖𝑖𝑖𝑖𝑖𝑖𝑖𝑖−10 − 𝐼𝐼𝑆𝑆𝑖𝑖−10 0.001 -0.030 0.002 -0.023 (0.015) (0.072) (0.028) (0.078) 𝑆𝑆𝑆𝑆𝑖𝑖𝑖𝑖𝑖𝑖𝑖𝑖𝑖𝑖𝑖𝑖𝑖𝑖 − 𝐼𝐼𝑆𝑆𝑖𝑖 0.247*** 0.176** 0.259 0.217* (0.063) (0.061) (0.170) (0.103) (𝑆𝑆𝑆𝑆𝑖𝑖𝑖𝑖𝑖𝑖𝑖𝑖𝑖𝑖𝑖𝑖𝑖𝑖 − 𝐼𝐼𝑆𝑆𝑖𝑖) ∗ 𝑃𝑃𝑝𝑝𝑝𝑝𝑝𝑝𝑖𝑖 -0.014 -0.065 (0.154) (0.087) 𝑃𝑃𝑝𝑝𝑝𝑝𝑝𝑝𝑖𝑖 0.261 -0.143 (0.272) (0.081) cons -0.311* 0.046 -0.305 0.058 (0.160) (0.061) (0.182) (0.066) Obs. 378 385 378 385 R-squared 0.370 0.409 0.370 0.415 Post-crisis dummy No No Yes Yes Standard errors are in parenthesis *** p<0.01, ** p<0.05, * p<0.1
Table A8: Effects of distance of short-term inflation expectation from inflation target (with lag of 5 years)
(1) (2) (3) (4) EMEs AEs EMEs AEs
LT𝑖𝑖𝑖𝑖𝑖𝑖𝑖𝑖𝑖𝑖𝑖𝑖𝑖𝑖−10 − 𝐼𝐼𝑆𝑆𝑖𝑖−10 0.001 -0.030 0.001 0.003 (0.015) (0.072) (0.015) (0.060) 𝑆𝑆𝑆𝑆𝑖𝑖𝑖𝑖𝑖𝑖𝑖𝑖𝑖𝑖𝑖𝑖𝑖𝑖 − 𝐼𝐼𝑆𝑆𝑖𝑖 0.247*** 0.176** 0.248*** 0.182** (0.063) (0.061) (0.063) (0.071) (𝑆𝑆𝑆𝑆𝑖𝑖𝑖𝑖𝑖𝑖𝑖𝑖𝑖𝑖𝑖𝑖𝑖𝑖 − 𝐼𝐼𝑆𝑆𝑖𝑖) ∗ 𝐸𝐸𝐿𝐿𝐸𝐸𝑖𝑖 -0.209** -0.006 (0.085) (0.038) 𝐸𝐸𝐿𝐿𝐸𝐸𝑖𝑖 -0.012 0.121* (0.082) (0.058) cons -0.311* 0.046 -0.314* 0.012 (0.160) (0.061) (0.160) (0.051) Obs. 378 385 378 385 R-squared 0.370 0.409 0.372 0.451 Post-crisis dummy No No Yes Yes Standard errors are in parenthesis *** p<0.01, ** p<0.05, * p<0.1
24
Table A9: Effects of distance of inflation from the target (with lag of 5 years, no asymmetry)
(1) (2) (3) (4) (5) (6) (7) (8) EMEs AEs EMEs AEs EMEs AEs EMEs AEs
LT𝑖𝑖𝑖𝑖𝑖𝑖𝑖𝑖𝑖𝑖𝑖𝑖𝑖𝑖−10 − 𝐼𝐼𝑆𝑆𝑖𝑖−10 0.007 0.012 0.003 0.013 -0.001 0.001 0.004 0.007 (0.014) (0.059) (0.013) (0.065) (0.013) (0.070) (0.013) (0.014) ∆𝑆𝑆𝑆𝑆𝑖𝑖𝑖𝑖𝑖𝑖𝑖𝑖𝑖𝑖𝑖𝑖𝑖𝑖 0.089* 0.046 0.086* 0.031 0.085** 0.012 0.083* 0.089* (0.048) (0.043) (0.043) (0.040) (0.038) (0.039) (0.041) (0.048) 𝐼𝐼𝑖𝑖𝑖𝑖𝐼𝐼 − 𝐼𝐼𝑆𝑆2𝑛𝑛 0.074 0.124** 0.074 (0.068) (0.044) (0.068) 𝐼𝐼𝑖𝑖𝑖𝑖𝐼𝐼 − 𝐼𝐼𝑆𝑆3𝑛𝑛 0.084 0.142*** (0.064) (0.047) 𝐼𝐼𝑖𝑖𝑖𝑖𝐼𝐼 − 𝐼𝐼𝑆𝑆4𝑛𝑛 0.110 0.153** (0.073) (0.062) 𝐼𝐼𝑖𝑖𝑖𝑖𝐼𝐼 − 𝐼𝐼𝑆𝑆5𝑛𝑛 0.133 0.162* (0.113) (0.080) cons -0.177 -0.011 -0.223 -0.047 -0.200 0.026 -0.169 -0.177 (0.168) (0.056) (0.182) (0.057) (0.174) (0.085) (0.173) (0.168) Obs. 376 385 374 385 374 385 374 376 R-squared 0.146 0.381 0.141 0.385 0.147 0.369 0.151 0.146 Standard errors are in parenthesis *** p<0.01, ** p<0.05, * p<0.1
25
Table A10: Effects of distance of inflation from the target (with lag of 5 years, asymmetry)
(1) (2) (3) (4) (5) (6) (7) (8) EMEs AEs EMEs AEs EMEs AEs EMEs AEs
LT𝑖𝑖𝑖𝑖𝑖𝑖𝑖𝑖𝑖𝑖𝑖𝑖𝑖𝑖−10 − 𝐼𝐼𝑆𝑆𝑖𝑖−10 0.005 0.008 0.002 0.009 -0.000 -0.023 0.003 -0.062 (0.013) (0.045) (0.012) (0.048) (0.012) (0.046) (0.013) (0.048) ∆𝑆𝑆𝑆𝑆𝑖𝑖𝑖𝑖𝑖𝑖𝑖𝑖𝑖𝑖𝑖𝑖𝑖𝑖 0.081 0.041 0.073 0.026 0.078** 0.007 0.080* -0.004 (0.056) (0.040) (0.043) (0.039) (0.036) (0.039) (0.042) (0.036)
𝑃𝑃𝑝𝑝𝑝𝑝2𝑦𝑦𝑖𝑖 0.034 0.236** (0.095) (0.083)
𝑁𝑁𝑖𝑖𝑁𝑁2𝑦𝑦𝑖𝑖 0.180 0.057** (0.110) (0.020)
𝑃𝑃𝑝𝑝𝑝𝑝3𝑦𝑦𝑖𝑖 0.010 0.291*** (0.063) (0.078)
𝑁𝑁𝑖𝑖𝑁𝑁3𝑦𝑦𝑖𝑖 0.274* 0.046* (0.134) (0.024)
𝑃𝑃𝑝𝑝𝑝𝑝4𝑦𝑦𝑖𝑖 0.036 0.302*** (0.045) (0.074)
𝑁𝑁𝑖𝑖𝑁𝑁4𝑦𝑦𝑖𝑖 0.286* 0.041 (0.150) (0.045)
𝑃𝑃𝑝𝑝𝑝𝑝5𝑦𝑦𝑖𝑖 0.096 0.311*** (0.133) (0.081)
𝑁𝑁𝑖𝑖𝑁𝑁5𝑦𝑦𝑖𝑖 0.225 0.034 (0.140) (0.078) cons -0.060 -0.060 -0.080 -0.096** -0.007 -0.066 -0.074 -0.053 (0.173) (0.034) (0.117) (0.041) (0.134) (0.062) (0.176) (0.079) Obs. 376 385 374 385 374 385 374 385 R-squared 0.159 0.423 0.170 0.455 0.166 0.440 0.154 0.419 Standard errors are in parenthesis *** p<0.01, ** p<0.05, * p<0.1

26
Table A11: Effects of distance of inflation from the target (with lag of 5 years, no asymmetry, interaction with ELB dummy)
(1) (2) (3) (4) (5) (6) (7) (8) EMEs AEs EMEs AEs EMEs AEs EMEs AEs
LT𝑖𝑖𝑖𝑖𝑖𝑖𝑖𝑖𝑖𝑖𝑖𝑖𝑖𝑖−10 − 𝐼𝐼𝑆𝑆𝑖𝑖−10 0.007 0.034 0.003 0.030 -0.001 0.016 0.004 -0.009 (0.014) (0.050) (0.013) (0.057) (0.013) (0.058) (0.013) (0.065) ∆𝑆𝑆𝑆𝑆𝑖𝑖𝑖𝑖𝑖𝑖𝑖𝑖𝑖𝑖𝑖𝑖𝑖𝑖 0.089* 0.045 0.087* 0.028 0.085** 0.009 0.083* 0.001 (0.049) (0.041) (0.043) (0.036) (0.038) (0.035) (0.041) (0.036) 𝐸𝐸𝐿𝐿𝐸𝐸𝑖𝑖 -0.055 0.086 -0.054 0.072 -0.067 0.071 -0.085* 0.082 (0.068) (0.057) (0.074) (0.057) (0.072) (0.055) (0.044) (0.050) 𝐼𝐼𝑖𝑖𝑖𝑖𝐼𝐼 − 𝐼𝐼𝑆𝑆2𝑛𝑛 0.074 0.132** (0.068) (0.056) 𝐼𝐼𝑖𝑖𝑖𝑖𝐼𝐼 − 𝐼𝐼𝑆𝑆2𝑛𝑛 ∗ 𝐸𝐸𝐿𝐿𝐸𝐸𝑖𝑖 0.001 -0.029 (0.055) (0.050) 𝐼𝐼𝑖𝑖𝑖𝑖𝐼𝐼 − 𝐼𝐼𝑆𝑆3𝑛𝑛 0.084 0.162** (0.064) (0.065) 𝐼𝐼𝑖𝑖𝑖𝑖𝐼𝐼 − 𝐼𝐼𝑆𝑆3𝑛𝑛 ∗ 𝐸𝐸𝐿𝐿𝐸𝐸𝑖𝑖 0.010 -0.057 (0.087) (0.063) 𝐼𝐼𝑖𝑖𝑖𝑖𝐼𝐼 − 𝐼𝐼𝑆𝑆4𝑛𝑛 0.110 0.171** (0.073) (0.077) 𝐼𝐼𝑖𝑖𝑖𝑖𝐼𝐼 − 𝐼𝐼𝑆𝑆4𝑛𝑛 ∗ 𝐸𝐸𝐿𝐿𝐸𝐸𝑖𝑖 0.037 -0.064 (0.114) (0.068) 𝐼𝐼𝑖𝑖𝑖𝑖𝐼𝐼 − 𝐼𝐼𝑆𝑆5𝑛𝑛 0.133 0.172* (0.113) (0.088) 𝐼𝐼𝑖𝑖𝑖𝑖𝐼𝐼 − 𝐼𝐼𝑆𝑆5𝑛𝑛 ∗ 𝐸𝐸𝐿𝐿𝐸𝐸𝑖𝑖 0.051 -0.052 (0.115) (0.065) cons -0.175 -0.034 -0.221 -0.066 -0.198 0.017 -0.165 0.014 (0.169) (0.045) (0.183) (0.049) (0.175) (0.077) (0.173) (0.087) Obs. 376 385 374 385 374 385 374 385 R-squared 0.146 0.410 0.141 0.420 0.148 0.406 0.151 0.390 Standard errors are in parenthesis *** p<0.01, ** p<0.05, * p<0.1

27
Table A12: Effects of distance of short-term inflation expectation from inflation target (with lag of 2 years)
(1) (2) (3) (4) EMEs AEs EMEs AEs
LT𝑖𝑖𝑖𝑖𝑖𝑖𝑖𝑖𝑖𝑖𝑖𝑖𝑖𝑖−4 − 𝐼𝐼𝑆𝑆𝑖𝑖−4 0.162*** 0.285*** 0.168*** 0.284*** (0.036) (0.037) (0.033) (0.035) 𝑆𝑆𝑆𝑆𝑖𝑖𝑖𝑖𝑖𝑖𝑖𝑖𝑖𝑖𝑖𝑖𝑖𝑖 − 𝐼𝐼𝑆𝑆𝑖𝑖 0.301*** 0.180*** 0.382*** 0.188*** (0.036) (0.037) (0.055) (0.058) (𝑆𝑆𝑆𝑆𝑖𝑖𝑖𝑖𝑖𝑖𝑖𝑖𝑖𝑖𝑖𝑖𝑖𝑖 − 𝐼𝐼𝑆𝑆𝑖𝑖) ∗ 𝑃𝑃𝑝𝑝𝑝𝑝𝑝𝑝𝑖𝑖 -0.127** -0.015 (0.051) (0.051) 𝑃𝑃𝑝𝑝𝑝𝑝𝑝𝑝𝑖𝑖 -0.837 -0.017 (0.506) (0.042) cons 0.789 -0.029 0.763 -0.030 (0.494) (0.030) (0.492) (0.033) Obs. 468 467 468 467 R-squared 0.530 0.491 0.540 0.492 Post-crisis dummy No No Yes Yes Standard errors are in parenthesis *** p<0.01, ** p<0.05, * p<0.1
Table A13: Effects of distance of short-term inflation expectation from inflation target (with lag of 2 years)
(1) (2) (3) (4) EMEs AEs EMEs AEs
LT𝑖𝑖𝑖𝑖𝑖𝑖𝑖𝑖𝑖𝑖𝑖𝑖𝑖𝑖−4 − 𝐼𝐼𝑆𝑆𝑖𝑖−4 0.162*** 0.285*** 0.162*** 0.276*** (0.036) (0.037) (0.036) (0.039) 𝑆𝑆𝑆𝑆𝑖𝑖𝑖𝑖𝑖𝑖𝑖𝑖𝑖𝑖𝑖𝑖𝑖𝑖 − 𝐼𝐼𝑆𝑆𝑖𝑖 0.301*** 0.180*** 0.302*** 0.186*** (0.036) (0.037) (0.036) (0.044) (𝑆𝑆𝑆𝑆𝑖𝑖𝑖𝑖𝑖𝑖𝑖𝑖𝑖𝑖𝑖𝑖𝑖𝑖 − 𝐼𝐼𝑆𝑆𝑖𝑖) ∗ 𝐸𝐸𝐿𝐿𝐸𝐸𝑖𝑖 -0.272*** 0.001 (0.088) (0.040) 𝐸𝐸𝐿𝐿𝐸𝐸𝑖𝑖 -0.022 0.093** (0.059) (0.040) cons 0.789 -0.029 0.786 -0.029 (0.494) (0.030) (0.494) (0.032) Obs. 468 467 468 467 R-squared 0.530 0.491 0.531 0.514 Post-crisis dummy No No Yes Yes Standard errors are in parenthesis *** p<0.01, ** p<0.05, * p<0.1

28
Table A14: Effects of distance of inflation from the target (with lag of 2 years, no asymmetry)
(1) (2) (3) (4) (5) (6) (7) (8) EMEs AEs EMEs AEs EMEs AEs EMEs AEs
LT𝑖𝑖𝑖𝑖𝑖𝑖𝑖𝑖𝑖𝑖𝑖𝑖𝑖𝑖−4 − 𝐼𝐼𝑆𝑆𝑖𝑖−4 0.210*** 0.281*** 0.175*** 0.204*** 0.074 0.168*** 0.070 0.126* (0.021) (0.035) (0.026) (0.039) (0.064) (0.045) (0.096) (0.061) ∆𝑆𝑆𝑆𝑆𝑖𝑖𝑖𝑖𝑖𝑖𝑖𝑖𝑖𝑖𝑖𝑖𝑖𝑖 0.143*** 0.072* 0.102*** 0.054 0.076** 0.039 0.079** 0.033 (0.027) (0.035) (0.027) (0.033) (0.029) (0.030) (0.036) (0.027) 𝐼𝐼𝑖𝑖𝑖𝑖𝐼𝐼 − 𝐼𝐼𝑆𝑆2𝑛𝑛 0.033 0.094** (0.045) (0.036) 𝐼𝐼𝑖𝑖𝑖𝑖𝐼𝐼 − 𝐼𝐼𝑆𝑆3𝑛𝑛 0.071* 0.111** (0.040) (0.042) 𝐼𝐼𝑖𝑖𝑖𝑖𝐼𝐼 − 𝐼𝐼𝑆𝑆4𝑛𝑛 0.113* 0.125* (0.060) (0.059) 𝐼𝐼𝑖𝑖𝑖𝑖𝐼𝐼 − 𝐼𝐼𝑆𝑆5𝑛𝑛 0.128 0.141* (0.114) (0.070) cons 1.439** 0.059 0.012 0.055 -0.391*** -0.255*** -0.178 0.012 (0.504) (0.038) (0.150) (0.047) (0.065) (0.041) (0.150) (0.051) Obs. 466 467 437 446 410 424 383 402 R-squared 0.442 0.402 0.286 0.388 0.186 0.367 0.167 0.359 Standard errors are in parenthesis *** p<0.01, ** p<0.05, * p<0.1
29
Table A15: Effects of distance of inflation from the target (with lag of 2 years, asymmetry)
(1) (2) (3) (4) (5) (6) (7) (8) EMEs AEs EMEs AEs EMEs AEs EMEs AEs
LT𝑖𝑖𝑖𝑖𝑖𝑖𝑖𝑖𝑖𝑖𝑖𝑖𝑖𝑖−4 − 𝐼𝐼𝑆𝑆𝑖𝑖−4 0.209*** 0.247*** 0.177*** 0.145*** 0.075 0.076 0.066 0.039 (0.021) (0.034) (0.027) (0.047) (0.061) (0.053) (0.090) (0.052) ∆𝑆𝑆𝑆𝑆𝑖𝑖𝑖𝑖𝑖𝑖𝑖𝑖𝑖𝑖𝑖𝑖𝑖𝑖 0.140*** 0.068* 0.095*** 0.044 0.070** 0.027 0.077* 0.022 (0.028) (0.032) (0.026) (0.031) (0.026) (0.028) (0.037) (0.024)
𝑃𝑃𝑝𝑝𝑝𝑝2𝑦𝑦𝑖𝑖 0.021 0.189** (0.062) (0.070)
𝑁𝑁𝑖𝑖𝑁𝑁2𝑦𝑦𝑖𝑖 0.070 0.043* (0.106) (0.024)
𝑃𝑃𝑝𝑝𝑝𝑝3𝑦𝑦𝑖𝑖 0.024 0.249*** (0.044) (0.078)
𝑁𝑁𝑖𝑖𝑁𝑁3𝑦𝑦𝑖𝑖 0.202 0.032 (0.128) (0.031)
𝑃𝑃𝑝𝑝𝑝𝑝4𝑦𝑦𝑖𝑖 0.063 0.285*** (0.038) (0.074)
𝑁𝑁𝑖𝑖𝑁𝑁4𝑦𝑦𝑖𝑖 0.237 0.029 (0.148) (0.054)
𝑃𝑃𝑝𝑝𝑝𝑝5𝑦𝑦𝑖𝑖 0.104 0.301*** (0.138) (0.076)
𝑁𝑁𝑖𝑖𝑁𝑁5𝑦𝑦𝑖𝑖 0.188 0.033 (0.112) (0.080) cons 1.497** 0.014 0.168 -0.011 -0.249 -
0.322*** -0.115 -0.087
(0.528) (0.043) (0.195) (0.032) (0.163) (0.042) (0.168) (0.059) Obs. 466 467 437 446 410 424 383 402 R-squared 0.443 0.431 0.296 0.440 0.194 0.430 0.169 0.415 Standard errors are in parenthesis *** p<0.01, ** p<0.05, * p<0.1

30
Table A16: Effects of distance of inflation from the target (with lag of 2 years, no asymmetry, interaction with ELB dummy)
(1) (2) (3) (4) (5) (6) (7) (8) EMEs AEs EMEs AEs EMEs AEs EMEs AEs
LT𝑖𝑖𝑖𝑖𝑖𝑖𝑖𝑖𝑖𝑖𝑖𝑖𝑖𝑖−4 − 𝐼𝐼𝑆𝑆𝑖𝑖−4 0.210*** 0.278*** 0.176*** 0.195*** 0.075 0.162*** 0.070 0.114 (0.021) (0.042) (0.026) (0.046) (0.064) (0.053) (0.096) (0.071) ∆𝑆𝑆𝑆𝑆𝑖𝑖𝑖𝑖𝑖𝑖𝑖𝑖𝑖𝑖𝑖𝑖𝑖𝑖 0.143*** 0.070* 0.102*** 0.049 0.076** 0.035 0.079** 0.033 (0.027) (0.034) (0.027) (0.032) (0.029) (0.029) (0.036) (0.027) 𝐸𝐸𝐿𝐿𝐸𝐸𝑖𝑖 -0.029 0.054 -0.101*** 0.054 -0.101** 0.065 -0.085 0.079 (0.069) (0.053) (0.027) (0.059) (0.043) (0.063) (0.051) (0.062) 𝐼𝐼𝑖𝑖𝑖𝑖𝐼𝐼 − 𝐼𝐼𝑆𝑆2𝑛𝑛 0.033 0.101** (0.045) (0.041) 𝐼𝐼𝑖𝑖𝑖𝑖𝐼𝐼 − 𝐼𝐼𝑆𝑆2𝑛𝑛 ∗ 𝐸𝐸𝐿𝐿𝐸𝐸𝑖𝑖 0.032 -0.020 (0.073) (0.049) 𝐼𝐼𝑖𝑖𝑖𝑖𝐼𝐼 − 𝐼𝐼𝑆𝑆3𝑛𝑛 0.071 0.125** (0.041) (0.052) 𝐼𝐼𝑖𝑖𝑖𝑖𝐼𝐼 − 𝐼𝐼𝑆𝑆3𝑛𝑛 ∗ 𝐸𝐸𝐿𝐿𝐸𝐸𝑖𝑖 0.045 -0.038 (0.115) (0.057) 𝐼𝐼𝑖𝑖𝑖𝑖𝐼𝐼 − 𝐼𝐼𝑆𝑆4𝑛𝑛 0.113* 0.138* (0.060) (0.065) 𝐼𝐼𝑖𝑖𝑖𝑖𝐼𝐼 − 𝐼𝐼𝑆𝑆4𝑛𝑛 ∗ 𝐸𝐸𝐿𝐿𝐸𝐸𝑖𝑖 0.041 -0.048 (0.119) (0.067) 𝐼𝐼𝑖𝑖𝑖𝑖𝐼𝐼 − 𝐼𝐼𝑆𝑆5𝑛𝑛 0.128 0.151* (0.114) (0.076) 𝐼𝐼𝑖𝑖𝑖𝑖𝐼𝐼 − 𝐼𝐼𝑆𝑆5𝑛𝑛 ∗ 𝐸𝐸𝐿𝐿𝐸𝐸𝑖𝑖 0.048 -0.036 (0.112) (0.067) cons 1.439** 0.066* 0.015 0.057 -
0.388*** -0.252*** -0.175 0.008
(0.505) (0.035) (0.151) (0.051) (0.065) (0.039) (0.150) (0.055) Obs. 466 467 437 446 410 424 383 402 R-squared 0.442 0.414 0.287 0.406 0.187 0.393 0.168 0.387 Standard errors are in parenthesis *** p<0.01, ** p<0.05, * p<0.1
Table A17 (Baseline without time fixed effect): Effects of distance of short-term inflation expectation from inflation target
DV: LT𝑖𝑖𝑖𝑖𝑖𝑖𝑖𝑖𝑖𝑖𝑖𝑖𝑖𝑖 − 𝐼𝐼𝑆𝑆𝑖𝑖 (1) (2) (3) (4) EMEs AEs EMEs AEs
LT𝑖𝑖𝑖𝑖𝑖𝑖𝑖𝑖𝑖𝑖𝑖𝑖𝑖𝑖−1 − 𝐼𝐼𝑆𝑆𝑖𝑖−1 0.691*** 0.571*** 0.685*** 0.572*** (0.026) (0.050) (0.031) (0.049) 𝑆𝑆𝑆𝑆𝑖𝑖𝑖𝑖𝑖𝑖𝑖𝑖𝑖𝑖𝑖𝑖𝑖𝑖 − 𝐼𝐼𝑆𝑆𝑖𝑖 0.199*** 0.074*** 0.272** 0.075** (0.041) (0.018) (0.098) (0.031) (𝑆𝑆𝑆𝑆𝑖𝑖𝑖𝑖𝑖𝑖𝑖𝑖𝑖𝑖𝑖𝑖𝑖𝑖 − 𝐼𝐼𝑆𝑆𝑖𝑖) ∗ 𝑃𝑃𝑝𝑝𝑝𝑝𝑝𝑝𝑖𝑖 -0.127 0.004 (0.089) (0.027) 𝑃𝑃𝑝𝑝𝑝𝑝𝑝𝑝𝑖𝑖 0.190** 0.011 (0.086) (0.016) cons -0.111*** 0.012** -0.224*** 0.007 (0.015) (0.004) (0.055) (0.009) Obs. 521 509 521 509 R-squared 0.779 0.517 0.783 0.517 Post crisis dummy No No Yes Yes Standard errors are in parenthesis *** p<0.01, ** p<0.05, * p<0.1

31
Appendix B: Data sources and list of abbreviations
Descriptive statistics Table B2
Variables Mean (%)
Median (%)
Minimum (%)
Maximum (%)
Standard deviation (percentage points)
Advanced economies
Long-term inflation expectation
2.04 2 0.8 2.9 0.37
Long-term inflation expectation – Inflation target
0.06 0 -0.9 0.9 0.30
Short-term inflation expectation
1.79 1.89 -0.78 4.08 0.76
Short-term inflation expectation – Inflation target
-0.18 -0.14 -1.83 1.85 0.62
Emerging economies
Long-term inflation expectation
3.43 3.1 1.3 10.5 1.17
Long-term inflation expectation – Inflation target
-0.38 0 -24.5 2.2 1.79
Short-term inflation expectation
4.26 3.57 0.22 34.32 3.04
Short-term inflation expectation – Inflation target
0.45 0.27 -3.62 13.97 1.50
Data sources Table B1
Variable Description Source
Inflation expectations
Inflation expectations Long-term (6-10 years ahead) inflation expectations, in percent;
in April and October (for CZ, HU, PL, RU and TR in March and
September until 2014H1) each year.
Short-term (one year ahead) inflation expectations interpolated
from current-year and next-year Consensus survey expectations,
in percent; in April and October (for CZ, HU, PL, RU and TR in
March and September until 2014H1) each year.
Consensus Economics
Authors’ calculations
Inflation
Consumer price index
Year-on-year changes Datastream, National
data, BIS

32
List of country abbreviations Table B3
Emerging economies (EMEs)
AR
BR
CL
CN
CO
CZ
HK
HU
ID
IN
KR
MX
MY
PE
PH
PL
RU
SG
TH
TR
Argentina
Brazil
Chile
China
Colombia
Czech Republic
Hong Kong
Hungary
Indonesia
India
South Korea
Mexico
Malaysia
Peru
Phillipines
Poland
Russia
Singapore
Thailand
Turkey
Advanced economies (AEs)
AU
CA
CH
GB
JP
NZ
SE
US
DE
FR
IT
ES
NL
Australia
Canada
Switzerland
Great Britain
Japan
New Zealand
Sweden
United States
Germany
France
Italy
Spain
Netherlands

Previous volumes in this series
868 June 2020
Debt De-risking Jannic Cutura, Gianpaolo Parise and Andreas Schrimpf
867 June 2020
The effectiveness of macroprudential policies and capital controls against volatile capital inflows
Jon Frost, Hiro Ito and René van Stralen
866 May 2020
Model risk at central counterparties: Is skin-in-the-game a game changer?
Wenqian Huang and Elod Takáts
865 May 2020
The drivers of cyber risk Iñaki Aldasoro, Leonardo Gambacorta, Paolo Giudici and Thomas Leach
864 May 2020
Global and domestic financial cycles: variations on a theme
Iñaki Aldasoro, Stefan Avdjiev, Claudio Borio and Piti Disyatat
863 May 2020
Pension contributions and tax-based incentives: evidence from the TCJA
Ahmed Ahmed and Anna Zabai
862 May 2020
On the instability of banking and other financial intermediation
Chao Gu, Cyril Monnet, Ed Nosal and Randall Wright
861 May 2020
Dealers’ insurance, market structure, and liquidity
Francesca Carapella and Cyril Monnet
860 April 2020
Dollar invoicing, global value chains, and the business cycle dynamics of international trade
David Cook and Nikhil Patel
859 April 2020
Post-crisis international financial regulatory reforms: a primer
Claudio Borio, Marc Farag and Nikola Tarashev
858 April 2020
The Janus face of bank geographic complexity
Iñaki Aldasoro and Bryan Hardy
857 April 2020
International bank lending and corporate debt structure
Jose-Maria Serena and Serafeim Tsoukas
856 April 2020
Volatility spillovers and capital buffers among the G-SIBs
Paul D McNelis and James Yetman
855 April 2020
Does the liquidity trap exist? Stéphane Lhuissier, Benoît Mojon and Juan Rubio Ramírez
854 April 2020
A new indicator of bank funding cost Eric Jondeau, Benoît Mojon and Jean-Guillaume Sahuc
853 April 2020
Home sweet host: Prudential and monetary policy spillovers through global banks
Stefan Avdjiev, Bryan Hardy, Patrick McGuire and Goetz von Peter
All volumes are available on our website www.bis.org.