quality & safety m - uni-corvinus.hu
TRANSCRIPT

Szent István University
Faculty of Food Sciences
Department of Postharvest
THE ROLE OF RISK ANALYSIS IN THE FOOD
QUALITY & SAFETY MANAGEMENT SYSTEMS
Thesis of Ph.D. Dissertation
Zoltán Syposs
Supervisor
Gábor Kollár Ph.D.
Associate professor,
Head of Department
Budapest
2003

2
DOCTORAL (Ph.D.) SCHOOL
Doctoral School: Szent István University,Ph.D. School of Landscape-architecture and Decision Supporting Systems
Science: Multidisciplinary Agricultural Sciences(Business Administration and Management Organisation Sciences)
Subprogram: Food Industrial Risk Analysis
Title: The role of Risk Analysis in the Food Quality & Safety Management Systems
Head of Ph.D. School: Prof. Zsolt HarnosDoctor of the Hungarian Academy of SciencesSzent István University
Supervisor: Gábor Kollár Ph.D.Associate professor,Head of Postharvest DepartmentFaculty of Food SciencesSzent István University
Opponents: Prof. József FarkasDoctor of the Hungarian Academy of Sciences Head of Department of Refrigeration & Livestock Processing Technology DepartmentFaculty of Food SciencesSzent István University
Diána Bánáti Ph.D.Candidate of Food SciencesHead of Central Food Research InstiuteBudapest, Hungary
.................................................. ..................................................
Approval of Head of the School Approval of Supervisor

3
IntroductionThe most important quality parameter within the food/agri sector is food-
safety. In contradiction with the rapid and continuous development of food processing
technologies, applied quality control- and analytical methods, the number of food
safety incidents (world-wide) are increasing too. Due to the expanding global economy
and the international trading of foodstuffs, there is an increasing demand to ensure
worldwide safe food.
The most significant driving force for increased attention to food safety has been the
continued surge in new food borne pathogens, chemical contaminants and different
food borne accidents.
HACCP (Hazard Analysis Critical Control Point) is the most accepted, recognized
method to achieve food safety objectives effectively.
The objective of HACCP is to ensure food safety throughout the entire food chain.
The most effective industrial application of the Food Safety Management
system is condition of the scientific evaluation of the related food borne hazards and
their adequate control measures throughout the food chain.
Although the principles and methodology of Risk Analysis has been introduced for
many years within different socio-economic fields, until recently the risk based
concept within the food-industry was used „ad-hoc”. In the last few years, due to the
occurence of several significant food safety related hazards and their adverse health
effects, a formal food industrial Risk Analysis methodology was developed.
Protection of human health is the main target of food industrial Risk Analysis, thus
during the determination of acceptable risk level all related health effects must be
taken into consideration.
Beyond, controlling human health and food borne diseases, Risk Analysis can be used
as a tool within different areas, like optimalization of quality costs, increasing
productivity, research & development, technical installations within food processing
and risk based approach might be used in the daily business too.
During my research work I’ve assessed the opportunities of industrial
application of food industrial Risk Analysis. The associated research work was
conducted within the field of beverage processing. The beverage industry and related

4
processing and bottling technology is rapidly developing and the number of
microbiologically sensitive products in the category are continuously increasing. The
microbiological sensitivity of the new beverage portfolio cannot be compared to the
classical beverage products, which are mainly preserved and carbonated.
In my research analysis I’ve applied the methods of food industrial Risk Analysis at
the food safety- and the general microbiological quality levels too.
Research objectivesThe objective of my research work was to establish a microbiological risk
assessment method applied in the beverage industry.
Related to the research objective I was in search of certain answers.
• How could the available risk assessment methods applied in the food industry?
• What kind of predictive microbiological model fits the most for the aseptic
PET beverage technology? Within this field I’ve conducted the following
research work:
• Frequency of occurence of Klebsiella oxytoca in the Water Treatment
Process,
• Probability of survival of Alicyclobacillus acidoterrestris, Bacillus subtilis,
Aspergillus ochraceus and Cladosporium cladosporoides strains in the PET
bottles chemical decontamination system.
• Is the Monte-Carlo method suitable to model different processes within the
aseptic PET technology?
• Are the available validation methods and tools providing an adequate
background for the industrial application of risk assessment?
• To define adequate microbiological criteria in order to measure the
effectiveness of the PET bottle decontamination system?
During the design of my research work one of the main focus points were to provide
scientifically based answers to the frequently referred questions, presented by food
business operators: what is the probability to manufacture products in compliance with
the related and required quality standards, at a given hygiene level in the processing
environment? How can the risk assessment based approach – defined by the Codex
Alimentarius Commission – applied at Company level?

5
Materials and methodsThe scope of my research work covers the following areas:
- Water Treatment process,
- Chemical decontamination of PET bottles.
Microbiological analytical methods
Standard membrane filtration and pour plating methods were applied during the
applied microbiological analysis.
Within the first test series i.e. Water Treatment process, a member of the Coliform
group - Kbsiella oxytoca – was selected as a test strain.
In the second test series i.e. PET decontamination process, 4 test micro-organisms
were selected (Alicyclobacillus acidoterrestris, Bacillus subtilis, Aspergillus
ochraceus, Cladosporium cladosporoides).
The role of the above described indicator and spoilage micro-organisms are proved
throughout many different food hygiene indicators and spoilage problems across the
beverage industry.
Determination of the destruction kinetics - Klebsiella oxytoca
Experiments were carried out at room temperature (22-24 °C) using different
chlorine concentrations (4, 6, 8, 10, 12 mg/l). As a disinfectant agent commercial
bleach was used in a pilot plant (active chlorine concentration: 90g/l). One ml of the
basal suspension of Klebsiella oxytoca was added to 12.5 ml of water samples with
different chlorine concentrations. The suspension was prepared from Klebsiella
oxytoca cells, which were incubated for 24 hours. The living cell numbers (cfu) were
determined at 10, 20, 30, 40 and 50 minutes after the addition of the basal bacterial
suspension to the chlorinated water samples. The destruction rate coefficients (k)
belonging to the different chlorine concentrations (c) were calculated from the linear
regression equations of the surviving curves (log10 N vs. time).
Plotting the log10 k values against log10 c values, from the linear relationship,
the concentration exponent (n) could be determined as the slope of the curve. With the
concentration exponent the effect of the concentration on the destruction rate (k) or
decimal reduction time (D) was calculated.

6
Modeling of Klebsiella oxytoca survival in the Water Treatment technology
The Water Treatment process consists of the following process elements:
- from the raw water storage/buffer tank (1 m3 - in the pilot plant) the water
is supplied onto the sand-filter for mechanical filtration.
- from the sand filter the water goes into the reaction tanks, where chlorine
is injected into the water flow. The chlorine is dosed into the pipe section
just before the reaction tanks.
- removal of the chlorine is performed by filtration of the water supply via
carbon-filters.
- as a final step the water is filtered through a 10 µm mesh filter, i.e.
polisher.
The Klebsiella oxytoca suspension was injected into the raw water supply system. The
introduced cell number - N0 [cfu/ml] – value was determined by preparing dilution
series. The initial cell concentration was kept constant for a period of 10 days.
Followed by the completion of the 10 days period, new inoculum initial cell
concentration level was selected. The level of contamination followed by the polisher
filtration - N1 [cfu/ml] - was measured on a daily basis.
Operation of the Water Treatment pilot plant was conducted according to the relevant
industrial standards, i.e. chlorination dose: 6-8 mg/l (target value: 7mg/l); contact time:
50 min. Enumeration of Klebsiella oxytoca strains was performed on Endo-agar
(MERCK), by applying the following incubation conditions:
temperature: 37 °C; incubation period: 24 (48) hours.
Minimum level of detection was defined as: 4·10-3 cfu/ml (1 cfu/250ml), logarithm
value lgN = -2,4.
The end-point of the microbiological risk assessment was selected as: lgN = -2,4.
PET bottles decontamination experiment
At the aseptic PET bottles decontamination process step as a chemical sterilant
agent, in most cases Oxonia type of disinfectant is applied. This chemical consists of
Peracetic-acid (=PAA) (5,8%) and hydrogen-peroxid (27,5%) 1:4 ratio mixture. The
applied concentration of the chemical during bottle decontamination is: 1500 mg/l
(PAA). During the first step of the decontamination cycle all bottles are inverted by a
rotary rinser, operated at a speed of 28,000 bottles/hour. Followed by this step, the

7
chemical disinfectant is injected into the bottles by using 3,5 bar pressure. The
objective of this step is to create an Oxonia layer inside the entire bottle surface.
The temperature of the desinfectant at the point of appication: 52 °C, contact time: 8
sec. Removal of the residual chemical desinfectant is performed by sterile water
rinsing. (Maximum residue level of chemical agent in the PET bottle: 0,5 mg/l)
The test series was performed in the pilot plant applying 4 repeats, where 24 bottles
were contaminated/test micro-organisms. The Pet bottles were decontaminated
according to the routine industrial operations requirements, desribed above.
Total number of analysed PET bottles:
96 contaminated PET bottles / test microbe + 4 positive control + 4 negative control.
Teszt-micro-organizms:
Alicyclobacillus acidoterrestris
Bacillus subtilis
Cladosporium cladosporoides
Aspergillus ochraceus
The inoculum used to test the bottle decontamination system consisted of
approximately 90% spores versus vegetative cells. The initial cell concentration was
adjusted to the value of 106 cfu/bottle.
1 ml of suspension was added in the 0,5 l PET bottles and distributed evenly. The
bottles were dryed at room temperature (20-24 °C) for a period of 48 hours.
All test bottles were decontaminated according to the above described technology.
The end-point of the microbiological risk assessment was determined as: 1
cfu/bottle contamination value.

8
Mathematical modelling of the microbial survival
The risk associated with survival of test microorganisms were accordingly
modelled taking into consideration the relevant destruction kinetics parameters, level
of initial contamination and it’s variation where Monte-Carlo modelling was used as a
risk assessment tool. The relevant destruction kinetics parameters were calculated with
STATGRAPHICS 5.1 (Statistical Graphics Corporation, USA) software.
The Monte-Carlo simulation was performed by using Microsoft Excel 2002 (Microsoft
Corporation) és @Risk 4.5 for Excel (Palisade Corporation, Newfield, New York)
software. In most experimental models described in my dissertation 10,000 iterations
were applied.
ResultsResults of Klebsiella oxytoca chemical destruction
The different survival curves associated to the different chlorine level, have
been determined.
Based on the slopes of the curves (m) the destruction rates (k) and decimal reduction
times (D) are defined.
Table 1. Klebsiella oxytoca destruction kinetics parameters due to chlorination
chlorine(mg l-1)
k(min-1)
D(min)
4 0.135 17.0
6 0.195 11.8
8 0.328 7.02
10 0.393 5.87
12 0.583 3.95
The results of linear regression:
lg k = -1,689 + 1,317·lg c, R2 = 0,979
This is in good agreement with the n = 1 value of hypochlorous acid reported by
Odlaug, (1981).

9
Calculating the destruction rate belonging to the chlorine concentration of 7 mg l-1,
which is a mean value in the industrial chlorination:
k = 0.265 min-1.
Modelling of survival of Klebsiella oxytoca in the Water Treatment Process
The initial - N0 [cfu/ml] - contamination value is decreased - N [cfu/ml] - by
dosing chlorine in the reaction tanks. If the coliform cells are surviving the
chlorination in the reaction tanks, the risk is high that coliform positive water samples
are detected in the system, which have a direct influence on the water quality used for
the syrup manufacturing as well as for beverage filling. I’ve calculated the living cell
concentration (Nt) value based on the related destruction kinetics equation, where k(c)
is the destruction rate related to the given chlorine concentration, (t) is the contact time
related to the chlorination process. (t) has been estimated by using the contact times in
the reaction tanks.
In the mathematical model the analysed parameters are considered as probability
density functions, which are represented by the relevant distribution parameters (µ; σ).
The variation of the factors (N0, c, t), which are directly influencing the number
survivals cannot be considered as explicit parameters, thus Monte-Carlo simulation
was used.
The estimated values used in the Monte-Carlo model are summarized in table 2.

10
Table. 2. The estimated values used in the Monte-Carlo model
Input parameter Type of distribution Parameters ofdistribution
Initial cell concentration Normal
x = log Nµ =-2 – 6σ = 0.5
Chlorine concentrationin the reaction tanks
Normal
x = c
µ = 7.0 (mg/l)
σ = 0.5 (mg/l)
Contact time in reactiontank I.
Exponential
x = t
β = t
-
β = 25 (min)
Contact time in reactiontank II.
Exponetial
x = t
β = t
-
β = 25 (min)
In alignment with the determined risk assessment end-point, the probability of survival
and detection is defined based on the distribution function resulted from the Monte-
Carlo simulation [lgNt>-2,4], where the probability values are defined from the
[P(lgNt>-2.4)] risk estimate.
The initial cell concentration [lgN0] was adjusted between -2 – 6 and at each
value 10.000 iteration was performed in order to determine [lgNt] values. Followed by
this step – by using the MC software – I’ve calculated the probabilities [P(lgNt>-2.4)]
associated with the [lgNt>-2,4] values, based on the [lgNt] values distribution
functions. The resulted probabilities are illustrated in the function of the initial cell
concentration (lgN0). On Figure 1. it can be seen that within the traditional Water
Treatment systems even in case of the lowest detectable contamination level the risk of
survival and detection of 1 Klebsiella oxytoca cell is approximately 3-4%.

11
Figure 1. Probability of detection of Klebsiella oxytoca cells surviving the Water
Treatment Process, in the function of the initial raw water
contamination level
Validation of the Klebsiella oxytoca survival and detection model
The validation of the above described microbiological risk assessment model
was carried out in a R&D pilot plant department (SIDEL beverage filling
division/France). The validation period was defined as 180 days (10 decades). The
Klebsiella oxytoca contamination level was analysed on a daily basis, by applying
membrane filtration method. The results are summarized in table 3.

12
Table 3. Validation of the Klebsiella oxytoca survival and detection model
________________________________________________________
Decade log N0 P(lg Nt>-2.4) Detection(%) (%)
________________________________________________________1. -0.49 15 102. -1.40 6 103. - 0 04. -0.50 15 205. 0.48 26 306. 0.30 25 207. 3.04 56 508. 0.70 31 309. 4.08 66 7010. 1.99 45 4011. 0.00 20 3012. -1.00 9 1013. -0.82 11 014. -0.52 14 2015. -1.70 4 1016. 0.08 21 2017. 1.23 36 3018. -0.60 14 10
____________________________________________________
Based on the analysis I’ve conducted the linear regression equation was determined,
which describes the correlation between the observed and predicted values. Of the
survived and detected Klebsiella oxytoca contamination levels. Detected
contamination level (%) = -1,28 + 1.091 · predicted probability (%)
Data pairs = 18
Determination coefficient: R2 = 0,905
Results of the PET bottles decontamination experiment
The initial cell concentration was determined by pour plating and preparation
of dilution series of the inoculum.
Followed by the 8 sec. contact time the residual microbial contamination level in the
PET bottles were determined in lg values. During my experimanetal work, significant
survival was detected only in case of Alicyclobacillus acidoterrestris. In most cases the
residual cfu level was below 10. Survival rates are summarized in table 4.
13
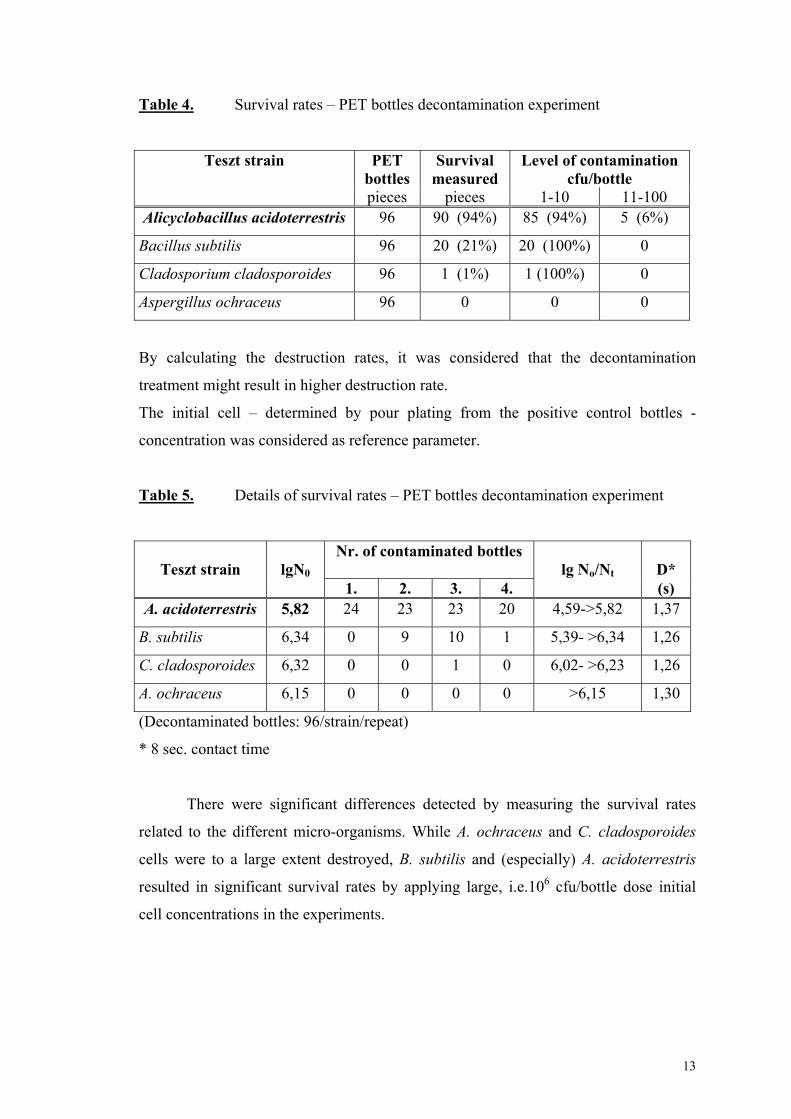
Table 4. Survival rates – PET bottles decontamination experiment
Teszt strain PETbottles
Survivalmeasured
Level of contaminationcfu/bottle
pieces pieces 1-10 11-100Alicyclobacillus acidoterrestris 96 90 (94%) 85 (94%) 5 (6%)
Bacillus subtilis 96 20 (21%) 20 (100%) 0
Cladosporium cladosporoides 96 1 (1%) 1 (100%) 0
Aspergillus ochraceus 96 0 0 0
By calculating the destruction rates, it was considered that the decontamination
treatment might result in higher destruction rate.
The initial cell – determined by pour plating from the positive control bottles -
concentration was considered as reference parameter.
Table 5. Details of survival rates – PET bottles decontamination experiment
Teszt strain lgN0
Nr. of contaminated bottleslg No/Nt D*
1. 2. 3. 4. (s)A. acidoterrestris 5,82 24 23 23 20 4,59->5,82 1,37
B. subtilis 6,34 0 9 10 1 5,39- >6,34 1,26
C. cladosporoides 6,32 0 0 1 0 6,02- >6,23 1,26
A. ochraceus 6,15 0 0 0 0 >6,15 1,30
(Decontaminated bottles: 96/strain/repeat)
* 8 sec. contact time
There were significant differences detected by measuring the survival rates
related to the different micro-organisms. While A. ochraceus and C. cladosporoides
cells were to a large extent destroyed, B. subtilis and (especially) A. acidoterrestris
resulted in significant survival rates by applying large, i.e.106 cfu/bottle dose initial
cell concentrations in the experiments.

14
Probability model of the PET bottle decontamination process
The probability of detecting contaminated Pet bottles followed by the
sterilization process was simulated by Monte-Carlo modelling.
The statistical parameters taken into consideration during the simulation were as
follows:
Input parameter: lg N0, σ = 0,5 .
The input parameter (initial cell concentration) was adjusted between lgN0 =1–7 (scale
parameter 0,5)
Contact time (chemical treatment): t = 8 s σ = 0,5 s
Destruction rate: D = 1.3 s σ = 0,2 s
Model describing the survival: lg Nt = lg N0 – t/D
Model output parameter:
Risk of beverage spoilage: The probability of surviving test micro-organisms
detected in more then 1 bottle: P(lg Nt ≥ 0).
The results based on the Monte-Carlo simulation are summarized in table 6. (10.000
iteration)
Table 6. Probability of PET bottle contamination in the function of the initial cell
concentration level
Classical Estimation Monte Carlolg No lgNt=lgN0-8/1,3 Nt P=1-e-Nt (%) P(lg Nt ≥ 0) (%)
7 0,85 7 99,9 74,56,5 0,35 2,2 88,9 60,76 -0,15 0,71 50,4 43,2
5,5 -0,65 0,22 19,8 26,35 -1,15 7·10-2 6,78 12,1
4,5 -1,65 2·10-2 2,00 4,324 -2,15 7·10-3 0,69 1,14
3,5 -2,65 2·10-3 0,20 0,173 -3,15 7·10-4 0,07 0,02
2,5 -3,65 2·10-4 0,02 0,00152 -4,15 7·10-5 0,007 <0,001

15
The classical prediction (estimation) of probability values of beverage spoilage were
determined based on the observed cfu numbers in the relevant destruction kinetics
equation.
The probability of detection survival cells in the PET bottles:
P = 1 – exp (-Nt)
The Nt values determined by the classical estimation - destruction kinetics equation is
not taking into consideration the variation of the related statistic parameters, thus they
are not reflected in the probability values. In table 6. the comparison values based on
the classical estimation and the Monte-Carlo simulation are reflected.

16
ConclusionsMicrobiological risk assessment modelling is proved to be a very effective tool
to predict microbiological quality parameters in food processing. Based the evaluation
of the experiments carried out in my thesis the following conclusions are made:
• The effectiveness of the applied chemical treatment in the traditional water
treatment processes is very limited. The risk associated with the survival and
detection of Klebsiella oxytoca in the treated water is high.
• The analysed and applied Monte-Carlo method provided suitable good
performing risk estimates, related to the probabilities of survival of Klebsiella
spp. especially in low dose applied cases, which cases were validated
successfully, by pilot plant experiments (180 days).
• In case of large dose applied in the aseptic PET bottle decontamination system
the Monte-Carlo simulation didn’t provide as precise prediction risk estimates
as the classical model, which has been defined based on the relevant
destruction kinetics equation.
• The application of the classical model for determining microbiological quality
parameters in the aseptic technology is further recommended. The
microbiological criteria to be used for the maximum tolerable contamination
level / PET bottle is recommended as:
N0 ≤ 100 cfu/palack
This value is ensures that the commercial sterility rate (0,01%), from a bottle
decontamination effectiveness point of view.

17
SummaryDuring my thesis I’ve reviewed the specific aspects of the Food Quality
Management systems, with a special focus on the role of HACCP within the field of
food safety. In compliance with the objective of my research work, followed by the
review of food chemical- and physical risk analysis processes, I’ve investigated and
described the structure and methods of microbiological risk analysis. The qualitative
and quantitative aspects of the microbiological risk assessment as one of the most
important elements of the risk analysis process were explained, based on the review of
related activities at national and international level. Although, the overall risk
assessment projects were reviewed in detail, the experiments, related to my thesis were
designed in order to investigate the opportunities of food industrial application of these
methods.
The industrial experiments related to the microbiological risk assessment process were
carried out in the beverage industry, which is one of the most rapidly developing fields
within the food industry. Aseptic PET technology represents the latest strategical and
technological development within the beverage industry. The aseptic PET filling
technology is described in depth in my study.
Experiments were carried out at two process elements – water treatment & PET bottle
decontamination system – both elements have a critical impact on the microbiological
safety and quality of the product. The objectives of the experiments were to estimate
the risk level associated with the occurrence of determined microbiological hazards.
Based on the scope of the assessment, quantitative risk assessment (QRA) was used as
a process by which the results of the hazard analyses were applied to support business
decisions, which might not necessarily impact the food safety parameters of beverage
products, but all other quality parameters.
During the first set of experiments, simulation of probability of occurance and
detection of the most resistant member of the Coliform group, Klebsiella oxytoca was
carried out. The QRA process was used in order to estimate the probability of the test
micro-organism in the treated water as a function of the initial contamination level of
the raw water. The risk assessment end-point was determined as: coliform bacteria
level of treated water sample ≥ 1 cfu/250 ml. The water treatment process is based on
chlorination and operated according to the industrial standards. The QRA process was
based on the assumption of the initial viable cell concentration and the mathematical
modelling of the effect of chlorine on the destruction rate, taking into account the

18
probability distribution of the contamination, chlorine concentration and the residence
time distribution during disinfection. For evaluation, the Monte Carlo simulation was
applied. The model was validated in a Pilot Plant for a period of six months and the
linear relationship between the predicted and observed probability of Klebsiella-
detection was characterized with a determination coefficient of R2= 0.905.
During the second set of experiments the risk of microbiological contamination rate
was simulated at the aseptic filling bottle decontamination system. Four different test
strains were applied in the experiment. The importance and role of the strains being
clearly proved in the beverage industry. The PET bottles were contaminated by using
the suspension of the given test strain and followed by the routine decontamination
cycle the residual contamination was measured. We determined the probability of
occurrence of the bottle contamination after the sterilization cycle as a function of the
input cell concentration. The uncertainty related to the probability distribution was
taken into consideration by using the Monte-Carlo simulation. A comparison was
established between the Monte-Carlo method and the classical exponential model,
which is calculated from the microbial destruction kinetics associated to the theoretical
considerations. Microbiological criteria were recommended in order to measure the
sterilization effectiveness of the bottle decontamination system.
Newly achieved scientific results:• Application of the available risk assessment methods and their importance in
the decision supporting system is verified by food industrial trials.
• The advantages of the Monte-Carlo methods in the field of microbiological
risk-assessment are verified by relatively long term pilot-plant trials.
• Predictive model is established in order to support the quality control system.
• The differences between the Monte-Carlo and traditional theoretical models are
described in case of low dose occurrence.
• Recommendation is made for introduction of microbiological criteria, to
measure the effectiveness of the PET bottle decontamination system.

19
List of publications related to the subject of the dissertation
I. Publications in International Journals
1. Journals with impact factors
Dióspatonyi I., Syposs Z.- Viczián Zs., Kollár G. Láng-Lázi M. (2000): Quality assurance aspects in biochemical and chemical information technology. Computers and Chemical Engineering 24 pp. 1031-1036.
Kollár G., Viczián Zs., Syposs Z., Füstös Zs., Dióspatonyi I. (2000): Quality assurance, information technology and bioindustry. Hungarian Journal of Industrial Chemistry. Veszprém, Vol. 28. pp. 317-320.
Kollár G., Syposs Z., Viczián G., Mészáros L., Kollár-Hunek K. (2001): QualityManagement System as a tool of process control for food and agri industries.Hungarian Journal of Industrial Chemistry. Veszprém, Vol. 29. pp. 135-138.
Z. Syposs, O. Reichart, L. Mészáros (2003): Microbiological risk assessment in the beverage industry. Food Control-Elsevier Sciences Publishers. Jóváhagyott folyóiratcikk. Megjelenés várható időpontja: 2003 szeptember.
2. Journals without impact factors
Kollár G., Füstös Zs., Syposs Z., Viczián Zs. (1999): The effect of Quality Assurance on the Postharvest processes. New Economy of Horticulture, 31/4. Budapest p.128-130.
Kollár G., Füstös Zs., Syposs Z., Viczián Zs. (1999): The effect of Quality Assurance of the Postharvest processes. Seed, Research, Cultivation, Commercelization, XIII. Nr.6. p.29-30.
Syposs Z., Kollár G. (2000): Quality Assurance & Food Safety systems. New Economy of Horticulture. 32/1. pp. 48-52.
Syposs Z. (2000): The application levels of quality system audits. Mineral Water, Beverages, Fruit Juices. Budapest, I. 1. p. 21-22.
Syposs Z. (2000): The structure and specialties of the ISO 9001:2000 quality system standard in the Food Industry. Mineral Water, Beverages, Fruit Juices. Budapest, I. 2. p. 53-54.
Syposs Z., Lakner Z. (2000): Quality related challenges faced by the Hungarian Food economics in the globlaization. Mineral Water, Beverages, Fruit Juices. Budapest, I. 3. p. 63-69.

20
II. Conference - full papers, abstracts & posters
1. Full paper - Hungarian
Syposs Z. (2001): Applied methods in the Risk Assessment & HACCP.Hungalimentária 2001., Budapest, P 15.
2. Abstract - Hungarian
Kollár G., Viczián Zs., Füstös Zs., Syposs Z. (1999): Quality Assurance & Information Technology. Chemical engineering. Hungary, Veszprém, p. 105.
3. Full paper – International Conference
Z. Syposs, Z. Lakner (2000): The Role of Quality Certification in the European Market. The effect of quality strategy on competitiveness in the Hungarian Food Chain. 44th EOQ International Congress Budapest, Hungary. pp 419-433.
Kollár G., Viczián G., Syposs Z., Mészáros L., Hunek K. (2001): Postharvest aspects in Quality Management System engineering for fruit and vegetable production. Proceedings of 6th International Symposium on Fruit, Nut, and Vegetable Production Engineering, Potsdam. pp. 351-357.
Z. Syposs, G. Kollár (2001): Applied Risk Assessment Methods in the Food Industry. 45th EOQ Congress 19-21 September 2001. Istanbul, Turkey. D3 pp.1-8.
Z. Syposs, G. Kollár (2002): Microbiological risk assessment in the beverage industry. Fifth International Food Safety and HACCP Conference, Noordwijk, the Netherlands. Lectures pp. 37-38.
4. Abstract – International Conference
Z. Syposs, M. Erdélyi (1999): DNV experiences on independent industrial HACCP self assessment in Hungary. Third International Food Safety and HACCP Conference, Noordwijk, the Netherlands. P5. pp. 50.
M. Erdélyi, L. Lelik, Z. Syposs (1999): Sensory and analytical tests on recyclable bottles (PRB) used for saturated soft drinks. Third International Food Safety and HACCP Conference, Noordwijk, the Netherlands. P10. pp. 57-58.
Z. Syposs (2000): DNV experiences on supplier chain auditing in Hungary.Food Hygiene Europe 2000 Conference, Amsterdam, the Netherlands. P4.pp.68.

21
Kollár G., Syposs Z. (2000): Experiences of QA & Food Safety Systems Audits. Lippay János-Vas Károly Scientific conference. Szent István University Budai Campus Publications. Bp. pp.116-117.
Z. Syposs, J. Tornai-Lehoczki (2003): Application of acidified? (pH 4,5) Linden Grain Medium as a microbiological validation tool in the Aseptic Beverage PET Technology. 23rd International Specialised Symposium on Yeasts, Budapest, Hungary. Jóváhagyott absztrakt a konferencia kiadványban. Megjelenés várható időpontja: 2003 augusztus.