bl.ank page - defense technical information centerdtic.mil/dtic/tr/fulltext/u2/718718.pdf · b....
TRANSCRIPT

TECP 700-700Materiel Test Procedure 5-2-507
10 April 1967 White Sands Missile Range
U. S. ARMY TEST AND EVALUATION COMMANDCOMMON ENGINEERING TEST PROCEDURE
VIBRATION TEST
1. OBJECTIVE
..-,The object of this test is to instruct personnel in the techniques- 0 of missile vibration testing. 7
2. BACKGROUND
Vibration is an oscillation which describes the motion of a mechan-
ical system. Vibratory motiorr is introduced in a missile during firing, bythe propulsion system, aerodynamic turbulence in the boundary layer, and byequipment that exhibits mechanical motion, such as turbines and engines.During transportation, missile vibration is induced by: irregularities inroad surfaces; road surfaces varying from paved to cross-country tactical
conditions; joints and irregularities in railroad tracks; aircraft engines;aerodynamic buffeting during turbulent flying conditions; irregularities inlanding field surfaces; and by rough seas and operation of ship engines.
Vibration testing has proven useful in determining missile designweaknesses and in estimating the ability of mechanical items to withstand
severe environments. Extensive research and studies have been conducted bymanufacturers and the government in an effort to more realistically analyzestructural response to vibratory motion and to derive meaningful laboratorymissile vibration tests from their analyses.
3. REQUIRED EQUIPMENT
<t. a. Applicable Vibrator ExciterU. b. Applicable Manufacturer's and Military Instructions and/orZvu SpecificationsV c. Rigid Fixtures (jigs) to attach test specimen to the exciter
• 0* d. Auxiliary Tables3. e. Recording System
S.ZJ f. Signal Conditioning Equipment:111 g. Piezoelectric Accelerometers (Velocity Pickups, Strain Gage
52_ Accelerometers, or Displacement Transducers (used in their linear dynamicrange))
* h. Cable* i. Bungee Shock Cord
• Items marked by an * are not always required. D DC
F 17 1971DI1STRIBUTIO0N SýTATEME
.ppproved for Public releaW I _
Distributiofl ULU -1- C
44'

MTP 5-2-5071o April 1967
* J. Spring-like Suspension System* k. Drive Rod* 1. SAE 30-40 oil
m. Bolts* n. X-ray Machine
4. REFERENCES
A. Harris and Crede (edited by), Shock and Vibration Handbook,Volume 1, McGraw-Hill Book Company, Inc., New York, 1961.
1) Harris, C. M. and Crede, C. E., Introduction to theHandbook, Chapter 1.
2) Abramson, N. N., Non-Linear Vibration, Chapter 4.3) Stokey, W. F., Vibration of Systems Having Distributed Mass
and Elasticity, Chapter 7.4) Baxter, Beckman, and Brown, Measuring Techniques, Chapter 20.
B. Harris and Crede (edited by), Shock and Vibration Handbook,Volume 2, McGraw-Hill Book Company, Inc., New York, 1961.
1) Lunney, E. M., introduction to Data Analysis and Testing,Chapter 21.
2) Gertel, M., Specification of Laboratory Tests, Chapter 24.3) Unholtz, K., Vibration Testing Machines, Chapter 25.
C. Timoshenko, S., Vibration Problems in Engineering, Third Edition,D. Van Nostrand Company, Inc., New Jersey, 1955.
D. Van Santen, G. W., Mechanical Vibration, Philips TechnicalLibrary, 1953.
E. Jacobsen and Ayre, Engineering Vibrations, McGraw-Hill BookCompany, Inc., New York, 1958.
F. Den Hartog, J. D., Mechanical Vibrations, Third Edition,McGraw-Hill Book Company, Inc., New York, 1947.
G. Aseltine, J. A., Transform Method in Linear S stem Analysis,McGraw-Hill Book Company, inc., New York, 1958.
H. Cheng, C., Analysis in Linear Systems, Addison-WesleyPublishing Company, Inc., Massachusetts, 1959.
I. Churchill, R. V., Complex Variables and Applications, SecondEdition, McGraw-Hill Book Company, Inc., New York, 1960.
J. Johnson, W. C., Mathematics and Physical Principles of Engineer-ing Analysis, McGraw-Hill Book Company, Inc., New York, 1944.
K. Miner, M. A., Cumulative Damage in Fatigue, Journal of AppliedMechanics, Volume 13, September 1945.
L. Miles, J. W., On Structural Fatigue Under Random Loading,Journal of Applied Mechanics, Volume 21, November, 1954.
M. Booth, G. B., Random Motion, Product Engineering, November,1956.
N. MIL-E-5272, Environmental Testing, Aeronautical and AssociatedEquipment, 1959.
* Items marked by an * are not always required.
-2-

BL.ANK PAGE

MTP 5-2-507lo April 1967
P. MIL-STD-810(UsAF), Military Standard Environmental Test Methodsfor Aerospace and Ground Equipment, 1962.
Q. McCool, W. A., Generation of Transfer-Functions from LinearLumped Constant Physical System, Laboratory Report No. 51,ESL-EML WSMR, July, 1962.
R. Crede, C. E., and Lunney, E. J., Establishment of Vibrationand Shock Test for Missile Electronics as Derived from theMeasured Environment, WADC Technical Report No. 56-503.
S. Vigness, I., Shock and Vibration Tests, Proceedings of theEnvironmental Testing Workshop, Sandia Corporation, Albuquerque,New Mexico, September, 1961.
T. Sandia Corporation Document SC-4452A(M), Sandia Corporation,Albuquerque, New Mexico, February, 1962.
U. MTP 5-2-503, Restrained Firing TestsV. MTP 5-2-512, Missile System Aerodynamics TestsW. MTP 5-2-578, Mobility TestsX. MTP 5r--2-6o4, Structural Data Analysis Methods
5. SCOPE
5.1 SUMMARY
This procedure describes the necessary particulars to be performedwhen a test specimen is subjected to vibration tests.
5.2 LIMITATIONS
None
6. PROCEDURES
6.1 PREPARATION FOR TEST
6.1.1 Preparation of Test Equipment
a. Determine the vibration test specifications to be applied tothe test specimen (See Appendix A).
b. Determine the vibration exciter to be used. (See Appendix B).c. Determine the type and location of required instrumentation
with appropriate calibration procedures having NBS traceability. (SeeAppendix C).
d. Determine the category of testing to be performed:
1) Tests conducted at laboratory or field ambient conditions2) Tests conducted in a specified environment and then compared
to the results of similar tests previously conducted at laboratory or fieldambient conditions
3) Tests conducted in a specified environment and then repeatedat laboratory or field ambient conditions
e. Determine the type testing to be performed as indicated inAppendix D using the considerations of Appendices F, G, and H.
-3-

MTP 5-2-50710 April 1967
6.1.2 Preparation of the Test Specimen
a. Ascertain that the test specimen's physical characteristicsare in accordance with specified requirements, and visually inspect thetest specimen for physical damage or corrosion.
b. Fasten the test specimen to the vibration exciter by means ofthe fixtures or tables described in Appendix E.
c. Mount the required instrumentation.
6.2 TEST CONDUCT
Vibration tests shall be conducted as follows:
a. Operate the test specimen in a normal manner, when applicable.b. Apply power to the vibration exciter being used.c. Measure and record:
1) Vibration input excitation level and frequency band2) Duration of excitation3) Test specimen response
d. At the completion of the test:
1) Turn off the test specimen, when applicable.2) Examine the test specimen for evidence of intermittent or
catastrophic failure and record all observations (See Appendix I).
NOTE: In the case of complex test specimen, visual inspectioncan be misleading and x-ray and/or other types ofinspection may be necessary to detect catastrophicfailures.
3) Step a through d shall be repeated, as necessary, to obtain
maximum data completeness.
6.3 TEST DATA
6.3.1 Preparation of Test Equipment
Record the following:
a. The vibration input system (manufacturer, model number, serialnumber, etc.)
b. Type and location of the control instrumentation (electrodynamic,etc. )
c. Type and location (on the test specimen) of instrumentationwith parameter being measured
d. Category of testing (laboratory, environment etc.)e. Type testing (equivalent, simulation).
-4-
MTP 5-2-50710 April 1967
6.3.2 Preparation of the Test Specimen
Record the following:
a. Test specimenb. Method of fastening specimen to exciter (suspended, table)
6.3.3 Test Conduct
Record the following:
a. Ambient temperature in degrees Fb. Vibration excitation level in volts and frequency band in cps.c. Duration of excitation in secondsd. Type of failure, if any (intermittent, catastrophic)e. Response of specimenf. Direction of excitation (WRT test specimen)
6.4 DATA REDUCTION AND PRESENTATION
Prepare a log book or folder for each system tested and record theresults of the vibration test. Enter all pertinent data in this log, suchas theoretical estimations, mathematical calculations, measured vibrationmotions, test conditions, intermittent or catastrophic failures, testparameters, etc., that were obtained during the test. The log must becomplete, accurate, and up-to-date, as the log may be used for futureanalysis of missile structures.
Upon completion of the test or termination due to failure, testresults should be studied to arrive at conclusions and recommendationsregarding the suitability of the test specimen for service use or compliancewith test specifications. (See Appendix I).
In the event of structural failures, the data obtained during theconduct of this procedure shall be analyzed and presented as described inMTP 5-2-604.
The extent of vibration evaluation usually will be limited tocomparing the actual or theoretical estimations with the manufacturer'sspecifications and/or the military requirements imposed by the intendedusage. In many theoretical instances, vibration motions must be comparedwith standards and/ur past experiences.
"-5-
MTP 5-2-50710 April 1967
GLOSSARY,
1. Amplitude: The maximum zero-to-peak value of a sinusoidal quantity.
2. Damping: The dissipation of energy with time or distance.
3. Degrees of Freedom: The minimum number of independent coordinatesrequired to define the positions of all parts of a mechanical system at anyinstant of time. In general, it is equal to the number of independentdisplacements that are possible.
4. Ergodic Process: A random process that is stationary and of sucha nature that all possible time averages performed on one signal are independ-ent of the signal chosen and hence are representative of the time averages ofeach of the other signals of the entire random process.
5. Harmonic: A sinusoidal quantity having a frequency that is anintegral multiple of the fre'•uency of a periodic .quantity to which it isrelated.
6. Linear System: A system which for every element the response isproportional to the excitation.
7. Mechanical Impedance: The ratio of a force quantity to a velocityquantity when the agruments of the real or imaginary parts of the quantitiesincrease linearly with time.
8. Mechanical Mobility: The reciprocal of mechanical impedance.
9. Mode of Vibration: A characteristic pattern assumed by thevibrating system in which the motion of every particle is simple harmonicwith the same frequency.
10. Natural Frequency: The frequency of free vibration of a system.
11. Random Vibration: Vibration whose instantaneous magnitude is notspecified for any given instant of time, but is specified only by probabilitydistribution functions giving the probable fraction of the total time that themagnitude (or some sequence of magnitudes) lies within a specified range.
12. Resonance: The condition which exists during forced vibration whenany change, however small, in the frequency of excitation causes a decreasein the response of the system.
13. Simple Harmonic Motion: A motion such that the displacement is asinusoidal function of time.
14. Steady-State Vibration: When the velocity of each particle in asystem is a continuing periodic quantity.
15. Transmissibility: The nondimensional ratio of the responseamplitude of a system, in steady-state forced vibration, to the excitationamplitude.
I

MTP 5-2-50710 April 1967
APPENDDC A
VIBRATION TEST SPECIFICATIONS
Vibration test procedures usually are outlined in detail invarious specifications. These specifications may have originated as aresult of commercial procurement or may be military specifications. Thevibration tests required by specifications usually are conservative andbiased in favor of the purchaser. However, such bias and conservatismoften results in an unfavorable situation for both the supplier and thepurchaser. This situation occurs when a system is actually suitable foruse but is ruled as unsatisfactory on the basis of vibration specificationtests. Thus, considerable effort may be needlessly expanded in redesign tomeet the specification, and optimum system space and weight requirements maybe exceeded. The net result is an overdesigned system which is less satis-factory from an overall operational standpoint and is more expensive. Theamplitude levels required by laboratory vibration tests are derived frompast measurements on similar specimens. A vibration test specification whichis not substantiated by measurements, is actually an attempt to extrapolatethe measurements from past specimens to the current test specimen.
Figure A-1 shows a typical example of measurements collected froma particular portion of several specimens with an envelope of maxima drawn.This envelope of maxima forms the basis of selecting the amplitude level forthe vibration specification.
The mechanics of tests may require a logarithmic sinusoidal sweepand/or a resonaet", dwell in specifying an input frequency associated with thespecified vibrution level. Methods of application are also uniquely specified.Two more of the more common general specifications are listed in References 4Nand 4P and test personnel should review these documents to become familiarwith the vibration test specifications usually required for missile testing.
W O MC-ASUREMENTS IN AFT PORTION OF MISSILE
z• I •- ENVELOPE OF MAXiMA
SI "*'"00
000* 0
°FREQUENCY - CP
FIGURE A-i. TYPICAL MEASUREMENTS AND ENVELOPE OF M~AXIMA
A-I

BLANK PAGE

MTP 5-2-50710 April 1967
APPENDIX B
VIBRATION EXCITERS
Vibration exciters, classified as mechanical, hydraulic, electrody-namic, or piezoelectric are described below.
The selection of a vibration exciter is dependent upon the testspecifications and the size of the test specimen. Mechanical exciters andelectrodynamic exciters powered by rotary supplies are not suitable forrandom vibration since they produce essentially a single-frequency output.A hydraulic exciter is considerably more satisfactory for low frequency-highlevel testing than other exciters. Consult Reference 4M for further infor-mation on the various types of exciters.
Presently electrodynamic and hydraulic exciters are the mostcommonly used.
A. Mechanical Exciters -- These exciters consist of a table driven by aneccentric and connecting link, a Scotch yoke, a cam and follower, or arotating unbalanced mass. These four types of drives are illustrated inFigure B-1. Mechanical exciters produce wither circular or rectilinearmotion and operate in a frequency range of 5 to 100 cycles per second (cps)and 10 to 60 cps. Both have a maximum displacement of 0.5 inch peak-to peak.The average maximum acceleration is 37 times the force of gravity (g).
B. Hydraulic Exciter -- The hydraulic exciter uses power in the form of ahigh-pressure flow of fluid from a pump to produce the reciprocating motionof its table. The exciter can produce large forces with displacements upto 9 inches peak-to-peak and force outputs from direct current (d-c) toabout 400 cps. Hydraulic exciters are available which will accept testitems of various dimensions and weights.
C. Electrodynamic Exciter -- An electrodynamic exciter generates vibratoryforces by locating a movable current-carrying wire coil, to which a table isattached in a high magnetic fluz density as shown in Figure B-2.
The high magnetic flux density is created by the field coil when the coil isconnected to a suitable d-c voltage source. The body casting permits a pathfield-coil flux to cross the movable coil. Alternating current (a-c) in themovable coil causes vibratory motion of the coil since reversing the currentin the movable coil reverses the direction of the generated force. Thisgenerated force is proportional to the value of the sinusoidal current in themovable coil because the size of the magnet structure is adequate to maintaina constant flux density in the air gap, regardless of the flux created by thecurrent in the movable coil., The electrodynamic exciter can be powered by arotary power supply (alternator) or an electronic power supply. An alternatormay be used when only sinusoidal excitation is desired. An electronic powersupply is required when arbitrary waveforms are desired or when sinusoidalexcitation at rapid cycling is needed. An electrodynamic exciter is capableof producing a sine wave output or an output having an arbitrary waveform.
B-I

11f 5-2-5073.0 April1 1967
TBLE
FRAME FRAME
ECCENTRIC ANDCONNECTING LINK SCOTCH YOKE
TABLE GENERATED FORCE
TABLE
f• B~~~ASE .-.--
ROTATINGUNBALANCED MASS
FRAME
CAM AND FOLLOWER
FIGURE B - I. MECHANICAL EXCITER DRIVING MECHANISMS
B-2

MTP 5-2-5071o April 1967
GENERATED FORCE• DRIVER COIL
.,BODY CASTING (MOVABLE)(MAGNET STRUCTURE)
FIELD COIL(STATIONARY)
FLUX PATH
FIGURE B-2. AN ELECTRODYNAMIC EXCITER
It will operate at frequencies of 5 to 2,000 cps, usually with a peak-to-peakdisplacement of normally one inch. Models are available which will produce upto 25,000 pounds force (continuous sinusoidal peak value) and which havetables as large as 29.5 inches in diameter. The controls available for theelectrodynamic exciter are:
(1) Automatic frequency cycling which allows the test frequency tobe cycled from fl to f 2 to fl continuously and at the desired
time rate automatically.(2) Excitation level control which is a servo control that allows
a desired level as a function of frequency or time to be heldautomatically.
(3) Equalization network consisting of a series of filters whichflattens the response curve of the exciter so that the responseof the table is proportional to the input excitation voltage.With no equalization, the table response is as shown inFigure B-3(a) and is due to mechanical and electrical resonances.The equalization network attempts to produce the response asshown in Figure B-3 (b).
D. Piezoelectric Exciter -- The piezoelectric exciter uses a stack ofpiezoelectric elemerts as a source of mechanical vibration. They are usedin the frequency range of 1,000 to 20,000 cps and have a maximum peak-to-peak displacement of 0.000011 to 0.001 inch. They can produce accelerationsas high as 1,000 g and are used predominately for acceleration calibration.
B-3

MrP 5-2-50710 April 1967 C
42
z z
U.-
FREQUENCY FREQUENCY(0) (b)
FIGURE B-3. EXCITER TABLE RESPONSE
B-4,

MTP 5-2-50710 April 1967
APPENDIX C
INSTRUMENTATION
The acquisition of vibration data, and the monitoring of testresults are dependent upon the proper instrumentation of the structuralpoints of interest.
Selection of the required transducers, carrier systems, recordersconversion and reduction equipment shall be determined by the individualspecifications and test requirements.
Data shall be recorded on magnetic tape, oscillograph, or stripchart-records depending upon the frequency required and accuracy specifi-cations of the required data.
Reference 4.A.4 of this procedure describes methods of acquiringvibration information and the problems included in instrumenting a missilestructure. The following paragraphs are presented as an a:- in overcomingsome of the inherent measuring problems and determining the instrumentationused.
a. One of the most troublesome aspects of data acquisition is thatthe required instrumentation is a function of the vibration frequencies andamplitudes to be measured which, in turn, are unknown at the time the instru-mentation system is to be installed. Figure C-I is a diagram of a typicaldata acquisition system with a lumped parameter representation of a mechanicalsystem using a piezoelectric accelerometer. If the acceleration amplitude ofthe test specimen mass, "x(t), is small in comparison with the predicted level,almost no output will result that can be recorded. On the other hand, *(t)may be large in comparison with the level and will overdrive the electroniccomponents associated with the recording system. In the case of a d-camplifier, one spike may cause the amplifier to be overdriven and electricaloscillations to occur for as long as 60 seconds. Many recording systems havea 40 decibel (db) dynamic range, however, other systems may have a dynamicrange as low as 20 db. Optimum attenuation results when the rms level of thesignal is about 10 db below the maximum level. It is recommended that severalpreliminary tests be made to set the gain at the optimum level. This ispossible during laboratory tests and/or data collected on the ground, such asin a transportation environment; however, for a missile flight this isimpossible. An accurate prediction based on vibration analysis or an extrap-olation from similar missiles and/or flights must be used to set system gain.
b. The selection of an instrumentation system is of vitalimportance. It is recommended that piezoelectric accelerometers be used forvibration measurements above 5 cps. Below 5 cps, velocity pickups, displace-ment transducers, or strain gage accelerometers may be used. Piezoelectricaccelerometers offer a wide frequency range and amplitude response charac-teristics coupled with small size and are, therefore, recommended for use.The principal problem in using a piezoelectric accelerometer is that theelectronics associated with it may be critical. High impedance components
C-1

MTP 5-2-507lo April 1967
are present in these electronic systems and electrical noise may beintroduced.
SATTENUATO14 eCOvel ' l ! ,SETTING SYTEM
KS 1J 0S TRANSDUCER (PIEZOELECTRIC ACCELEROMETER)S® CABLE
FIGURE C-I. TYPICAL DATA ACQUISITION SYSTEM
c. The "whip" of the cable between the transducer and the signalconditioning equipment may also introduce spurious signals into the instru-mentation system. Care should be exercised when taping the cable to astationary surface so that whip is minimized. Another problem associatedwith instrumentation includes significant changing of the mass and stiffnesscharacteristics of the structure to be measured, by the addition of atransducer. Select transducers that are compatible with the predictedfrequency and the amplitude requirements that are associated with the measure-ment. A transducer should be calibrated versus a secondary standard beforeand after each test to determine that its characteristics are unchanged.Temperature, acoustics, and other environments affect the performance of atransducer and, in turn, the vibration instrumentation. If environments aresevere, it is necessary to use instrumentation compatible with these envi-ronments or to isolate the instrumentation from the effect of these envi-ronments. Consultation of the manufacturer's specifications and/or instru-ctions may be necessary to estimate these effects.
C-2

"TP 5-2-50710 April 1967
APPENDIX D
TESTING CONCEPTS
A. Equivalent Testing
The overall objective of equivalent tests is to produce the samepossible damage in a laboratory vibration test as the specimen might incurduring service. The principal problem is to establish a relationshipbetween the vibratory oscillation and the damage that is introduced intothe test specimen by this oscillation. Several assumptions must be madebefore this relationship can be established and these assumptions tend todistract from the realism of the test. The most common assumption is thatdamage accumulates linearly according to Miner's theory, as explained inReference 4K. Given that the environment is random, stationary, and ergodicand that the system responds as a simple mechanical oscillator, Miles, asexplained in Reference 4L, devised a method for determining an equivalentsinusoidal vibration level that would produce the same damage as the randomexcitation in the same period of time. The work of Miner and Miles is usedas the basis for References 4.B.2 and 4S in which tentative equivalent testshave been derived based on the measured environment. The Department ofDefense has appointed a committee to study the problem of equivalent testingand much effort in vibration analysis is scheduled to be expended to effectrealistic assumptions. The detailed study of equivalent tests is a task forspecialists in dynamic testing and is beyond the scope of this MTP, which isto consider the practical aspects of vibration testing.
B. Simulation Testing
The overall objective of simulation (random) testing is to reproduce,as closely as is practical, the measured environment in the laboratory. Inperforming a simulation test, first, evaluate the vibratory environment andobtain applicable dynamic data as discussed in the applicable MTP's. (Seereference 4U through 4W). An input is then available for simulation testing.At first, simulation testing may appear to satisfy all of the requirementsfor obtaining realistic test results. However, simulation vibration testingis no more realistic than sinusoidal vibration testing, with one exception.A sinusoidal input to a system is not as likely to induce component collisionsas is random excitation. A sinusoidal vibration input'will usually exciteindividual components singularly as the excitation frequency is varied, whilea random vibration input will usually excite many components simultaneously.This simultaneous excitation of adjacent components may cause collisions thatwould not occur during sinusoidal excitation. However, this is not alwaysthe case, since the structure of a component may tend to filter the excitationand limit the input. This is illustrated in Figure F-13 (Appendix F). M3 andM2 may never collide for a particular ei(t), which is random, because thevalues of the lumped parameters are such that it is sufficiently excited due tofiltering of the input. There are various vibration testing devices available
D-1

?fP 5-2-5071o April 1967
that will simulate a desired vibration environment. These devices areexpensive and usually are difficult to operate in comparison with sinusoidalvibration testing devices.
D-2
MTP 5-2-507.lo April 1967
APPENDIX E
PHYSICAL ARRANGEMENT OF EXCITER AND TEST SPECIMEN
Small test specimens may be mounted directly to the moving elementsof the exciter with appropriate fixtures. It is often necessary or desirableto mount the specimen so that its mass is not supported by the exciter. Thismay be accomplished by suspending the test specimen or by mounting it on anauxiliary table. Paragraphs a through g describe the considerations to begiven to the design, arrangement, and use of fixtures and auxiliary tablesduring vibration testing.
a. Exciter Mounting Test Fixtures -- A mounting fixture should bedesigned if the test specimen is to be mounted directly on the exciter. Thefixture will act as a spring or a series of springs between the exciter andthe specimen. The fixture should be as stiff as possible and have a highnattral frequency. If the fixture is not stiff, it will amplify the signalfrom the exciter at some frequencies and will isolate the test specimen fromthe exciter at other frequencies. Stiffness is also important to assure thatall test specimen mounting points receive the same input level from theexciter. Most tests require that the specimen be excited in three mutuallyperpendicular axes. This requires a versatile fixture or three separatefixtures for the same specimen.
b. Fixture Weight -- All fixtures should be designed to have asmuch mass as possible, as a massive fixture will tend to act as a highimpedance to feedback from the test item. Feedback may distort the inputsignal and cause excessive transverse motion in the case of low fixtureweight with respect to test specimen weight. The maximum force available,from the exciter system and the required acceleration level, must beconsidered in determining the fixture weight.
"c. Dynamic Balance -- If translatory motion of the test specimenis to be produced in the direction desired, the dynamic center of gravity ofthe fixture/test specimen in combination should be located directly overthe center of gravity of the exciter's moving element. This is difficultto achieve as the location of the dynamic center of gravity constantly changeswith variances in excitation frequency, due to phase shifts in the motion ofthe test specimen relative to the motion of the fixture system. Normally,the method of desirning for dynamic balance is to strive for symmetry and todesign the fixture/test specimen combination with its static center ofgravity over the center of gravity of the exciter's moving element. FigureE-1 shows a typical fixture for an exciter mounted test specimen. If anupright fixture is required, care must be exercised in counter-balancing thetest specimen since counter-balancing with rigid mass does not result indynamic balance at all frequencies and may even enhance the dynamic unbalanceat some frequencies. This is caused by phase shifts in the motion of the testitem relative to the motion of the more rigid balancing mass. Use a sparetest specimen to balance the actual test specimen.
E-1

?EIF 5-2-507
10 April 1967
zz
UsU
LU
I--z0 0
0 2U
0 0~
0 00 z-
0LU-
0 x0 EL0 0J
040U
ww
xw
E-2

MTP 5-2-50710 April 1967
d. Fixture Materials and Constructions Methods -- Aluminum andmagnesium are used for fixture materials, where possible, because of theirlow density. Magnesium has better damping properties than aluminum andlower density but is more expensive. Casting is the preferred fabricationmethod when the fixture can not be made from plate or billet stock. Avoidbolted and welded fixture construction. Welds tend to crack under vibra-tion. Bolted fixtures tend to be less rigid than those that are cast andinduce extraneous high frequency excitations. If bolts are used in fixtureconstruction, they should be used in tension/compression. When used inshear they isolate the higher frequencies. The mounting bolt spacing isdetermined by the bolt hole pattern on the exciter and the particular fixturedesign. A fixture may be mounted directly to the exciter or, if necessary,to an adapter plate which is in turn bolted to the exciter. The mountingbolt torque values should be as specified in Table E-I.
e. Design Frequency -- Fixtures should be designed to have the,highest possible natural frequency.
The acceleration gradient across the height of a vertical typemounting fixture may be particularly troublesome. The fixture should havea natural frequency of three times the maximum test frequency. References4-F and 4-T contain formulae for calculating natural frequencies and springfactors. However, these calculations, when applied to an actual complexfixture, will only approximate the resonant frequencies. A practicalapproach to fixture design is to design the fixture, test it by actual use,
( • and make any necessary modifications. Figures E-2 and E-3 illustrate twocommon fixture designs.
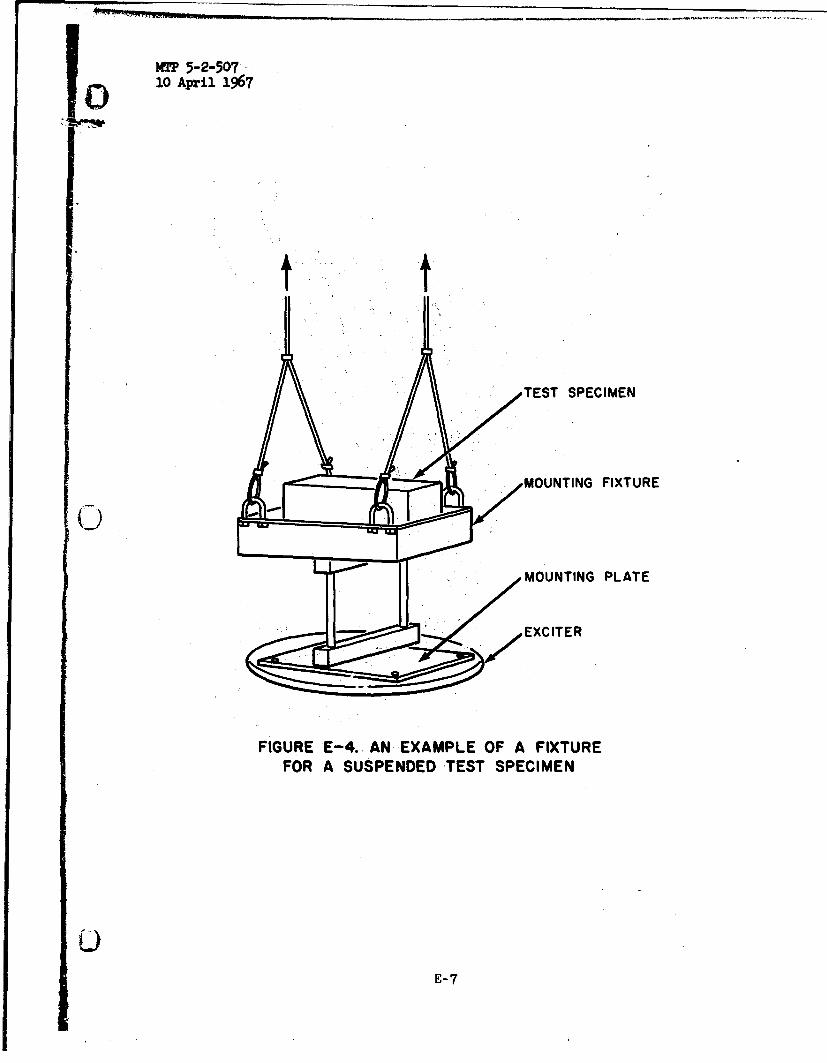
f. Suspension -- A test specimen may be suspended if it is too heavyto be mounted directly on the exciter. The specimen also may be suspendedwhen the same orientation of the test specimen with respect to the gravityvector must be maintained during vibration in three mutually perpendiculardirections. Specimens are also suspended to reduce the extraneous vibrationinputs, produced in directions other than those desired, which may be causedby the mounting fixtures. Use a spring-like suspension system to isolatethe supporting structure from the excitation vibration. T7.e uispension musthave a low natural frequency and an elastic cord, ktnown commercially asBungee Shock cord, is recommended. Attach the test specimen to the exciterwith either a bolted connection or a single drive rod. Since it will actas a spring, the connection should be as stiff as possible or it will amplifythe signal from the exciter at some frequencies and will isolate the testspecimen from the exciter at other frequencies. Figures E-4 and E-5illustrate common exciter specimen connections. When connecting the testspecimen to the exciter, care must be taken not to misalign the connectionand bind the exciter.
g. Auxiliary Tables - Auxiliary tables may be used during vibra-tion testing. These tables take the form of a mounting plate supported byeither flexures or a fluid and are mechanically coupled to the vibrationexciter. They may be supported by air, filled membranes such as an inner
E-3

. P 5-2-50710 April 1967
Table E-I. Mounting Bolt Torque Values
Bolt Size * Torque (Inch-Pounds)
No. 6 20
No. 8 35
No. 10 50
No. 12 60
1/4 85
5/16 14o
3/8 300
7/16 425
1/2 770
5/8 1450
3/4 2500
• Torque values are for steel bolts threadedinto holes tapped into a steel plate with aminimum thread engagement of 1 1/2 times boltdiameters or for steel bolts threaded intoholes tapped into aluminum plate with a threadengagement of 2 1/2 to 3 times bolt diameters.
E-4

I4TP 5-2-507l0 April 1967
wI-
XWWIL~ I-
UU
wID I-lu
I-L
-w0.1-
wxO
Z0
E-5-

yTFi' 5-2-50TtO April 1967 a
LLJL
xILW
w0.I-iW Z
i::IL
W (E-6
MIT 5-2-507o1 April 1967
TEST SPECIMEN
MOUNTING FIXTURE
0
MOUNTING PLATE
S:• EXCITER
FIGURE E-4. AN EXAMPLE OF A FIXTUREFOR A SUSPENDED TEST SPECIMEN
E
E-7

JIT5-2-507 ,
lo April 1967
SUSPENDED TEST SPECIMEN
RUBBER COVER
FIGURE E-5. AN EXAMPLE OF AN EXCITATION INPUT CONNECTIONBETWEEN AN EXCITER AND A SUSPENDED TEST SPECIMEN
E-8
MTP 5-2-5071o April 1967
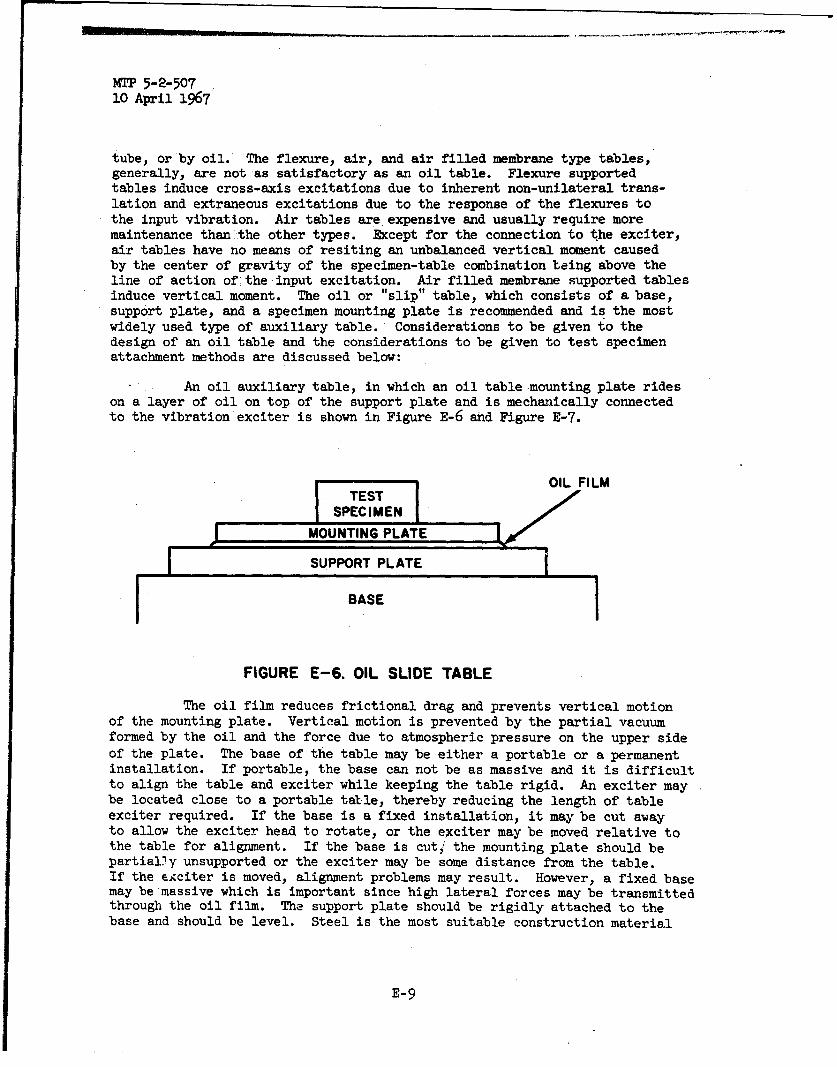
tube, or by oil. The flexure, air, and air filled membrane type tables,generally, are not as satisfactory as an oil table. Flexure supportedtables induce cross-axis excitations due to inherent non-unilateral trans-lation and extraneous excitations due to the response of the flexures tothe input vibration. Air tables are expensive and usually require moremaintenance than the other types. Except for the connection to the exciter,air tables have no means of resiting an unbalanced vertical moment causedby the center of gravity of the specimen-table combination being above theline of action of the input excitation. Air filled membrane supported tablesinduce vertical moment. The oil or "slip" table, which consists of a base,support plate, and a specimen mounting plate is recommended and is the mostwidely used type of auxiliary table. Considerations to be given to thedesign of an oil table and the considerations to be given to test specimenattachment methods are discussed below:
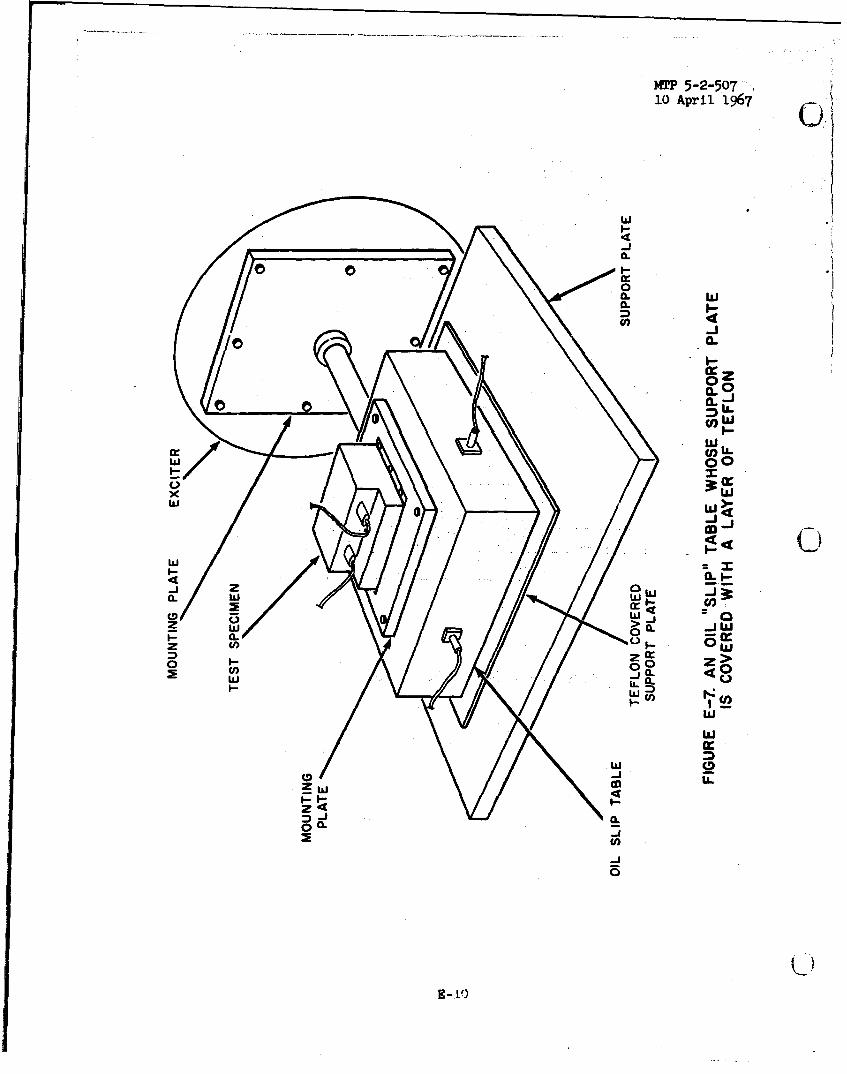
An oil auxiliary table, in which an oil table mounting plate rideson a layer of oil on top of the support plate and is mechanically connectedto the vibration exciter is shown in Figure E-6 and Figure E-7.
OIL FILM
SPEC IMEN
MOUNTING PLATE •
SUPPORT PLATE
BASE
IF
FIGURE E-6. OIL SLIDE TABLE
The oil film reduces frictional drag and prevents vertical motionof the mounting plate. Vertical motion is prevented by the partial vacuumformed by the oil and the force due to atmospheric pressure on the upper sideof the plate. The base of the table may be either a portable or a permanentinstallation. If portable, the base can not be as massive and it is difficultto align the table and exciter while keeping the table rigid. An exciter maybe located close to a portable table, thereby reducing the length of tableexciter required. If the base is a fixed installation, it may be cut awayto allow the exciter head to rotate, or the eXciter may be moved relative tothe table for alignment. If the base is cut,' the mounting plate should bepartially unsupported or the exciter may be some distance from the table.If the exciter is moved, alignment problems may result. However, a fixed basemay be massive which is important since high lateral forces may be transmittedthrough the oil film. The support plate should be rigidly attached to thebase and should be level. Steel is the most suitable construction material
E-9
MTP 5-2-50710 April 1967
41-J0L
w
ozCL
a--
w
U)LLw -j
I.-9E-t

S-. - -• . . . .. .. . .. �.. . "*•~ -~ V... •. ÷
MTP 5-2-5071o April. 1967
since aluminum :or magnesium usually is used in the mounting plate, and thiscombination will produce lower frictional drag than a support plate mounting/
.. plate combination ,constructed of the same material. The surface finish of-.,the support plate ihould.have a 60- to 63-microinch smoothness and should beflat. to.0.002 inch. The sliding surface may have depressions, but must nothave any projections. A mounting plate usually is fabricated from aluminumor magnesium to keep the plate as light as possible. The plate should bethick enough so as not to buckld under column loading and not to flex underthe action of any vertical moments. It also should have a 60- to 63-microinchsmoothness and be flat to 0.002 inch. The sliding surface also may havedepressions, but must not have any-projections. Higher anti-separation forcescan be produced if the mounting plate is surrounded by a puddle of oil ratherthan when the film forms a meniscus between the mounting plate and supportplate. This may be accomplished by providing a constant oil-feed system andby providing a dam around -the mounting plate. The oil-feed system is
Sadvisable since, in time, the plate will force most of the oil from under it.A manifold system should be machined on the bottom of the mounting plate todistribute the force-fed oil. These manifolds usually consist of an outletat the center of-the plate with grooves radiating from the center. Anycommieicial SAE 30 or SAE 40 oils are suitable for slip tables less than 36inches square with light test specimens, small vertical moments, and slidingsurfaces with at least a 6 0-microinch finish. For large tables with heavytest specimens, large pitching'moments, or finishes rougher than a 60-micro-inch finish, commercial gear oil or light grease should be used. The connec-tion between the mounting table-and the exciter should be as stiff as possiblefor the reasons discussed in paragraph f. Bolts should be used in tension/compression since bolts used in shear isolate the higher frequencies. Caremust be taken not to misalign the connection and place the exciter in a bind.The source of greatest uncontrolled problems in the use of the slip table isthe natural phenomenon of wave propagation in solids which produces varyingdisplacements and accelerations along the length of the mounting plate.Plates with lengths of 15 inches or less are not seriously affected by thisphenomenon at frequencies of 2,0001*cps and below, but as plate lengths areincreased, the variation in displacement from point to point becomes excessive,particularly at frequencies. over 1,000 cps. The propagation wave travelsalong the plate and is reflected from the end. When the propagated andreflected waves meet, their amplitudes are combined to produce the phenomenonof "standing waves" in the plate. Thus, there are points of maximum andminimum displacement and acceleration along the length of the mounting plate.The points of minimum displacement are located at the quarter-wave lengthsand the points of maximum displacements are at the half-wave lengths. Thelength of the propagated wave is given by the equation:
where: = Vp/f
= length of propagated wave
E-11

MP 5-2-50710 April 1967
Vp = wave propagation velocity -y
E = Young's Modulus of Elasticity
g = gravitational constant
y = weight of the material per-unit volume
f = frequency of the propagated wave
0
E-12

MTP 5-2-5071o April 1967
APPENDIX F
THEORETICAL CONSIDERATIONS
This appendix describes and illustrates some of the more importanttheoretical considerations and characteristics of vibrations and the problemsassociated with vibration analysis and testing.
a. Transform Methods and Electrical Circuit Analysis Analogy --
The theory and application of circuit analysis has been highly developed.Througý the use of signal flow graphs and mathematical transformations,complex systems can be represented and solved, provided that:
i. The parameters of the system are lumped rather than distributedso that -ordinary integro-differential equations apply.
ii. The system is linear so that all of the network elements arelinear. These systems then may be represented by ordinary differentialequations having constant coefficients. Such equations are solved mosteasily by using Laplace transforms. References 4G and 4H cover the solutionof linear systems using transform methods.
(1) The Laplace Transform -- This transformation aids in thesimplification of functions and operations. It transforms differentiationand integration, respectively, into multiplication and division and transforms
) integro-differential equations into algebraic equations. Laplace trans-formation is somewhat analogous to logarithmic transformation except thatlogarithmic transformation deals with numbers while Laplace transformationis associated with functions. The Laplace transform, f(t), is defined asa function of the complex variable S by the integral:
-St
L [f(t)] = F(S) = 0 f(t) £ dt (1)
where:
L Cf(t)] = the Laplace transform of f(t)
S = +j
t = variable, representing time, in this case, but maybe x, displacement, etc.
= 2.718
f(t) = function of time
F(S) = function of S
F-1
MTP 5-2-50710 April 1967 (
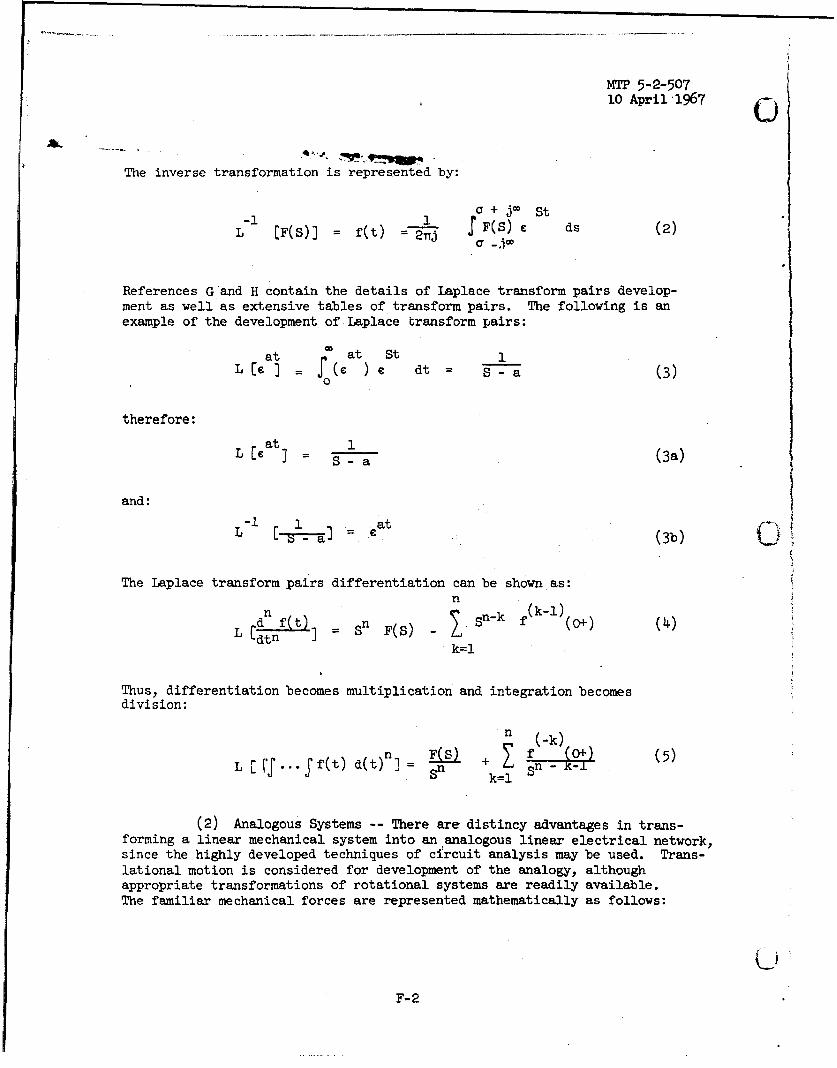
The inverse transformation is represented by:
_1_1 + jOj St-i 1 r F(S) e ds (2)L EF(S)] = f(t) = 2--J F _o(
References Gland H contain the details of Laplace transform pairs develop-ment as well as extensive tables of transform pairs. The following is anexample of the development of Laplace transform pairs:
at at St 1L [C c = j(e ) e dt S - a (3)
therefore:
ii€at 1LCcL a ] S-a (3a)
and:
L1 1-~.~ =*at(3)(IL [- U -- a. : (3b )
The Laplace transform pairs differentiation can be shown as:n
SnSn-k f(k-l)(o+)_d- f~)=S (4)L [dt ] F(S) (0-
k=l
Thus, differentiation becomes multiplication and integration becomes
division:
n f(-k)(+
L rS'.''f(t) d(t)n] =- S + z f- -0- (5)LS k=l
(2) Analogous Systems -- There are distincy advantages in trans-forming a linear mechanical system into an analogous linear electrical network,since the highly developed techniques of circuit analysis may be used. Trans-lational motion is considered for development of the analogy, althoughappropriate transformations of rotational systems are readily available.The familiar mechanical forces are represented mathematically as follows:
F-2
MTP 5-2-50710 April 1967
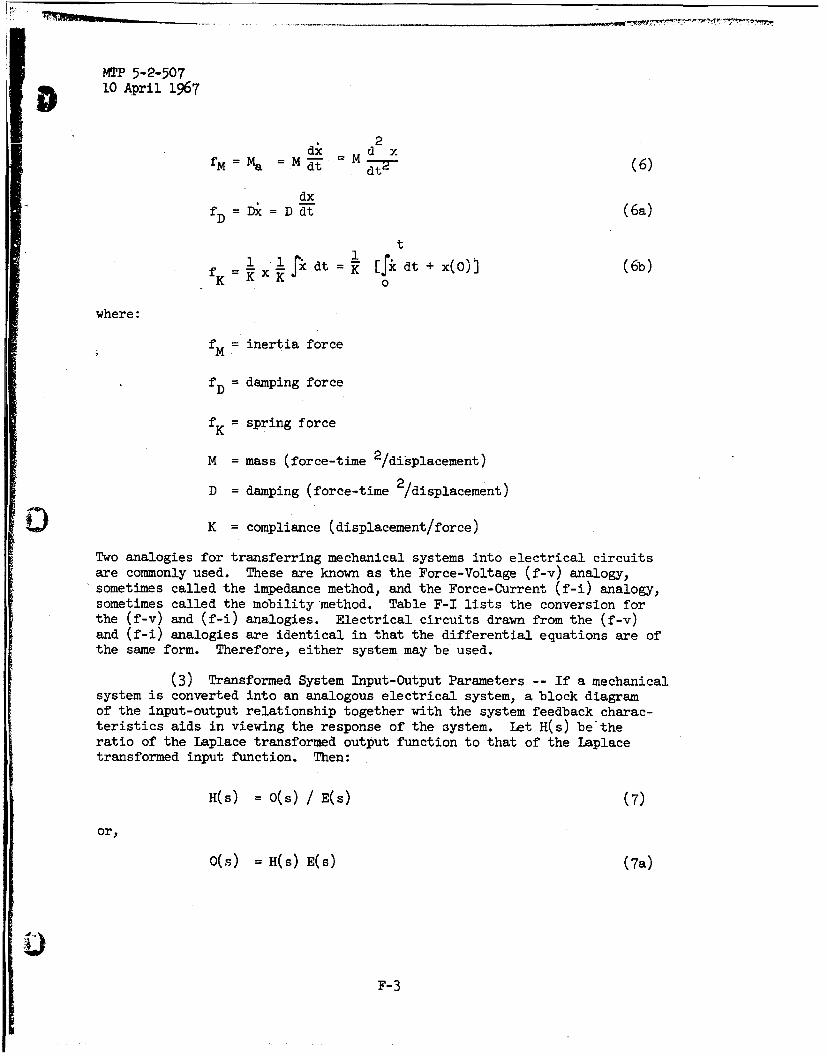
dx d x
dtM = dT (6)
dxfD = Dx D dt ( 6 a)
t1 1 dt + x(O)j (6b)
f= K X KoJ K
where:
fM = inertia force
fD = damping force
fK = spring force
M = mass (force-time 2 /displacement)
D = damping (force-time 2 /displacement)
K = compliance (displacement/force)
Two analogies for transferring mechanical systems into electrical circuitsare commonly used. These are known as the Force-Voltage (f-v) analogy,sometimes called the impedance method, and the Force-Current (f-i) analogy,sometimes called the mobility method. Table F-I lists the conversion forthe (f-v) and (f-i) analogies. Electrical circuits drawn from the (f-v)and (f-i) analogies are identical in that the differential equations are ofthe same form. Therefore, either system may be used.
(3) Transformed System Input-Output Parameters -- If a mechanicalsystem is converted into an analogous electrical system, a block diagramof the input-output relationship together with the system feedback charac-teristics aids in viewing the response of the system. let H(s) betheratio of the Laplace transformed output function to that of the Laplacetransformed input function. Then:
H(s) = 0(s) / E(s) (7)
or,
0(s) = H(s) E(s) (7a)
F-3

MTP 5-2-50710 April 1967
Table F-I. Conversion for Analogies
Electrical System
Mechanical System Force-Voltage Analogy Force-Current Analogy
Force, f Voltage, v Current, i
Velocity, x Current, i Voltage, v
Displacement, X Charge, q Flux Linkage, 4
Mass, M Inductance, L Capacitance, C
Damping Coef- Resistance, R Conductance, G
ficient, DCompliance, K Capacitance, C Inductance, L
where: 00(s) = Laplace transformed output function
E(s) = Laplace transformed excitation function
This condition is shown in Figure F-1.
E(s) • ~) O(s)
Figure F-I Transformed Input-Output Relationship
H(s) may be obtained from a linear system by transforming the response ofthat system to an excitation by a Dirac Impulse function. In all cases,the system initially must be relaxed for the input-output relationship tohold. For passive electrical elements, without initial conditions, thediagrams in Figure F-2 illustrate the input-output relationship.
(9
F-4

WMT 5-2-507O lo April 1967
ELECTRICAL CIRCUIT BLOCK DIAGRAM REPRESENTATION
C
CAPACITANCE I
VC "
L L
INDUCTANCE SL
VR~II:I~i~) RESISTANCE
FIGURE F-2. INPUT-OUTPUT RELATIONSHIPS
The transformed relationships given in Figure F-2 were obtained from thefollowing equations:
tvc (t)= I i (t) dt(8
0
V = I (S)
v =L diL (t)L dt (9)
F-5

MTP 5-2-50710 April 1967
VL (s) = SL 1 L (s)
vR (t) = 'R (t) R (10)
or,
yR (s) = IR (s) R
b. Single Degree of Freedom System --
Figure F-3 illustrates a single degree of freedom, linear, lumpedparameter, simple mechanical system.
M 9 (0) EXCITATION
I FUNCTION (FORCE)0 K
FIGURE F-3. SIMPLE MECHANICAL SYSTEM
Figure F-3 is a hypothetical system, however, it may be used to develop theideas of the effect of damping and resonance on a practical complex system.By evaluation of the homogeneous equation and particular integral, thedifferential equation and its solution may be obtained. The electricalcircuit using the (f-v) analogy is shown in Figure F-4.
R[D] C[K]
L[MJvl(t)[e (t) i [X]. L M
FIGURE F-4. FORCE-VOLTAGE ANALOGYOF SIMPLE MECHANICAL SYSTEM
F-6

MTP 5-2-50710 April 1967
Given that the system is initially relaxed and using Kirchoff's law:
tdi + 1 Jidt =v(t)
Transferring this equation into mechanical terms:
d2 x D dx 1Mdt- + dt+x = c(t)
Using equation (12) and representing
L [e(t)] by E(s) and L [x(t)] by X (s):2
Ms X (s) + D X (s) + X X (s) = E(s) (13)s K
assuming that k (Ot) = x(Ot) = 0.
i° LL) 1 i2 DH(s) = Es s2 + D+1 (14)
The impulse response is formed by finding the inverse transform:
-I -1 •'i 1s ] (5
L CH(s)] = h(t) = L LM 2+ D s + 1(15)
Solving s 2 + D = 0 for the roots,
M2 + (D2 1 Dobtain s =2 - (M) - E Let _ =a•and
1 , then s = -a + 7 and the solution of equation (14),
provided C V 2 , is:
-at 1
LMt) =-7 sin h -t (16)
F-7
MTP 5-2-50710 April 1967
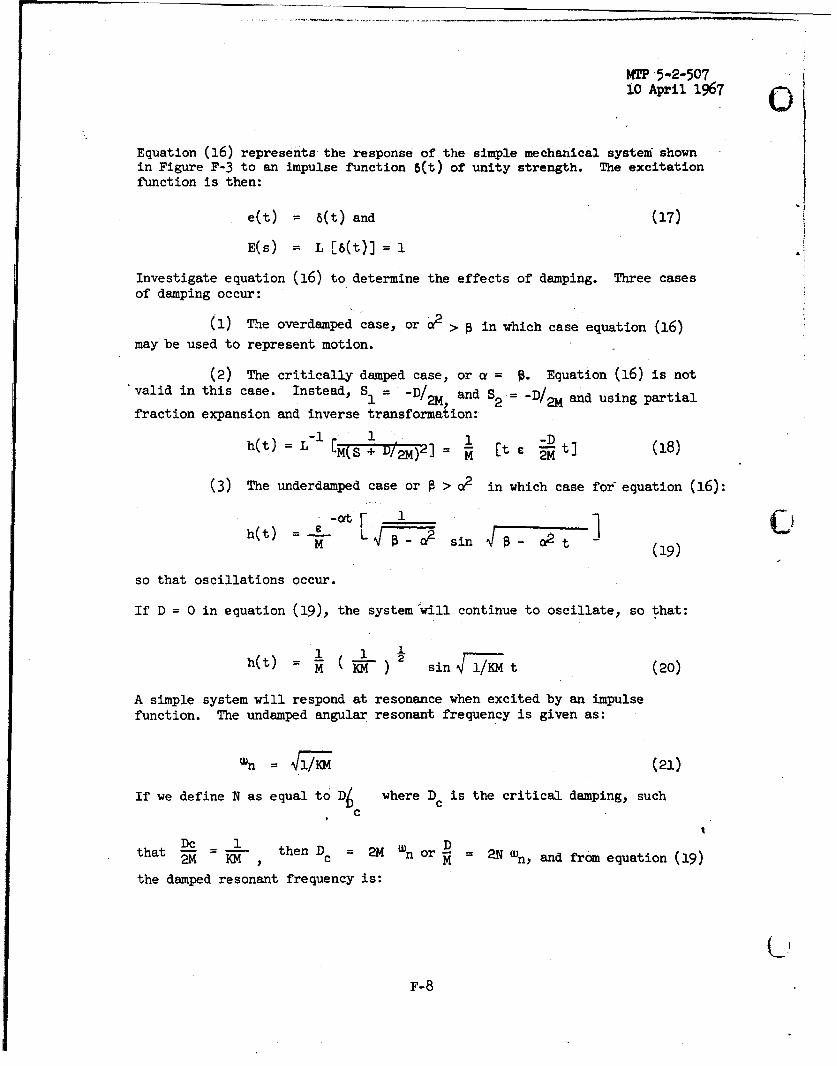
Equation (16) represents the response of the simple mechanical system shownin Figure F-3 to an impulse function 6(t) of unity strength. The excitationfunction is then:
e(t) = 8(t) and (17)
E(s) = L [6(t)] 1
Investigate equation (16) to determine the effects of damping. Three casesof damping occur:
(i) The overdamped case, or U2 > 0 in which case equation (16)
may be used to represent motion.
(2) The critically damped case, or r = c . Equation (16) is notvalid in this case. Instead, SI = -D/2M, and 2 -D/2M and using partial
fraction expansion and inverse transformation:
h(t) = L-1 . 1 . I -D (18)1M + D/24 K 2Mj [ e~t
(3) The underdamped case or P > u2 in which case for equation (16):
1' 1h(t) M -h- L•T sin (1-9 t )
so that oscillations occur.
If D = 0 in equation (19), the system 'will continue to oscillate, so that:
BKM 1 1 1
h1(t) jj ( .)2 sin Ti t (20)
A simple system will respond at resonance when excited by an impulsefunction. The undamped angular resonant frequency is given as:
Wn = (21)
If we define N as equal to Dý where De is the critical damping, suchc
Dc 1Dthat then Dc = 2M wn or = 2N r0n, and from equation (19)
the damped resonant frequency is:
F-8
MTP 5-2-5071o April ,1967
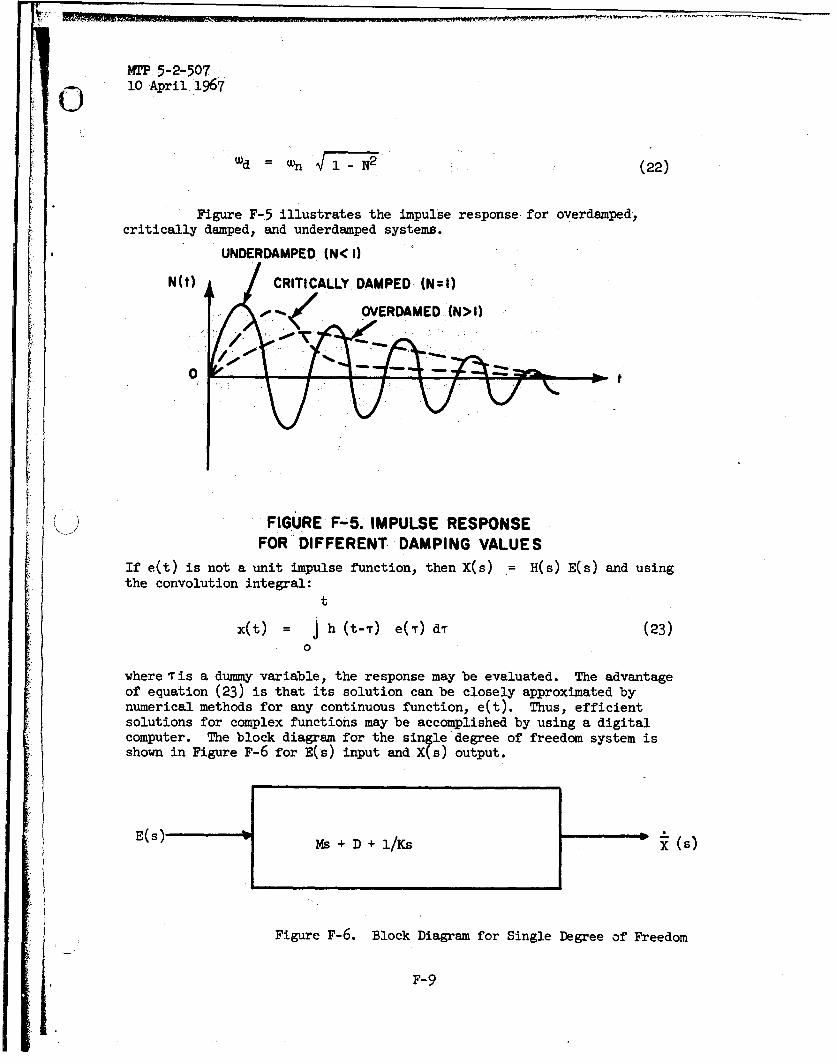
Wd = Wn 1 N2 (22)
Figure F-5 illustrates the impulse response- for overdamped,
critically damped, and underdamped systems.
UNDERDAMPED (N< I)
N(t) CRITICALLY DAMPED (N:I)
OVERDAMED .(N>I)
0 t
FIGURE'F-5. IMPULSE RESPONSEFOR DIFFERENT- DAMPING VALUES
If e(t) is not a unit impulse function, then X(s) = H(s) E(s) and usingthe convolution integral:
t
x(t) = J h (t-T) e(r) dT (23)0
where 'Tis a dummy variable, the response may be evaluated. The advantageof equation (23) is that its solution can be closely approximated bynumerical methods for any continuous function, e(t). Thus, efficientsolutions for complex functions may be accomplished by using a digitalcomputer. The block diagram for the single degree of freedom system isshown in Figure F-6 for E(s) input and X(s) output.
E(s) Ms + D +l/Ks - (s)
Figure F-6. Block Diagram for Single Degree of Freedom
j. F-9
MTP 5-2-50710 April 1967
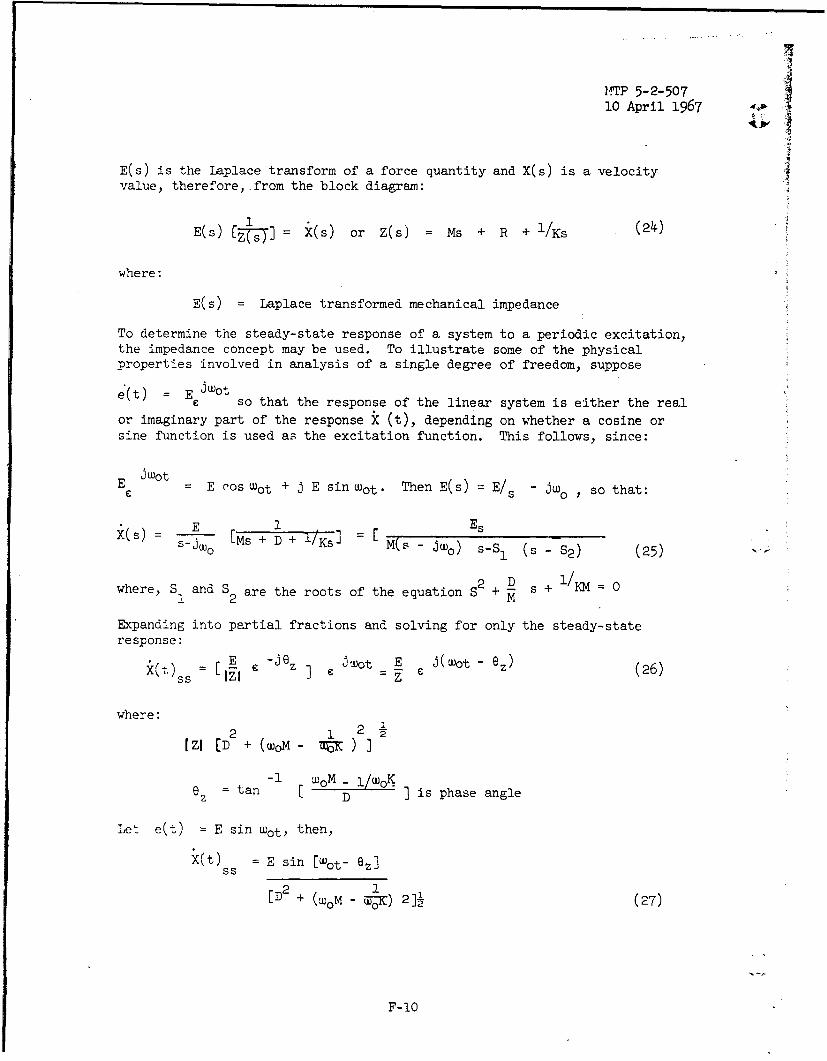
E(s) is the Laplace transform of a force quantity and X(s) is a velocityvalue, therefore, from the block diagram:
E(s) [mz7 -] X(s) or Z(s) = Ms + R +1/Ks (24)
where:
E(s) Laplace transformed mechanical impedance
To determine the steady-state response of a system to a periodic excitation,the impedance concept may be used. To illustrate some of the physicalproperties involved in analysis of a single degree of freedom, suppose
e . t) -- E JWote so that the response of the linear system is either the real
or imaginary part of the response i (t), depending on whether a cosine orsine function is used as the excitation function. This follows, since:
E Wot E osWot + J E sinwot. Then E(s) = E/s - J ' so that:
9.(s) E E.1 s.X ss [Ms + D + 1/Ks] = IM( - (s
S-u)0 s M( -JW)s-S 1 i - S2) (25)
where, S1 and S are the roots of the equation S2 + R s +1 2
Expanding into partial fractions and solving for only the steady-stateresponse:
E j i'Jot E j(wot - ez) (26)X~'ss = IZI z
where:2 2
rzl [D + (wOM - - ) I
-i ,aoM _ l/WoKez = tan [ D j is phase angle
Let e(t) E sin wot, then,
X(t) = E sin [wot- ez]ss
[D2 + (WoM - =o-) 2]½ (27)
F-10
MTP 5-2-5074ý 10 April 1967
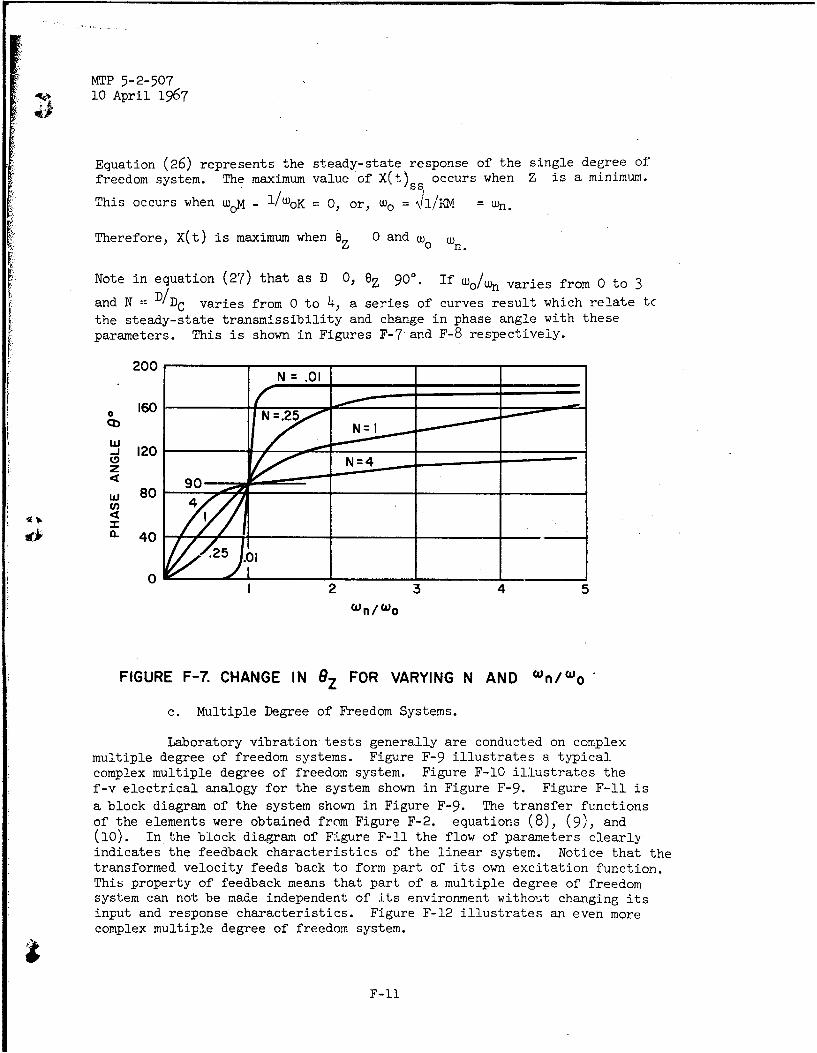
Equation (26) represents the steady-state response of the single degree of
freedom system. The maximum value of X(t) ss occurs when Z is a minimum.
This occurs when woM -1/ /WoK = 0, or, Wo \,i/i. = Wn.
Therefore, X(t) is maximum when a 0 and w
z 0 Wn.
Note in equation (27) that as D 0, eZ 90o. If Wo /wh varies from 0 to 3
and N = D/Dc varies from 0 to 4, a series of curves result which relate tcthe steady-state transmissibility and change in phase angle with theseparameters. This is shown in Figures F-7 and F-8 respectively.
200 N = .01
p 160
-a120
S~0
z
W 804)
16 a- 40
0 I2 3 4 5
wn/lwo
FIGURE F-7. CHANGE IN FOR VARYING N AND Wnl/W
c. Multiple Degree of Freedom Systems.
Laboratory vibration tests generally are conducted on complexmultiple degree of freedom systems. Figure F-9 illustrates a typicalcomplex multiple degree of freedom system. Figure F-10 illustrates thef-v electrical analogy for the system shown in Figure F-9. Figure F-11 is
a block diagram of the system shown in Figure F-9. The transfer functionsof the elements were obtained from Figure F-2. equations (8), (9), and(10). In the block diagram of Figure F-1I the flow of parameters clearlyindicates the feedback characteristics of the linear system. Notice that thetransformed velocity feeds back to form part of its own excitation function.This property of feedback means that part of a multiple degree of freedomsystem can not be made independent of its environment without changing itsinput and response characteristics. Figure F-12 illustrates an even morecomplex multiple degree of freedom system.
F-Il

MTP 5-2-507_o0 April 1967
N=O
5co , - N:.O
CL0-. 4 -
n - • N : . I 5
-3
0,N= 25
z
.5 I 1.5 2 2.5 3woWn
FIGURE F-8. TRANSMISSIBILITY AS A FUNCTION OF
0 AND N
33
K2 D2
M2 2
K D
F mI -t DI
FIGURE F-12. SYSTEM SHOWN IN FIGURE F-9WITH ONE ADDED SPRING MASS

MTP 5-2-50710 April 1967
M2 $ 2(tD K1
e(t)
FIGURE F-9. SYSTEM WITH EXCITATION APPLIED TO BASE MASS
LI[M11 Vo eo(t)]
RI [DOI]
t ( L2 [M 2 ]V [il [l(t)] 1 2[ X t)]S~CI[KI]
FIGURE F-IO. FORCE-VOLTAGE CIRCUIT ANALOGY FOR THE SYSTEMSHOWN IN FIGURE F-9
E s (s) LA 0+K o(S) L M 2s
FIGURE F-Il. BLOCK DIAGRAM OF THE SYSTEM SHOWN IN FIGURE F-9
F-1,3
MTP 5-2-50710 April 1967
L•[M,] L2 [M2 ] L3 [M3]
Vilt) [eilt)]ilX t)i2 , t)iD( t)
C([K1] c 2 [K2 ]
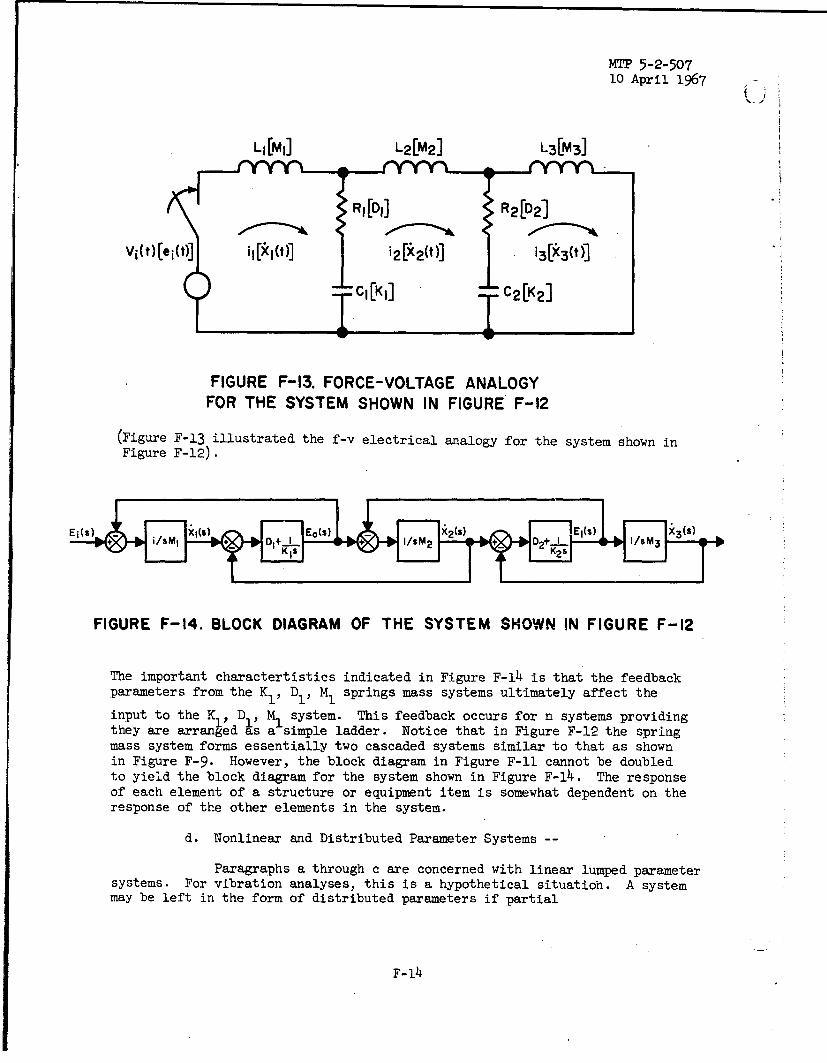
FIGURE F-13. FORCE-VOLTAGE ANALOGYFOR THE SYSTEM SHOWN IN FIGURE F-12
(Figure F-13 illustrated the f-v electrical analogy for the system shown inFigure F-12).
• ÷ , ,•, " . D1+_L -/M D2 I- - /_ o
FIGURE F-14. BLOCK DIAGRAM OF THE SYSTEM SHOWN IN FIGURE F-12
The important charactertistics indicated in Figure F-14 is that the feedbackparameters from the K1 , Dl, Ml springs mass systems ultimately affect the
input to the K , D1 , M1 system. This feedback occurs for n systems providingthey are arranged as a simple ladder. Notice that in Figure F-12 the springmass system forms essentially two cascaded systems similar to that as shownin Figure F-9. However, the block diagram in Figure F-11 cannot be doubledto yield the block diagram for the system shown in Figure F-14. The responseof each element of a structure or equipment item is somewhat dependent on theresponse of the other elements in the system.
d. Nonlinear and Distributed Parameter Systems --
Paragraphs a through c are concerned with linear lumped parametersystems. For vibration analyses, this is a hypothetical situatioh. A systemmay be left in the form of distributed parameters if partial
F-14

MTP 5-2-50710 April 1967
differential equations are used to describe the systems. Solutions ofthese partial differential equations are extremely difficult when thesystem is any but the most simple configuration. References 41 and 4 Jshould be consulted for a thorough study of distributed parameter systems.Assume that the physical parameters of the system can be lumped intoconcentrated elements of damping, stiffness, and mass. Nonlinear equationswill result if the responses of these systems are made dependent upon theresponse level itself. Figure F-15 illustrates a nonlinear restoring force,such as a spring, which is considered as a "hardening" and "softening"situation.
HARDENINGS ,Z<---LI NEAR
RESISTING ALNAFORCE SOFTENING
- ././ -~DISPLACEMENT
!//
FIGURE F-15. EXAMPLE OF NONLINEARRESTORING FORCE
If the spring in the system illustrated in Figure F-3 is assumed to havethe behavior illustrated in Figure F-15 the equation of the motion wouldUe:
M d x +D wdx + xdt2 dt x = e(t) (28)
where:
K(x) = compliance as a function of displacement
Equation (28) may appear to be no more complicated than equation (12).However, analysis will reveal that the Laplace transform and classicalmethods of solution of linear equations are not useful in this case.Special methods must be employed such as equation (28). Figure F-16 showsthe absolute value of the plotted displacement response versus the squareof the angular frequency of excitation for both a hardening and softeningsituation.
F-15
KTP 5-2-507
lo April 1967
S HARDENING SYSTEM
S- ,• SOFTENING SYSTEM-Io,
I,
.0\1",D I / I
'I
- I
e
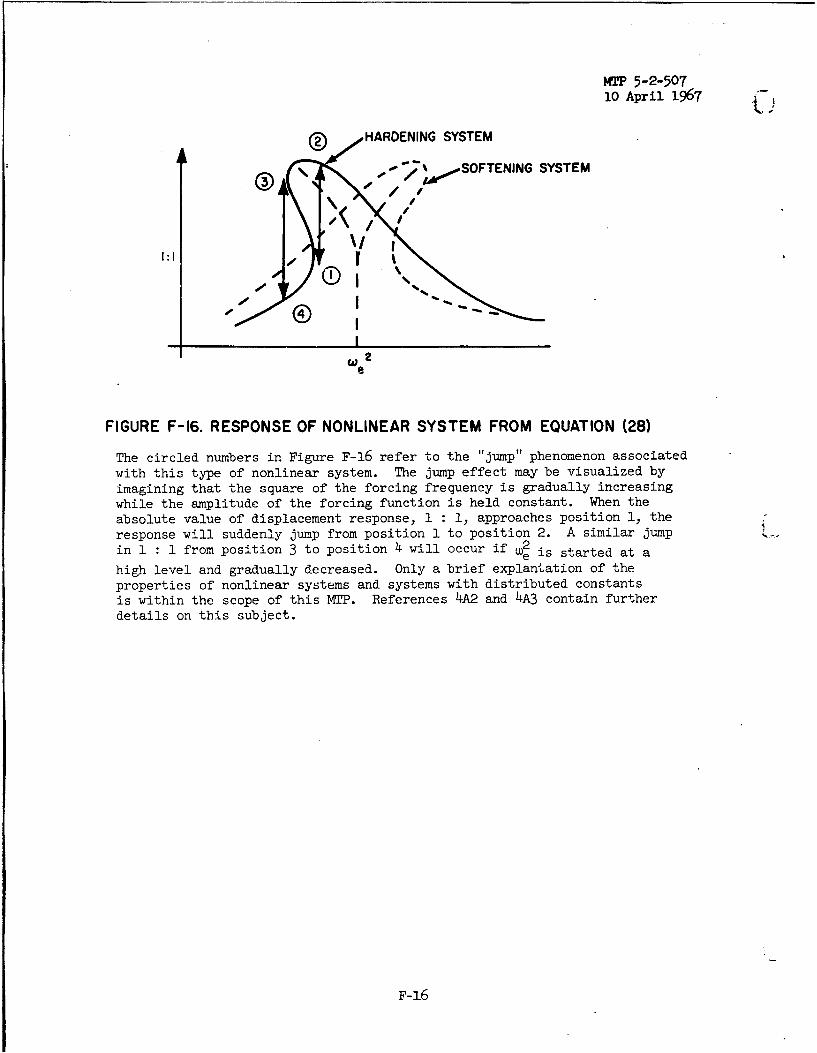
FIGURE F-16. RESPONSE OF NONLINEAR SYSTEM FROM EQUATION (28)
The circled numbers in Figure F-16 refer to the "jump" phenomenon associatedwith this type of nonlinear system. The jump effect may be visualized byimagining that the square of the forcing frequency is gradually increasingwhile the amplitude of the forcing function is held constant. When theabsolute value of displacement response, 1 : 1, approaches position 1, theresponse will suddenly jump from position 1 to position 2. A similar jumpin 1 : 1 from position 3 to position 4 will occur if 2 is started at a
high level and gradually decreased. Only a brief explantation of theproperties of nonlinear systems and systems with distributed constantsis within the scope of this MTP. References 4A2 and 4A3 contain furtherdetails on this subject.
F-16

MTP 5-2-507
10 April 1967
( )
APPENDIX G
MECHANICAL IMPEDIXNCE MATCHING
An item to be vibration tested normally is interconnected withother structures. In Appendix F, paragraph c, the response of a structurefeeds back to effect its own input excitation. The structure to be testedcan be considered as the load and the adjacent structure can be consideredas the source. If the source structure mechanical impedance is high comparedto the shock load structure, the load structure response has little effecton its own input motion. This is indicated in Figure F-il (Appendix F)which illustrated the feedback characteristics associated with the twodegree of freedom system as shown in Figure F-9 (Appendix F). The motionof mass M1 cannot be measured with M2 detached and then used as an input
to excite M2 since this procedure would neglect the feedback effect of M2
into the motion of its foundation M1 . Thus, in a newly developed system, it
is not feasible to measure the motion of the equipment attachment points witha dummy load or with no loading structure in place. Another procedure which,in general, results in overtesting, is to measure the excitation e(t), asshown in Figure F-9 (Appendix F), associated with M in service and then use
this excitation as input on an electrodynamic exciter with the mass of thetable and armature substituted for M In effect, the table/armaturecombination is required to move with excitation e(t) no matter what responseoccurs at M2 . Thus, the feedback characteristics of M2 are not allowed to
affect the input excitation e(t), and the system is overtested. There is nopractical way to avoid this problem completely if e(t) is the only knownparameter. All that may be accomplished is to attempt to move as much ofthe structure as is practical into testing position so that the properrelationship is maintained between the source and load structures. Testpersonnel must relay on technical judgment to determine how far into thestructural elements this matching of impedance should proceed beforesubstituting the table/armature combination characteristics for the actualstructure.
G-1

MTP 5-2-50710 April 1967
APPENDIX H
EQUALIZATION PROBLEMS IN RANDOM TESTING
Vibration test Pquipment may be designed to reproduce a randomvibratory motion that will simulate a service environment. When this motionis the input to a mechanical system, the feedback characteri3tics discussedin paragraph c, Appendix F, and impedance matching considerations discussedin Appendix G become important factors. Specifications may require that thefeedback effect be eliminated by using electronic shaping networks consistingof filters and atteiuators, until the rms acceleration density is "flat" withrespect to frequency. This method is called equalization to a flat spectrum.Other spectra may be obtained by proper selection of attenuator settings andthe use of filters, but equalization to a flat spectrum is most commonlyrequired. The general oesult is overtesting, when a flat input spectrum isused, since an infinite mechanical impedance has been substituted for theactual impedance, and the test specimen response is pot allowed to affectits own input appreciably. Reference 4S recommends that only broad bandequalization be accomr7ished using a dummy test specimen of rigid constructionwhich is securely attached to a vibrator. After equalization is completed,the actual test specimen is substituted for the dummy specimen and nofurther compensation in the input motion of the vibration table is accomplished.Thus, the difficulties in equalization are minimized and the resulting testtends to avoid the over conservatism associated with absolute equalization.Absolute equalization is nearly impossible for complex test specimens sincemany resonances exist and not enough equalization components are availableto eliminate their feedback effects. In addition, as one feedback elementis eliminated, it tends to charge the frequency of feedback In adjacentmechanical elements. Thus, an iteration procedure is necessary in orderthat the feedback of the different mechanical elements is eliminated. Themore, mechanical elements that are considered, the more laborious theiteration procedure becomes. Another factor to be considered in equalizationis the nonlinearity of the test specimen. Nonlinearity was discussed inparagraph d, Appendix F. This discussion revealed that the principle ofsuperposition does not applyl. The net effect of nonlinearityin the testspecimen is to require that equalization be accomplished at the rmsacceleration density to be used during the test. Care must be taken thatequipment is not damaged by vibration during the equalization procedure.If fatigue failures occur, resonance frequencies and response levels willshift and re-equalization will be required. Specifications, which requirerandom testing at flat rms acceleration density usually are difficult toaccomplish and often are unrealistic. Testing to specifications of thistype is not recommended.
H-1.

MTP 5-2-50710 April 1967
APPENDIX I
FAILURE DEECTION PROBLEMS
During a vibration test, the detection and analysis of the causeof failure may be difficult. !or example, during a vibration test, anelectronic circuit in a component under test might fail due to a capacitorshort. This failure might have occurred regardless of the test, or mighthave been a direct result of the test. Other possibilities exist, anda conclusion that the capacitor failed as a result of the test is extremelyuncertain without additional evidence. Careful technical consideration mustbe given to the cause and effect relationship of each failure to preventerroneous conclusions'and unnecessary redesign efforts. There Is nodefinite procedure for failure investigation or troubleshooting, exceptthat drawings, system specification documents, operating instructions, andgood eingineering practices should be used. Failure may be classified asintermittent or catastrophic (fatigue). An intermittent failure is onethat occurs during the test but disappears when the equipment returns tonormal operation after the causitive influence is removed. Catastrophicor fatigue failure is one which results in the structural failure of acomrponenit of the equipment and can be detected by inspection of instru-mentation after the test is concluded.
I-i