block iv receiver tracking loop performance in the presence of a cw … · 2016-06-07 · block iv...
TRANSCRIPT

TDA Progress Report 42-60 September and October 1980
Block IV Receiver Tracking Loop Performance in the Presence of a CW RFI
M. K. Sue Telecommunications Systems Section
This article is a part of a continuing effort to develop models to characterize the behavior of the Deep Space Network (DSN) Receiving System in the presence of a radio frequency interference (RFI). A model that allows one to predict the tracking perfor~ mance of the Block IV receiver in the presence of a CW RFI is discussed. Experimental and analytical results are provided for a typical DSN operational mode. A curve of protection criteria that extends the current CCIR recommendation is also presented.
I. Introduction Communications systems such as the Deep Space Network
(DSN) often are operated in a radio frequency interference (RFI) environment. The high sensitivity required to achieve planetary communications makes the DSN highly sensitive to RFI. To prevent RFI from causing detrimental effects on the DSN Receiving Systems, it is necessary to first determine their RFI susceptibility characteristics. This study is a part of a continuing effort to develop models to characterize the RFI susceptibility of various parts of the DSN Receiving System. When a very strong RFI signal is present at the DSN Receiving System input, it can saturate the maser and various parts of the receiver, producing harmonics, gain compression, and other nonlinearities. These characteristics have been studied in Ref. 1. In this article, we are dealing with CW RFIs that are close in frequency to the carrier frequency. Due to the high sensitivity of the carrier tracking loop, this type of RFI will degrade the carrier loop performance much before saturation effects become noticeable. It is the purpose of this study to develop an analytical model that will allow us to predict the tracking performance of the Block IV receiver when operated in the presence of a CW RFI in the receiver passband. It is
hoped that this model together with the saturation models presented in Ref. 1 can provide information necessary for RFI protection and coordination.
II. Effects of a CW RFI on a Phase Locked Loop
The effects of a CW RFI on a phase locked loop have been studied and documented by various authors (Refs. 2 through 7). The analysis on which the model to be developed is based is, however, from Refs. 2, 3, and 8. For the purpose of self-containment, necessary steps are repeated here. Basically when an RFI is present at the input of a phase locked loop with a fixed frequency offset from the desired signal, it creates a constant phase offset (static phase error) and a beat note that phase modulates the voltage-controlled oscillator (VCO) output. The beat frequency is the RFI offset frequency. Specifically, if we assume that the loop is initially locked to a desired signal with root-me an-square (rms) amplitude A and frequency wc/2rr, and that a CW RFI, with rms amplitude B and offset frequency llw/2rr, is present at the input, then the input to the loop is
155
https://ntrs.nasa.gov/search.jsp?R=19810004718 2020-06-05T01:12:55+00:00Z

x(t) = V2 A sin (w t) + V2 B sin (w + .1w)t c c (I) Instead of solving the set of nonlinear differential equations
Equation (I) can be rewritten as
x(t) = A(t) sin (w/ + oCt)) (2)
where:
AU) = V2 A (1 + R2 + 2 R cos .1wt)I/2 (3)
oCt) = tan- l (R sin (.1wt)/(I + R cos (.1wt))) (4)
and R = B/A is the interference-to-signal ratio (ISR).
Assuming that the phase locked loop remains in lock with the desired signal with a phase error rf;(t), then the veo output is
ret) = -./2cos (w t - rf;(t)) c (5)
The phase detector output, i.e., the error signal, is then
Q(t) = x(t) • ret)
= V; A(t) sin (o(t) - rf;(t)) (6)
where the double frequency term has been ignored.
The phase error, rf;(t), is related to the error signal, Q(t), by Eq. (7)
¢(t) = _KF(P) Q(t) p
(7)
where p = d/dt is the Heaviside operator, K is the open loop gain and F(s) is the loop filter transfer function. For the DSN Block IV receiver, the loop filter is a lead-lag filter having this form:
(8)
where T 1 and T 2 are time constants.
156
(Eqs. 6 and 7) for rf;(t) , Bruno and Blanchard adopted a trial solution,
rf;(t) = A + m sin (.1wt + v) (9)
which yields the following set of constraint equations (Ref. 4),
_ -m 2 0 cos 1/1 - 2 Jo(m)
(10) sin (A)
. -m2 o cos 1/1 sm(A- v) = 2RJ
1(m) (11)
(12)
where 1/1 is the phase angle of F (j.1w),Jo' J1
, and J2
are Bessel functions of the first kind, and 0 is given by this equation,
AKIFU.:lw) I (13)
The term A in the above equations is the static phase error (SPE) and m is the modulation index or phase jitter.
Equations (9) through (12) represent the model of a phase locked loop operated in the presence of a ew RFI. This model assumes a: noiseless condition that is approximately true when the loop is operated at strong signals. At weak signal levels where the noise effect dominates, this model is expected to fail. It is noted that A in the above equations is restricted to the range of -rr/2 to rr/2 with IAI = rr/2 representing the limiting condition beyond which the loop can no longer lock to the desired signal.
To evaluate the RFI effect on the loop, Eqs. (10), (II), and (12) must be solved simultaneously for A, m, and v for a given Rand .1w. This involves solving a set of nonlinear equations, which is not a trivial job. For small values of m, i.e., m «V2, Levitt (Ref. 4) is able to reduce Eqs. (10), (11), and (I2) to an explicit form

m 2 ~ R2/(lj2 + 28 sin 1/1 + 1) (14)
.. ~ -m28 cos 1/1 sm A = 2 (15)
. (" ) -m8 cos 1/1 sml\-v~ R (16)
The explicit form makes it much easier to evaluate the RFI effect and is applicable to the Block IV phase locked loop in most cases.
III. The Effects of a Band Pass Limiter The phase locked loop model presented in the above para
graph does not account for the effects of a band pass limiter (BPL). Since the Block IV receiver has a limiter in the 100-kHz module, the phase locked loop model must be modified to account for the limiter effects before it can be applied to the Block IV receiver. There are two parameters in the model needing modification. In the absence of a band pass limiter, the product AK in Eq. (13) is a constant for a given loop and a given input signal level, independent of the RFI power level. With a band pass limiter, AK must be replaced by O:LK to account for the limiter suppression effects, where K now is the strong Signal open loop gain and O:L is the limiter suppression factor that is a function of both the signal-to-noise ratio and ISR. In addition, due· to the suppression of the signal by RFI and vice versa, the interference-to-signal ratio that the loop sees, called the effective ISR, is not the same as that at the limiter input. This is the second parameter that needs to be modified.
The response of a BPL to two CW signals in noise was studied by J. J. Jones (Ref. 8). Again, only necessary steps are repeated here for clarity. If we assume that the input to an ideal BPL consists of two CW signals in additive narrowband gaussian noise and let Wet) denote the input signal, then
(17)
where WI (t) = V2 A sin (wet) is the signal, W2 (t) =V2B sin «we + .1w)t) is the RFI with offset frequency .1w/2rr, and n (t) is the additive narrowband gaussian noise with total noise power N. The power in the signal is then S I = A 2 and the power in the RFI is S2 = B2. The interference-to-signal ratio at the limiter input is R = B/A = (S2/S 1)1/2.
The output of the BPL consists of both discrete and continuous components due to signal, RFI, and noise. If we let Z(t) denote the output of the limiter near the carrier frequency, then the correlation function of Z(t) is
b2
= '"' '"' '"' 2 KIQIIQ - I i + 111 pK(T)
~ ~ k=li~2 .• ' (K;lil)! (K;lil)!
(18)
where peT) is the correlation function of the base band components of net), normalized to unit power.
The output power for the signal and interference in the fundamental frequency band are:
[ ( S) i
2 (SI) 00 -~ = rr2 Ii ~ i!(i+ I)!
X r (i + 1/2),F, (-I. -i -I; I; ~:~' (19)
(s ) [00 (-~r
= rr~ ~ ~ (i;2
(20)
where ro is the gamma function and 2Fl (a, b, c, d) is the Gauss hypergeometric function.
Assuming that signal components at high-frequency bands can be ignored, we can define a quantity called effective ISR as:
(21)
The limiter suppression factor O:L is given by
(22)
Using Eqs. (21) and (22) and substituting Re for Rand K for AK in Eqs. (10) and (13), we now have a model that can
157
predict the performance of the Block IV receiver in the presence of RFI. The equations defming this model are:
sin (A) _ -m2 0 cos 1/1 - 2 Jo(m)
(23)
(24)
(25)
(26)
where 1/1 as before, is the phase angle of the loop filter, and K is the strong signal open loop gain.
IV. Numerical Results
The analytical model developed in the previous paragraphs has been applied to the DSN Block IV receiver for two tracking modes. These two modes are: (a) wide, Bn = 2 kHz, 2 BLO = 10 Hz, S-band (wide/2 kHz/1O Hz), and (b) wide, Bn = 2 kHz, 2 BLO = 30 Hz, X-band (wide/2 kHz/3D Hz), where Bn is the pre detection noise bandwidth and 2 BLO is the two sided threshold loop bandwidth. Three sets of curves have been generated for each of these two modes. They are:
(I) Receiver drop lock level as a function of RFI offset frequency (ilF) with margin (M) as a parameter, where margin is defined as the ratio of Signal to noise in 2BLO.
(2) Static phase error (A) vs ISR with M' as a parameter.
(3) Rms phase jitter (m/.,ff) vs ISR with M' as a parameter.
These curves are shown in Figs. 1 through 6. It is noted that as the signal or the RFI becomes too large, computation of (S 1)0
or (S2)O breaks down. It is thus necessary to employ asymptotic approximation when this happens (Ref. 8). This explains why the curves in Figs. 1 and 2 are not completely smooth.
158
V. Experimental Verification
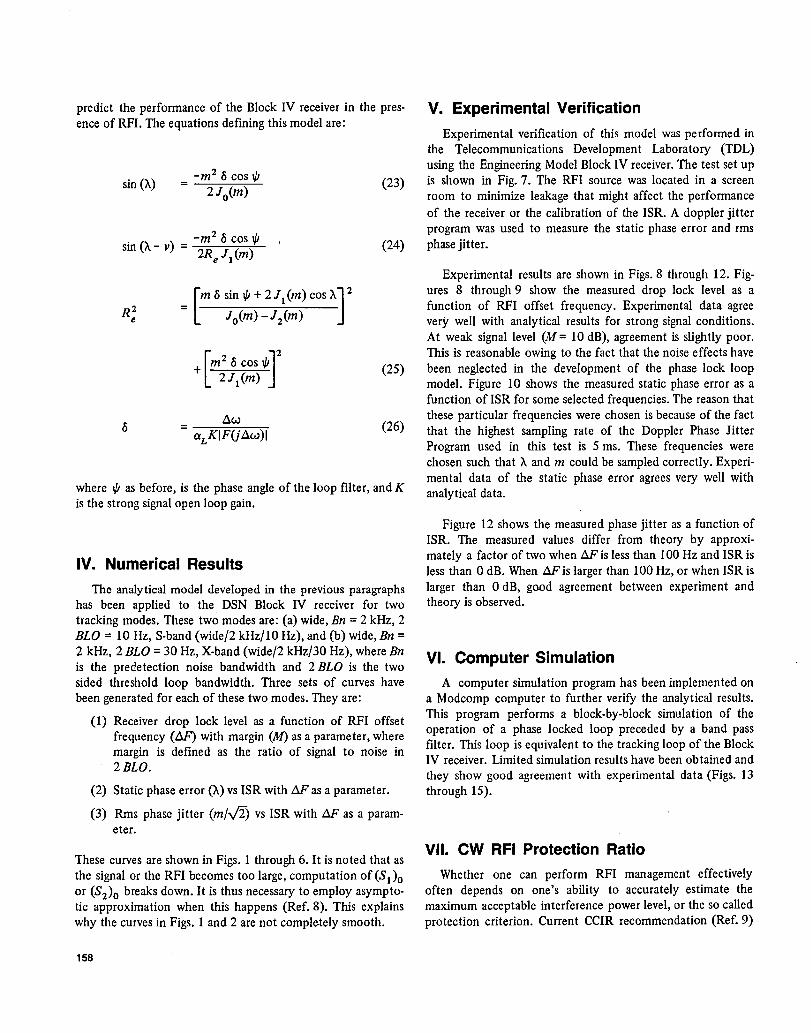
Experimental verification of this model was performed in the Telecommunications Development Laboratory (TDL) using the Engineering Model Block IV receiver. The test set up is shown in Fig. 7. The RFI source was located in a screen room to minimize leakage that might affect the performance of the receiver or the calibration of the ISR. A doppler jitter program was used to measure the static phase error and rms phase jitter.
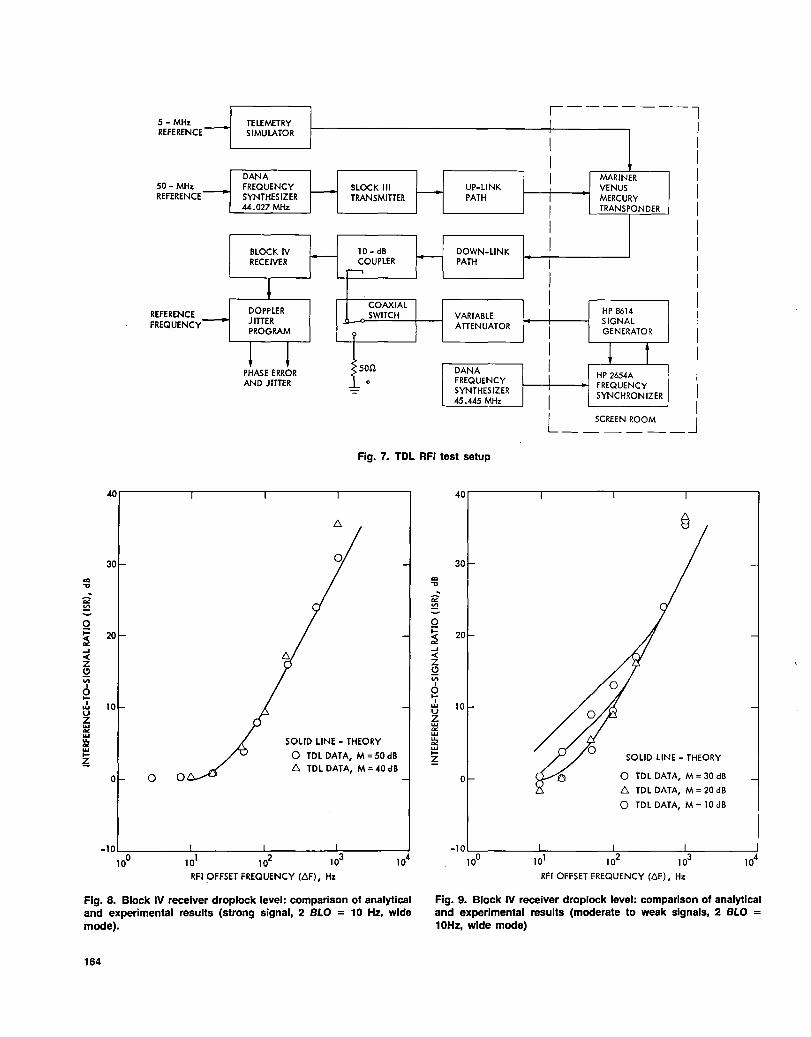
Experimental results are shown in Figs. 8 through 12. Figures 8 through 9 show the measured drop lock level as a function of RFI offset frequency. Experimental data agree very well with analytical results for strong signal conditions. At weak signal level (M = 10 dB), agreement is slightly poor. This is reasonable owing to the fact that the noise effects have been neglected in the development of the phase lock loop model. Figure 10 shows the measured static phase error as a function of ISR for some selected frequencies. The reason that these particular frequencies were chosen is because of the fact that the highest sampling rate of the Doppler Phase Jitter Program used in this test is 5 ms. These frequencies were chosen such that A and m could be sampled correctly. Experimental data of the static phase error agrees very well with analytical data.
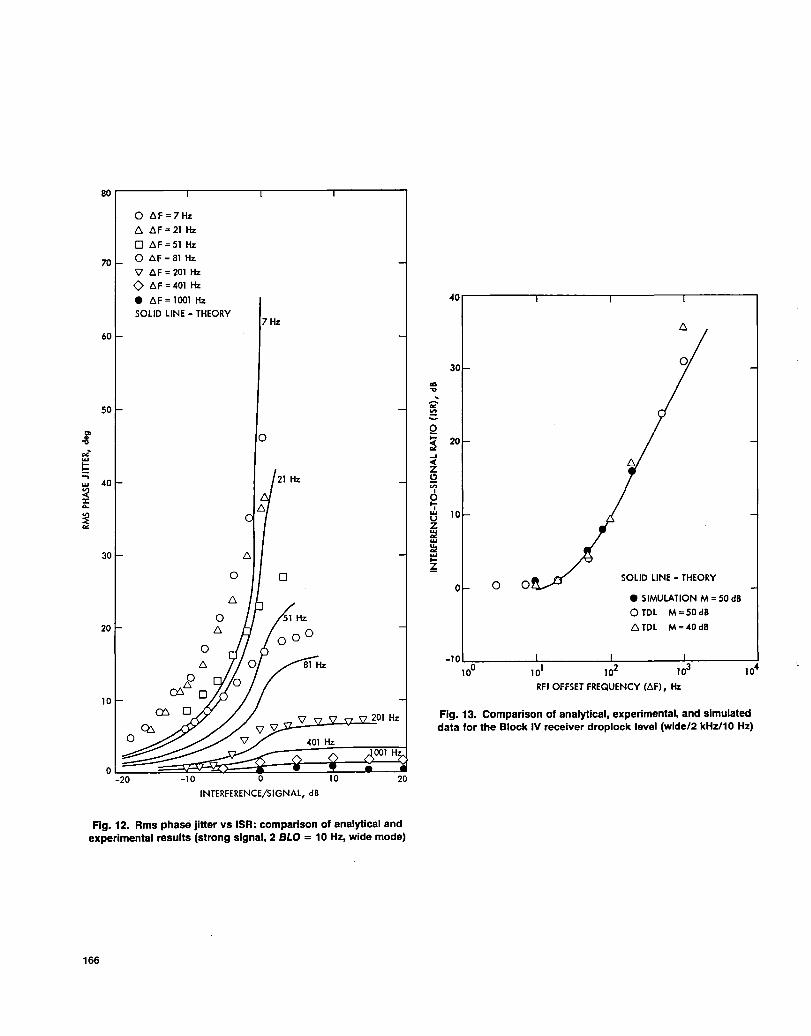
Figure 12 shows the measured phase jitter as a function of ISR. The measured values differ from theory by approximately a factor of two when M' is less than 100 Hz and ISR is less than 0 dB. When M'is larger than 100 Hz, or when ISR is larger than 0 dB, good agreement between experiment and theory is observed.
VI. Computer Simulation
A computer simulation program has been implemented on a Modcomp computer to further verify the analytical results. This program performs a block-by-block simulation of the operation of a phase locked loop preceded by a band pass filter. This loop is equivalent to the tracking loop of the Block IV receiver. Limited simulation results have been obtained and they show good agreement with experimental data (Figs. 13 through 15).
VII. CW RFI Protection Ratio
Whether one can perform RFI management effectively often depends on one's ability to accurately estimate the maximum acceptable interference power level, or the so called protection criterion. Current CCIR recommendation (Ref. 9)

provides worst-case protection criteria based only on interference that may fall in the loop bandwidth. Based on the experimental and analytical results of this study, we have determined protection criteria as a function of frequency for the Block IV receiver under the influence of the type of RFI discussed in this article. A Simplified straight-line approximation of the protection criteria as a function of RFI frequency offset is shown in Fig. 16. This protection is based on a maximum acceptable tracking loop degradation of 10 deg of static phase error or peak phase jitter, whichever is larger. This criterion is consistent with the current CCIR recommendation on protection for deep-space communications, which calls for a maximum acceptable degradation of 10 deg of phase modulation (Ref. 9). The maximum allowable absolute RFI power level in Fig. 16 is based on a 10-dB carrier margin, 10-Hz threshold loop bandwidth, and a -215.0-dBW/Hz noise spectral density. This noise spectral density corresponds to the nominal value expected for X-band operations. While the S-band and Ku-band noise spectral densities are different from that of the X-band, the difference is small enough (1.6 dB, Ref. 9) that Fig. 16 may be considered adequate for all three frequency bands.
Based on Fig. 16, the maximum allowable power level for an in-band interference is -210 dBW. This value confirms the current CCIR recommendation of -220.0 dBW for a I-Hz bandwidth, which corresponds to -210 dBW for a IO-Hz bandwidth.
It is noted that the protection criteria presented here are for receiver tracking only. Effects on telemetry, ranging, doppler, etc., have not yet been considered. Protection criteria for the receiving system as a whole would have to include all these
effects. This will be examined in the future. Meanwhile, it is recommended that Fig. 16 be used for analysis of specific RFI coordination problems encountered by the DSN.
VIII. Conclusion
An analytical model that models the response of a phase locked 'loop preceded by a band pass limiter has been presented. This model can be used to predict the performance of the Block IV receiver carrier tracking loop in the presence of a CW RFI. Sets of curves have been generated for the static phase error, phase jitter, and out-of-Iock values for the Block IV receiver using the often used tracking modes. Experimental verification and some computer simulation have been performed to verify the analytical results. Simulation and experimental results show good agreement with theoretical prediCtion for the static phase error and out-of-Iock values. Predicted phase jitter is consistently lower than the experimental and simulated results by a factor of one-half for small ISR when the offset frequency is small. For large ISR, good agreement is observed. The analytical model assumes a noiseless condition, which is valid only when the loop is operated at strong signal levels. Experimental data indicate, however, that even at the minimum operating signal level of 10-dB carrier margin, reasonably good prediction can still be obtained.
Based on both analytical and experimental results, a protection criteria curve has been developed to protect the Block IV receiver tracking loop against CW RFI. This curve extends the current CCIR recommendation to allow calculation of out-ofband interference.
159

160
Acknowledgment
The author would like to thank H. de la Rambelje of the Telecommunications Systems Section for his computer simulation, J. F. Weese, also of the Telecommunications Systems Section, for his support in TDL, and M. A. Koerner for his invaluable technical discussions.
References
1. Hersey, D. R., and Sue, M. K., "Maximum CW RFI Power Levels for Linear Operation of the DSN Block IV Receiver at S-Band Frequencies," DSN Progress Report 42-56, January and February 1980. Jet Propulsion Laboratory, Pasadena, Calif.
2. Bruno, F., "Tracking Performance and Loss of Lock of a Carrier Loop Due to the Presence of a Spoofed Spread Spectrum Signal," in Proceedings of the 1973 Symposium on sse. Hazeltine Corp.
3. Blanchard, A., "Interference in Phase-Locked Loops," IEEE, AES-lO, No.5, September 1974.
4. Levitt, B. K., "Carrier Tracking Loop Performance in the Presence of Strong CW Interference," DSN Progress Report 42-51, March and April 1979. Jet Propulsion Laboratory, Pasadena, Calif.
5. Britt, C. L., and Palmer, D. F., "Effects of CW Interference on Narrow-Band SecondOrder Phase-Lock Loops," IEEE, AES-3, No.1, January 1967:
6. Kliger, I. E., and Olenberger, C. F., "Phase-Lock Loop Jump Phenomenon in the Presence of Two Signals," IEEE, AES-12, No.1, January 1976.
7. Olenberger, C. F., "Effects of Automatic Gain Control on Phase-Locked Loop Behavior in the Presence ofInterference," IEEE, AES-12.
8. Jones, J. J., "Hard-Limiting of Two Signals in Random Noise," IEEE Transactions on Information Theory, IT-9, January 1963.
9. Recommendations and Reports of the CCIR, 1978, Vol. II, Report 685 and Recommendation 365-3. International Radio Consultative Committee, XIVth Plenary Assembly.

... " '" !!!
Q < '" ..... -< Z Cl v;
I 0 >-
I w U Z w
'" w u.
'" ~ ?;
40r---------,----------.---------,---------,
30
20
10
M = 10dB
0 M = 20 dB
M=MARGIN
RFI OFFSET FREQUENCY (M), Hz
Fig. 1. Block IV receiver droplock levels vs RFI offset frequency with margin as a parameter (wlde/2 kHzl1D Hz)
... " 0< !!!
0 ;= ;S ..... -< Z Q II>
I
0 >-
I w U Z w
'" w Il2 w >-?;
40r---------~---------r--------~---------,
30
20
10
M = 10dB
0 M = 20 dB
M=MARGIN
-IO~--------~--------~~---------'-----------' 100 101 104
RFI OFFSET FREQUENCY (AF), Hz
Fig. 2. Block IV receiver droplock levels vs RFI offset frequency with margin as a parameter (wide/2 kHzl3D Hz)
161

'" .. "" ~.
0 ~
'" ... ... V1
< :z: .... u ~ 0-V1
162
-so
-70
t:.F = 10 Hz
50 Hz
-60 100 Hz
-50
-40
-30
-20
-10
oL-______ ~~~ __ ~~ ______ ~ ______ ~ -20 -10
INTERFERENCE/SIGNAL, dB
Fig. 3. SPE vs ISR with ~F as a parameter (strong signal, 2 BLO = 10 Hz wide mode)
If "" ~ . ... 0-t: ..., ... ~ :z: .... ~ ~
~r---------r---------r--------'--------~
50
,(0
30
20
10
-10 o INTERFERENCE/SIGNAL, dB
10 1000 Hz
20
Fig. 4. Rms phase jitter vs ISR with ~F as a parameter (strong Signal, 2 BLO = 10 Hz, wide mode)

'" " ."
o.!-
0 o.! o.! w w
~ J: "-U
~ t-V)
_~r--------r--------TT-r---.-.--------'
OHz
,..80
t.F=10Hz
-70
-60
-50
100 Hz
-40
-30
-20
1000 Hz -10
O~ ____ ===±~~ __ ~~ ________ ~ ______ ~ -20 -10 0 20
INTERFERENCE/SIGNAl, dB
Fig. 5. SPE vs ISR with AF as a parameter (strong signal, 2 BLO = 30 Hz, wide mode)
i' ."
o.!-W
!:: ., w
~ J: "-
~ o.!
70,--------,---------.--------,--------,
60 10 Hz
50
40
30
1000 Hz
OL_2-0---------~10~--~~~~------~1~0--------~20
INTERFERENCE/SIGNAL, dB
Fig. 6. Rms phase jitter vs ISR with AF as a parameter (strong signal, 2 BLO = 30 Hz, wide mode)
163
5 - MHz REFERENCE :-
50- MHz REFERENCE -
REFERENCE FREQUENCY .-
TELEMETRY SIMULATOR
DANA FREQUENCY SYNTHESIZER 44.027 MHz
BLOCK IV RECEIVER
l DOPPLER JITTER PROGRAM
JASE ERR1R AND JITTER
f---- BLOCK III I--TRANSMITTER
I-- 10 - dB I--COUPLER I"'
COAXIAL SWITCH
son 0
2=-
UP-LINK PATH
DOWN-LINK PATH
VARIABLE ATTENUATOR
DANA FREQUENCY SYNTHESIZER 45.445 MHz
1-------l I I I I I I I I
I
I I I I
I I I I I
! I I
! I
MARINER VENUS MERCURY TRANSPONDER
HP 8614 SIGNAL GENERATOR
l t HP 26S4A FREQUENCY SYNCHRONIZER
I I I I I I I I I
L SCREEN ROOM J ------
Fig. 7. TDL RFI test setup
40.-----~----.------r-----,
30
... .., "2 !a -0
~ 20 .... « z Q V'I
I 0 ....
I 10 ... u Z ... "" ... ::z SOLID LINE - THEORY ... .... o TDLDATA, M=50dB ?;
6. TDL DATA, M = 40 dB 0 0 0
-10'--::r--------'-:------'-:r----~:__---__! 10
0 10
1 10
4
RFI OFFSET FREQUENCY (~F), Hz
Fig. 8. Block IV receiver droplock level: comparison of analytical and experimental results (strong signal, 2 BLO = 10 Hz, wide mode).
164
40,-----,------,,-------,------,
30
"" .., "2 !a
0 ;:
20 ;:; .... « z Q V'I
I 0 ....
I 10 ...
u Z w
"" ... LL
'" w .... SOLID LINE - THEORY ?;
0 0 TDL DATA, M = 30 dB
6. TOL DATA, M = 20 dB
0 TOL DATA, M = 10 dB
-10~----~----~----~----~ If 1~ 1~ 1~
RFI OFFSET FREQUENCY (~F), Hz
Fig. 9. Block IV receiver droplock level: comparison of analytical and experimental results (moderate to weak signals, 2 BLO 10Hz, wide mode)

40 0
30
'" "0 . 2 ~
0 ~ 20
'" ...J « z C> VI
I 0 t-
I 10 w u z w
'" w l:! w .... ~
0 0 0 0 SOLID LINE - THEORY
o TDL DATA, M = 50 dB
-10~ ________ ~ ________ ~ ________ ~~ ______ ~
100 101 102
103 104
RFI OFFSET FREQUENCY (t::.F),
Fig. 10. Block IV receiver droplock level: comparison of analytical and experimental results (strong signal, 2 BLO = 30 Hz, wide mode)
2' -0
0"-0 '" '" w w VI « :I: "-
!d .... « .... VI
-90
-80
-70
-60
-50
-40
-30
o M=7Hz t::. M=21 Hz 7 Hz D6F=51Hz
o M=81 Hz
'V M = 201 Hz
o 6F =401 Hz .6F=I00IHz
SOLID LINE - THEORY
21 Hz
o INTERFERENCE/SIGNAL, dB
81 Hz
51 Hz
10
Fig. 11. SPE vs ISR: comparison of analytical and experimental results (strong signal, 2 BLO = 10 Hz, wide mode)
165
80
06F=7Hz
6. M =21 Hz
o M=51 Hz
70 o 6F = 81 Hz
'V 6F = 201 Hz o M=401 Hz
• 6F = 1001 Hz SOLID LINE - THEORY
7Hz
60
50
i' "0 o ",,' ... !: .., ... 40 ~ ::c ... ~ ""
30
o o
20
o
10
OL_2;0::::~~_;I~O~~~~~Ot:::~::::~10t===](==:j2~O INTERFERENCE/SIGNAL, dB
Fig. 12. Rms phase jitter vs ISR: comparison of analytical and experimental results (strong signal, 2 BLO = 10 Hz, wide mode)
166
40
30
o o o
t::.
SOLID LINE - THEORY
• SIMULATION M = 50 dB
o TDL M=50dB
6. TDL M = 40 dB
-IO~ ________ ~ ________ ~ ________ ~ ______ ~
100 101 104
RFI OFFSET FREQUENCY (6F), Hz
Fig. 13. Comparison of analytical, experimental, and simulated data for the Block IV receiver droplock level (wide/2 kHzll0 Hz)

_~r-------~--------.-~Ih,r~--------.
-80 !IF = 51 Hz M=81 Hz
SOLID LINE - THEORY -70 o SIMULATION !IF = 81 Hz
0
[:, SIMULATION !IF = 51 Hz
o TDL DATA, !IF = 51 Hz
o TDL DATA, !IF = 81 Hz
-60
0
'" 0 " -0
0<' -50 0 0 0< '" .... UJ VI
~ 0 .... u ;= < -40 .... VI
-30
20
INTERFERENCE/SIGNAL, dB
Fig. 14. Comparison of analytical, experimental, and simulated data for the Block IV receiver static phase error (wldel2 kHzl10 Hz)
'" " -0 0<' .... -.... t:: ..., .... VI
~ .... VI
~
50r---------,---------,---------,--------,
40
30
20
10
0 -20
THEORY
SIMULATION
o TDL DATA, !IF =51 Hz o TDL DATA, !IF = 81 Hz
0
" o / i'
/ 0' I
9'0 / /
0 CY 9/
-10 0
INTERFERENCE/SIGNAL, dB
} !IF = 81 Hz
10 20
Fig. 15. Comparison of analytical, experimental, and simulated data for the Block IV receiver rms phase jitter (wlde/2 kHzl10 Hz)
30 UJ .... .... -170 ::J .... < 20 ~~ Z ~ -180 '" '" <-0 VI 10 ~ ..... I", 0-0 -1~
",UJ .... <> I • ~~ .... 0 0 u- 00<
~< -200 :::l~ 0<'" -10 ~2 .... ~ -210 w ::J-.... -20 ::!:~ ~ -220 ~ -30
100
101
102
103
104
I RFI OFFSET FREQUENCY (M), Hz
Fig. 16. Recommended protection criteria for CW RFI for Block IV receiver (absolute power level based on 1O-dB carrier margin and -205 dBW noise power In a 100Hz bandwidth)
167