blockage effects on the aerodynamics of a pitching · pdf fileblockage effects on the...
TRANSCRIPT
Blockage Effects on the Aerodynamics of a Pitching Wing
Yongsheng Lian∗
University of Louisville, Louisville, Kentucky 40292
DOI: 10.2514/1.42215
The blockage effects on the aerodynamic characteristics of stationary wings have been extensively studied, both
numerically and experimentally. However, the effects on flapping wing aerodynamics have not been fully explored.
In this paper, the blockage effects on the aerodynamics of a pitching wing are investigated using a numerical
approach. The flowfield is described by solving the Navier–Stokes equations on an overlapping grid. The wing
motion is handled by a moving overlapping grid method. Force histories at different blockage ratios and reduced
pitching frequencies are compared. Simulations show that the pitching motion canmitigate the blockage effects: the
higher the reduced frequency, themoreminimal the blockage effects. In addition, the sidewall effects are studied. It is
demonstrated that sidewalls can lead to a strong spanwise variation in the flowfield, and the variation is further
extenuated by the existence of a leading-edge vortex.
Nomenclature
Ap = oscillation amplitudeb = spanc = chord lengthCD = drag coefficient per unit spanCL = lift coefficient per unit spanCT = thrust coefficient per unit spanD = diameter of a circular cylinderf = pitching frequencyk = reduced frequency, �fc=U0
KC = Keulegan–Carpenter number, 2�Ap=DRe = Reynolds number, U0c=�S = reference cross-sectional area of wingT = period, 2�=!U0 = reference velocity, typically freestream velocity� = Stokes parameter, �D2=��T�� = pitching angle of attack�0 = pitching amplitude� = viscosity� = kinematic viscosity� = fluid density! = oscillating circular frequency
Introduction
M ICROAirVehicles (MAVs) have drawn growing interest fromboth engineering and science societies because of their
potential military and civilian applications [1]. Typically, an MAVhas a maximum dimension of 15 cm or less and a flight speed of lessthan 15 m=s. Because of their small size and low flight speed, MAVsoperate at low Reynolds numbers (Re � 104), and flow aroundMAVs is characterized with rich unsteady phenomena. Con-sequently, the principles that have guided us for aircraft designcannot be directly applied to MAV design, since these principles arecalibrated for steady-state high-Reynolds-number flight. In MAVdesign, one of themost challenging issues is to generate sufficient liftto keep the vehicle airborne. Recent research has identified thatflapping wings take advantage of unsteady mechanisms to enhancetheir lift generation capability [2,3]. This, together with other
characteristics such as gust resistance [4], makes flapping wings themost promising candidates for MAV design. In the study of flappingwings, the following issues have been extensively discussed andstudied:
1) To what extent does flapping wing aerodynamics need to behandled by unsteadymodels?While flappingmotions and associatedfluid flows are intrinsically time dependent, at high frequency, thenoncirculatory effect can dominate, and the classical attached flowmodels and quasi-steady models seem to be able to capturesubstantial essence for certain flyers [5].
2) Towhat extent can the lift be expressed as an analytical functionof the wing kinematics? That is, when are the aerodynamic forcesclosed-form functions of the angle of attack and its first fewderivatives?
3) To what extent does the Reynolds number affect the flappingwing performance? The drag polar and lift curve slope of fixedairfoils at Re < 105 are profoundly affected by laminar flowseparation, exhibiting the so-called drag bulge. These phenomena arestrongly dependent on Reynolds number, airfoil surface roughness,and ambient turbulence intensity. It is not clear whether flappingwings will show similar patterns.
4) What is the role of each parameter in flapping wingperformance? The Strouhal number, reduced frequency, plungeamplitude, pivoting point, and phase lag all affect the flapping wingperformance. Identifying their individual roles is critical in theMAVdesign. Unfortunately, because the exploration of such a wide spaceis a formidable task, the question is still not clear.
Blockage and sidewall effects have been extensively studied forstationary wings. However, their effects on flapping wing aero-dynamics have not drawn enough attention. In flapping wingexperiments, especially in water-tunnel experiments, wings can be inthe close proximity of the top and bottom surfaces. There is evidencethat blockage and sidewalls can affect the flapping wing aero-dynamics. For example, Ol [6] observed strong three-dimensional(3-D) flow behavior in his two-dimensional (2-D) experimentalsetup. In his experiment, an aspect-ratio-3 wing wasmounted wall towall with a small clearance (equivalent to boundary-layer thickness)between the wingtip and sidewall. The wing experienced a plungemotion with the amplitude of 0:05c. Ol observed that the spanwiseflow in the shed vortices became stronger with increasing reducedfrequency. His experiment also demonstrated that the spanwise flowwas not due to the intrusion of the rig’s centered-mounted plungerods.
It is known that sidewalls can produce 3-D effects, of which atypical example is the spanwise flow in shed vortices in thewake [6].When flow passes a cylinder, the flow shows 3-D vertical instabilityin thewake.Williamson [7] attributed this instability to the particularboundary conditions at the spanwise ends of the cylinder. However,the spanwise velocity in the wake is typically much smaller than the
Received 15 November 2008; revision received 23 July 2010; accepted forpublication 1August 2010. Copyright © 2010 byYongsheng Lian. Publishedby the American Institute of Aeronautics and Astronautics, Inc., withpermission. Copies of this paper may be made for personal or internal use, oncondition that the copier pay the $10.00 per-copy fee to the CopyrightClearance Center, Inc., 222 Rosewood Drive, Danvers, MA 01923; includethe code 0001-1452/10 and $10.00 in correspondence with the CCC.
∗Assistant Professor, Mechanical Engineering Department; [email protected]. Senior Member AIAA.
AIAA JOURNALVol. 48, No. 12, December 2010
2731
Dow
nloa
ded
by Y
ongs
heng
Lia
n on
Feb
ruar
y 7,
201
3 | h
ttp://
arc.
aiaa
.org
| D
OI:
10.
2514
/1.4
2215

freestream velocity. In Ol’s experiment [6], the spanwise velocity iscomparable to the freestream velocity. Obviously, this large variationcannot be readily modeled by the flow instability theory.
Flapping wing simulations typically use large computationaldomains to mitigate the blockage effects. This is hardly true for theexperiment. For example, Dickinson et al. [8] tested a 25-cm-longmodel wing immersed in a 1 � 1 � 2 m tank filled with mineral oil.At the closest position, the wingtip came within 22 cm of the topsurface and 18 cm from the sidewalls. Ol [6] tested a flappingrectangular wing in a water channel. At the closest point, the wingcame within less than 2c of the top and bottom surfaces.Koochesfahani [9] experimentally studied a pitching NACA0012wing. The experiment was done in a low-speed channel with a50-cm-wide and 76-cm-deep test section. The test wing had a chordof 8 cm. The experiment was run with pitch amplitudes of 2 and 4�
and a reduced frequency ranging from 1.0 to 12. He calculated themean thrust coefficient by measuring the momentum of the time-averaged velocity profiles on a control volume. His results showednoticeable difference from the simulated solutions by others,especially at high reduced frequencies. Ramamurti and Sandberg[10] stated that Koochesfahani’s experiments [9] increasinglyoverpredicted the thrust with increasing pitching frequency, citingthe ignorance of the unsteady effects and pressure differences on thecontrol volume. Bohl and Koochesfahani [11] demonstrated thatinclusion of the unsteady velocity quantities could significantlyimprove experimental prediction of thrust for high-frequency low-amplitude pure-plunge cases. Lian and Ol [12] performed acombined experimental and numerical study of a pitching flat plate.Using the same domain as the experiment, the simulation predictedthe same maximum lift coefficient as the experiment; using a largerdomain, the simulation predicted a much higher maximum liftcoefficient.
A thorough understanding of the blockage and sidewall effects iscritical in the study offlappingwing aerodynamics. It not only guidesus to properly design the experiment and make blockage correctionsbut helps us interpret the disparity between the numerical andexperimental data so improved numericalmodels can be proposed. Inthis paper, we numerically study the blockage and sidewall effects ona pitching wing.We compare the force histories at different blockageratios and reduced frequencies. Since flapping wing performance isaffected by various factors, such as wing kinematics and Reynoldsnumber, the effects of blockage and sidewall may vary from case tocase. We are not intent to exhaust all the combinations but toquantitatively demonstrate the blockage and sidewall effects onpitching wing aerodynamics.
Numerical Methods
We solve the time-dependent incompressible Navier–Stokesequations with finite differences on a curvilinear overlapping grid.Themethod is fourth-order accurate in space and uses themomentumequations for the velocity coupled to a Poisson equation for pressure[13]. Time stepping is accomplished using a second-order-accurateAdams predictor–corrector method [14].
We use a moving overlapping grid approach [15] to dynamicallyupdate the computational grid to accommodate thewingmotion. Theoverlapping grid uses boundary-conforming structured grids toachieve high-quality representations of boundaries. It employsCartesian grids as the background grids so that the efficienciesinherent with Cartesian grids can be exploited. The irregularboundary associated with standard Cartesian grid methods takes theform of the interpolation boundary between overlapping grids.
Results and Discussions
Code Validation
We first validate our code to establish the confidence in itsprediction capability in the study ofmoving body problems. The casechosen is a transversely oscillatory circular cylinder in stationaryflow. The circular cylinder has a diameter of D, and its motion andvelocity are described as follows:
x�t� � �Ap sin�!t� (1)
_x�t� � �Ap! cos�!t� � �Um cos�!t� (2)
where Ap is the oscillation amplitude, ! is the oscillation circularfrequency, and Um is the maximum oscillation speed. Tatsuno and
Fig. 2 Inline force [in Eq. (5)] computed over a 2-D circular cycle at
Re� 100 and KC� 5.
Slip wall
Slip wall
Inlet u=U
0
h
h
O-type airfoil grid
Fine wake grid
Coarse Cartesian background grid
Outlet
Fig. 3 Boundary conditions used in the simulation of flapping wing.
x
y
D=1x
y
D=1
No-slip wall
No-slip wall
No-slip wall No-slip wall
h
h
hhFig. 1 Computational setup for the transversely oscillating circularcylinder.
2732 LIAN
Dow
nloa
ded
by Y
ongs
heng
Lia
n on
Feb
ruar
y 7,
201
3 | h
ttp://
arc.
aiaa
.org
| D
OI:
10.
2514
/1.4
2215

Bearman [16] illustrated that the complexity of the vortex patternswere determined by the following two parameters:
KC�UmTD
(3)
Re� �UmD�
(4)
where T � �2�=!� is the oscillation period, � is the fluid viscosity,and � is the viscosity. In our study, the Reynolds number Re is 100and the KC number is 5. Under this condition, two vortices shedsymmetrically per half cycle, and flow is essentially 2-D [16,17].
The inline unsteady force acting on the cylinder per unit span canbe modeled with a semiempirical Morison equation [18,19]:
F1�t� � �12�DCD _xj _xj � 1
4��D2CI �x (5)
where CD and CI denote the drag coefficient and added mass,respectively. For anRe of 100 and aKC of 5, Dutsch et al. [17] used afinite volume method to determine that CD � 2:09 and CI � 1:45.Another numerical analysis byUzunoglu et al. [20] showed a slightlydifferent value of CD � 2:10.
The computational setup is shown in Fig. 1. The center of thecylinder is initially at the origin (x� 0 and y� 0). The no-slipboundary condition is imposed on all outer boundaries. Our testsshow that a domain size of h� 6D is sufficiently large enough thatthe imposed boundary conditions influence the forces insignificantly.
In Fig. 2, the inline force variation with time is presented. Thecomputed result is compared with the semiempirical prediction ofEq. (5) and the numerical result of Uzunoglu et al. [20]. A reasonableagreement exists between the inline force from three analyses.
Pitching Wing Test: Grid Sensitivity Analysis
The case studied here is a SD7003 airfoil† experiencing pitchingmotion about the quarter-chord position from the leading edge. Thepitching motion is described as follows:
��t� � �0 cos�2kU0t
c
�� 4� (6)
where �0 is the pitching amplitude, k is the reduced frequency,U0 isthe freestream velocity, and c is the airfoil chord. In our test, �0 is21.5�, k is 3.93, and the Reynolds numberRe based on the chord andfreestream velocity is 10,000. At this Reynolds number, we assumeflow is laminar.
The computational configuration is shown in Fig. 3. It is based onthe experimental setup [4] in which the wing was 2c away from thetop and bottom surfaces at its starting point. The slip boundarycondition is applied on the top and bottom surfaces. The Dirichletboundary condition is applied at the inlet, and a zero gauge pressure
Fig. 5 Blockage effect on the aerodynamic forces of a pitching airfoil (Re� 10; 000, k� 3:93, and �0 � 21:5�).
Fig. 4 Grid sensitivity test for a pitching airfoil (h� 2c, Re� 10; 000, k� 3:93, and �0 � 21:5�).
†Data available at http://www.ae.illinois.edu/m-selig/ads/coord_database.html#S [retrieved July 2010].
LIAN 2733
Dow
nloa
ded
by Y
ongs
heng
Lia
n on
Feb
ruar
y 7,
201
3 | h
ttp://
arc.
aiaa
.org
| D
OI:
10.
2514
/1.4
2215
boundary condition is applied at the outlet. An O-type grid isgenerated around the airfoil using a hyperbolic grid generatorembedded in the Overture package.‡ To better capture flow structurein the wake region, a finewake grid is added. The background grid isa coarse uniform Cartesian grid.
Strictly speaking, a no-slip boundary condition should be appliedon the top and bottom surfaces to model the wall effect. However,such an arrangement requires an extremelyfine grid near the surfacesto capture the boundary-layer development along the channel. Such afine grid inevitably increases the computational cost. On the otherhand, a coarse grid near the top and bottom surfaces will reduce thecomputational cost but will predict a thicker boundary layer that canexaggerate the blockage effect. To balance the solution accuracy andcomputational cost, we use the slip boundary condition. Such anarrangement essentially simulates flow in the core frictionless regionin the channel. Because the boundary-layer thickness will be thin atthis Reynolds number, the setup is a good approximation of theexperiment.
We notice that the distance upstream to the airfoil influences theforces more than the distance downstream to the airfoil. But as theupstream distance is more than 12c and the downstream distance ismore than 6c away from the airfoil, their influence diminishes. Anupstream distance of 12c and a downstream distance of 6c are usedthroughout this paper.
The computed forces are sensitive to the grid density in the wakeregion and near the airfoil surface and the distribution of the airfoilgrid, signaling the importance of viscous effect. The domain size andgrid density of the O grid are carefully adjusted so that the O-griddensity matches the wake grid density in their overlapping region.We find that such an arrangement can capture the vortex evolution(hence force variation) without using excessive grid points in thecircumstantial direction around the airfoil. A hyperbolic stretching isapplied to theO grid to ensure there are at least 10 grid points in theboundary layer. In most cases, our simulations reach periodic afterthe second cycle. The sensitivity analysis results in the third cycle arepresented in Fig. 4. Based on our analysis, themedium density grid isused in our study.
Blockage Effect at Different Reduced Frequencies
The force histories at k of 3.93 and �0 of 21.5� are shown in Fig. 5.
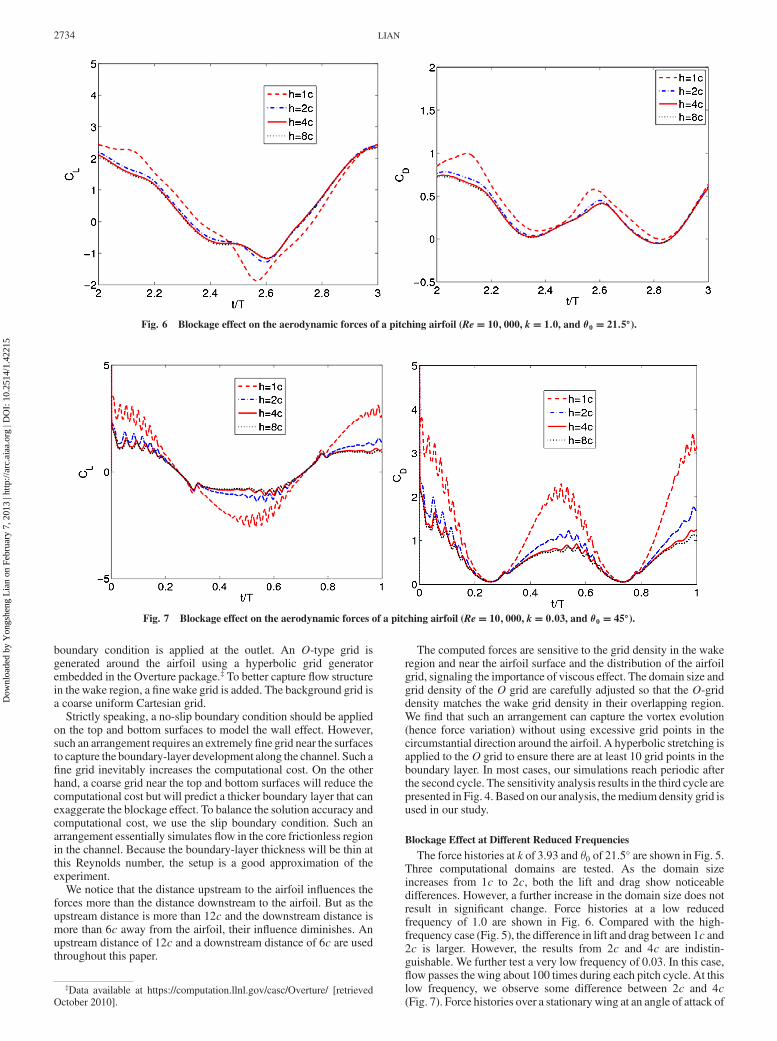
Three computational domains are tested. As the domain sizeincreases from 1c to 2c, both the lift and drag show noticeabledifferences. However, a further increase in the domain size does notresult in significant change. Force histories at a low reducedfrequency of 1.0 are shown in Fig. 6. Compared with the high-frequency case (Fig. 5), the difference in lift and drag between 1c and2c is larger. However, the results from 2c and 4c are indistin-guishable. We further test a very low frequency of 0.03. In this case,flow passes thewing about 100 times during each pitch cycle. At thislow frequency, we observe some difference between 2c and 4c(Fig. 7). Force histories over a stationary wing at an angle of attack of
Fig. 7 Blockage effect on the aerodynamic forces of a pitching airfoil (Re� 10; 000, k� 0:03, and �0 � 45�).
Fig. 6 Blockage effect on the aerodynamic forces of a pitching airfoil (Re� 10; 000, k� 1:0, and �0 � 21:5�).
‡Data available at https://computation.llnl.gov/casc/Overture/ [retrievedOctober 2010].
2734 LIAN
Dow
nloa
ded
by Y
ongs
heng
Lia
n on
Feb
ruar
y 7,
201
3 | h
ttp://
arc.
aiaa
.org
| D
OI:
10.
2514
/1.4
2215
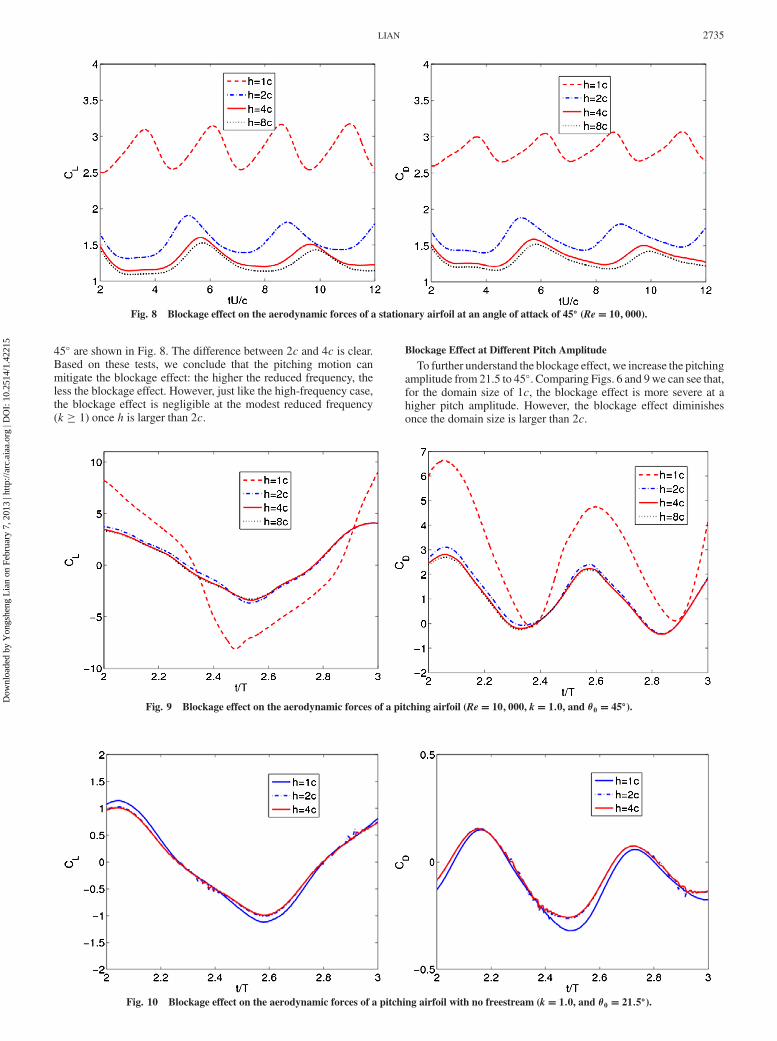
45� are shown in Fig. 8. The difference between 2c and 4c is clear.Based on these tests, we conclude that the pitching motion canmitigate the blockage effect: the higher the reduced frequency, theless the blockage effect. However, just like the high-frequency case,the blockage effect is negligible at the modest reduced frequency(k 1) once h is larger than 2c.
Blockage Effect at Different Pitch Amplitude
To further understand the blockage effect, we increase the pitchingamplitude from 21.5 to 45�. Comparing Figs. 6 and 9we can see that,for the domain size of 1c, the blockage effect is more severe at ahigher pitch amplitude. However, the blockage effect diminishesonce the domain size is larger than 2c.
Fig. 10 Blockage effect on the aerodynamic forces of a pitching airfoil with no freestream (k� 1:0, and �0 � 21:5�).
Fig. 9 Blockage effect on the aerodynamic forces of a pitching airfoil (Re� 10; 000, k� 1:0, and �0 � 45�).
Fig. 8 Blockage effect on the aerodynamic forces of a stationary airfoil at an angle of attack of 45� (Re� 10; 000).
LIAN 2735
Dow
nloa
ded
by Y
ongs
heng
Lia
n on
Feb
ruar
y 7,
201
3 | h
ttp://
arc.
aiaa
.org
| D
OI:
10.
2514
/1.4
2215

Blockage Effect for Hovering Flight
Figure 10 shows the results with no freestream. There is somedifference in lift and drag between the domain sizes of 1c and 2c. Butthe lift and drag histories are almost identical between h� 2c andh� 4c. Comparing force histories without freestream (Fig. 10) andthose with freestream (Fig. 6) reveals that the top and bottom wallshave less influence on the aerodynamics when there is no freestream.
Three-Dimensional Effect
Nowwe study the spanwise flow variation. The SD7003 wing hadan aspect ratio of three and was mounted wall to wall in the watertunnel. The clearance between thewingtip and the sidewalls was lessthan the boundary-layer thickness. In the simulation, the sidewallsand the top and bottomwalls were simulated. However, the clearancebetween thewingtip and the sidewallwas notmodeled. The side viewof the computational setup was the same as that described in Fig. 4a.The wing motion followed Eq. (6), and the Reynolds number was10,000. Figure 11 shows the streamlines near the upper surface at
phases 0 and �=2. Here, phase 0 refers to �� 4� and when thetrailing edge is about to start moving down. The streamlines revealedcomplex flow patterns along the span. Fromwingtip to 25% inbound(Fig. 11a), flow was circulated away from the wall, but the vortexstructure was irregular. From 25 to 40%, there was a vortex tube, andflow was circulated toward the wall. From 40% to middle span, flowmoved toward the middle span again. Analyzing the spanwisevelocity near the upper surface of the wing reveals that, from phase 0to phase�=2, the high-velocity region (v=U0 > 0:4) grew andmovedtoward the middle span, indicating increasing spanwise variationfrom phases of 0 to �=2.
From the boundary-layer theory, we know that, within theboundary layer, the transverse pressure gradient is negligible. Here,we can assume a constant pressure along the span when the wingremains stationary. However, this constant distribution changes if thewing is undergoing flapping motion, especially when the reducedfrequency is high (Fig. 12a). When the wing moves away from itsoriginal position, it leaves a vacancy that must be filled by nearbyfluid. Near the sidewalls, the fluid is nearly stagnant because of
Fig. 11 Streamlines near the upper surface of the pitching wing with side, top, and bottom walls: a) 0 � z=b � 0:25, b) 0:25 � z=b � 0:40, andc) 0:40 � z=b � 0:50 (z is the distance from the wingtip, and b is the wingspan).
Fig. 12 Pressure and velocity distributions along the span close to the upper surface. A strong leading vortex exists on the upper surface. Components u,
v, and w are the velocity components in the streamwise, normal, and spanwise directions, respectively.
2736 LIAN
Dow
nloa
ded
by Y
ongs
heng
Lia
n on
Feb
ruar
y 7,
201
3 | h
ttp://
arc.
aiaa
.org
| D
OI:
10.
2514
/1.4
2215

viscous friction and cannot fill the space as quickly as fluid outsidethe boundary layer. Therefore, fluid from outside the boundary tendsto be squeezed into the boundary in order to fill the vacancy. Thiscauses overshoots in the velocity and pressure profiles near thesidewalls (Fig. 12b). These overshoots propagate downstream and
move toward the middle span (Fig. 13). From this reasoning, we canconclude that the higher the reduced frequency, the more severe thespanwise variation.
The disturbance along the spanwise variation is further amplifiedby the vortex tube when flow travels downstream. From the phase of
Fig. 15 Comparison of force histories between 2-D simulation and 3-D simulation, with sidewalls and freestream velocity.
Fig. 14 Velocity and pressure distributions at different streamwise locations on the lower surface. When there is no strong leading-edge vortex, the
pressure and velocity are nearly constant along the span, except near the leading edge.
Fig. 13 Propagation of velocity and pressure disturbances toward themiddle span on the upper surface.When there is a strong leading-edge vortex, the
pressure and velocity show strong variation along the span.
LIAN 2737
Dow
nloa
ded
by Y
ongs
heng
Lia
n on
Feb
ruar
y 7,
201
3 | h
ttp://
arc.
aiaa
.org
| D
OI:
10.
2514
/1.4
2215

0 to the phase of �=2, there is a strong vortex structure near theleading edge on the upper surface. However, during the same period,because there is not such a strong vortex on the lower surface, thepressure and velocity are almost constant along the span on the lowersurface, except near the leading edge (Fig. 14).
Now, we compare the force and flowfield between the 3-D wingand 2-D airfoil, both with top and bottom walls. It is clear fromFig. 15 that neither the lift nor drag coefficients showed significantdifference between the 2-D and 3-D results. At the phase of 0, thestreamwise velocity profile near the sidewall (z=b� 0:05) wasclearly different from the 2-D solution (Fig. 16). However, the profilewas similar to the 2-D profile from z=b� 0:25 to the middle span.The same conclusion held at phase �=2 (Fig. 17).
Conclusions
The blockage effect and sidewall effect on a pitching wing wasstudied. Tests showed that the blockage effect can significantly affectthewing aerodynamicswhen the domain size is small (h� 1c). For alarge domain (h 2c), the blockage effect is observed at lowreduced frequency cases, but no noticeable blockage effect isobserved at modest reduced frequencies. Tests also showed that thedynamic motion can mitigate the blockage effect: the higher thereduced frequency, the less the blockage effect. For the pitchingwingcase, a larger pitch amplitude leads to more blockage effect. Thesidewalls cause strong spanwise variation in both pressure andvelocity. This spanwise variation is further amplified by the existenceof a leading-edge vortex. When there is no leading-edge vortex, thesidewalls affect regions close to the leading edge, and furtherdownstream, flow is nearly 2-D.
Acknowledgment
This work is partially supported by a U. S. Air Force Office ofScientific Research grant (FA9550-09-1-0622).
References
[1] Shyy, W., Lian, Y., Tang, J., Viieru, D., and Liu, H., Aerodynamics ofLow Reynolds Number Flyers, Cambridge Univ. Press, New York,
2008.[2] Dickinson, M. H. and Götz, K. G., “Unsteady Aerodynamic
Performance of Model Wings at Low Reynolds Numbers,” Journal ofExperimental Biology, Vol. 174, No. 1, 1993, pp. 45–64.
[3] Ellington, C. P., “The Novel Aerodynamics of Insect Flight:Application to Micro-Air Vehicles,” Journal of Experimental Biology,Vol. 202, No. 23, 1999, pp. 3439–3448.
[4] Lian, Y., and Shyy, W., “Aerodynamics of Low Reynolds NumberPlunging Airfoil Under Gusty Environment,” AIAA Paper 2007-0071,Reno, NV, 2007.
[5] Visbal, M. R., “High-Fidelity Simulation of Transitional Flows past aPlungingAirfoil,”AIAA Journal, Vol. 47,No. 11, 2009, pp. 2685–2697.doi:10.2514/1.43038
[6] Ol,M., “Vortical Structures in High Frequency Pitch and Plunge at LowReynolds Number,” AIAA Paper 2007-4233, 2007.
[7] Williamson, C.H.K., “VortexDynamics in theCylinderWake,”AnnualReview of Fluid Mechanics, Vol. 28, No. 1, 1996, pp. 477–526.doi:10.1146/annurev.fl.28.010196.002401
[8] Dickinson, M. H., Lehmann, F. O., and Sane, S. P., “Wing Rotation andthe Aerodynamic Basis of Insect Flight,” Science, Vol. 284, No. 5422,1999, pp. 1954–60.doi:10.1126/science.284.5422.1954
[9] Koochesfahani, M. M., “Vortical Patterns in theWake of an OscillatingAirfoil,” AIAA Journal, Vol. 27, No. 9, 1989, pp. 1200–1205.doi:10.2514/3.10246
[10] Ramamurti, R., and Sandberg, W. C., “Simulation of Flow AboutFlapping Airfoils Using a Finite Element Incompressible Flow Solver,”AIAA Journal, Vol. 39, No. 2, 2001, pp. 253–260.doi:10.2514/2.1320
[11] Bohl, D. G., and Koochesfahani, M. M., “MTV Measurements ofthe Vortical Field in the Wake of an Airfoil Pitching at HighReduced Frequency,” Journal of Fluid Mechanics, Vol. 620, 2009,pp. 63–88.doi:10.1017/S0022112008004734
[12] Lian, Y., and Ol, M., “Experiments and Computation on a Low AspectRatio Pitching Flat Plate,” AIAA Paper 2010-0385, 2010.
[13] Henshaw, D. W., “A Fourth-Order Accurate Method for theIncompressible Navier–Stokes Equations on Overlapping Grids,”Journal of Computational Physics, Vol. 113, No. 1, 1994, pp. 13–25.doi:10.1006/jcph.1994.1114
[14] Henshaw, W. D., and Petersson, N. A., “A Split-Step Scheme for theIncompressible Navier–Stokes Equations,” Numerical Simulation of
Incompressible Flows, World Scientific, Hackensack, NJ, 2003,pp. 108–125.
[15] Henshaw, D. W., and Schwendeman, D. W., “Moving OverlappingGrids with Adaptive Mesh Refinement for High-Speed Reactive andNon-Reactive Flow,” Journal of Computational Physics, Vol. 216,No. 2, 2006, pp. 744–779.doi:10.1016/j.jcp.2006.01.005
[16] Tatsuno,M., andBearman, P.W., “AVisual Study of the Flow around anOscillating Circular at Low Keulegan–Carpenter Numbers and LowStokes Numbers,” Journal of Fluid Mechanics, Vol. 211, 1990,pp. 157–182.doi:10.1017/S0022112090001537
[17] Dutsch, H., Durst, F., Becker, S., and Lienhart, H., “Low-Reynolds-Number Flow Around an Oscillating Circular Cylinder at LowKeulegan–Carpenter Numbers,” Journal of Fluid Mechanics, Vol. 360,1998, pp. 249–271.doi:10.1017/S002211209800860X
[18] Morison, J. R., O’Brien, M. P., Johnson, J. M., and Schaaf, S. A., “TheForce Exerted by Surface Waves on Piles,” Petroleum Transactions of
AIME, Vol. 189, 1950, pp. 149–154.[19] Sarpkara, T., “Vortex Shedding and Resistance in Harmonic Flow
About Smooth and Rough Cylinders at High ReynoldsNumber,”NavalPostgraduate School, Rept. NPS-59SL76021, Monterey, CA, 1976.
[20] Uzunoglu,B., Tan,M., andPrice,W.G., “Low-Reynolds-Number FlowAround an Oscillating Circular Cylinder Using a Cell ViscousBoundary Element Method,” International Journal for Numerical
Methods in Engineering, Vol. 50, No. 10, 2001, pp. 2317–2338.doi:10.1002/nme.122
P. BeranAssociate Editor
Fig. 16 Comparison of streamwise velocity contours between 2-D and
3-D at phase 0.
Fig. 17 Comparison of streamwise velocity contours between 2-D and3-D at phase �=2.
2738 LIAN
Dow
nloa
ded
by Y
ongs
heng
Lia
n on
Feb
ruar
y 7,
201
3 | h
ttp://
arc.
aiaa
.org
| D
OI:
10.
2514
/1.4
2215