bloomberg commodity index (bcom) tables & · pdf filethe 2015 meltdown sent almost every...
TRANSCRIPT

December 2015Market Commentary 02Commodity Performance BCOM 08 Roll Select 09 Historical 10Contribution to Return & Weights 11Commodity Volatility Realized 12 Implied 13 Historical Realized 14Commodity Correlation Composites 15 Singles 16 US CPI Indices 17 Country CPI 18 Country GDP 19Commitment of Traders Report Monthly Notional Change & Correlation 20 Historical Net Positions 21Commodity Inventories & Sales Monthly Change & Correlation 23 Historical Levels 24Commodity ETP Flows 26Term Structures 27Research Dashboards (BI) 29Bloomberg Cheat Sheet 30
Contact us:<Help> <Help> on the Bloomberg Professional [email protected]
TABLES & CHARTS(BCOM)BLOOMBERG COMMODITY INDEX
Commodities Drop 3% in December, Down 25% for 2015
The 2015 meltdown sent almost every commodity lower as the world got stuck with raw-material surpluses after years of supply expansion met a slowing economy in China. The Bloomberg Commodity Index (BCOM), a measure of investor returns in raw materials, tumbled 25% in 2015, a fifth straight annual loss and the longest slide since the data began in 1991. Cotton was the only gainer out of 22 individual commodity indices for the year. Crude oil was the worst performer, tumbling 45% on a supply glut.
The Federal Reserve isn’t doing any favors for commodity markets already enduring the longest slump in decades. By raising U.S. interest rates for the first time since 2006, the central bank has bolstered the value of the dollar, the currency used around the world to buy and sell most raw materials. That may mean sustained strength for the dollar and limited demand for raw-material imports from countries with weaker currencies.
Investors continue to pull money from ETFs backed by agriculture, livestock and industrial metals. A record $857 million was pulled last year from U.S. exchange-traded funds backed by broad baskets of everything from grains to metals, according to data compiled by Bloomberg through Dec. 23. Outflows for precious metals accelerated in Q4, with the biggest net-withdrawal in almost a year as the Fed raised interest rates. Investors are also positioning for a bottom, though, as they poured $8.9 billion last year into energy funds, the biggest annual inflow since data began in 2006. The optimism came even as prices slumped for natural gas, Brent crude, WTI and heating oil, making them four of the five worst performers in BCOM in 2015.
The commodity collapse will lead to more companies defaulting on their debt, according to Moody’s Investors Service Inc. The trailing 12-month default rate for energy and metals companies surged to 7.9% in October, more than double the rate a year before. The plunge in raw-material prices means a third of companies in the two industries are on review for downgrade or have a negative outlook. Moody’s expects the downturn to last longer and be more severe than average. Producers of oil, natural gas and metals accounted for 48% of defaults and 36% of downgrades globally in the 10 months through October. The two sectors are also heavily in debt after selling almost $2 trillion in bonds worldwide since 2010. With producers struggling to halt losses, they are selling assets, cutting dividends and slashing output, which may be enough to put a floor on prices.
A Bloomberg survey of traders, analysts, and economists provides a glimmer of hope for 2016 commodity prices after the worst commodity collapse in a generation. Respondents are most bullish on wheat as the impact of a strong El Nino has started to boost food prices. Gold and natural gas are also expected to advance. Respondents were split among bulls and bears for WTI crude oil, mired in the longest slump since 1998, with the average estimated high for 2016 at $56 a barrel and at $33 for the average low. Copper - which hit a six-year low in November - had the most negative outlook in the Bloomberg survey.
Meanwhile, the worst flooding across the U.S. Midwest in four years has disrupted everything from oil to agriculture, forcing pipelines, terminals and grain elevators to close and killing off thousands of pigs. Fifty miles of the Illinois River have been closed, according to the U.S. Coast Guard, as well as 81 miles of the Mississippi River.
ENERGY (29.8% weight in BCOM)
The Bloomberg Petroleum Index (BCOMPE) sank 13% in December and lost 39% for the year. Oil capped its biggest two-year loss with prices dropping about 30% in 2015 and averaging the lowest level since 2004, amid speculation suppliers from the Middle East to the U.S. will exacerbate an oil glut as they fight for market share. The global oil surplus will persist at least until late 2016, according to the International Energy Agency.
U.S. crude oil production data highlights resilient volume despite the precipitous slide in oil prices, the drop in rig counts and the significant haircut to operator capital expenditure budgets in 2015. U.S. supplies rose 102 million barrels over the year, the biggest jump since at least 1920 in government data. With U.S. production holding steady, stockpiles are 37% above the five-year average and likely to exceed seasonal highs in 2016. Inventories at Cushing - a hub that has a working capacity of 73 million barrels - climbed to a record 63 million barrels.
OPEC increased its output in the face of already rising global stockpiles as Saudi Arabia, the world’s largest crude exporter, has led the group in fighting for market share against higher-cost producers such as shale drillers in the U.S. OPEC set aside its output target of 30 million barrels a day at its meeting in Vienna last month.
2

The failure of OPEC to reach any meaningful agreement at its meeting in Vienna on Dec. 4 confirmed that the historic storm besetting the oil market has markedly reduced this once-powerful group's effectiveness and influence. Far from adding an element of stability, an internally divided OPEC will contribute to further volatility in oil markets, with prices remaining low for longer than many anticipated. The oil market is being battered as three distinct forces come together. The supply side has been destabilized by the rapid encroachment of shale energy technology. The demand side is undermined by declining global growth in general, and the sharper relative fall in emerging economies in particular. Third, the role of “swing producer” on the downside once played by Saudi Arabia and some of its OPEC partners - by reducing output when prices are low - has de facto been taken over by the U.S. This has shifted the mechanics of the market from discrete decisions on tightening supply to waiting for natural market supply and demand forces to set the pace. The resulting collapse in oil prices sharply reduces export earnings of all producers. But their resilience, including the ability to manage their economies with lower income, varies significantly. Some, such as Saudi Arabia and the United Arab Emirates, have sufficient financial reserves, other accumulated wealth, debt capacity and policy flexibility to manage the longer-term transition to an oil regime in which many of the non-traditional suppliers will be knocked out by lower prices. Others, including Venezuela, are being destabilized in ways that extend well beyond economic and financial factors and produce a growing possibility of political and social turmoil. In the absence of any new agreement, OPEC has officially kept in place existing production quotas until the ministers meet again in June. In practice, however, individual member states will not feel constrained by any OPEC agreements on output levels and are likely to produce as much as they can, but each for its own reasons. For better-off OPEC members, producing more today is intended to secure a better competitive position in the future. For the struggling countries, the goal is to generate as much income as possible, and as soon as possible, to avoid major internal dislocations. Barring a major geopolitically driven shock, this set of dynamics may mean that oil prices will stay low and volatile for a while. Over time, this price configuration will drive out the higher-cost energy producers and encourage higher demand, which would restore OPEC's influence. In the short-term, however, the group will have little influence in stabilizing this unhinged oil market. OPEC said demand for its crude will slide until 2020, though less steeply than previously expected, as rival supplies continue to grow. The organization will need to pump 30.7 million barrels a day by the end of the decade, OPEC said in its annual World Oil Outlook. That’s 1.7 million barrels more than projected a year ago, and 1 million less than the group pumped in November. The forecast underlines the struggle faced by OPEC as it seeks to defend market share against a surge in output from rivals such as the U.S. and Russia. While the prices of benchmarks WTI and Brent hover in the $30s, they represent a category of crude - light and low in sulfur - that is more highly valued because it’s easier to refine. Some producers of thicker, blacker and more sulfurous varieties have suffered heavier losses and are already living in the $20s. A mix of Mexican crudes was valued at less than $28 in December, plunging 73% in 18 months to an 11-year low. Iraq is offering its heaviest variety of oil to buyers in Asia for about $25. Western Canada Select, which is heavy and sulfurous, has slumped 75% to less than $22, the least in almost eight years. Other varieties including Ecuador’s Oriente, Saudi Arabia’s Arab Heavy and Iraq’s Basrah Heavy were also selling below $30. Speculators increased bets on falling oil prices to an all-time high as short positions in WTI rose by 9,935 contracts to 181,849 futures and options, the most in records dating back to 2006, CFTC data show. The world’s largest independent oil traders said supplies will overwhelm demand into 2016 and prices may not rally until 2017, painting a gloomy outlook for energy-rich nations. Their market view indicates that the 12-member group and the oil industry as a whole will have to endure a much longer slump than the downturn that followed the 2008 financial crisis, when prices recovered within a year. As a campaign by oil explorers including Continental Resources Inc., Chevron Corp. and Exxon Mobil Corp. to lift the 1970s-era export prohibition culminated in a Dec. 18 congressional decision to end the ban, the first U.S. shipment of crude oil to an overseas buyer departed a Texas port on Dec. 31, just weeks after a 40-year ban on most such exports was lifted. The ship is carrying a cargo
3
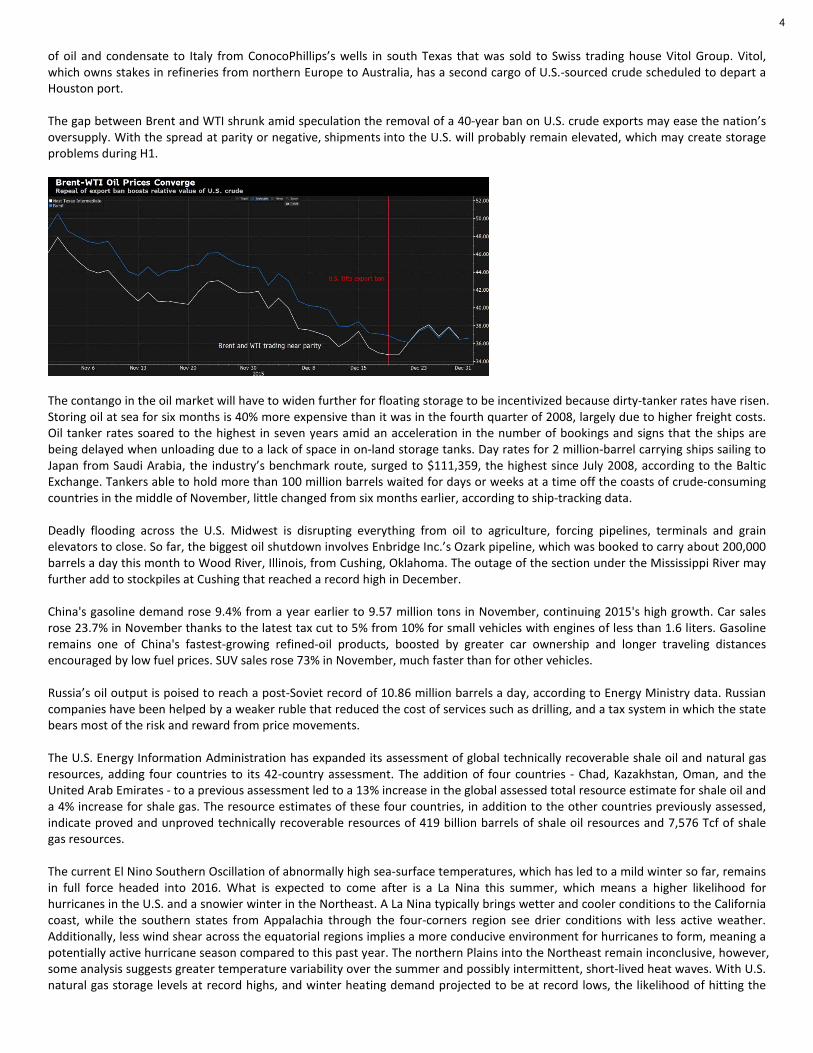
of oil and condensate to Italy from ConocoPhillips’s wells in south Texas that was sold to Swiss trading house Vitol Group. Vitol, which owns stakes in refineries from northern Europe to Australia, has a second cargo of U.S.-sourced crude scheduled to depart a Houston port. The gap between Brent and WTI shrunk amid speculation the removal of a 40-year ban on U.S. crude exports may ease the nation’s oversupply. With the spread at parity or negative, shipments into the U.S. will probably remain elevated, which may create storage problems during H1.
The contango in the oil market will have to widen further for floating storage to be incentivized because dirty-tanker rates have risen. Storing oil at sea for six months is 40% more expensive than it was in the fourth quarter of 2008, largely due to higher freight costs. Oil tanker rates soared to the highest in seven years amid an acceleration in the number of bookings and signs that the ships are being delayed when unloading due to a lack of space in on-land storage tanks. Day rates for 2 million-barrel carrying ships sailing to Japan from Saudi Arabia, the industry’s benchmark route, surged to $111,359, the highest since July 2008, according to the Baltic Exchange. Tankers able to hold more than 100 million barrels waited for days or weeks at a time off the coasts of crude-consuming countries in the middle of November, little changed from six months earlier, according to ship-tracking data. Deadly flooding across the U.S. Midwest is disrupting everything from oil to agriculture, forcing pipelines, terminals and grain elevators to close. So far, the biggest oil shutdown involves Enbridge Inc.’s Ozark pipeline, which was booked to carry about 200,000 barrels a day this month to Wood River, Illinois, from Cushing, Oklahoma. The outage of the section under the Mississippi River may further add to stockpiles at Cushing that reached a record high in December. China's gasoline demand rose 9.4% from a year earlier to 9.57 million tons in November, continuing 2015's high growth. Car sales rose 23.7% in November thanks to the latest tax cut to 5% from 10% for small vehicles with engines of less than 1.6 liters. Gasoline remains one of China's fastest-growing refined-oil products, boosted by greater car ownership and longer traveling distances encouraged by low fuel prices. SUV sales rose 73% in November, much faster than for other vehicles. Russia’s oil output is poised to reach a post-Soviet record of 10.86 million barrels a day, according to Energy Ministry data. Russian companies have been helped by a weaker ruble that reduced the cost of services such as drilling, and a tax system in which the state bears most of the risk and reward from price movements. The U.S. Energy Information Administration has expanded its assessment of global technically recoverable shale oil and natural gas resources, adding four countries to its 42-country assessment. The addition of four countries - Chad, Kazakhstan, Oman, and the United Arab Emirates - to a previous assessment led to a 13% increase in the global assessed total resource estimate for shale oil and a 4% increase for shale gas. The resource estimates of these four countries, in addition to the other countries previously assessed, indicate proved and unproved technically recoverable resources of 419 billion barrels of shale oil resources and 7,576 Tcf of shale gas resources. The current El Nino Southern Oscillation of abnormally high sea-surface temperatures, which has led to a mild winter so far, remains in full force headed into 2016. What is expected to come after is a La Nina this summer, which means a higher likelihood for hurricanes in the U.S. and a snowier winter in the Northeast. A La Nina typically brings wetter and cooler conditions to the California coast, while the southern states from Appalachia through the four-corners region see drier conditions with less active weather. Additionally, less wind shear across the equatorial regions implies a more conducive environment for hurricanes to form, meaning a potentially active hurricane season compared to this past year. The northern Plains into the Northeast remain inconclusive, however, some analysis suggests greater temperature variability over the summer and possibly intermittent, short-lived heat waves. With U.S. natural gas storage levels at record highs, and winter heating demand projected to be at record lows, the likelihood of hitting the
4
storage cap remains high. While natural gas may reach a price floor come summer, any major heat waves in the Northeast or Mid-Atlantic could lead to greater gas burn for power generators causing a spike in demand and increasing PJM's heat rate volatility. On the contrary, a major Mid-Atlantic hurricane would likely lead to a demand drop for both gas and power. A more active hurricane season overall may also put U.S. LNG export terminals at risk of storm damage. A La Nina, though not typically as strong in magnitude as an El Nino, typically peaks in the wintertime in the northern hemisphere, bringing with it cooler than average temperatures across the Plains and Midwest, and snowier winters in the Northeast. Moderate La Ninas (an anomaly of around -1 Celsius) were seen in 1995, 2005, and 2013 while strong La Ninas (an anomaly around -2 Celsius) were seen in 1998, 2000, 2007, and 2010 (NOAANT34 ANOM Index GP <GO>). There is always the possibility that the summer of 2016 will not experience a La Nina at all, and instead the equatorial Pacific will be in a neutral phase. Seasonal outlooks will be more certain in a few months. GRAINS (23.7% weight in BCOM) Corn, wheat and soybeans capped a third annual loss on abundant supplies. The Bloomberg Grains Index (BCOMGR) was down 7.7% in Q4 and down 19% for the year. Argentina, the world’s third largest grower of soybeans, lifted four years of currency controls after grains exporters agreed to deliver $6 billion in hoarded crops to the country over the next few weeks. The country let the peso float, prompting a devaluation of the tightly controlled official exchange rate. Argentina’s new President Mauricio Macri also announced the elimination of export taxes on crops, including corn and wheat. Argentine farmers have been storing crops, partly in protest of the taxes and the difficult process of obtaining export permits. Farmers have $11.4 billion of soy, corn and wheat for sale, according to a former head of Argentina’s tax agency. Brazil’s soybean production will fall short of a government forecast because of damage caused by drought in central and northern areas, according to the country’s largest publicly traded farming company. Losses in Mato Grosso, the top soybean-producing state, will be significant this season after the drought hurt the potential of the crop during its pod-filling stages. The crop’s most critical development stage over the next few weeks will be crucial in determining whether some damage can be reversed with more rain. El Nino brought excess precipitation to southern states including Parana, Brazil’s central and northern regions, which account for more than half the nation’s output, have struggled with below-average and irregular rainfall. Some farmers in the dry areas are abandoning soybeans and will be planting corn instead. Brazil is still likely to see a record soybean crop, however. President Barack Obama’s administration ordered refiners to blend a record 14.5 billion gallons of ethanol into gasoline in 2016. For the first time ever, that will mean ethanol will make up more than 10% of the total U.S. fuel mix. INDUSTRIAL METALS (15.5% weight in BCOM)
Industrial metals fell in 2015, capping the worst year since 2008, as production cuts and signs of improving demand in China came too late to counter falling consumption and excess supplies. Copper, aluminum, zinc, and nickel capped annual losses, with nickel dropping 43%, the worst performer in the Bloomberg Industrial Metals Index (BCOMIN).
Copper declined for a third straight year, the longest slump since 1998, amid growing supply gluts after demand faltered in China. While producers have pledged production cuts, investors spooked by wavering global economic growth and the possibility of persistent metals surpluses have been slow to return. Global refined copper demand may rise to an estimated 22.3 million metric tons in 2015, from 15.1 million in 2000. China's plans to accelerate infrastructure investment have yet to spur metals demand, according to Bloomberg Intelligence. China is the largest user of the metal, with 48% of the market, up from 6.5% in 2000. China's refined-copper imports also remain high on arbitrage profit as China imported 358,727 metric tons of refined copper in November, the third consecutive month of inbound shipments over 340,000 tons. Nickel plunged 43% in 2015, making it the worst-performing metal on LME and forcing companies in China to plan output reductions. Top smelters including the largest supplier Jinchuan Group Co. agreed to cut production by at least 20% in 2016. Cuts outside China were minimal and disappointing to-date and weak supply and demand fundamentals are expected to persist. However, with a high proportion of the cost curve losing cash, it should only be a matter of time until production cuts become more prominent in nickel. It is estimated that about 70% of nickel mines and 60% of aluminum smelters are losing money at current prices. Expiring hedging contracts, diminished liquidity and restricted access to capital markets are pushing companies closer to default.
5
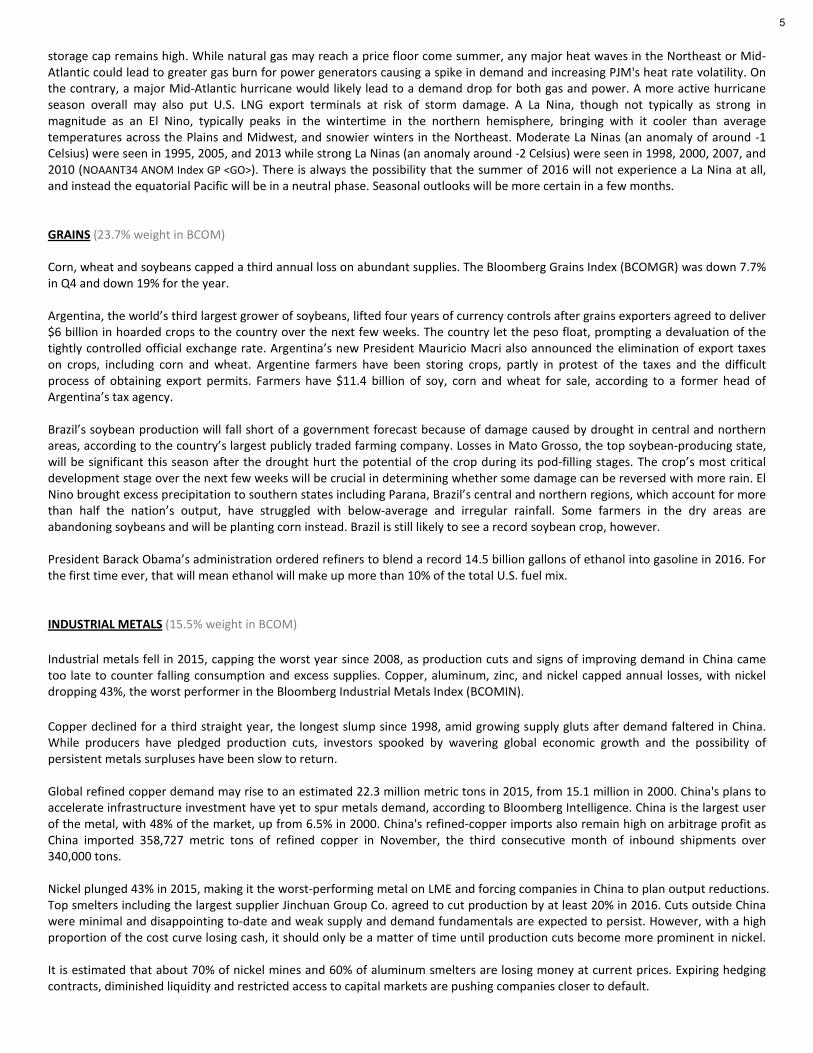
PRECIOUS METALS (17% weight in BCOM) Gold’s image as a haven asset took a battering with the metal capping its longest slump in more than 30 years as investors sold from bullion-backed funds. Holdings in gold exchange-traded products have declined to the lowest in more than six years. Gold has had a bumpy 2015, swinging between year-to-date gains and losses more than ten times as investors tried to gauge the timing of the Fed’s rate rise. Bullion futures fell for a sixth-straight quarter, the longest slump since 1984, and lost 10% last year. Prices have plunged 45% since reaching a record high in 2011. The pace of ETF withdrawals has slowed, possibly indicating that sales may be winding down. Some traders have speculated that prices could be near a bottom because the metal is trading near its cost of production.
Gold is priced globally in U.S. dollars and the greenback's strength has caused a decline in the metal's price. The Bloomberg Dollar Index (BDXY <GO>) soared to a record high on Dec. 17.
SOFTS (8.9% weight in BCOM) The Bloomberg Softs Index (BCOMSO), comprised of sugar, cotton, and coffee, rebounded in Q4 with a 11% return. Sugar prices jumped 52% since reaching a seven-year low in August. The market has finally swung to a supply deficit after years of surpluses and, according to the average of 18 traders and analysts surveyed by Bloomberg News, the commodity will keep rising through Q1. While strong Asian demand is helping, the revival in sugar’s fortunes can be attributed largely to El Nino. The weather pattern has cut the sucrose content in the sugar cane grown in Brazil, the biggest supplier, as well as yields in India and Thailand. Global sugar output will fall 4.3% to 178.9 million metric tons in the 2015-16 season, which runs from October to September in most countries, trailing demand by as much as 8.2 million tons, according to Czarnikow Group Ltd. A shortfall is expected for the season after that, according to the International Sugar Organization. Sugar production is also expected to shrink in China, to the lowest in a decade.
The European Union will reap the smallest crop since 1971, according to forecaster F.O. Licht GmbH. Money managers increased white sugar net-long position by 5.4% to a record 18,918 contracts. Of course, sugar’s rally could still be derailed, not least by the possibility of increased shipments from India where the government is pushing mills to make mandatory exports of as much as 4 million tons. Further pressure on the real would help Brazilian commodity exporters in foreign markets. However, most of the cane that has been harvested in Brazil is being used to make ethanol - the quickest way for processors to monetize higher commodity prices after several years of struggle - after domestic demand for the biofuel jumped.
As favorable weather increases coffee crop yields, declining currencies in producing countries are encouraging farmers to export supplies that fetch dollars in return. It’s all adding up to overwhelming supplies, and the U.S. Department of Agriculture is predicting that output will top use for a sixth straight year. Brazil’s harvest is poised to keep getting bigger next season. Arabica prices dropped 28% in 2015. The net-short position in futures and options increased to 16,734 contracts in the week ended Dec. 22, according to CFTC data. The figures compared with 11,409 the prior week. There’s enough cotton sitting in global warehouses to make more than 127 billion T-shirts, or 17 for each person on the planet, which may create downward pressure on prices. World inventories at the end of this season will be the second-largest ever, just slightly less than the prior year’s record, according to a U.S Department of Agriculture. That’s a signal that supplies will remain ample even after the agency cut its outlook for production. While threats to the American crop - hampered by heavy rains - helped make the fiber 2015’s best-performing commodity, the gains may not last much longer as demand slows. China, the world’s largest user, is
6

curbing cotton imports by more than 30%, helping to shrink global trade for a fourth straight year, the International Cotton Advisory Committee estimates.
Bursting Warehouses: Global cotton stockpiles will be second-highest ever (CTNNWW00 1176 Index GP <GO>)
Crop Under Threat: USDA cotton crop condition declined through the season (CONDCOTT Index GP <GO>)
LIVESTOCK (5.1% weight in BCOM) After falling to a two-year low, U.S. cattle prices jumped almost 10% in the last week of December - the highest weekly gain since data started in 1964 - after the U.S. government reported a shrinking domestic herd and a winter storm in the Great Plains threatened to disrupt livestock operations. Despite this late move, cattle futures in 2015 dropped 18%, halting a record six-year rally. A gauge of volatility in livestock futures surged to the highest in 11 years, driving some U.S. cattle ranchers and hog farmers out of the market. The 60-day volatility on the Bloomberg Livestock Index (BCOMLI) climbed to the highest since March 2004 as hog futures on CME tumbled 26% last year, the biggest annual drop since 1998.
BLOOMBERG and BLOOMBERG INDICES are trademarks or service marks of Bloomberg Finance L.P. Bloomberg Finance L.P. and its affiliates ("collectively, "Bloomberg") or Bloomberg's licensors own all proprietary right in the BLOOMBERG INDICES. Bloomberg does not guarantee the timeliness, accuracy or completeness of any data or information relating to BLOOMBERG INDICES. Bloomberg makes no warranty, express or implied, as to the BLOOMBERG INDICES or any data or values relating thereto or results to be obtained therefrom, and expressly disclaims all warranties of merchantability and fitness for a particular purpose with respect thereto. It is not possible to invest directly in an index. Back-tested performance is not actual performance. Past performance is not an indication of future results. To the maximum extent allowed by law, Bloomberg, its licensors, and its and their respective employees, contractors, agents, suppliers and vendors shall have no liability or responsibility whatsoever for any injury or damages - whether direct, indirect, consequential, incidental, punitive or otherwise - arising in connection with BLOOMBERG INDICES or any data or values relating thereto - whether arising from their negligence or otherwise. This document constitutes the provision of factual information, rather than financial product advice. Nothing in the BLOOMBERG INDICES shall constitute or be construed as an offering of financial instruments or as investment advice or investment recommendations (i.e., recommendations as to whether or not to “buy”, “sell”, “hold”, or to enter or not to enter into any other transaction involving any specific interest or interests) by Bloomberg or its affiliates or a recommendation as to an investment or other strategy by Bloomberg or its affiliates. Data and other information available via the BLOOMBERG INDICES should not be considered as information sufficient upon which to base an investment decision. All information provided by the BLOOMBERG INDICES is impersonal and not tailored to the needs of any person, entity or group of persons. Bloomberg and its affiliates do not express an opinion on the future or expected value of any security or other interest and do not explicitly or implicitly recommend or suggest an investment strategy of any kind. Customers should consider obtaining independent advice before making any financial decisions. © 2016 Bloomberg Finance L.P. All rights reserved. This document and its contents may not be forwarded or redistributed without the prior consent of Bloomberg.
7

Composite Indices
Dec Nov Q4 Q3 1-Year 3-Year 5-Year 10-Year 20-YearBloomberg Commodity ER BCOM -3.11% -7.26% -10.55% -14.48% -24.70% -43.51% -51.62% -54.10% -24.70%Bloomberg Commodity TR BCOMTR -3.09% -7.25% -10.52% -14.47% -24.66% -43.43% -51.48% -48.54% 21.87%
Bloomberg Commodity Spot BCOMSP -1.81% -6.63% -7.16% -13.73% -18.40% -38.16% -41.06% 7.60% 136.28%Bloomberg Roll Select BCOMRST -3.01% -6.43% -9.39% -13.61% -23.45% -40.96% -46.36% -20.40% 176.13%
1 Month Forward BCOMF1T -2.73% -6.91% -9.53% -14.37% -23.57% -40.68% -47.52% -34.63% 126.17% 2 Month Forward BCOMF2T -2.90% -6.84% -9.47% -14.23% -23.89% -41.53% -48.56% -31.05% 156.51% 3 Month Forward BCOMF3T -2.61% -6.37% -8.70% -14.14% -23.12% -40.09% -46.43% -22.40% 170.87% 4 Month Forward BCOMF4T -2.50% -6.16% -8.06% -13.73% -22.09% -38.96% -44.13% -13.85% 5 Month Forward BCOMF5T -2.50% -5.95% -7.85% -13.54% -21.70% -39.58% -43.95% -10.27% 6 Month Forward BCOMF6T -2.47% -5.86% -7.70% -13.28% -21.52% -39.39% -43.53% -5.73%
Energy BCOMENTR -10.52% -10.64% -22.70% -22.34% -38.87% -61.00% -70.29% -90.63% -36.12%Petroleum BCOMPETR -14.40% -10.80% -23.12% -24.47% -39.42% -63.91% -63.10% -73.12% 88.99%Agriculture BCOMAGTR -1.00% -2.71% -2.17% -12.63% -15.60% -34.33% -41.52% -0.86% -28.45%
Grains BCOMGRTR -2.57% -4.55% -7.71% -13.72% -19.42% -39.31% -38.57% 1.85% -43.61%Industrial Metals BCOMINTR 3.38% -8.68% -8.25% -11.11% -26.88% -41.18% -55.13% -24.56% 50.17%Precious Metals BCOMPRTR -0.85% -7.53% -5.02% -5.55% -11.45% -42.84% -36.47% 79.86% 174.55%
Softs BCOMSOTR 2.68% 0.42% 11.18% -7.53% -9.85% -32.62% -55.01% -36.89% -31.37%Livestock BCOMLITR 4.04% -7.91% -3.45% -5.38% -18.83% -12.66% -17.69% -54.14% -52.47%Ex-Energy BCOMXETR 0.33% -5.62% -4.35% -10.08% -17.74% -35.95% -41.99% 1.98% 20.16%
Ex-Petroleum BCOMXPET 0.39% -6.13% -6.52% -10.70% -20.68% -37.82% -49.54% -43.78%Ex-Agriculture BCOMXAGT -4.09% -9.27% -14.12% -15.25% -28.54% -47.57% -55.87% -63.12%
Ex-Grains BCOMXGRT -3.21% -7.83% -11.12% -14.63% -25.72% -44.47% -54.36% -57.90%Ex-Industrial Metals BCOMXIMT -4.19% -7.00% -10.92% -15.06% -24.15% -44.02% -50.84% -56.18%Ex-Precious Metals BCOMXPMT -3.54% -7.20% -11.60% -16.06% -27.12% -44.19% -54.27% -56.97%
Ex-Softs BCOMXSOT -3.62% -7.91% -12.22% -14.96% -26.00% -44.43% -51.43% -50.23%Ex-Livestock BCOMXLIT -3.44% -7.22% -10.87% -14.90% -24.91% -44.89% -53.02% -48.09%
Ex-Agriculture & Livestock BCOMXALT -4.70% -9.37% -14.90% -15.93% -29.18% -49.91% -58.29% -64.17%S&P 500 Total Return SPXT -1.58% 0.30% 7.04% -6.44% 1.38% 52.59% 80.75% 102.42% 382.50%
Bloomberg US Treasury Bond BUSY -0.16% -0.44% -0.96% 2.07% 0.85% 3.50% 15.92%Bloomberg USD IG Corporate Bond BUSC -0.84% -0.28% -0.56% 0.64% -0.80% 5.23% 24.70%Bloomberg USD HY Corporate Bond BUHY -2.76% -1.85% -1.51% -5.14% -3.49% 4.44% 26.71%
Bloomberg Dollar Spot BBDXY -0.42% 2.32% 1.55% 2.80% 8.98% 24.95% 26.36% 13.37%
Single Commodity Indices
Dec Nov Q4 Q3 1-Year 3-Year 5-Year 10-Year 20-YearNatural Gas BCOMNGTR 0.45% -10.24% -22.00% -15.02% -39.95% -56.30% -83.96% -99.32% -98.77%WTI Crude BCOMCLTR -14.94% -12.25% -23.40% -27.38% -44.35% -65.33% -70.53% -80.87% 44.09%
Brent Crude BCOMCOT -17.68% -11.73% -26.46% -26.29% -45.57% -69.43% -61.55% -61.01% 299.77%ULS Diesel BCOMHOTR -18.71% -12.24% -31.09% -20.49% -42.84% -64.88% -58.98% -66.41% 81.08%
Unleaded Gasoline BCOMRBTR -3.98% -4.68% -8.67% -19.76% -12.65% -49.94% -27.96% -36.24% 358.21%Corn BCOMCNTR -3.61% -4.81% -9.55% -10.74% -19.22% -51.17% -41.23% -19.09% -80.19%
Soybeans BCOMSYTR -2.23% -0.53% -3.92% -13.99% -14.63% -10.80% -7.51% 101.56% 225.80%Wheat BCOMWHTR -1.13% -9.47% -8.88% -17.53% -22.21% -48.71% -62.83% -58.94% -91.82%
Soybean Oil BCOMBOTR 3.79% 3.17% 10.62% -19.74% -7.70% -43.14% -56.49% -14.78% -40.74%Soybean Meal BCOMSMT -7.52% -5.86% -14.35% -10.53% -18.00% 9.99% 34.33% 260.23% 920.72%HRW Wheat BCOMKWT -0.88% -7.23% -9.51% -21.17% -32.67% -52.63% -61.42% -43.49% -70.13%
Copper BCOMHGTR 4.25% -11.99% -9.17% -10.73% -25.13% -43.00% -54.75% 4.93% 175.88%Alumnium BCOMALTR 3.85% -2.02% -5.45% -8.29% -22.94% -40.81% -55.48% -60.06% -45.36%
Zinc BCOMZSTR 2.66% -8.83% -5.77% -16.01% -27.98% -30.66% -45.40% -31.48% 10.41%Nickel BCOMNITR -1.04% -11.69% -15.53% -13.46% -42.64% -50.82% -66.74% -27.24% 92.92%Gold BCOMGCTR -0.46% -6.73% -4.97% -5.00% -10.88% -37.53% -27.34% 88.74% 163.12%Silver BCOMSITR -1.99% -9.78% -5.18% -7.12% -12.72% -55.99% -57.64% 39.91% 145.09%Sugar BCOMSBTR 2.10% 2.83% 18.36% -4.38% -4.70% -47.30% -59.59% -50.31% 2.11%Coffee BCOMKCTR 5.92% -3.90% 1.46% -10.50% -31.54% -34.46% -66.00% -51.99% -58.74%Cotton BCOMCTTR 1.04% -1.32% 4.46% -10.99% 2.97% -11.49% -39.51% -22.11% -79.17%
Live Cattle BCOMLCTR 3.39% -8.05% 2.90% -14.57% -14.30% -0.65% -5.48% -30.82% -2.07%Lean Hogs BCOMLHTR 5.30% -7.67% -13.73% 13.44% -26.09% -30.75% -35.84% -77.62% -87.14%
Index Name Ticker
Index Name Ticker
PERFORMANCE: Bloomberg Commodity Indices
2015
2015
8
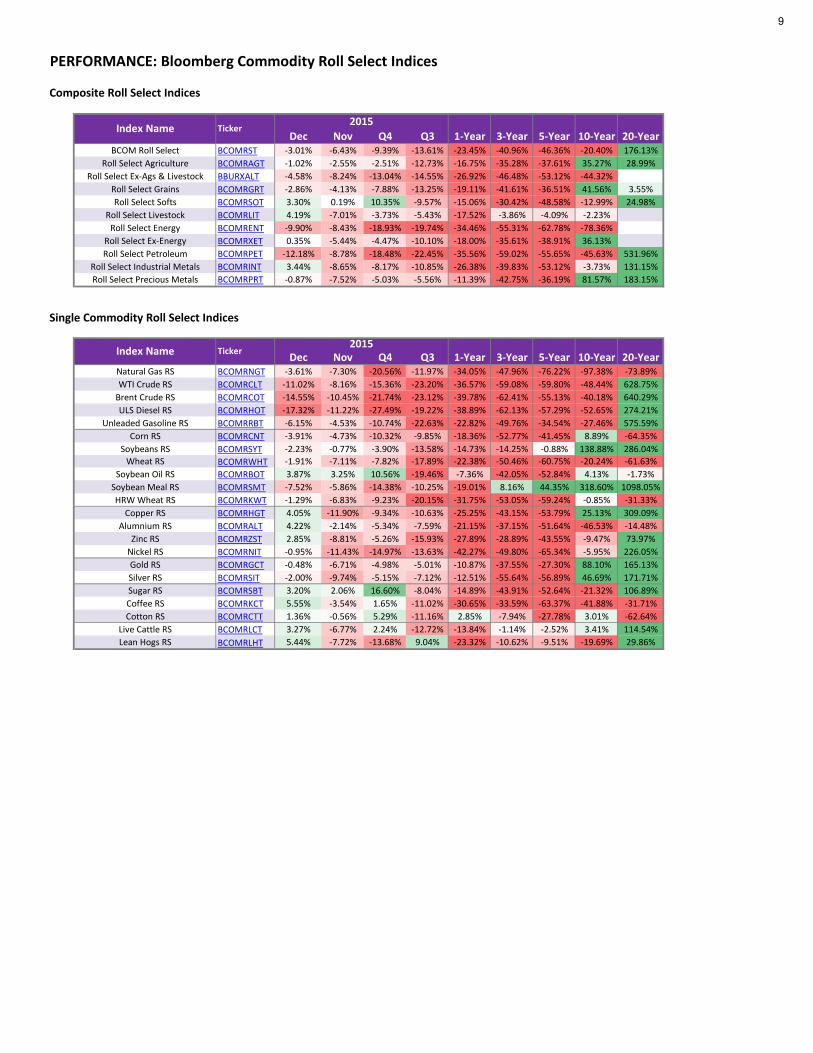
Composite Roll Select Indices
Dec Nov Q4 Q3 1-Year 3-Year 5-Year 10-Year 20-YearBCOM Roll Select BCOMRST -3.01% -6.43% -9.39% -13.61% -23.45% -40.96% -46.36% -20.40% 176.13%
Roll Select Agriculture BCOMRAGT -1.02% -2.55% -2.51% -12.73% -16.75% -35.28% -37.61% 35.27% 28.99%Roll Select Ex-Ags & Livestock BBURXALT -4.58% -8.24% -13.04% -14.55% -26.92% -46.48% -53.12% -44.32%
Roll Select Grains BCOMRGRT -2.86% -4.13% -7.88% -13.25% -19.11% -41.61% -36.51% 41.56% 3.55%Roll Select Softs BCOMRSOT 3.30% 0.19% 10.35% -9.57% -15.06% -30.42% -48.58% -12.99% 24.98%
Roll Select Livestock BCOMRLIT 4.19% -7.01% -3.73% -5.43% -17.52% -3.86% -4.09% -2.23%Roll Select Energy BCOMRENT -9.90% -8.43% -18.93% -19.74% -34.46% -55.31% -62.78% -78.36%
Roll Select Ex-Energy BCOMRXET 0.35% -5.44% -4.47% -10.10% -18.00% -35.61% -38.91% 36.13%Roll Select Petroleum BCOMRPET -12.18% -8.78% -18.48% -22.45% -35.56% -59.02% -55.65% -45.63% 531.96%
Roll Select Industrial Metals BCOMRINT 3.44% -8.65% -8.17% -10.85% -26.38% -39.83% -53.12% -3.73% 131.15%Roll Select Precious Metals BCOMRPRT -0.87% -7.52% -5.03% -5.56% -11.39% -42.75% -36.19% 81.57% 183.15%
Single Commodity Roll Select Indices
Dec Nov Q4 Q3 1-Year 3-Year 5-Year 10-Year 20-YearNatural Gas RS BCOMRNGT -3.61% -7.30% -20.56% -11.97% -34.05% -47.96% -76.22% -97.38% -73.89%WTI Crude RS BCOMRCLT -11.02% -8.16% -15.36% -23.20% -36.57% -59.08% -59.80% -48.44% 628.75%
Brent Crude RS BCOMRCOT -14.55% -10.45% -21.74% -23.12% -39.78% -62.41% -55.13% -40.18% 640.29%ULS Diesel RS BCOMRHOT -17.32% -11.22% -27.49% -19.22% -38.89% -62.13% -57.29% -52.65% 274.21%
Unleaded Gasoline RS BCOMRRBT -6.15% -4.53% -10.74% -22.63% -22.82% -49.76% -34.54% -27.46% 575.59%Corn RS BCOMRCNT -3.91% -4.73% -10.32% -9.85% -18.36% -52.77% -41.45% 8.89% -64.35%
Soybeans RS BCOMRSYT -2.23% -0.77% -3.90% -13.58% -14.73% -14.25% -0.88% 138.88% 286.04%Wheat RS BCOMRWHT -1.91% -7.11% -7.82% -17.89% -22.38% -50.46% -60.75% -20.24% -61.63%
Soybean Oil RS BCOMRBOT 3.87% 3.25% 10.56% -19.46% -7.36% -42.05% -52.84% 4.13% -1.73%Soybean Meal RS BCOMRSMT -7.52% -5.86% -14.38% -10.25% -19.01% 8.16% 44.35% 318.60% 1098.05%HRW Wheat RS BCOMRKWT -1.29% -6.83% -9.23% -20.15% -31.75% -53.05% -59.24% -0.85% -31.33%
Copper RS BCOMRHGT 4.05% -11.90% -9.34% -10.63% -25.25% -43.15% -53.79% 25.13% 309.09%Alumnium RS BCOMRALT 4.22% -2.14% -5.34% -7.59% -21.15% -37.15% -51.64% -46.53% -14.48%
Zinc RS BCOMRZST 2.85% -8.81% -5.26% -15.93% -27.89% -28.89% -43.55% -9.47% 73.97%Nickel RS BCOMRNIT -0.95% -11.43% -14.97% -13.63% -42.27% -49.80% -65.34% -5.95% 226.05%Gold RS BCOMRGCT -0.48% -6.71% -4.98% -5.01% -10.87% -37.55% -27.30% 88.10% 165.13%Silver RS BCOMRSIT -2.00% -9.74% -5.15% -7.12% -12.51% -55.64% -56.89% 46.69% 171.71%Sugar RS BCOMRSBT 3.20% 2.06% 16.60% -8.04% -14.89% -43.91% -52.64% -21.32% 106.89%Coffee RS BCOMRKCT 5.55% -3.54% 1.65% -11.02% -30.65% -33.59% -63.37% -41.88% -31.71%Cotton RS BCOMRCTT 1.36% -0.56% 5.29% -11.16% 2.85% -7.94% -27.78% 3.01% -62.64%
Live Cattle RS BCOMRLCT 3.27% -6.77% 2.24% -12.72% -13.84% -1.14% -2.52% 3.41% 114.54%Lean Hogs RS BCOMRLHT 5.44% -7.72% -13.68% 9.04% -23.32% -10.62% -9.51% -19.69% 29.86%
PERFORMANCE: Bloomberg Commodity Roll Select Indices
Index Name Ticker
Index Name Ticker
2015
2015
9

PERFORMANCE: Historical ReturnBloomberg Commodity Composite Indices
Commodities vs. Equities vs. Bonds vs. USD
Bloomberg Commodity Energy Subindices
Bloomberg Commodity Forward Indices
Bloomberg Commodity Group Subindices
Bloomberg Commodity Grains Subindices
Bloomberg Commodity Industrial Metals Subindices Bloomberg Commodity Precious Metals Subindices
Bloomberg Commodity Softs Subindices Bloomberg Commodity Livestock Subindices
-100%0%
100%200%300%400%500%600%700%800%900%
91 93 95 97 99 01 03 05 07 09 11 13 15
BloombergCommodity Index ER
BloombergCommodity Index TR
BloombergCommodity IndexSpotBloombergCommodity IndexRoll Select
-50%0%
50%100%150%200%250%300%350%400%450%
00 02 04 06 08 10 12 14
Bloomberg CommodityIndex TR
Bloomberg CommodityIndex 1 MonthForwardBloomberg CommodityIndex 3 MonthForwardBloomberg CommodityIndex 6 MonthForward
-60%-40%-20%
0%20%40%60%80%
100%120%
10 11 12 13 14 15
BloombergCommodity Index TR
S&P 500 Total ReturnIndex
Bloomberg USTreasury Bond Index
Bloomberg USD IGCorporate Bond Index
Bloomberg USD HYCorporate Bond Index
Bloomberg U.S. DollarSpot Index
-200%
0%
200%
400%
600%
800%
1000%
91 93 95 97 99 01 03 05 07 09 11 13 15
Energy
Grains
Industrial Metals
Precious Metals
Softs
Livestock
-500%
0%
500%
1000%
1500%
2000%
2500%
3000%
91 93 95 97 99 01 03 05 07 09 11 13 15
Natural Gas
WTI Crude
Brent Crude
ULS Diesel
Unleaded Gasoline-200%
0%200%400%600%800%
1000%1200%1400%1600%1800%
91 93 95 97 99 01 03 05 07 09 11 13 15
Corn
Soybeans
Wheat
Soybean Oil
Soybean Meal
HRW Wheat
-200%
0%
200%
400%
600%
800%
1000%
91 93 95 97 99 01 03 05 07 09 11 13 15
Copper
Alumnium
Zinc
Nickel-100%
0%100%200%300%400%500%600%700%800%900%
91 93 95 97 99 01 03 05 07 09 11 13 15
Gold
Silver
-200%
-100%
0%
100%
200%
300%
400%
500%
91 93 95 97 99 01 03 05 07 09 11 13 15
Sugar
Coffee
Cotton
-100%-80%-60%-40%-20%
0%20%40%60%80%
100%120%
91 93 95 97 99 01 03 05 07 09 11 13 15
Live Cattle
Lean Hogs
10
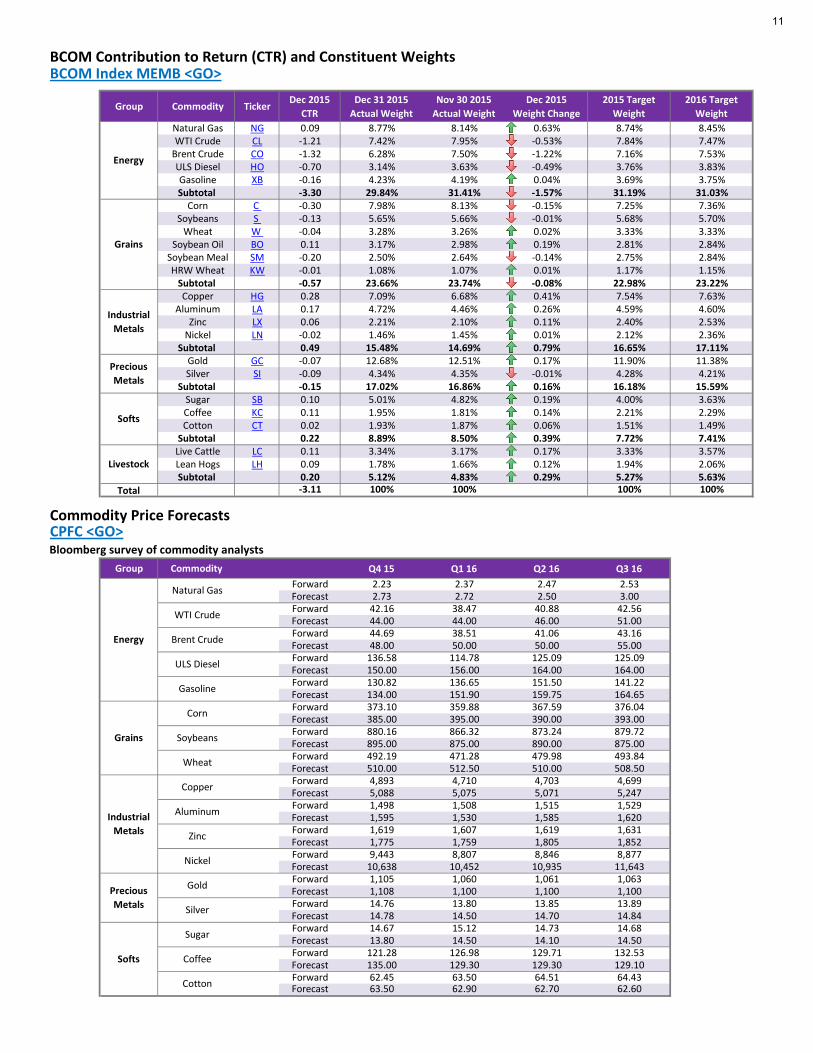
BCOM Contribution to Return (CTR) and Constituent Weights BCOM Index MEMB <GO>
Group Commodity Ticker Dec 2015 CTR
Dec 31 2015 Actual Weight
Nov 30 2015 Actual Weight
Dec 2015 Weight Change
2015 Target Weight
2016 Target Weight
Natural Gas NG 0.09 8.77% 8.14% 0.63% 8.74% 8.45% WTI Crude CL -1.21 7.42% 7.95% -0.53% 7.84% 7.47%
Brent Crude CO -1.32 6.28% 7.50% -1.22% 7.16% 7.53% ULS Diesel HO -0.70 3.14% 3.63% -0.49% 3.76% 3.83% Gasoline XB -0.16 4.23% 4.19% 0.04% 3.69% 3.75%Subtotal -3.30 29.84% 31.41% -1.57% 31.19% 31.03%
Corn C -0.30 7.98% 8.13% -0.15% 7.25% 7.36% Soybeans S -0.13 5.65% 5.66% -0.01% 5.68% 5.70%
Wheat W -0.04 3.28% 3.26% 0.02% 3.33% 3.33% Soybean Oil BO 0.11 3.17% 2.98% 0.19% 2.81% 2.84%
Soybean Meal SM -0.20 2.50% 2.64% -0.14% 2.75% 2.84% HRW Wheat KW -0.01 1.08% 1.07% 0.01% 1.17% 1.15%
Subtotal -0.57 23.66% 23.74% -0.08% 22.98% 23.22% Copper HG 0.28 7.09% 6.68% 0.41% 7.54% 7.63%
Aluminum LA 0.17 4.72% 4.46% 0.26% 4.59% 4.60% Zinc LX 0.06 2.21% 2.10% 0.11% 2.40% 2.53%
Nickel LN -0.02 1.46% 1.45% 0.01% 2.12% 2.36%Subtotal 0.49 15.48% 14.69% 0.79% 16.65% 17.11%
Gold GC -0.07 12.68% 12.51% 0.17% 11.90% 11.38% Silver SI -0.09 4.34% 4.35% -0.01% 4.28% 4.21%
Subtotal -0.15 17.02% 16.86% 0.16% 16.18% 15.59% Sugar SB 0.10 5.01% 4.82% 0.19% 4.00% 3.63% Coffee KC 0.11 1.95% 1.81% 0.14% 2.21% 2.29% Cotton CT 0.02 1.93% 1.87% 0.06% 1.51% 1.49%
Subtotal 0.22 8.89% 8.50% 0.39% 7.72% 7.41% Live Cattle LC 0.11 3.34% 3.17% 0.17% 3.33% 3.57% Lean Hogs LH 0.09 1.78% 1.66% 0.12% 1.94% 2.06%Subtotal 0.20 5.12% 4.83% 0.29% 5.27% 5.63%
Total -3.11 100% 100% 100% 100%
Commodity Price ForecastsCPFC <GO>
Group Commodity Q4 15 Q1 16 Q2 16 Q3 16Forward 2.23 2.37 2.47 2.53Forecast 2.73 2.72 2.50 3.00Forward 42.16 38.47 40.88 42.56Forecast 44.00 44.00 46.00 51.00Forward 44.69 38.51 41.06 43.16Forecast 48.00 50.00 50.00 55.00Forward 136.58 114.78 125.09 125.09Forecast 150.00 156.00 164.00 164.00Forward 130.82 136.65 151.50 141.22Forecast 134.00 151.90 159.75 164.65Forward 373.10 359.88 367.59 376.04Forecast 385.00 395.00 390.00 393.00Forward 880.16 866.32 873.24 879.72Forecast 895.00 875.00 890.00 875.00Forward 492.19 471.28 479.98 493.84Forecast 510.00 512.50 510.00 508.50Forward 4,893 4,710 4,703 4,699Forecast 5,088 5,075 5,071 5,247Forward 1,498 1,508 1,515 1,529Forecast 1,595 1,530 1,585 1,620Forward 1,619 1,607 1,619 1,631Forecast 1,775 1,759 1,805 1,852Forward 9,443 8,807 8,846 8,877Forecast 10,638 10,452 10,935 11,643Forward 1,105 1,060 1,061 1,063Forecast 1,108 1,100 1,100 1,100Forward 14.76 13.80 13.85 13.89Forecast 14.78 14.50 14.70 14.84Forward 14.67 15.12 14.73 14.68Forecast 13.80 14.50 14.10 14.50Forward 121.28 126.98 129.71 132.53Forecast 135.00 129.30 129.30 129.10Forward 62.45 63.50 64.51 64.43Forecast 63.50 62.90 62.70 62.60
Energy
Livestock
Softs
Precious Metals
Industrial Metals
Grains
Coffee
Cotton
Zinc
Nickel
Gold
Silver
Sugar
Softs
Bloomberg survey of commodity analysts
Energy
Grains
Industrial Metals
Precious Metals
Natural Gas
WTI Crude
Brent Crude
ULS Diesel
Gasoline
Corn
Soybeans
Wheat
Copper
Aluminum
11

Composite Indices
Bloomberg Commodity ER BCOM 16.44% 13.44% 15.42% 12.16% 13.88% 17.99% 15.98%Bloomberg Commodity TR BCOMTR 16.43% 13.44% 15.42% 12.16% 13.88% 17.99% 15.97%
Bloomberg Commodity Spot BCOMSP 16.28% 13.47% 15.50% 12.21% 13.93% 18.07% 16.07%Bloomberg Roll Select BCOMRST 14.22% 12.13% 14.31% 11.43% 13.14% 16.94% 14.60%
1 Month Forward BCOMF1T 15.78% 13.05% 15.10% 11.85% 13.60% 17.64% 15.41% 2 Month Forward BCOMF2T 14.96% 12.63% 14.80% 11.60% 13.36% 17.35% 14.89% 3 Month Forward BCOMF3T 14.25% 12.25% 14.46% 11.33% 13.15% 17.05% 14.46% 4 Month Forward BCOMF4T 13.84% 11.94% 14.20% 11.11% 12.92% 16.79% 5 Month Forward BCOMF5T 13.32% 11.59% 13.67% 10.74% 12.54% 16.29% 6 Month Forward BCOMF6T 13.32% 11.59% 13.67% 10.74% 12.54% 16.29%
Energy BCOMENTR 36.92% 30.11% 33.56% 24.32% 24.09% 28.82% 30.52%Petroleum BCOMPETR 38.53% 35.24% 40.80% 28.01% 27.45% 32.69% 32.83%Agriculture BCOMAGTR 13.18% 11.60% 16.01% 14.75% 17.67% 20.91% 18.38%
Grains BCOMGRTR 15.10% 14.83% 20.18% 18.83% 21.80% 25.18% 22.60%Industrial Metals BCOMINTR 19.50% 18.07% 19.54% 16.84% 19.34% 26.28% 22.31%Precious Metals BCOMPRTR 19.20% 16.77% 16.86% 19.45% 20.86% 23.39% 19.67%
Softs BCOMSOTR 18.56% 19.99% 20.70% 19.31% 20.66% 22.45% 20.60%Livestock BCOMLITR 23.55% 23.15% 17.72% 13.60% 13.65% 14.18% 14.49%Ex-Energy BCOMXETR 12.33% 10.18% 11.45% 10.84% 13.16% 16.78% 13.78%
Ex-Petroleum BCOMXPET 13.37% 10.56% 11.27% 10.86% 12.83% 16.58%Ex-Agriculture BCOMXAGT 20.67% 17.22% 18.85% 14.43% 15.64% 19.80%
Ex-Grains BCOMXGRT 12.33% 10.18% 11.45% 10.84% 13.16% 16.78%Ex-Industrial Metals BCOMXIMT 18.26% 15.37% 16.98% 13.14% 14.55% 18.65%Ex-Precious Metals BCOMXPMT 17.46% 14.50% 16.60% 13.01% 14.48% 18.19%
Ex-Softs BCOMXSOT 18.38% 14.78% 17.47% 13.16% 14.68% 18.89%Ex-Livestock BCOMXLIT 17.31% 14.04% 16.12% 12.69% 14.31% 18.54%
Ex-Agriculture & Livestock BCOMXALT 20.67% 17.22% 18.85% 14.43% 15.64% 19.80%S&P 500 Total Return Index SPXT 18.41% 14.84% 15.49% 12.81% 15.45% 20.75% 19.60%
Bloomberg US Treasury Bond Index BUSY 4.79% 3.80% 4.64% 3.88% 4.11%Bloomberg USD IG Corporate Bond Index BUSC 4.94% 3.87% 4.67% 4.10% 4.40%Bloomberg USD HY Corporate Bond Index BUHY 5.86% 4.75% 3.51% 3.16% 3.11%
Bloomberg U.S. Dollar Spot Index BBDXY 7.16% 6.55% 7.44% 6.00% 6.34% 7.07%
Single Commodity Indices
Natural Gas BCOMNGTR 54.05% 40.93% 40.38% 37.82% 38.44% 43.68% 47.19%WTI Crude BCOMCLTR 41.29% 37.85% 45.48% 31.37% 30.79% 34.91% 34.42%
Brent Crude BCOMCOT 39.55% 36.04% 42.25% 28.74% 27.63% 32.26% 31.82%ULS Diesel BCOMHOTR 39.64% 33.66% 35.93% 24.98% 24.33% 30.18% 32.24%
Unleaded Gasoline BCOMRBTR 45.86% 39.99% 40.79% 29.02% 28.14% 34.40% 34.04%Corn BCOMCNTR 17.36% 16.58% 23.13% 23.57% 27.16% 30.95% 26.90%
Soybeans BCOMSYTR 16.01% 15.07% 19.65% 19.70% 20.83% 24.72% 23.81%Wheat BCOMWHTR 19.21% 22.92% 29.18% 25.32% 29.89% 34.06% 29.74%
Soybean Oil BCOMBOTR 26.01% 22.22% 22.88% 19.66% 19.98% 24.11% 23.42%Soybean Meal BCOMSMT 17.01% 15.04% 21.87% 24.48% 24.74% 27.87% 26.57%HRW Wheat BCOMKWT 20.23% 22.63% 27.70% 23.60% 27.28% 31.00% 26.98%
Copper BCOMHGTR 24.70% 21.06% 23.63% 19.61% 22.60% 31.53% 27.77%Alumnium BCOMALTR 19.04% 17.49% 17.97% 17.39% 19.08% 24.12% 20.53%
Zinc BCOMZSTR 25.94% 30.51% 24.53% 19.71% 22.78% 34.56% 28.17%Nickel BCOMNITR 24.06% 28.11% 32.05% 26.99% 29.00% 39.10% 35.55%Gold BCOMGCTR 16.72% 14.69% 14.68% 17.44% 17.99% 20.35% 17.54%Silver BCOMSITR 29.02% 25.72% 26.75% 28.42% 33.41% 36.37% 30.55%Sugar BCOMSBTR 25.47% 31.73% 30.03% 23.59% 27.70% 33.41% 31.91%Coffee BCOMKCTR 26.09% 30.18% 34.25% 35.80% 33.63% 31.34% 36.83%Cotton BCOMCTTR 12.42% 16.40% 18.81% 19.11% 25.13% 27.16% 25.93%
Live Cattle BCOMLCTR 26.52% 23.56% 18.37% 14.04% 14.05% 14.16% 14.39%Lean Hogs BCOMLHTR 29.93% 32.13% 29.34% 22.10% 21.06% 22.59% 24.16%
VOLATILITY: Realized
Index Name Ticker
Index Name Ticker
3-Mon 1-Year 3-Year1-Mon
1-Mon 3-Mon 1-Year 3-Year 5-Year 10-Year
5-Year 10-Year 20-Year
20-Year
12

VOLATILITY: ImpliedVCA <GO> OVDV <GO>
TermMoneyness 90% 100% 110% 90% 100% 110% 90% 100% 110%End of Dec 5% 55% 1% 1% 46% -3% 1% 36% 0%End of Nov 2% 52% 0% 0% 44% 1% 0% 32% 0%End of Dec 6% 42% 0% 2% 43% -1% 0% 40% 0%End of Nov 3% 45% 1% 2% 42% -1% 1% 38% 0%End of Dec 4% 45% 0% 2% 43% -1% 1% 40% 0%End of Nov 3% 43% 3% 1% 40% 0% 1% 36% 0%End of Dec 1% 42% -3% 1% 40% 0% 0% 33% 0%End of Nov 1% 37% -2% 3% 35% 0% 2% 30% 0%End of Dec 0% 39% 1% 0% 34% 0% 0% 24% 0%End of Nov 2% 41% -2% 0% 37% 0% 0% 33% -1%End of Dec 1% 21% 4% -1% 20% 2% -1% 22% 1%End of Nov 3% 16% 5% -1% 19% 2% -1% 20% 1%End of Dec 5% 17% 4% 2% 17% 1% 1% 17% 0%End of Nov 6% 16% 4% 1% 17% 1% 1% 17% 0%End of Dec -1% 23% 5% -2% 23% 3% -1% 25% 2%End of Nov 1% 20% 4% -1% 22% 2% -1% 24% 1%End of Dec 3% 21% 3% 1% 21% 1% 0% 20% 1%End of Nov 3% 21% 3% 1% 20% 1% 0% 20% 0%End of Dec 4% 23% 3% 2% 21% 1% 1% 20% 1%End of Nov 3% 18% 4% 1% 19% 1% 0% 19% 1%End of Dec 0% 22% 5% -1% 22% 3% -2% 25% 1%End of Nov 0% 19% 4% -2% 22% 2% -1% 23% 1%End of Dec 2% 24% -1% 1% 25% -1% 0% 25% 0%End of Nov 1% 25% 0% 1% 26% -1% 3% 26% -1%End of Dec 0 19% 0% 0% 20% 0% 0% 23% 0%End of Nov 0% 45% 0% 0% 37% 0% 0% 25% 0%End of Dec 1% 28% -1% 0% 29% 0% 0% 28% 0%End of Nov 0% 50% 0% 0% 33% 0% 0% 32% 0%End of Dec 0% 33% 0% 0% 33% 0% 0% 33% 0%End of Nov 0% 32% 3% 0% 29% 5% 0% 29% 5%End of Dec 2% 13% 0% 1% 15% 0% 1% 16% 0%End of Nov 2% 15% 0% 1% 15% 0% 1% 16% 0%End of Dec 5% 21% 2% 3% 23% 0% 2% 24% 0%End of Nov 6% 24% 2% 3% 25% 1% 2% 26% 0%End of Dec 0% 30% 3% -1% 31% 2% -1% 29% 2%End of Nov 1% 32% 2% -1% 30% 2% -1% 29% 2%End of Dec -1% 35% 5% -2% 34% 2% -2% 34% 2%
End of Nov -2% 33% 4% -2% 33% 3% -2% 33% 2%End of Dec 2% 17% 2% 1% 17% 1% 0% 18% 0%End of Nov 6% 17% 4% 1% 17% 1% 0% 18% 1%End of Dec 5% 19% -2% 3% 18% -2% 3% 16% -2%
End of Nov 2% 26% -1% 2% 22% -1% 2% 18% -2%End of Dec 3% 27% -2% 2% 26% -2% 1% 21% -2%End of Nov 6% 26% 3% 2% 30% -1% 1% 23% -1%
3M 6M
Corn
Soybeans
Wheat
1M
Live
stoc
k Live Cattle
Lean Hogs
Grai
nsPr
ecio
us
Met
als Gold
Silver
Softs
Sugar
Coffee
Cotton
Soybean Oil
Soybean Meal
HRW Wheat
Indu
stria
l Met
als Copper
Aluminum
Zinc
Nickel
Ener
gy
Natural Gas
WTI Crude
Brent Crude
ULS Diesel
Gasoline
13

Bloomberg Commodity Industrial Metals Subindices Bloomberg Commodity Precious Metals Subindices
Bloomberg Commodity Softs Subindices Bloomberg Commodity Livestock Subindices
Bloomberg Commodity Energy Subindices Bloomberg Commodity Grains Subindices
VOLATILITY: Historical 1-Year RealizedBloomberg Commodity Composite Indices Bloomberg Commodity Forward Indices
Commodities vs. Equities vs. Bonds vs. USD Bloomberg Commodity Group Subindices
5%
10%
15%
20%
25%
30%
35%
92 94 96 98 00 02 04 06 08 10 12 14
BloombergCommodity Index ER
BloombergCommodity Index TR
BloombergCommodity IndexSpotBloombergCommodity IndexRoll Select
5%
10%
15%
20%
25%
30%
35%
02 04 06 08 10 12 14
Bloomberg CommodityIndex TR
Bloomberg CommodityIndex 1 MonthForwardBloomberg CommodityIndex 3 MonthForwardBloomberg CommodityIndex 6 MonthForward
0%
5%
10%
15%
20%
25%
11 12 13 14 15
BloombergCommodity Index TRS&P 500 Total ReturnIndexBloomberg USTreasury Bond IndexBloomberg USD IGCorporate Bond IndexBloomberg USD HYCorporate Bond IndexBloomberg U.S. DollarSpot Index
5%10%15%20%25%30%35%40%45%50%
92 94 96 98 00 02 04 06 08 10 12 14
Energy
Grains
Industrial Metals
Precious Metals
Softs
Livestock
10%
20%
30%
40%
50%
60%
70%
92 94 96 98 00 02 04 06 08 10 12 14
Natural Gas
WTI Crude
Brent Crude
ULS Diesel
Unleaded Gasoline10%
15%
20%
25%
30%
35%
40%
45%
50%
92 94 96 98 00 02 04 06 08 10 12 14
Corn
Soybeans
Wheat
Soybean Oil
Soybean Meal
HRW Wheat
10%
20%
30%
40%
50%
60%
70%
92 94 96 98 00 02 04 06 08 10 12 14
Copper
Alumnium
Zinc
Nickel0%
10%
20%
30%
40%
50%
60%
92 94 96 98 00 02 04 06 08 10 12 14
Gold
Silver
10%
20%
30%
40%
50%
60%
92 94 96 98 00 02 04 06 08 10 12 14
Sugar
Coffee
Cotton
5%
10%
15%
20%
25%
30%
35%
40%
92 94 96 98 00 02 04 06 08 10 12 14
Live Cattle
Lean Hogs
14

Bloo
mbe
rg
Com
mod
ity
Roll
Sele
ct
1 M
onth
Fo
rwar
d
3 M
onth
Fo
rwar
d
6 M
onth
Fo
rwar
d
Ener
gy
Petr
oleu
m
Agric
ultu
re
Gra
ins
Indu
stria
l M
etal
s
Prec
ious
M
etal
s
Soft
s
Live
stoc
k
Ex-E
nerg
y
Ex-A
gs &
Li
vest
ock
Bloomberg Commodity 100% 100% 100% 99% 88% 85% 58% 48% 55% 39% 35% 26% 75% 95%Roll Select 100% 100% 100% 100% 86% 85% 59% 50% 56% 39% 36% 25% 76% 94%
1 Month Forward 100% 100% 100% 99% 87% 85% 58% 49% 56% 39% 36% 26% 76% 95%3 Month Forward 100% 100% 100% 100% 86% 85% 59% 49% 56% 39% 36% 25% 76% 95%6 Month Forward 99% 100% 99% 100% 85% 85% 59% 49% 56% 40% 36% 24% 76% 94%
Energy 88% 86% 87% 86% 85% 95% 26% 20% 28% 13% 15% 17% 34% 93%Petroleum 85% 85% 85% 85% 85% 95% 28% 21% 31% 13% 17% 15% 36% 90%Agriculture 58% 59% 58% 59% 59% 26% 28% 93% 26% 13% 52% 13% 78% 31%
Grains 48% 50% 49% 49% 49% 20% 21% 93% 17% 7% 21% 8% 68% 23%Industrial Metals 55% 56% 56% 56% 56% 28% 31% 26% 17% 30% 25% 20% 70% 54%Precious Metals 39% 39% 39% 39% 40% 13% 13% 13% 7% 30% 14% 6% 57% 40%
Softs 35% 36% 36% 36% 36% 15% 17% 52% 21% 25% 14% 14% 48% 22%Livestock 26% 25% 26% 25% 24% 17% 15% 13% 8% 20% 6% 14% 29% 20%Ex-Energy 75% 76% 76% 76% 76% 34% 36% 78% 68% 70% 57% 48% 29% 58%
Ex-Agriculture & Livestock 95% 94% 95% 95% 94% 93% 90% 31% 23% 54% 40% 22% 20% 58%S&P 500 Total Return Index 30% 31% 30% 31% 32% 28% 31% 15% 10% 25% 3% 15% 8% 21% 30%
S&P Energy 60% 60% 60% 60% 61% 64% 67% 21% 14% 28% 12% 21% 10% 30% 63%S&P Financial 26% 28% 26% 27% 29% 24% 28% 16% 11% 22% -3% 15% 8% 18% 25%
S&P Health Care 13% 15% 14% 14% 15% 11% 13% 5% 3% 17% 2% 5% 4% 11% 14%S&P Consumer Discretionary 22% 24% 23% 24% 26% 20% 25% 14% 9% 22% -4% 16% 9% 17% 21%
S&P IT 22% 24% 23% 24% 25% 20% 23% 11% 8% 23% 3% 9% 6% 18% 22%S&P Utilities 9% 9% 9% 9% 9% 9% 7% 2% -1% 2% 12% 12% -4% 6% 10%
S&P Consumers Staples 19% 21% 20% 20% 21% 15% 16% 12% 7% 20% 6% 16% 4% 18% 18%S&P Industrials 28% 30% 29% 29% 31% 26% 29% 14% 10% 26% 2% 15% 8% 21% 28%
S&P Telecommunication 29% 31% 30% 30% 31% 25% 27% 18% 15% 20% 11% 16% 8% 24% 28%S&P Materials 45% 47% 46% 47% 48% 41% 44% 22% 16% 36% 12% 21% 11% 34% 45%
Bloomberg US Treasury -19% -19% -19% -19% -20% -21% -24% -15% -15% -18% 21% -1% -3% -9% -17%Bloomberg USD IG Corporate -15% -15% -15% -15% -16% -18% -21% -13% -14% -15% 21% 0% -1% -6% -14%Bloomberg USD HY Corporate 24% 25% 24% 25% 26% 22% 25% 12% 7% 24% 1% 13% 11% 19% 23%
Bloomberg U.S. Dollar Spot -39% -39% -39% -39% -38% -30% -27% -25% -18% -16% -33% -27% -8% -34% -37%EURUSD 21% 21% 21% 21% 20% 15% 12% 18% 16% 6% 19% 14% 3% 20% 18%JPYUSD 4% 2% 3% 2% 1% -1% -6% 1% 0% -8% 27% 8% 2% 7% 4%CADUSD 59% 59% 59% 59% 59% 55% 56% 27% 18% 28% 28% 26% 9% 38% 59%MXNUSD 41% 42% 42% 42% 42% 38% 36% 24% 15% 18% 18% 29% 11% 30% 40%GBPUSD 31% 31% 31% 30% 30% 23% 21% 21% 17% 15% 22% 19% 13% 29% 28%AUDUSD 45% 46% 46% 46% 46% 34% 32% 25% 17% 33% 32% 26% 14% 42% 43%CHFUSD 6% 5% 6% 5% 5% -2% -4% 4% 1% 8% 23% 10% 2% 14% 5%KRWUSD 37% 37% 37% 37% 38% 25% 23% 23% 16% 24% 36% 29% 5% 37% 35%CNYUSD 15% 15% 15% 15% 15% 11% 10% 14% 13% 9% 6% 3% 6% 16% 12%
Bloo
mbe
rg
Com
mod
ity
Roll
Sele
ct
1 M
onth
Fo
rwar
d
3 M
onth
Fo
rwar
d
6 M
onth
Fo
rwar
d
Ener
gy
Petr
oleu
m
Agric
ultu
re
Gra
ins
Indu
stria
l M
etal
s
Prec
ious
M
etal
s
Soft
s
Live
stoc
k
Ex-E
nerg
y
Ex-A
gs &
Li
vest
ock
Bloomberg Commodity 99% 100% 99% 99% 80% 77% 68% 60% 64% 55% 47% 24% 86% 93%Roll Select 99% 99% 100% 99% 79% 76% 68% 60% 66% 56% 47% 23% 86% 92%
1 Month Forward 100% 99% 100% 99% 79% 77% 69% 60% 65% 55% 47% 24% 86% 92%3 Month Forward 99% 100% 100% 100% 78% 76% 69% 60% 66% 56% 47% 23% 87% 92%6 Month Forward 99% 99% 99% 100% 76% 76% 68% 59% 67% 58% 47% 23% 87% 92%
Energy 80% 79% 79% 78% 76% 87% 29% 23% 34% 23% 22% 15% 39% 88%Petroleum 77% 76% 77% 76% 76% 87% 30% 23% 41% 28% 26% 15% 43% 83%Agriculture 68% 68% 69% 69% 68% 29% 30% 95% 31% 24% 56% 16% 81% 37%
Grains 60% 60% 60% 60% 59% 23% 23% 95% 23% 19% 29% 13% 73% 30%Industrial Metals 64% 66% 65% 66% 67% 34% 41% 31% 23% 44% 31% 13% 71% 66%Precious Metals 55% 56% 55% 56% 58% 23% 28% 24% 19% 44% 20% 7% 66% 58%
Softs 47% 47% 47% 47% 47% 22% 26% 56% 29% 31% 20% 14% 53% 31%Livestock 24% 23% 24% 23% 23% 15% 15% 16% 13% 13% 7% 14% 25% 17%Ex-Energy 86% 86% 86% 87% 87% 39% 43% 81% 73% 71% 66% 53% 25% 68%
Ex-Agriculture & Livestock 93% 92% 92% 92% 92% 88% 83% 37% 30% 66% 58% 31% 17% 68%S&P 500 Total Return Index 35% 36% 36% 37% 38% 29% 36% 21% 16% 39% 8% 22% 11% 30% 34%
S&P Energy 54% 54% 55% 55% 55% 54% 60% 26% 20% 42% 19% 27% 12% 38% 56%S&P Financial 29% 30% 30% 31% 32% 24% 30% 19% 13% 37% 3% 21% 8% 25% 28%
S&P Health Care 23% 24% 24% 24% 25% 18% 23% 14% 10% 28% 4% 15% 9% 20% 22%S&P Consumer Discretionary 27% 28% 28% 29% 29% 22% 29% 18% 14% 33% 1% 17% 10% 23% 26%
S&P IT 31% 31% 31% 32% 33% 23% 31% 19% 14% 36% 8% 18% 11% 28% 29%S&P Utilities 17% 17% 17% 17% 18% 15% 17% 10% 7% 15% 5% 14% 2% 13% 16%
S&P Consumers Staples 23% 24% 24% 24% 25% 18% 23% 13% 10% 26% 6% 14% 9% 20% 22%S&P Industrials 33% 34% 34% 35% 35% 26% 33% 20% 15% 39% 7% 21% 10% 29% 32%
S&P Telecommunication 21% 22% 22% 22% 23% 18% 22% 13% 9% 22% 4% 14% 7% 17% 21%S&P Materials 45% 46% 46% 46% 47% 35% 43% 26% 20% 46% 20% 25% 12% 40% 44%
Bloomberg US Treasury -22% -22% -22% -22% -22% -22% -26% -15% -12% -25% 10% -10% -7% -15% -20%Bloomberg USD IG Corporate -15% -15% -15% -15% -15% -18% -21% -10% -9% -17% 14% -6% -6% -7% -14%Bloomberg USD HY Corporate 23% 24% 23% 24% 25% 17% 22% 14% 11% 25% 8% 13% 7% 21% 22%
Bloomberg U.S. Dollar Spot -42% -42% -42% -43% -43% -28% -31% -26% -19% -33% -35% -29% -7% -40% -40%EURUSD 32% 32% 32% 33% 33% 22% 23% 21% 16% 27% 25% 22% 4% 31% 31%JPYUSD 0% 0% 0% 0% 0% -4% -4% 0% 0% -6% 16% 2% -3% 3% 0%CADUSD 50% 50% 50% 51% 52% 42% 48% 28% 21% 38% 29% 28% 11% 41% 49%MXNUSD 36% 37% 36% 37% 38% 28% 32% 22% 15% 34% 18% 26% 10% 32% 35%GBPUSD 30% 30% 30% 31% 31% 20% 23% 18% 14% 25% 26% 19% 10% 30% 29%AUDUSD 44% 45% 45% 46% 46% 29% 35% 28% 21% 40% 32% 29% 13% 43% 42%CHFUSD 15% 15% 15% 15% 15% 5% 5% 8% 5% 16% 23% 12% -2% 19% 15%KRWUSD 32% 33% 33% 34% 34% 19% 23% 23% 18% 30% 23% 21% 10% 34% 29%CNYUSD 10% 10% 10% 10% 10% 7% 6% 8% 8% 8% 4% 4% 1% 9% 8%
Bond
Curr
ency
Bond
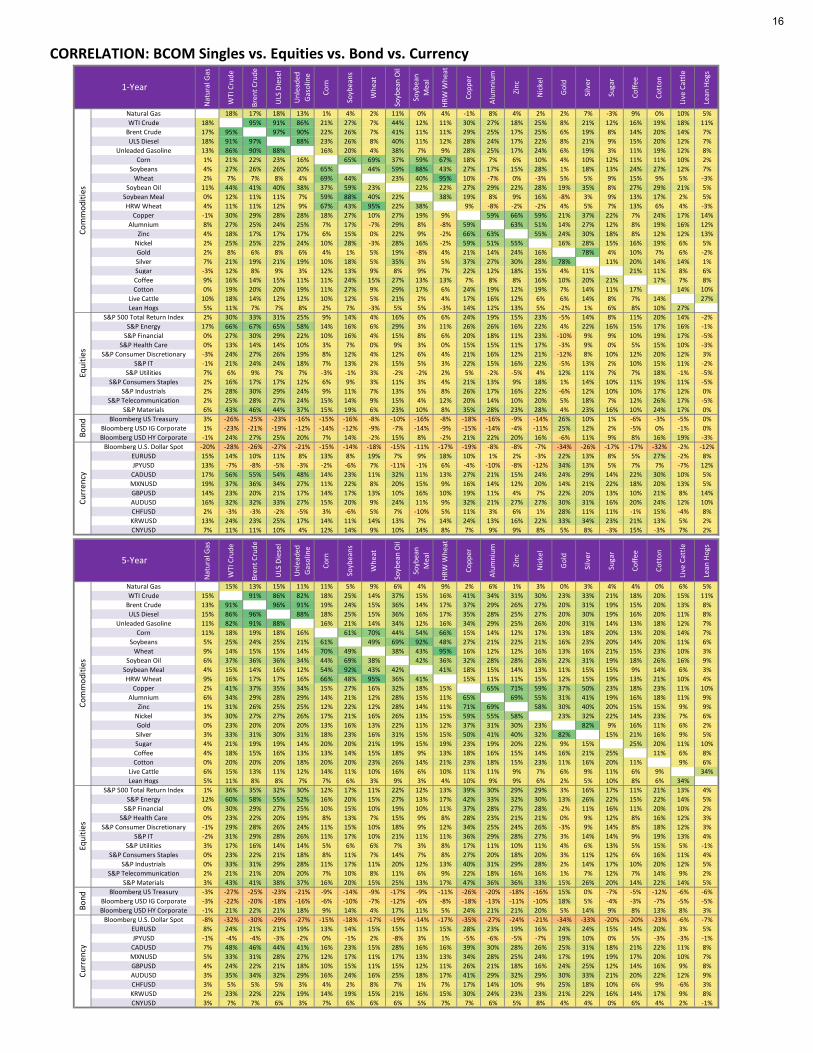
CORRELATION: BCOM Composites vs. Equities vs. Bond vs. Currency Cu
rren
cyCo
mm
oditi
esEq
uitie
s
5-Year
1-Year
Com
mod
ities
Equi
ties
15
Nat
ural
Gas
WTI
Cru
de
Bren
t Cru
de
ULS
Die
sel
Unl
eade
d G
asol
ine
Corn
Soyb
eans
Whe
at
Soyb
ean
Oil
Soyb
ean
Mea
l
HRW
Whe
at
Copp
er
Alum
nium
Zinc
Nic
kel
Gol
d
Silv
er
Suga
r
Coffe
e
Cott
on
Live
Cat
tle
Lean
Hog
s
Natural Gas 18% 17% 18% 13% 1% 4% 2% 11% 0% 4% -1% 8% 4% 2% 2% 7% -3% 9% 0% 10% 5%WTI Crude 18% 95% 91% 86% 21% 27% 7% 44% 12% 11% 30% 27% 18% 25% 8% 21% 12% 16% 19% 18% 11%
Brent Crude 17% 95% 97% 90% 22% 26% 7% 41% 11% 11% 29% 25% 17% 25% 6% 19% 8% 14% 20% 14% 7%ULS Diesel 18% 91% 97% 88% 23% 26% 8% 40% 11% 12% 28% 24% 17% 22% 8% 21% 9% 15% 20% 12% 7%
Unleaded Gasoline 13% 86% 90% 88% 16% 20% 4% 38% 7% 9% 28% 25% 17% 24% 6% 19% 3% 11% 19% 12% 8%Corn 1% 21% 22% 23% 16% 65% 69% 37% 59% 67% 18% 7% 6% 10% 4% 10% 12% 11% 11% 10% 2%
Soybeans 4% 27% 26% 26% 20% 65% 44% 59% 88% 43% 27% 17% 15% 28% 1% 18% 13% 24% 27% 12% 7%Wheat 2% 7% 7% 8% 4% 69% 44% 23% 40% 95% 10% -7% 0% -3% 5% 5% 9% 15% 9% 5% -3%
Soybean Oil 11% 44% 41% 40% 38% 37% 59% 23% 22% 22% 27% 29% 22% 28% 19% 35% 8% 27% 29% 21% 5%Soybean Meal 0% 12% 11% 11% 7% 59% 88% 40% 22% 38% 19% 8% 9% 16% -8% 3% 9% 13% 17% 2% 5%HRW Wheat 4% 11% 11% 12% 9% 67% 43% 95% 22% 38% 9% -8% -2% -2% 4% 5% 7% 13% 6% 4% -3%
Copper -1% 30% 29% 28% 28% 18% 27% 10% 27% 19% 9% 59% 66% 59% 21% 37% 22% 7% 24% 17% 14%Alumnium 8% 27% 25% 24% 25% 7% 17% -7% 29% 8% -8% 59% 63% 51% 14% 27% 12% 8% 19% 16% 12%
Zinc 4% 18% 17% 17% 17% 6% 15% 0% 22% 9% -2% 66% 63% 55% 24% 30% 18% 8% 12% 12% 13%Nickel 2% 25% 25% 22% 24% 10% 28% -3% 28% 16% -2% 59% 51% 55% 16% 28% 15% 16% 19% 6% 5%Gold 2% 8% 6% 8% 6% 4% 1% 5% 19% -8% 4% 21% 14% 24% 16% 78% 4% 10% 7% 6% -2%Silver 7% 21% 19% 21% 19% 10% 18% 5% 35% 3% 5% 37% 27% 30% 28% 78% 11% 20% 14% 14% 1%Sugar -3% 12% 8% 9% 3% 12% 13% 9% 8% 9% 7% 22% 12% 18% 15% 4% 11% 21% 11% 8% 6%Coffee 9% 16% 14% 15% 11% 11% 24% 15% 27% 13% 13% 7% 8% 8% 16% 10% 20% 21% 17% 7% 8%Cotton 0% 19% 20% 20% 19% 11% 27% 9% 29% 17% 6% 24% 19% 12% 19% 7% 14% 11% 17% 14% 10%
Live Cattle 10% 18% 14% 12% 12% 10% 12% 5% 21% 2% 4% 17% 16% 12% 6% 6% 14% 8% 7% 14% 27%Lean Hogs 5% 11% 7% 7% 8% 2% 7% -3% 5% 5% -3% 14% 12% 13% 5% -2% 1% 6% 8% 10% 27%
S&P 500 Total Return Index 2% 30% 33% 31% 25% 9% 14% 4% 16% 6% 6% 24% 19% 15% 23% -5% 14% 8% 11% 20% 14% -2%S&P Energy 17% 66% 67% 65% 58% 14% 16% 6% 29% 3% 11% 26% 26% 16% 22% 4% 22% 16% 15% 17% 16% -1%
S&P Financial 0% 27% 30% 29% 22% 10% 16% 4% 15% 8% 6% 20% 18% 11% 23% -10% 9% 9% 10% 19% 17% -5%S&P Health Care 0% 13% 14% 14% 10% 3% 7% 0% 9% 3% 0% 15% 15% 11% 17% -3% 9% 0% 5% 15% 10% -3%
S&P Consumer Discretionary -3% 24% 27% 26% 19% 8% 12% 4% 12% 6% 4% 21% 16% 12% 21% -12% 8% 10% 12% 20% 12% 3%S&P IT -1% 21% 24% 24% 18% 7% 13% 2% 15% 5% 3% 22% 15% 16% 22% -5% 13% 2% 10% 15% 11% -2%
S&P Utilities 7% 6% 9% 7% 7% -3% -1% 3% -2% -2% 2% 5% -2% -5% 4% 12% 11% 7% 7% 18% -1% -5%S&P Consumers Staples 2% 16% 17% 17% 12% 6% 9% 3% 11% 3% 4% 21% 13% 9% 18% 1% 14% 10% 11% 19% 11% -5%
S&P Industrials 2% 28% 30% 29% 24% 9% 11% 7% 13% 5% 8% 26% 17% 16% 22% -6% 12% 10% 10% 17% 12% 0%S&P Telecommunication 2% 25% 28% 27% 24% 15% 14% 9% 15% 4% 12% 20% 14% 10% 20% 5% 18% 7% 12% 26% 17% -5%
S&P Materials 6% 43% 46% 44% 37% 15% 19% 6% 23% 10% 8% 35% 28% 23% 28% 4% 23% 16% 10% 24% 17% 0%Bloomberg US Treasury 3% -26% -25% -23% -16% -15% -16% -8% -10% -16% -8% -18% -16% -9% -14% 26% 10% 1% -6% -3% -5% 0%
Bloomberg USD IG Corporate 1% -23% -21% -19% -12% -14% -12% -9% -7% -14% -9% -15% -14% -4% -11% 25% 12% 2% -5% 0% -1% 0%Bloomberg USD HY Corporate -1% 24% 27% 25% 20% 7% 14% -2% 15% 8% -2% 21% 22% 20% 16% -6% 11% 9% 8% 16% 19% -3%
Bloomberg U.S. Dollar Spot -20% -28% -26% -27% -21% -15% -14% -18% -15% -11% -17% -19% -8% -8% -7% -34% -26% -17% -17% -32% -2% -12%EURUSD 15% 14% 10% 11% 8% 13% 8% 19% 7% 9% 18% 10% 1% 2% -3% 22% 13% 8% 5% 27% -2% 8%JPYUSD 13% -7% -8% -5% -3% -2% -6% 7% -11% -1% 6% -4% -10% -8% -12% 34% 13% 5% 7% 7% -7% 12%CADUSD 17% 56% 55% 54% 48% 14% 23% 11% 32% 11% 13% 27% 21% 15% 24% 24% 29% 14% 22% 30% 10% 5%MXNUSD 19% 37% 36% 34% 27% 11% 22% 8% 20% 15% 9% 16% 14% 12% 20% 14% 21% 22% 18% 20% 13% 5%GBPUSD 14% 23% 20% 21% 17% 14% 17% 13% 10% 16% 10% 19% 11% 4% 7% 22% 20% 13% 10% 21% 8% 14%AUDUSD 16% 32% 32% 33% 27% 15% 20% 9% 24% 11% 9% 32% 21% 27% 27% 30% 31% 16% 20% 24% 12% 10%CHFUSD 2% -3% -3% -2% -5% 3% -6% 5% 7% -10% 5% 11% 3% 6% 1% 28% 11% 11% -1% 15% -4% 8%KRWUSD 13% 24% 23% 25% 17% 14% 11% 14% 13% 7% 14% 24% 13% 16% 22% 33% 34% 23% 21% 13% 5% 2%CNYUSD 7% 11% 11% 10% 4% 12% 14% 9% 10% 14% 8% 7% 9% 9% 8% 5% 8% -3% 15% -3% 7% 2%
Nat
ural
Gas
WTI
Cru
de
Bren
t Cru
de
ULS
Die
sel
Unl
eade
d G
asol
ine
Corn
Soyb
eans
Whe
at
Soyb
ean
Oil
Soyb
ean
Mea
l
HRW
Whe
at
Copp
er
Alum
nium
Zinc
Nic
kel
Gol
d
Silv
er
Suga
r
Coffe
e
Cott
on
Live
Cat
tle
Lean
Hog
s
Natural Gas 15% 13% 15% 11% 11% 5% 9% 6% 4% 9% 2% 6% 1% 3% 0% 3% 4% 4% 0% 6% 5%WTI Crude 15% 91% 86% 82% 18% 25% 14% 37% 15% 16% 41% 34% 31% 30% 23% 33% 21% 18% 20% 15% 11%
Brent Crude 13% 91% 96% 91% 19% 24% 15% 36% 14% 17% 37% 29% 26% 27% 20% 31% 19% 15% 20% 13% 8%ULS Diesel 15% 86% 96% 88% 18% 25% 15% 36% 16% 17% 35% 28% 25% 27% 20% 30% 19% 16% 20% 11% 8%
Unleaded Gasoline 11% 82% 91% 88% 16% 21% 14% 34% 12% 16% 34% 29% 25% 26% 20% 31% 14% 13% 18% 12% 7%Corn 11% 18% 19% 18% 16% 61% 70% 44% 54% 66% 15% 14% 12% 17% 13% 18% 20% 13% 20% 14% 7%
Soybeans 5% 25% 24% 25% 21% 61% 49% 69% 92% 48% 27% 21% 22% 21% 16% 23% 20% 14% 20% 11% 6%Wheat 9% 14% 15% 15% 14% 70% 49% 38% 43% 95% 16% 12% 12% 16% 13% 16% 21% 15% 23% 10% 3%
Soybean Oil 6% 37% 36% 36% 34% 44% 69% 38% 42% 36% 32% 28% 28% 26% 22% 31% 19% 18% 26% 16% 9%Soybean Meal 4% 15% 14% 16% 12% 54% 92% 43% 42% 41% 18% 15% 14% 13% 11% 15% 15% 9% 14% 6% 3%HRW Wheat 9% 16% 17% 17% 16% 66% 48% 95% 36% 41% 15% 11% 11% 15% 12% 15% 19% 13% 21% 10% 4%
Copper 2% 41% 37% 35% 34% 15% 27% 16% 32% 18% 15% 65% 71% 59% 37% 50% 23% 18% 23% 11% 10%Alumnium 6% 34% 29% 28% 29% 14% 21% 12% 28% 15% 11% 65% 69% 55% 31% 41% 19% 16% 18% 11% 9%
Zinc 1% 31% 26% 25% 25% 12% 22% 12% 28% 14% 11% 71% 69% 58% 30% 40% 20% 15% 15% 9% 9%Nickel 3% 30% 27% 27% 26% 17% 21% 16% 26% 13% 15% 59% 55% 58% 23% 32% 22% 14% 23% 7% 6%Gold 0% 23% 20% 20% 20% 13% 16% 13% 22% 11% 12% 37% 31% 30% 23% 82% 9% 16% 11% 6% 2%Silver 3% 33% 31% 30% 31% 18% 23% 16% 31% 15% 15% 50% 41% 40% 32% 82% 15% 21% 16% 9% 5%Sugar 4% 21% 19% 19% 14% 20% 20% 21% 19% 15% 19% 23% 19% 20% 22% 9% 15% 25% 20% 11% 10%Coffee 4% 18% 15% 16% 13% 13% 14% 15% 18% 9% 13% 18% 16% 15% 14% 16% 21% 25% 11% 6% 8%Cotton 0% 20% 20% 20% 18% 20% 20% 23% 26% 14% 21% 23% 18% 15% 23% 11% 16% 20% 11% 9% 6%
Live Cattle 6% 15% 13% 11% 12% 14% 11% 10% 16% 6% 10% 11% 11% 9% 7% 6% 9% 11% 6% 9% 34%Lean Hogs 5% 11% 8% 8% 7% 7% 6% 3% 9% 3% 4% 10% 9% 9% 6% 2% 5% 10% 8% 6% 34%
S&P 500 Total Return Index 1% 36% 35% 32% 30% 12% 17% 11% 22% 12% 13% 39% 30% 29% 29% 3% 16% 17% 11% 21% 13% 4%S&P Energy 12% 60% 58% 55% 52% 16% 20% 15% 27% 13% 17% 42% 33% 32% 30% 13% 26% 22% 15% 22% 14% 5%
S&P Financial 0% 30% 29% 27% 25% 10% 15% 10% 19% 10% 11% 37% 28% 27% 28% -2% 11% 16% 11% 20% 10% 2%S&P Health Care 0% 23% 22% 20% 19% 8% 13% 7% 15% 9% 8% 28% 23% 21% 21% 0% 9% 12% 8% 16% 12% 3%
S&P Consumer Discretionary -1% 29% 28% 26% 24% 11% 15% 10% 18% 9% 12% 34% 25% 24% 26% -3% 9% 14% 8% 18% 12% 3%S&P IT -2% 31% 29% 28% 26% 11% 17% 10% 21% 11% 11% 36% 29% 28% 27% 3% 14% 14% 9% 19% 13% 4%
S&P Utilities 3% 17% 16% 14% 14% 5% 6% 6% 7% 3% 8% 17% 11% 10% 11% 4% 6% 13% 5% 15% 5% -1%S&P Consumers Staples 0% 23% 22% 21% 18% 8% 11% 7% 14% 7% 8% 27% 20% 18% 20% 3% 11% 12% 6% 16% 11% 4%
S&P Industrials 0% 33% 31% 29% 28% 11% 17% 11% 20% 12% 13% 40% 31% 29% 28% 2% 14% 17% 10% 20% 12% 5%S&P Telecommunication 2% 21% 21% 20% 20% 7% 10% 8% 11% 6% 9% 22% 18% 16% 16% 1% 7% 12% 7% 14% 9% 2%
S&P Materials 3% 43% 41% 38% 37% 16% 20% 15% 25% 13% 17% 47% 36% 36% 33% 15% 26% 20% 14% 22% 14% 5%Bloomberg US Treasury -3% -27% -25% -23% -21% -9% -14% -9% -17% -9% -11% -26% -20% -18% -16% 15% 0% -7% -5% -12% -6% -6%
Bloomberg USD IG Corporate -3% -22% -20% -18% -16% -6% -10% -7% -12% -6% -8% -18% -13% -11% -10% 18% 5% -4% -3% -7% -5% -5%Bloomberg USD HY Corporate -1% 21% 22% 21% 18% 9% 14% 4% 17% 11% 5% 24% 21% 21% 20% 5% 14% 9% 8% 13% 8% 3%
Bloomberg U.S. Dollar Spot -8% -32% -30% -29% -27% -15% -18% -17% -19% -14% -17% -35% -27% -24% -21% -34% -33% -20% -20% -23% -6% -7%EURUSD 8% 24% 21% 21% 19% 13% 14% 15% 15% 11% 15% 28% 23% 19% 16% 24% 24% 15% 14% 20% 3% 5%JPYUSD -1% -4% -4% -3% -2% 0% -1% 2% -8% 3% 1% -5% -6% -5% -7% 19% 10% 0% 5% -3% -3% -1%CADUSD 7% 48% 46% 44% 41% 16% 23% 15% 28% 16% 16% 39% 30% 28% 26% 25% 31% 18% 21% 22% 11% 8%MXNUSD 5% 33% 31% 28% 27% 12% 17% 11% 17% 13% 13% 34% 28% 25% 24% 17% 19% 19% 17% 20% 10% 7%GBPUSD 4% 24% 22% 21% 18% 10% 15% 11% 15% 12% 11% 26% 21% 18% 16% 24% 25% 12% 14% 16% 9% 8%AUDUSD 3% 35% 34% 32% 29% 16% 24% 16% 25% 18% 17% 41% 29% 32% 29% 30% 33% 21% 20% 22% 12% 9%CHFUSD 3% 5% 5% 5% 3% 4% 2% 8% 7% 1% 7% 17% 14% 10% 9% 25% 18% 10% 6% 9% -6% 3%KRWUSD 2% 23% 22% 22% 19% 14% 19% 15% 21% 16% 15% 30% 24% 23% 23% 21% 22% 16% 14% 17% 9% 8%CNYUSD 3% 7% 7% 6% 3% 7% 6% 6% 6% 5% 7% 7% 6% 5% 8% 4% 4% 0% 6% 4% 2% -1%
Curr
ency
CORRELATION: BCOM Singles vs. Equities vs. Bond vs. Currency
5-Year
Com
mod
ities
Equi
ties
Bond
1-YearCo
mm
oditi
esEq
uitie
sBo
ndCu
rren
cy
16
All i
tem
s
Core
Food
Food
at h
ome
Food
aw
ay fr
om
hom
e
Ener
gy
Ener
gy
Com
mod
ities
Fuel
Oil
Mot
or F
uel
Ener
gy se
rvic
es
Elec
tric
ity
Util
ity g
as se
rvic
e
Com
mod
ities
less
fo
od a
nd e
nerg
y
Serv
ices
less
en
ergy
serv
ices
Shel
ter
Med
ical
car
e
Tran
spor
tatio
n
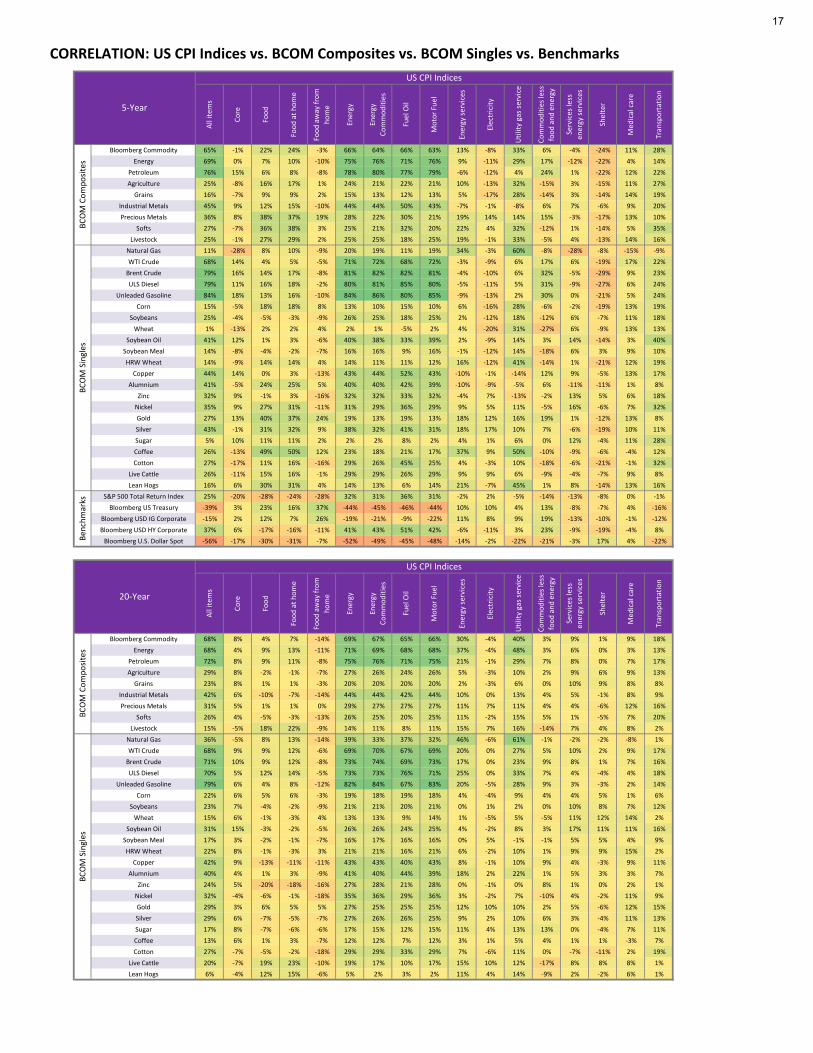
Bloomberg Commodity 65% -1% 22% 24% -3% 66% 64% 66% 63% 13% -8% 33% 6% -4% -24% 11% 28%Energy 69% 0% 7% 10% -10% 75% 76% 71% 76% 9% -11% 29% 17% -12% -22% 4% 14%
Petroleum 76% 15% 6% 8% -8% 78% 80% 77% 79% -6% -12% 4% 24% 1% -22% 12% 22%Agriculture 25% -8% 16% 17% 1% 24% 21% 22% 21% 10% -13% 32% -15% 3% -15% 11% 27%
Grains 16% -7% 9% 9% 2% 15% 13% 12% 13% 5% -17% 28% -14% 3% -14% 14% 19%Industrial Metals 45% 9% 12% 15% -10% 44% 44% 50% 43% -7% -1% -8% 6% 7% -6% 9% 20%Precious Metals 36% 8% 38% 37% 19% 28% 22% 30% 21% 19% 14% 14% 15% -3% -17% 13% 10%
Softs 27% -7% 36% 38% 3% 25% 21% 32% 20% 22% 4% 32% -12% 1% -14% 5% 35%Livestock 25% -1% 27% 29% 2% 25% 25% 18% 25% 19% -1% 33% -5% 4% -13% 14% 16%
Natural Gas 11% -28% 8% 10% -9% 20% 19% 11% 19% 34% -3% 60% -8% -28% -8% -15% -9%WTI Crude 68% 14% 4% 5% -5% 71% 72% 68% 72% -3% -9% 6% 17% 6% -19% 17% 22%
Brent Crude 79% 16% 14% 17% -8% 81% 82% 82% 81% -4% -10% 6% 32% -5% -29% 9% 23%ULS Diesel 79% 11% 16% 18% -2% 80% 81% 85% 80% -5% -11% 5% 31% -9% -27% 6% 24%
Unleaded Gasoline 84% 18% 13% 16% -10% 84% 86% 80% 85% -9% -13% 2% 30% 0% -21% 5% 24%Corn 15% -5% 18% 18% 8% 13% 10% 15% 10% 6% -16% 28% -6% -2% -19% 13% 19%
Soybeans 25% -4% -5% -3% -9% 26% 25% 18% 25% 2% -12% 18% -12% 6% -7% 11% 18%Wheat 1% -13% 2% 2% 4% 2% 1% -5% 2% 4% -20% 31% -27% 6% -9% 13% 13%
Soybean Oil 41% 12% 1% 3% -6% 40% 38% 33% 39% 2% -9% 14% 3% 14% -14% 3% 40%Soybean Meal 14% -8% -4% -2% -7% 16% 16% 9% 16% -1% -12% 14% -18% 6% 3% 9% 10%HRW Wheat 14% -9% 14% 14% 4% 14% 11% 11% 12% 16% -12% 41% -14% 1% -21% 12% 19%
Copper 44% 14% 0% 3% -13% 43% 44% 52% 43% -10% -1% -14% 12% 9% -5% 13% 17%Alumnium 41% -5% 24% 25% 5% 40% 40% 42% 39% -10% -9% -5% 6% -11% -11% 1% 8%
Zinc 32% 9% -1% 3% -16% 32% 32% 33% 32% -4% 7% -13% -2% 13% 5% 6% 18%Nickel 35% 9% 27% 31% -11% 31% 29% 36% 29% 9% 5% 11% -5% 16% -6% 7% 32%Gold 27% 13% 40% 37% 24% 19% 13% 19% 13% 18% 12% 16% 19% 1% -12% 13% 8%Silver 43% -1% 31% 32% 9% 38% 32% 41% 31% 18% 17% 10% 7% -6% -19% 10% 11%Sugar 5% 10% 11% 11% 2% 2% 2% 8% 2% 4% 1% 6% 0% 12% -4% 11% 28%Coffee 26% -13% 49% 50% 12% 23% 18% 21% 17% 37% 9% 50% -10% -9% -6% -4% 12%Cotton 27% -17% 11% 16% -16% 29% 26% 45% 25% 4% -3% 10% -18% -6% -21% -1% 32%
Live Cattle 26% -11% 15% 16% -1% 29% 29% 26% 29% 9% 9% 6% -9% -4% -7% 9% 8%Lean Hogs 16% 6% 30% 31% 4% 14% 13% 6% 14% 21% -7% 45% 1% 8% -14% 13% 16%
S&P 500 Total Return Index 25% -20% -28% -24% -28% 32% 31% 36% 31% -2% 2% -5% -14% -13% -8% 0% -1%Bloomberg US Treasury -39% 3% 23% 16% 37% -44% -45% -46% -44% 10% 10% 4% 13% -8% -7% 4% -16%
Bloomberg USD IG Corporate -15% 2% 12% 7% 26% -19% -21% -9% -22% 11% 8% 9% 19% -13% -10% -1% -12%Bloomberg USD HY Corporate 37% 6% -17% -16% -11% 41% 43% 51% 42% -6% -11% 3% 23% -9% -19% -4% 8%
Bloomberg U.S. Dollar Spot -56% -17% -30% -31% -7% -52% -49% -45% -48% -14% -2% -22% -21% -3% 17% 4% -22%
All i
tem
s
Core
Food
Food
at h
ome
Food
aw
ay fr
om
hom
e
Ener
gy
Ener
gy
Com
mod
ities
Fuel
Oil
Mot
or F
uel
Ener
gy se
rvic
es
Elec
tric
ity
Util
ity g
as se
rvic
e
Com
mod
ities
less
fo
od a
nd e
nerg
y
Serv
ices
less
en
ergy
serv
ices
Shel
ter
Med
ical
car
e
Tran
spor
tatio
n
Bloomberg Commodity 68% 8% 4% 7% -14% 69% 67% 65% 66% 30% -4% 40% 3% 9% 1% 9% 18%Energy 68% 4% 9% 13% -11% 71% 69% 68% 68% 37% -4% 48% 3% 6% 0% 3% 13%
Petroleum 72% 8% 9% 11% -8% 75% 76% 71% 75% 21% -1% 29% 7% 8% 0% 7% 17%Agriculture 29% 8% -2% -1% -7% 27% 26% 24% 26% 5% -3% 10% 2% 9% 6% 9% 13%
Grains 23% 8% 1% 1% -3% 20% 20% 20% 20% 2% -3% 6% 0% 10% 9% 8% 8%Industrial Metals 42% 6% -10% -7% -14% 44% 44% 42% 44% 10% 0% 13% 4% 5% -1% 8% 9%Precious Metals 31% 5% 1% 1% 0% 29% 27% 27% 27% 11% 7% 11% 4% 4% -6% 12% 16%
Softs 26% 4% -5% -3% -13% 26% 25% 20% 25% 11% -2% 15% 5% 1% -5% 7% 20%Livestock 15% -5% 18% 22% -9% 14% 11% 8% 11% 15% 7% 16% -14% 7% 4% 8% 2%
Natural Gas 36% -5% 8% 13% -14% 39% 33% 37% 32% 46% -6% 61% -1% -2% -2% -8% 1%WTI Crude 68% 9% 9% 12% -6% 69% 70% 67% 69% 20% 0% 27% 5% 10% 2% 9% 17%
Brent Crude 71% 10% 9% 12% -8% 73% 74% 69% 73% 17% 0% 23% 9% 8% 1% 7% 16%ULS Diesel 70% 5% 12% 14% -5% 73% 73% 76% 71% 25% 0% 33% 7% 4% -4% 4% 18%
Unleaded Gasoline 79% 6% 4% 8% -12% 82% 84% 67% 83% 20% -5% 28% 9% 3% -3% 2% 14%Corn 22% 6% 5% 6% -3% 19% 18% 19% 18% 4% -4% 9% 4% 4% 5% 1% 6%
Soybeans 23% 7% -4% -2% -9% 21% 21% 20% 21% 0% 1% 2% 0% 10% 8% 7% 12%Wheat 15% 6% -1% -3% 4% 13% 13% 9% 14% 1% -5% 5% -5% 11% 12% 14% 2%
Soybean Oil 31% 15% -3% -2% -5% 26% 26% 24% 25% 4% -2% 8% 3% 17% 11% 11% 16%Soybean Meal 17% 3% -2% -1% -7% 16% 17% 16% 16% 0% 5% -1% -1% 5% 5% 4% 9%HRW Wheat 22% 8% -1% -3% 3% 21% 21% 16% 21% 6% -2% 10% 1% 9% 9% 15% 2%
Copper 42% 9% -13% -11% -11% 43% 43% 40% 43% 8% -1% 10% 9% 4% -3% 9% 11%Alumnium 40% 4% 1% 3% -9% 41% 40% 44% 39% 18% 2% 22% 1% 5% 3% 3% 7%
Zinc 24% 5% -20% -18% -16% 27% 28% 21% 28% 0% -1% 0% 8% 1% 0% 2% 1%Nickel 32% -4% -6% -1% -18% 35% 36% 29% 36% 3% -2% 7% -10% 4% -2% 11% 9%Gold 29% 3% 6% 5% 5% 27% 25% 25% 25% 12% 10% 10% 2% 5% -6% 12% 15%Silver 29% 6% -7% -5% -7% 27% 26% 26% 25% 9% 2% 10% 6% 3% -4% 11% 13%Sugar 17% 8% -7% -6% -6% 17% 15% 12% 15% 11% 4% 13% 13% 0% -4% 7% 11%Coffee 13% 6% 1% 3% -7% 12% 12% 7% 12% 3% 1% 5% 4% 1% 1% -3% 7%Cotton 27% -7% -5% -2% -18% 29% 29% 33% 29% 7% -6% 11% 0% -7% -11% 2% 19%
Live Cattle 20% -7% 19% 23% -10% 19% 17% 10% 17% 15% 10% 12% -17% 8% 8% 8% 1%Lean Hogs 6% -4% 12% 15% -6% 5% 2% 3% 2% 11% 4% 14% -9% 2% -2% 6% 1%
CORRELATION: US CPI Indices vs. BCOM Composites vs. BCOM Singles vs. Benchmarks
20-Year
US CPI Indices
BCO
M C
ompo
sites
BCO
M S
ingl
esUS CPI Indices
5-Year
BCO
M C
ompo
sites
BCO
M S
ingl
esBe
nchm
arks
17

CORRELATION: World CPI vs. BCOM Composites vs. BCOM Singles vs. Benchmarks
US
Chin
a
Japa
n
Ger
man
y
UK
Fran
ce
Indi
a
Braz
il
Italy
Cana
da
Sout
h Ko
rea
Aust
ralia
Mex
ico
Spai
n
Russ
ia
Indo
nesi
a
Turk
ey
Net
herla
nds
Switz
erla
nd
Bloomberg Commodity 65% 73% -14% 58% 76% 55% 35% -44% 42% 67% 73% 82% 29% 67% -39% -14% -42% 44% 88%Energy 69% 43% 13% 58% 64% 40% 47% -69% 27% 36% 40% 75% 58% 43% -72% -8% -4% 49% 81%
Petroleum 76% 59% -8% 81% 81% 69% 59% -81% 58% 45% 60% 69% 56% 66% -82% -25% 0% 65% 74%Agriculture 25% 69% -36% 49% 66% 52% 31% -25% 46% 59% 69% 59% 12% 71% -16% -15% -61% 37% 69%
Grains 16% 55% -53% 52% 60% 54% 41% -26% 55% 39% 59% 39% 17% 77% -18% -28% -58% 47% 51%Industrial Metals 45% 52% 12% 21% 41% 18% 9% -21% 6% 54% 48% 62% 12% 36% -1% 4% -47% 10% 80%Precious Metals 36% 79% -40% 51% 69% 67% 10% -5% 61% 78% 88% 55% -10% 68% -6% -41% -35% 34% 39%
Softs 27% 77% -5% 34% 61% 41% 8% -17% 26% 79% 73% 76% 0% 47% -10% 7% -50% 12% 80%Livestock 25% 23% 54% 13% 28% 11% -8% -48% -5% 46% 26% 59% 40% 1% -38% 13% 8% -10% 68%
Natural Gas 11% -4% 48% -16% 0% -35% -1% -9% -47% 3% -18% 52% 24% -26% -15% 34% -6% -7% 49%WTI Crude 68% 51% 6% 71% 72% 58% 53% -82% 46% 42% 51% 67% 58% 53% -81% -13% 6% 54% 76%
Brent Crude 79% 70% -15% 84% 88% 75% 58% -75% 64% 55% 72% 75% 47% 72% -78% -29% -6% 66% 75%ULS Diesel 79% 77% -24% 87% 92% 79% 56% -68% 69% 61% 79% 78% 41% 78% -72% -30% -14% 69% 76%
Unleaded Gasoline 84% 69% -31% 91% 91% 81% 65% -70% 75% 51% 74% 68% 46% 83% -78% -43% -10% 79% 66%Corn 15% 65% -67% 56% 67% 62% 37% -13% 64% 46% 69% 40% 6% 82% -12% -38% -56% 55% 39%
Soybeans 25% 50% -26% 54% 59% 49% 49% -50% 45% 35% 50% 47% 34% 67% -39% -13% -47% 42% 69%Wheat 1% 19% -43% 17% 24% 18% 28% -7% 22% 8% 22% 11% 11% 51% 8% -10% -63% 23% 33%
Soybean Oil 41% 82% -53% 56% 73% 64% 34% -16% 59% 64% 81% 54% -4% 78% -11% -18% -60% 44% 57%Soybean Meal 14% 13% -8% 30% 26% 24% 34% -48% 25% 9% 17% 18% 40% 43% -31% -8% -34% 21% 51%HRW Wheat 14% 50% -31% 36% 52% 37% 30% -25% 32% 42% 51% 50% 18% 63% -9% -9% -63% 30% 67%
Copper 44% 67% -16% 42% 59% 41% 27% -28% 30% 55% 63% 62% 13% 60% -12% -2% -57% 32% 79%Alumnium 41% 49% 12% 8% 32% 9% -7% -1% -2% 55% 44% 55% -6% 24% 18% 6% -44% 1% 65%
Zinc 32% 5% 48% -13% -3% -23% -12% -13% -33% 19% 1% 34% 16% -8% 8% 12% -18% -16% 56%Nickel 35% 31% 41% 7% 29% 4% 4% -32% -9% 46% 32% 59% 30% 16% -13% 7% -25% -5% 79%Gold 27% 73% -40% 52% 67% 70% 7% -8% 66% 75% 86% 47% -6% 66% -11% -52% -19% 35% 26%Silver 43% 80% -38% 44% 66% 56% 13% -1% 48% 75% 83% 62% -14% 66% 2% -23% -53% 30% 53%Sugar 5% 89% -28% 63% 80% 70% 34% -34% 60% 75% 88% 70% 3% 66% -36% -22% -34% 39% 64%Coffee 26% 50% 29% 8% 36% 17% -24% -10% 0% 77% 52% 68% 7% 17% 0% 9% -27% -16% 71%Cotton 27% 62% -25% 19% 44% 19% 17% 6% 8% 48% 48% 58% -17% 41% 13% 35% -75% 13% 69%
Live Cattle 26% 6% 57% -24% -7% -14% -49% -6% -29% 44% 9% 28% 14% -22% 16% 17% -1% -46% 40%Lean Hogs 16% 29% 32% 40% 48% 29% 32% -67% 17% 30% 30% 62% 48% 20% -70% 2% 14% 25% 66%
S&P 500 Total Return Index 25% -5% 30% 3% 1% -20% 27% -36% -28% -15% -19% 23% 39% -1% -17% 39% -22% 4% 60%Bloomberg US Treasury -39% 23% 11% 4% 11% 11% -16% 6% 13% 33% 24% 20% -7% -6% 0% -27% 2% -14% 4%
Bloomberg USD IG Corporate -15% 12% 11% 22% 16% 26% -4% -30% 27% 24% 23% 15% 22% 7% -25% -36% 15% -7% 7%Bloomberg USD HY Corporate 37% 5% -16% 38% 23% 35% 25% -48% 34% -3% 14% 6% 36% 31% -37% -23% 11% 25% 6%
Bloomberg U.S. Dollar Spot -56% -78% 13% -69% -81% -63% -41% 47% -51% -67% -77% -87% -24% -65% 55% 22% 22% -52% -80%
US
Chin
a
Japa
n
Ger
man
y
UK
Fran
ce
Indi
a
Braz
il
Cana
da
Sout
h Ko
rea
Aust
ralia
Mex
ico
Russ
ia
Turk
ey
Net
herla
nds
Switz
erla
nd
Bloomberg Commodity 78% 48% 1% 51% 14% 68% -34% 31% 64% 20% 34% 13% -6% 8% 17% 65%Energy 74% 34% 6% 44% -1% 62% -42% 40% 64% 18% 37% 23% 5% 23% 33% 66%
Petroleum 79% 43% 4% 53% 12% 70% -37% 32% 63% 15% 34% 16% 1% 12% 26% 68%Agriculture 47% 66% 8% 49% 40% 58% 3% 24% 35% 32% 18% 12% -13% -5% 4% 35%
Grains 42% 66% 5% 51% 35% 57% 0% 25% 29% 24% 19% 13% -6% -4% 10% 29%Industrial Metals 48% 14% -5% 19% 4% 29% -25% -7% 32% -12% 10% -13% -12% -15% -25% 38%Precious Metals 40% 27% -31% 27% 40% 50% 0% -7% 30% 18% 22% -22% -17% -31% -13% 34%
Softs 34% 33% 7% 21% 34% 32% 7% 15% 36% 36% 8% 10% -17% 4% -6% 31%Livestock 37% 36% 20% 28% -3% 26% -34% 26% 34% 0% 16% 13% -10% 10% 3% 18%
Natural Gas 52% 22% 26% 22% -16% 33% -35% 41% 50% 25% 27% 31% 9% 30% 24% 44%WTI Crude 78% 41% 8% 50% 9% 68% -38% 32% 62% 14% 33% 19% 5% 15% 24% 70%
Brent Crude 81% 38% -2% 55% 17% 70% -36% 23% 64% 13% 33% 12% 0% 11% 28% 70%ULS Diesel 80% 47% 2% 56% 16% 73% -37% 33% 67% 15% 38% 11% -6% 4% 25% 67%
Unleaded Gasoline 77% 40% -7% 52% 14% 68% -31% 29% 63% 15% 29% 12% -4% 10% 27% 59%Corn 40% 66% 4% 46% 48% 52% 10% 26% 28% 26% 23% 23% 3% 2% 15% 20%
Soybeans 34% 56% 8% 43% 25% 53% -1% 21% 23% 24% 8% 1% -20% -11% 3% 26%Wheat 38% 58% 1% 44% 17% 49% -14% 24% 26% 5% 25% 10% 2% -8% 6% 31%
Soybean Oil 48% 49% 1% 51% 30% 63% -1% 4% 34% 36% 17% -11% -21% -14% 5% 37%Soybean Meal 21% 46% 1% 36% 12% 41% -15% 23% 18% 1% 17% -2% -21% -15% 6% 20%HRW Wheat 52% 61% 9% 49% 26% 54% -12% 23% 37% 16% 29% 18% 5% -2% 5% 43%
Copper 52% 23% -7% 25% 11% 37% -19% -5% 29% -7% 13% -11% -13% -20% -25% 42%Alumnium 59% 13% 5% 30% 4% 38% -32% -8% 47% -2% 14% -16% -11% -7% -8% 50%
Zinc 21% -3% -1% -6% -7% -5% -14% -13% 5% -23% -11% -6% -11% -10% -39% 7%Nickel 25% -1% -18% -2% -9% 14% -32% 1% 26% -27% 7% -12% -3% -10% -21% 23%Gold 39% 26% -33% 27% 39% 54% -4% -2% 33% 6% 31% -28% -18% -39% -10% 35%Silver 38% 25% -22% 23% 35% 38% 2% -11% 25% 28% 9% -10% -11% -14% -15% 30%Sugar 43% 20% -18% 22% 20% 43% -9% 28% 42% 28% 36% 8% -16% 3% 13% 38%Coffee 18% 23% 42% 11% 24% 3% 4% -8% 16% 24% -33% 11% -15% 8% -31% 15%Cotton 20% 41% -3% 4% 32% 19% 21% 21% 25% 8% 13% 11% 4% -11% -17% 15%
Live Cattle 29% 26% 23% 15% -16% 21% -44% 24% 38% -6% 5% -1% -10% -2% -10% 11%Lean Hogs 34% 37% 10% 33% 9% 27% -19% 25% 23% 4% 24% 19% -14% 14% 14% 18%
BCO
M C
ompo
sites
BCO
M S
ingl
es
CPI by Country
5-Year
CPI by CountryBC
OM
Com
posit
esBC
OM
Sin
gles
Benc
hmar
ks
20-Year
18

CORRELATION: World GDP vs. BCOM Composites vs. BCOM Singles vs. Benchmarks
US
Chin
a
Japa
n
Ger
man
y
UK
Fran
ce
Indi
a
Braz
il
Italy
Cana
da
Sout
h Ko
rea
Aust
ralia
Mex
ico
Spai
n
Russ
ia
Indo
nesi
a
Turk
ey
Net
herla
nds
Switz
erla
nd
Bloomberg Commodity -1% 84% -35% 28% 19% 22% 78% 57% 2% 67% 4% 3% 13% -34% 70% -5% 22% -68% 30%Energy 10% 37% -11% 5% 27% -7% 37% 57% -25% 49% 1% 0% -12% -33% 56% -6% -17% -60% 42%
Petroleum 13% 55% -28% 5% 24% -9% 60% 70% -39% 51% -11% 5% 8% -62% 77% -6% -14% -86% 35%Agriculture -18% 86% -45% 33% 15% 35% 81% 55% 12% 63% 13% 0% 13% -34% 65% -4% 37% -63% 22%
Grains -27% 74% -42% 18% 13% 34% 69% 58% -1% 52% 8% -4% 4% -48% 60% 0% 30% -63% 18%Industrial Metals 2% 72% -31% 35% 10% 29% 59% 25% 41% 50% -1% -12% 19% 6% 30% -10% 38% -31% 20%Precious Metals 3% 85% -27% 21% -4% 22% 81% 30% -10% 42% -12% 19% 40% -43% 62% -1% 29% -56% -2%
Softs 0% 88% -40% 50% 15% 31% 82% 38% 28% 63% 15% 8% 27% -8% 59% -8% 41% -49% 22%Livestock 13% 24% -21% 25% 23% -2% 22% 17% 10% 38% -7% -13% 11% 18% 21% -17% -2% -17% 34%
Natural Gas 6% -16% 27% 8% 16% 2% -24% 1% 15% 19% 27% -5% -39% 39% -8% -4% -9% 19% 29%WTI Crude 15% 47% -25% 9% 26% -11% 53% 66% -30% 47% -10% 4% 6% -49% 68% -9% -15% -78% 38%
Brent Crude 13% 65% -27% 7% 19% -6% 69% 67% -40% 55% -11% 10% 16% -65% 82% -6% -10% -88% 29%ULS Diesel 11% 74% -29% 11% 20% -1% 77% 66% -38% 59% -9% 12% 19% -66% 86% -4% -5% -89% 28%
Unleaded Gasoline 9% 65% -27% -3% 17% -5% 68% 70% -50% 52% -15% 8% 14% -77% 84% -1% -12% -91% 26%Corn -24% 78% -33% 18% 6% 36% 74% 55% -10% 45% 4% 8% 7% -55% 63% 2% 29% -63% 13%
Soybeans -23% 65% -44% 16% 23% 20% 64% 61% 0% 59% 11% -11% 7% -42% 62% -1% 21% -66% 21%Wheat -34% 52% -48% 17% 16% 41% 43% 44% 24% 42% 15% -24% -14% -22% 26% -3% 37% -36% 23%
Soybean Oil -9% 95% -43% 37% 9% 34% 91% 50% 9% 60% 12% 11% 26% -42% 72% -1% 44% -67% 13%Soybean Meal -31% 32% -42% 3% 20% 12% 31% 45% 5% 41% 4% -28% 1% -26% 31% -2% 14% -40% 16%HRW Wheat -22% 76% -48% 30% 20% 42% 68% 53% 22% 58% 13% -13% -2% -25% 49% -8% 38% -54% 29%
Copper -1% 87% -43% 37% 13% 28% 78% 40% 30% 63% 6% -8% 25% -18% 52% -7% 44% -53% 21%Alumnium 6% 65% -17% 34% -3% 32% 52% 10% 46% 32% -4% 1% 17% 17% 16% -10% 35% -14% 12%
Zinc 8% 12% -2% 7% -4% 2% -3% -10% 44% 12% -21% -29% 3% 42% -24% 2% 6% 20% 9%Nickel 2% 50% -30% 29% 21% 29% 40% 24% 35% 43% -1% -22% 7% 15% 21% -17% 28% -26% 25%Gold 4% 77% -22% 15% -8% 17% 74% 27% -23% 32% -20% 22% 41% -49% 60% -2% 25% -55% -6%Silver 2% 92% -33% 30% 2% 28% 85% 31% 9% 53% 0% 13% 35% -31% 61% 0% 35% -53% 4%Sugar 6% 90% -34% 28% 2% 12% 91% 52% -9% 57% 5% 26% 37% -48% 84% 0% 25% -76% 12%Coffee 3% 60% -27% 43% 7% 25% 52% 15% 33% 42% 0% 0% 20% 20% 28% -9% 25% -18% 20%Cotton -8% 82% -42% 59% 31% 45% 75% 34% 51% 71% 42% -4% 10% 7% 48% -5% 55% -37% 26%
Live Cattle 7% 11% -16% 33% 0% 13% 2% -22% 43% 4% -21% -18% 12% 54% -27% -12% 15% 29% 14%Lean Hogs 11% 25% -16% 6% 31% -13% 29% 44% -24% 48% 6% -4% 4% -22% 52% -16% -15% -50% 36%
S&P 500 Total Return Index -6% -2% -9% 18% 30% 10% -5% 25% 40% 16% 16% -24% -36% 24% -9% 2% -7% -5% 33%Bloomberg US Treasury 1% 6% 31% -27% -51% -19% 10% -5% -23% -21% -21% 55% 16% -8% 18% 8% -23% 0% -17%
Bloomberg USD IG Corporate -7% 7% 7% -24% -29% -14% 14% 17% -34% -22% -27% 39% 2% -37% 24% -5% -37% -30% -14%Bloomberg USD HY Corporate 9% 24% -41% 7% 18% 11% 29% 34% -19% 18% -17% -14% -22% -43% 28% -23% 10% -54% 16%
Bloomberg U.S. Dollar Spot -16% -75% 25% -9% -11% 4% -74% -55% 22% -63% -2% -17% -21% 49% -80% -1% 4% 74% -24%
US
Chin
a
Japa
n
Ger
man
y
UK
Fran
ce
Cana
da
Sout
h Ko
rea
Aust
ralia
Mex
ico
Spai
n
Switz
erla
nd
Bloomberg Commodity 40% 45% 16% 31% 35% 33% 50% 4% 2% 40% 37% 35%Energy 35% 11% 9% 11% 24% 20% 35% 3% -5% 23% 36% 18%
Petroleum 36% 23% 10% 15% 25% 20% 41% 6% -3% 27% 28% 26%Agriculture 11% 51% 5% 21% 20% 15% 35% -12% 3% 33% 2% 14%
Grains 6% 44% 3% 13% 15% 10% 28% -9% 5% 26% -3% 7%Industrial Metals 45% 65% 29% 51% 40% 50% 49% 14% 7% 46% 45% 60%Precious Metals 9% 64% 1% 23% 9% 15% 30% 5% 2% 21% -7% 21%
Softs 17% 35% 3% 29% 21% 19% 33% -11% -2% 35% 8% 21%Livestock 44% 12% 22% 27% 32% 28% 21% 6% 12% 32% 35% 34%
Natural Gas 27% -9% 5% 2% 13% 16% 15% -13% -9% 12% 40% 4%WTI Crude 36% 22% 10% 15% 24% 20% 40% 8% -2% 26% 32% 25%
Brent Crude 36% 27% 9% 18% 25% 22% 46% 10% -1% 28% 26% 31%ULS Diesel 32% 24% 8% 13% 21% 14% 38% 2% -8% 24% 22% 23%
Unleaded Gasoline 38% 24% 13% 20% 30% 26% 48% 3% -5% 34% 22% 29%Corn 1% 30% -1% 7% 3% 4% 14% -14% 5% 20% -14% -4%
Soybeans 8% 39% 3% 8% 17% 9% 34% -10% 5% 27% -3% 9%Wheat 6% 51% 8% 22% 24% 13% 27% 1% 1% 20% 12% 15%
Soybean Oil 11% 59% 0% 13% 17% 13% 30% -13% 10% 19% 10% 13%Soybean Meal -4% 23% 3% 7% 9% 5% 28% -2% -7% 23% -10% 10%HRW Wheat 11% 54% 7% 25% 25% 15% 30% -1% -1% 27% 16% 17%
Copper 40% 67% 24% 46% 35% 42% 47% 12% 3% 46% 35% 54%Alumnium 44% 49% 20% 44% 32% 46% 41% 5% 6% 36% 50% 53%
Zinc 45% 50% 36% 55% 38% 52% 39% 11% 5% 50% 43% 60%Nickel 44% 53% 31% 46% 46% 50% 51% 27% 11% 39% 46% 55%Gold 0% 63% 1% 15% 3% 1% 22% 11% -3% 12% -15% 12%Silver 22% 58% 1% 33% 18% 35% 39% -4% 8% 33% 8% 32%Sugar 9% 26% 1% 15% 10% 3% 17% -10% -15% 20% 0% 8%Coffee 21% 21% 2% 20% 8% 22% 25% -13% 9% 32% 14% 31%Cotton 17% 29% 12% 31% 27% 23% 36% 5% -3% 34% 4% 22%
Live Cattle 44% 16% 19% 28% 30% 34% 25% 7% 15% 32% 41% 37%Lean Hogs 32% 8% 20% 19% 27% 15% 11% 3% 6% 24% 18% 24%
20-Year
BCO
M C
ompo
sites
BCO
M S
ingl
es
GDP by Country
5-Year
GDP by CountryBC
OM
Com
posit
esBC
OM
Sin
gles
Benc
hmar
ks
19

COMMITMENT OF TRADERS REPORT: Commodity Futures & Options, Money ManagersCOT <GO>
Group Commodity End of Dec 2015 Net Position (Lots)
End of Nov 2015 Net Position
(Lots)
Notional Change ($mill, with end
of Dec 2015 price)
End of Dec 2015 Notional ($ mill)
Natural Gas -180,875 -178,169 -63 -4,243 WTI Crude 86,923 96,521 -353 3,195
Brent Crude 163,672 177,945 -532 6,097 ULS Diesel -39,172 -45,372 294 -1,858 Gasoline 21,385 15,189 336 1,160
Total -318 4,350 Corn -82,543 -99,808 303 -1,451
Soybeans -31,681 -52,925 918 -1,369 Wheat -67,167 -47,353 -454 -1,539
Soybean Oil 65,283 21,535 786 1,172 Soybean Meal -34,185 -24,266 -261 -900 HRW Wheat -15,048 -24,115 206 -342
Total 1,498 -4,428 Copper -28,607 -29,917 68 -1,488
Aluminum 70,620 72,635 -76 2,658 Zinc 13,207 9,369 154 528
Nickel 10,786 8,214 136 569 Total 281 2,267 Gold -14,902 -14,655 -27 -1,602 Silver 9,339 8,862 33 647 Total 7 -954 Sugar 174,621 176,022 -23 2,928 Coffee -16,734 -19,565 132 -778 Cotton 53,026 30,192 715 1,660 Total 823 3,810
Live Cattle 10,735 5,622 279 586Lean Hogs 9,432 11,034 -38 224
Total 241 810Total 2,532 5,856
Historical Correlation
1-Year 5-Year 1-Year 5-Year 1-Year 5-Year Natural Gas 11% 24% -44% -35% 46% 45% WTI Crude 4% 33% -56% -47% 51% 52%
Brent Crude 7% 34% -38% -36% 32% 42% ULS Diesel 6% 30% -52% -35% 50% 45% Gasoline 26% 34% -45% -18% 49% 40%
Corn 45% 58% -34% -49% 54% 65% Soybeans 60% 67% -78% -57% 77% 72%
Wheat 61% 51% -68% -61% 69% 66% Soybean Oil 43% 52% -70% -61% 76% 67%
Soybean Meal 60% 53% -55% -43% 69% 60% HRW Wheat 6% 24% -42% 47% 52%
Copper 42% 49% -66% -54% 63% 58% Aluminum -11% -25% 29%
Zinc 16% -36% 51% Nickel 30% -31% 62% Gold 68% 61% -61% -53% 70% 65% Silver 46% 56% -57% -47% 61% 60% Sugar 49% 47% -82% -60% 83% 64% Coffee 64% 45% -75% -65% 83% 67% Cotton 66% 56% -49% -50% 70% 61%
Live Cattle 4% 19% -11% -5% 10% 15%Lean Hogs 3% 16% -9% -13% 0% 12%
Livestock
Energy
Grains
Industrial Metals
Precious Metals
Softs
Grains
Industrial Metals
Precious Metals
Softs
Livestock
CommodityBCOM Single Index Level vs. MM's
Long PositionBCOM Single Index Level vs. MM's
Short PositionBCOM Single Index Level vs.
MM's Net Position
Energy
Group
20

Gasoline Corn
COMMITMENT OF TRADERS REPORT: Historical Money Manager's Net Position vs. BCOM Index LevelNatural Gas WTI Crude
Brent Crude ULS Diesel
Soybeans Wheat
Soybean Oil Soybean Meal
HRW Wheat
0
20
40
60
80
100
-300000
-200000
-100000
0
100000
200000
06 07 08 09 10 11 12 13 14 15
Money Manager's Net Position Index Level
0
500
1000
1500
2000
2500
050000
100000150000200000250000300000
06 07 08 09 10 11 12 13 14 15
Money Manager's Net Position Index Level
0
500
1000
1500
2000
0
100000
200000
300000
400000
06 07 08 09 10 11 12 13 14 15
Money Manager's Net Position Index Level
0
200
400
600
800
1000
-60000-40000-20000
0200004000060000
06 07 08 09 10 11 12 13 14 15
Money Manager's Net Position Index Level
0
500
1000
1500
-200000
20000400006000080000
100000
06 07 08 09 10 11 12 13 14 15
Money Manager's Net Position Index Level
0
20
40
60
80
-400000
-200000
0
200000
400000
600000
06 07 08 09 10 11 12 13 14 15
Money Manager's Net Position Index Level
0
200
400
600
800
-200000
-100000
0
100000
200000
300000
06 07 08 09 10 11 12 13 14 15
Money Manager's Net Position Index Level
0
50
100
150
-150000
-100000
-50000
0
50000
100000
06 07 08 09 10 11 12 13 14 15
Money Manager's Net Position Index Level
050100150200250300
-100000
-50000
0
50000
100000
06 07 08 09 10 11 12 13 14 15
Money Manager's Net Position Index Level
0
500
1000
1500
2000
-100000
-50000
0
50000
100000
150000
06 07 08 09 10 11 12 13 14 15
Money Manager's Net Position Index Level
0
100
200
300
400
500
-40000-20000
020000400006000080000
06 07 08 09 10 11 12 13 14 15
Money Manager's Net Position Index Level
21
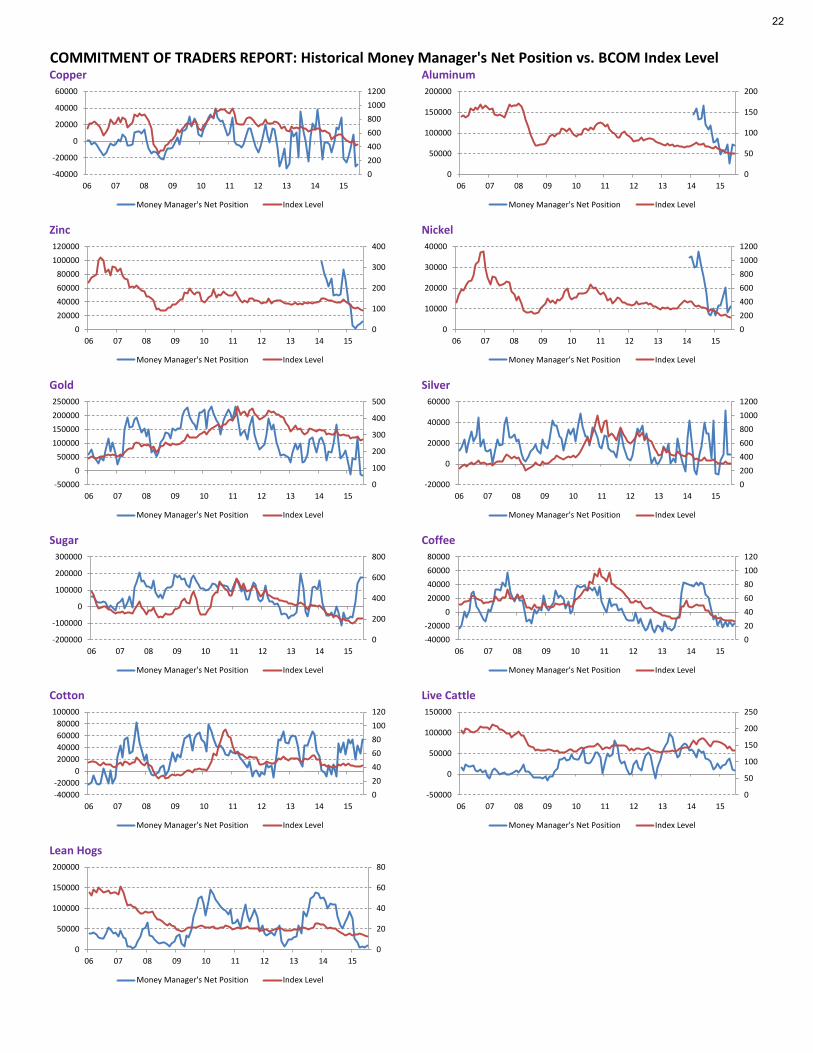
COMMITMENT OF TRADERS REPORT: Historical Money Manager's Net Position vs. BCOM Index LevelCopper Aluminum
Zinc Nickel
Gold Silver
Sugar Coffee
Cotton Live Cattle
Lean Hogs
020040060080010001200
-40000
-20000
0
20000
40000
60000
06 07 08 09 10 11 12 13 14 15
Money Manager's Net Position Index Level
0
50
100
150
200
0
50000
100000
150000
200000
06 07 08 09 10 11 12 13 14 15
Money Manager's Net Position Index Level
0
100
200
300
400
020000400006000080000
100000120000
06 07 08 09 10 11 12 13 14 15
Money Manager's Net Position Index Level
020040060080010001200
0
10000
20000
30000
40000
06 07 08 09 10 11 12 13 14 15
Money Manager's Net Position Index Level
0
100
200
300
400
500
-500000
50000100000150000200000250000
06 07 08 09 10 11 12 13 14 15
Money Manager's Net Position Index Level
020040060080010001200
-20000
0
20000
40000
60000
06 07 08 09 10 11 12 13 14 15
Money Manager's Net Position Index Level
0
200
400
600
800
-200000
-100000
0
100000
200000
300000
06 07 08 09 10 11 12 13 14 15
Money Manager's Net Position Index Level
020406080100120
-40000-20000
020000400006000080000
06 07 08 09 10 11 12 13 14 15
Money Manager's Net Position Index Level
020406080100120
-40000-20000
020000400006000080000
100000
06 07 08 09 10 11 12 13 14 15
Money Manager's Net Position Index Level
0
50
100
150
200
250
-50000
0
50000
100000
150000
06 07 08 09 10 11 12 13 14 15
Money Manager's Net Position Index Level
0
20
40
60
80
0
50000
100000
150000
200000
06 07 08 09 10 11 12 13 14 15
Money Manager's Net Position Index Level
22
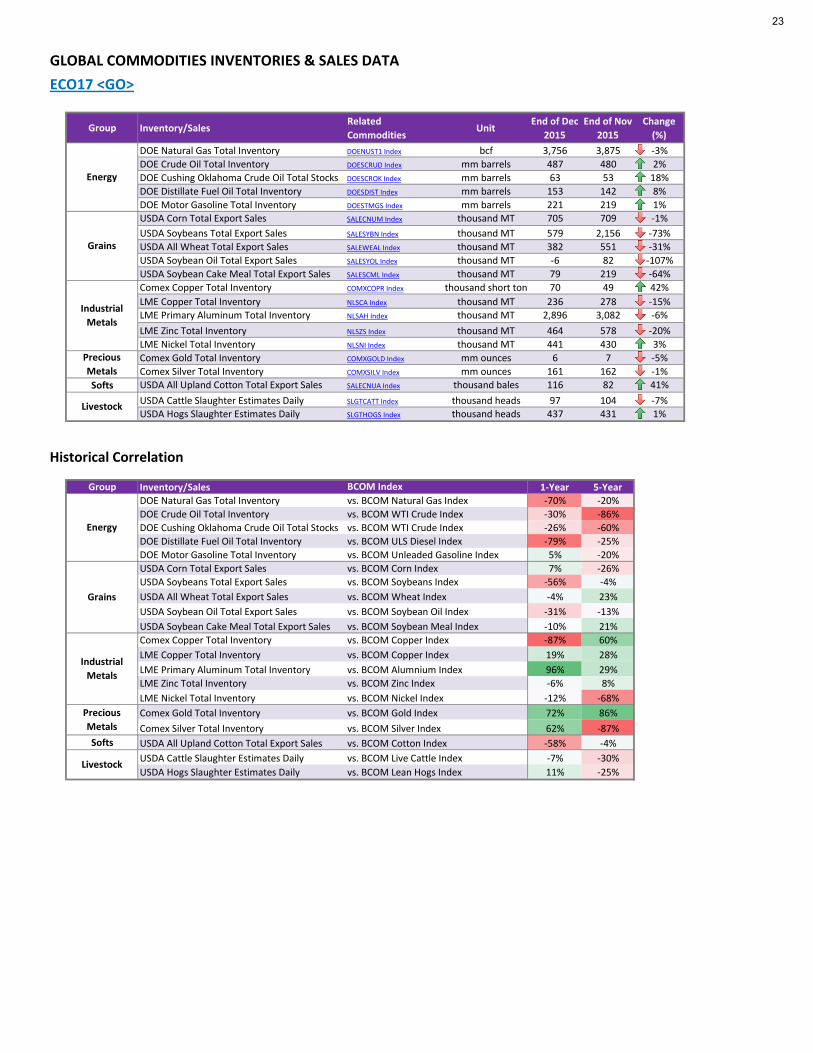
GLOBAL COMMODITIES INVENTORIES & SALES DATAECO17 <GO>
Group Inventory/SalesRelated Commodities
UnitEnd of Dec
2015End of Nov
2015Change
(%)DOE Natural Gas Total Inventory DOENUST1 Index bcf 3,756 3,875 -3%DOE Crude Oil Total Inventory DOESCRUD Index mm barrels 487 480 2%DOE Cushing Oklahoma Crude Oil Total Stocks DOESCROK Index mm barrels 63 53 18%DOE Distillate Fuel Oil Total Inventory DOESDIST Index mm barrels 153 142 8%DOE Motor Gasoline Total Inventory DOESTMGS Index mm barrels 221 219 1%USDA Corn Total Export Sales SALECNUM Index thousand MT 705 709 -1%USDA Soybeans Total Export Sales SALESYBN Index thousand MT 579 2,156 -73%USDA All Wheat Total Export Sales SALEWEAL Index thousand MT 382 551 -31%USDA Soybean Oil Total Export Sales SALESYOL Index thousand MT -6 82 -107%USDA Soybean Cake Meal Total Export Sales SALESCML Index thousand MT 79 219 -64%Comex Copper Total Inventory COMXCOPR Index thousand short ton 70 49 42%LME Copper Total Inventory NLSCA Index thousand MT 236 278 -15%LME Primary Aluminum Total Inventory NLSAH Index thousand MT 2,896 3,082 -6%LME Zinc Total Inventory NLSZS Index thousand MT 464 578 -20%LME Nickel Total Inventory NLSNI Index thousand MT 441 430 3%Comex Gold Total Inventory COMXGOLD Index mm ounces 6 7 -5%Comex Silver Total Inventory COMXSILV Index mm ounces 161 162 -1%
Softs USDA All Upland Cotton Total Export Sales SALECNUA Index thousand bales 116 82 41%USDA Cattle Slaughter Estimates Daily SLGTCATT Index thousand heads 97 104 -7%USDA Hogs Slaughter Estimates Daily SLGTHOGS Index thousand heads 437 431 1%
Historical Correlation
Group Inventory/Sales 1-Year 5-YearDOE Natural Gas Total Inventory -70% -20%DOE Crude Oil Total Inventory -30% -86%DOE Cushing Oklahoma Crude Oil Total Stocks -26% -60%DOE Distillate Fuel Oil Total Inventory -79% -25%DOE Motor Gasoline Total Inventory 5% -20%USDA Corn Total Export Sales 7% -26%USDA Soybeans Total Export Sales -56% -4%USDA All Wheat Total Export Sales -4% 23%USDA Soybean Oil Total Export Sales -31% -13%USDA Soybean Cake Meal Total Export Sales -10% 21%Comex Copper Total Inventory -87% 60%LME Copper Total Inventory 19% 28%LME Primary Aluminum Total Inventory 96% 29%LME Zinc Total Inventory -6% 8%LME Nickel Total Inventory -12% -68%Comex Gold Total Inventory 72% 86%Comex Silver Total Inventory 62% -87%
Softs USDA All Upland Cotton Total Export Sales -58% -4%USDA Cattle Slaughter Estimates Daily -7% -30%USDA Hogs Slaughter Estimates Daily 11% -25%
BCOM Index
vs. BCOM WTI Crude Indexvs. BCOM WTI Crude Indexvs. BCOM ULS Diesel Index
vs. BCOM Silver Indexvs. BCOM Gold Index
vs. BCOM Cotton Indexvs. BCOM Live Cattle Indexvs. BCOM Lean Hogs Index
vs. BCOM Natural Gas Index
vs. BCOM Unleaded Gasoline Index
vs. BCOM Copper Indexvs. BCOM Copper Indexvs. BCOM Alumnium Indexvs. BCOM Zinc Indexvs. BCOM Nickel Index
vs. BCOM Corn Indexvs. BCOM Soybeans Indexvs. BCOM Wheat Indexvs. BCOM Soybean Oil Indexvs. BCOM Soybean Meal Index
Livestock
Livestock
Energy
Grains
Industrial Metals
Precious Metals
Energy
Grains
Industrial Metals
Precious Metals
23
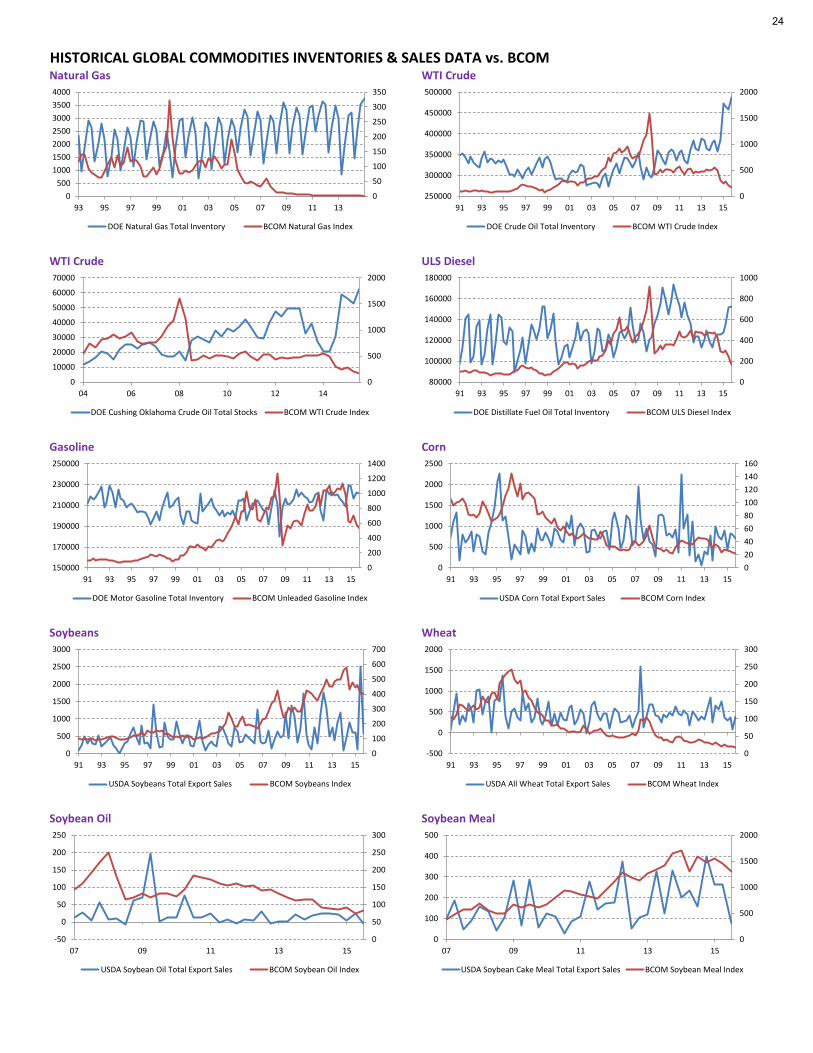
Soybeans Wheat
Soybean Oil Soybean Meal
HISTORICAL GLOBAL COMMODITIES INVENTORIES & SALES DATA vs. BCOMNatural Gas WTI Crude
WTI Crude ULS Diesel
Gasoline Corn
0
50
100
150
200
250
300
350
0500
1000150020002500300035004000
93 95 97 99 01 03 05 07 09 11 13
DOE Natural Gas Total Inventory BCOM Natural Gas Index
0
500
1000
1500
2000
250000
300000
350000
400000
450000
500000
91 93 95 97 99 01 03 05 07 09 11 13 15
DOE Crude Oil Total Inventory BCOM WTI Crude Index
0
500
1000
1500
2000
0
10000
20000
30000
40000
50000
60000
70000
04 06 08 10 12 14
DOE Cushing Oklahoma Crude Oil Total Stocks BCOM WTI Crude Index
0
200
400
600
800
1000
80000
100000
120000
140000
160000
180000
91 93 95 97 99 01 03 05 07 09 11 13 15
DOE Distillate Fuel Oil Total Inventory BCOM ULS Diesel Index
0
200
400
600
800
1000
1200
1400
150000
170000
190000
210000
230000
250000
91 93 95 97 99 01 03 05 07 09 11 13 15
DOE Motor Gasoline Total Inventory BCOM Unleaded Gasoline Index
020406080100120140160
0
500
1000
1500
2000
2500
91 93 95 97 99 01 03 05 07 09 11 13 15
USDA Corn Total Export Sales BCOM Corn Index
0
100
200
300
400
500
600
700
0
500
1000
1500
2000
2500
3000
91 93 95 97 99 01 03 05 07 09 11 13 15
USDA Soybeans Total Export Sales BCOM Soybeans Index
0
50
100
150
200
250
300
-500
0
500
1000
1500
2000
91 93 95 97 99 01 03 05 07 09 11 13 15
USDA All Wheat Total Export Sales BCOM Wheat Index
0
50
100
150
200
250
300
-50
0
50
100
150
200
250
07 09 11 13 15
USDA Soybean Oil Total Export Sales BCOM Soybean Oil Index
0
500
1000
1500
2000
0
100
200
300
400
500
07 09 11 13 15
USDA Soybean Cake Meal Total Export Sales BCOM Soybean Meal Index
24
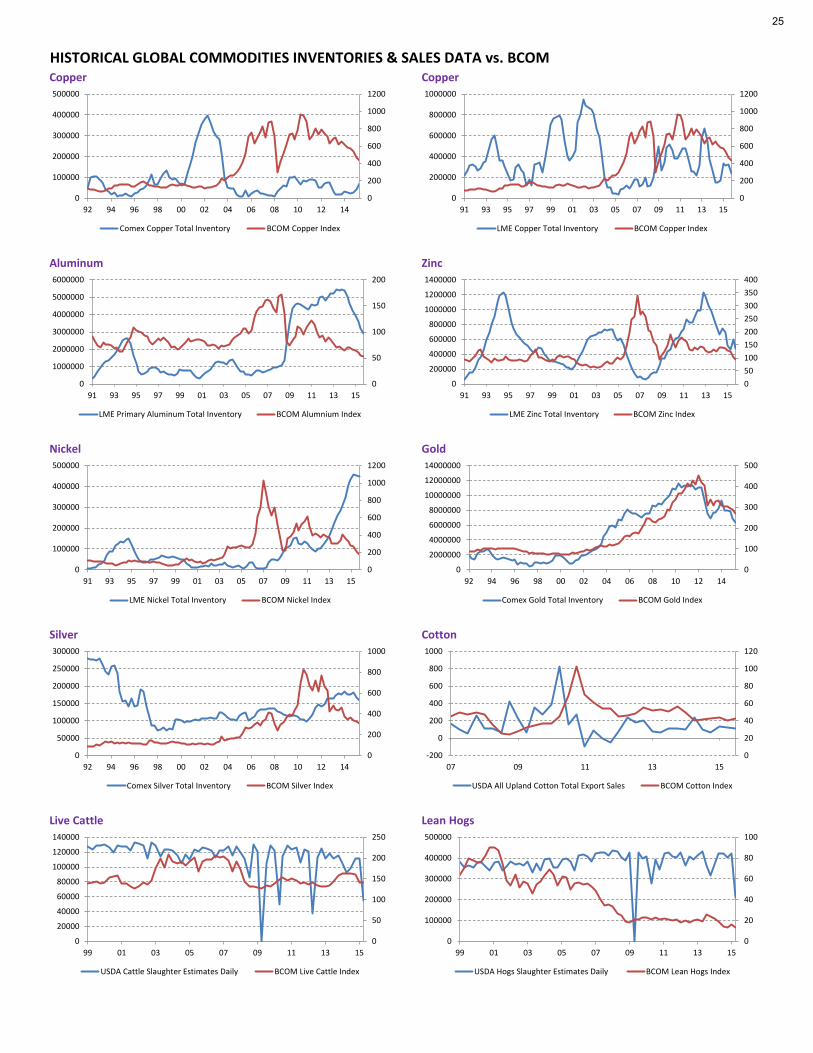
Silver Cotton
Live Cattle Lean Hogs
HISTORICAL GLOBAL COMMODITIES INVENTORIES & SALES DATA vs. BCOMCopper Copper
Aluminum Zinc
Nickel Gold
0
200
400
600
800
1000
1200
0
100000
200000
300000
400000
500000
92 94 96 98 00 02 04 06 08 10 12 14
Comex Copper Total Inventory BCOM Copper Index
0
200
400
600
800
1000
1200
0
200000
400000
600000
800000
1000000
91 93 95 97 99 01 03 05 07 09 11 13 15
LME Copper Total Inventory BCOM Copper Index
0
50
100
150
200
0
1000000
2000000
3000000
4000000
5000000
6000000
91 93 95 97 99 01 03 05 07 09 11 13 15
LME Primary Aluminum Total Inventory BCOM Alumnium Index
050100150200250300350400
0
200000
400000
600000
800000
1000000
1200000
1400000
91 93 95 97 99 01 03 05 07 09 11 13 15
LME Zinc Total Inventory BCOM Zinc Index
0
200
400
600
800
1000
1200
0
100000
200000
300000
400000
500000
91 93 95 97 99 01 03 05 07 09 11 13 15
LME Nickel Total Inventory BCOM Nickel Index
0
100
200
300
400
500
0
2000000
4000000
6000000
8000000
10000000
12000000
14000000
92 94 96 98 00 02 04 06 08 10 12 14
Comex Gold Total Inventory BCOM Gold Index
0
200
400
600
800
1000
0
50000
100000
150000
200000
250000
300000
92 94 96 98 00 02 04 06 08 10 12 14
Comex Silver Total Inventory BCOM Silver Index
0
20
40
60
80
100
120
-200
0
200
400
600
800
1000
07 09 11 13 15
USDA All Upland Cotton Total Export Sales BCOM Cotton Index
0
50
100
150
200
250
0
20000
40000
60000
80000
100000
120000
140000
99 01 03 05 07 09 11 13 15
USDA Cattle Slaughter Estimates Daily BCOM Live Cattle Index
0
20
40
60
80
100
0
100000
200000
300000
400000
500000
99 01 03 05 07 09 11 13 15
USDA Hogs Slaughter Estimates Daily BCOM Lean Hogs Index
25

COMMODITY FUND FLOWS FOR US-LISTED ETPsXLTP XETFM <GO>
Report Period: 11/30/2015 - 12/31/2015
Net Flows ($ mill)
Beginning Fund Market Cap
($ mill)
% of Funds Market Cap
104.13 5,979.09 1.7%945.38 8,303.42 11.4%-127.68 1,443.72 -8.8%
0.23 23.50 1.0%-24.68 213.87 -11.5%
-684.13 35,221.24 -1.9%213.25 51,184.84 0.4%
All Commodities Sector: Top 10 Creations
Ticker Name Net Flows ($ mill)
Beginning Fund Market Cap
($ mill)
% of Funds Market Cap
UWTI US VelocityShares 3x Long Crude ETN 352.35 1,062.16 33.2%USO US United States Oil Fund LP 291.31 3,303.11 8.8%PDBC US PowerShares DB Optimum Yield Diversified Commodity 205.45 6.71 3063.7%UCO US ProShares Ultra Bloomberg Crude Oil 185.57 884.63 21.0%OIL US iPath Goldman Sachs Crude Oil Total Return Index ETN 127.46 829.44 15.4%DJP US iPath Bloomberg Commodity Index Total Return ETN 77.93 966.26 8.1%
DGAZ US VelocityShares 3x Inverse Natural Gas ETN 30.13 61.35 49.1%GLTR US ETFS Physical Precious Metal Basket Shares 23.83 138.73 17.2%GSG US iShares S&P GSCI Commodity Indexed Trust 17.22 714.29 2.4%UNG US United States Natural Gas Fund LP 17.02 511.86 3.3%
All Commodities Sector: Top 10 Redemptions
Ticker Name Net Flows ($ mill)
Beginning Fund Market Cap
($ mill)
% of Funds Market Cap
GLD US SPDR Gold Shares -415.48 22,264.90 -1.9%IAU US iShares Gold Trust -237.09 5,427.84 -4.4%DBC US PowerShares DB Commodity Index Tracking Fund -151.66 2,284.80 -6.6%DBA US PowerShares DB Agriculture Fund -110.08 782.04 -14.1%SCO US ProShares UltraShort Bloomberg Crude Oil -63.13 121.38 -52.0%
SGOL US ETFS Physical Swiss Gold Shares -31.18 790.02 -3.9%DBB US PowerShares DB Base Metals Fund -25.56 135.71 -18.8%
DWTI US VelocityShares 3x Inverse Crude ETN -21.01 163.83 -12.8%USCI US United States Commodity Index Fund -18.17 538.78 -3.4%ZSL US ProShares UltraShort Silver -15.42 70.09 -22.0%
Sector
LivestockIndustrial MetalsPrecious Metals
Total
Broad BasedEnergy
Agriculture
26

COMMODITY FUTURES TERM STRUCTUREENERGY GROUP
GRAINS GROUP
1.5
2.5
3.5
4.5
5.5
JAN
16
OCT
16
JUL
17AP
R 18
JAN
19
OCT
19
JUL
20AP
R 21
JAN
22
OCT
22
JUL
23AP
R 24
JAN
25
OCT
25
JUL
26AP
R 27
JAN
28
Natural Gas
30-Nov-2015
31-Dec-20150
10203040506070
JAN
16
MAY
16
SEP
16JA
N 1
7M
AY 1
7SE
P 17
JAN
18
MAY
18
SEP
18JA
N 1
9M
AY 1
9SE
P 19
JAN
20
MAY
20
SEP
20JA
N 2
1M
AY 2
1
WTI Crude
30-Nov-2015
31-Dec-2015
3035404550556065
JAN
16
JUN
16
NO
V 16
APR
17SE
P 17
FEB
18JU
L 18
DEC
18M
AY 1
9O
CT 1
9M
AR 2
0AU
G 20
JAN
21
JUN
21
NO
V 21
APR
22SE
P 22
Brent Crude
30-Nov-2015
31-Dec-20150
50
100
150
200
DEC
15
MAR
16
JUN
16
SEP
16
DEC
16
MAR
17
JUN
17
SEP
17
DEC
17
MAR
18
JUN
18
SEP
18
DEC
18
#N/A
ULS Diesel
30-Nov-2015
31-Dec-2015
100
120
140
160
180
200
DEC
15FE
B 16
APR
16JU
N 1
6AU
G 16
OCT
16
DEC
16FE
B 17
APR
17JU
N 1
7AU
G 17
OCT
17
DEC
17FE
B 18
APR
18JU
N 1
8AU
G 18
OCT
18
Unleaded Gasoline
30-Nov-2015
31-Dec-2015
240250260270280290300310
DEC
15
MAR
16
JUL
16
SEP
16
DEC
16
MAR
17
JUL
17
SEP
17
DEC
17
OCT
18
#N/A
Soybean Meal
30-Nov-2015
31-Dec-2015450470490510530550570590
DEC
15
MAR
16
MAY
16
JUL
16
SEP
16
DEC
16
MAR
17
MAY
17
JUL
17
SEP
17
DEC
17
HRW Wheat
30-Nov-2015
31-Dec-2015
350
370
390
410
430
450
DEC
15
MAR
16
MAY
16
JUL
16
SEP
16
DEC
16
MAR
17
MAY
17
JUL
17
SEP
17
DEC
17
JUL
18
DEC
18
Corn
30-Nov-2015
31-Dec-2015850
900
950
1000
JAN
16
MAR
16
MAY
16
JUL
16AU
G 16
SEP
16N
OV
16JA
N 1
7M
AR 1
7M
AY 1
7JU
L 17
AUG
17SE
P 17
NO
V 17
JAN
18
MAR
18
MAY
18
Soybeans
30-Nov-2015
31-Dec-2015
450
500
550
600
DEC
15
MAR
16
MAY
16
JUL
16
SEP
16
DEC
16
MAR
17
MAY
17
JUL
17
SEP
17
DEC
17
Wheat
30-Nov-2015
31-Dec-201527282930313233
DEC
15
MAR
16
JUL
16
SEP
16
DEC
16
MAR
17
JUL
17
SEP
17
DEC
17
OCT
18
#N/A
Soybean Oil
30-Nov-2015
31-Dec-2015
27
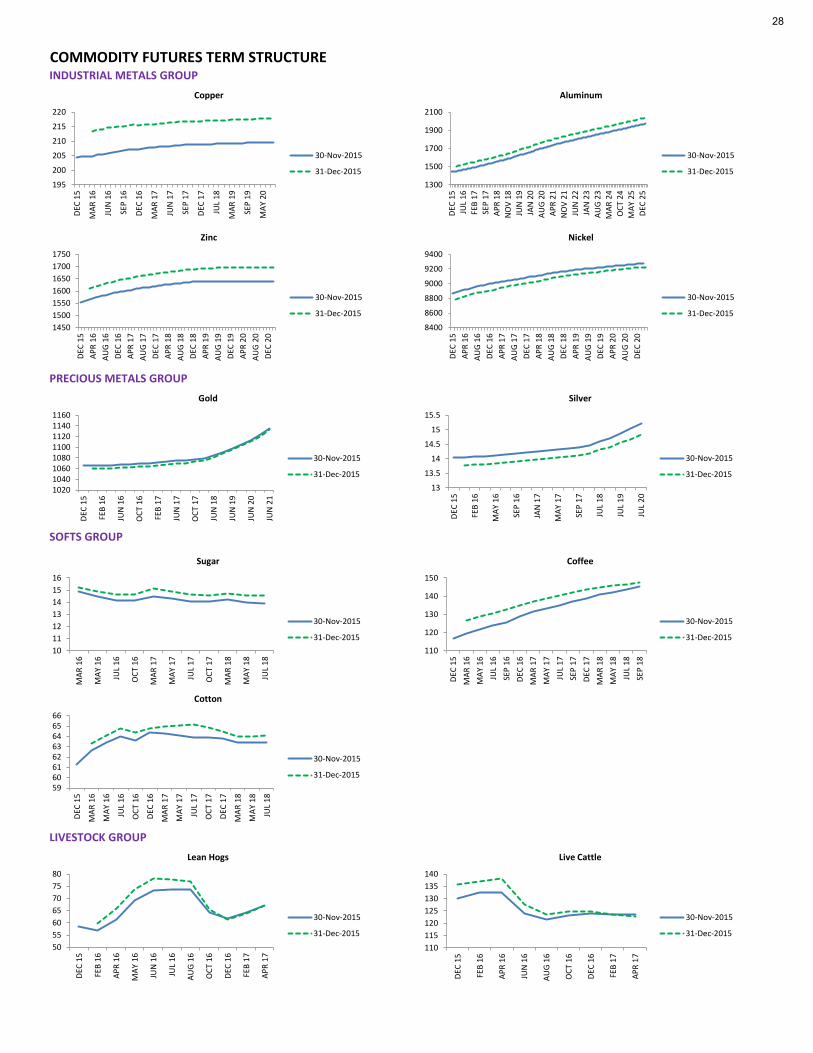
COMMODITY FUTURES TERM STRUCTUREINDUSTRIAL METALS GROUP
PRECIOUS METALS GROUP
SOFTS GROUP
LIVESTOCK GROUP
195
200
205
210
215
220
DEC
15
MAR
16
JUN
16
SEP
16
DEC
16
MAR
17
JUN
17
SEP
17
DEC
17
JUL
18
MAR
19
SEP
19
MAY
20
Copper
30-Nov-2015
31-Dec-20151300
1500
1700
1900
2100
DEC
15JU
L 16
FEB
17SE
P 17
APR
18N
OV
18JU
N 1
9JA
N 2
0AU
G 20
APR
21N
OV
21JU
N 2
2JA
N 2
3AU
G 23
MAR
24
OCT
24
MAY
25
DEC
25
Aluminum
30-Nov-2015
31-Dec-2015
10201040106010801100112011401160
DEC
15
FEB
16
JUN
16
OCT
16
FEB
17
JUN
17
OCT
17
JUN
18
JUN
19
JUN
20
JUN
21
Gold
30-Nov-2015
31-Dec-201513
13.5
14
14.5
15
15.5
DEC
15
FEB
16
MAY
16
SEP
16
JAN
17
MAY
17
SEP
17
JUL
18
JUL
19
JUL
20
Silver
30-Nov-2015
31-Dec-2015
10111213141516
MAR
16
MAY
16
JUL
16
OCT
16
MAR
17
MAY
17
JUL
17
OCT
17
MAR
18
MAY
18
JUL
18
Sugar
30-Nov-2015
31-Dec-2015110
120
130
140
150
DEC
15M
AR 1
6M
AY 1
6JU
L 16
SEP
16DE
C 16
MAR
17
MAY
17
JUL
17SE
P 17
DEC
17M
AR 1
8M
AY 1
8JU
L 18
SEP
18
Coffee
30-Nov-2015
31-Dec-2015
50556065707580
DEC
15
FEB
16
APR
16
MAY
16
JUN
16
JUL
16
AUG
16
OCT
16
DEC
16
FEB
17
APR
17
Lean Hogs
30-Nov-2015
31-Dec-2015
110115120125130135140
DEC
15
FEB
16
APR
16
JUN
16
AUG
16
OCT
16
DEC
16
FEB
17
APR
17
Live Cattle
30-Nov-2015
31-Dec-2015
1450150015501600165017001750
DEC
15AP
R 16
AUG
16DE
C 16
APR
17AU
G 17
DEC
17AP
R 18
AUG
18DE
C 18
APR
19AU
G 19
DEC
19AP
R 20
AUG
20DE
C 20
Zinc
30-Nov-2015
31-Dec-2015
8400
8600
8800
9000
9200
9400
DEC
15AP
R 16
AUG
16DE
C 16
APR
17AU
G 17
DEC
17AP
R 18
AUG
18DE
C 18
APR
19AU
G 19
DEC
19AP
R 20
AUG
20DE
C 20
Nickel
30-Nov-2015
31-Dec-2015
5960616263646566
DEC
15
MAR
16
MAY
16
JUL
16
OCT
16
DEC
16
MAR
17
MAY
17
JUL
17
OCT
17
DEC
17
MAR
18
MAY
18
JUL
18
Cotton
30-Nov-2015
31-Dec-2015
28
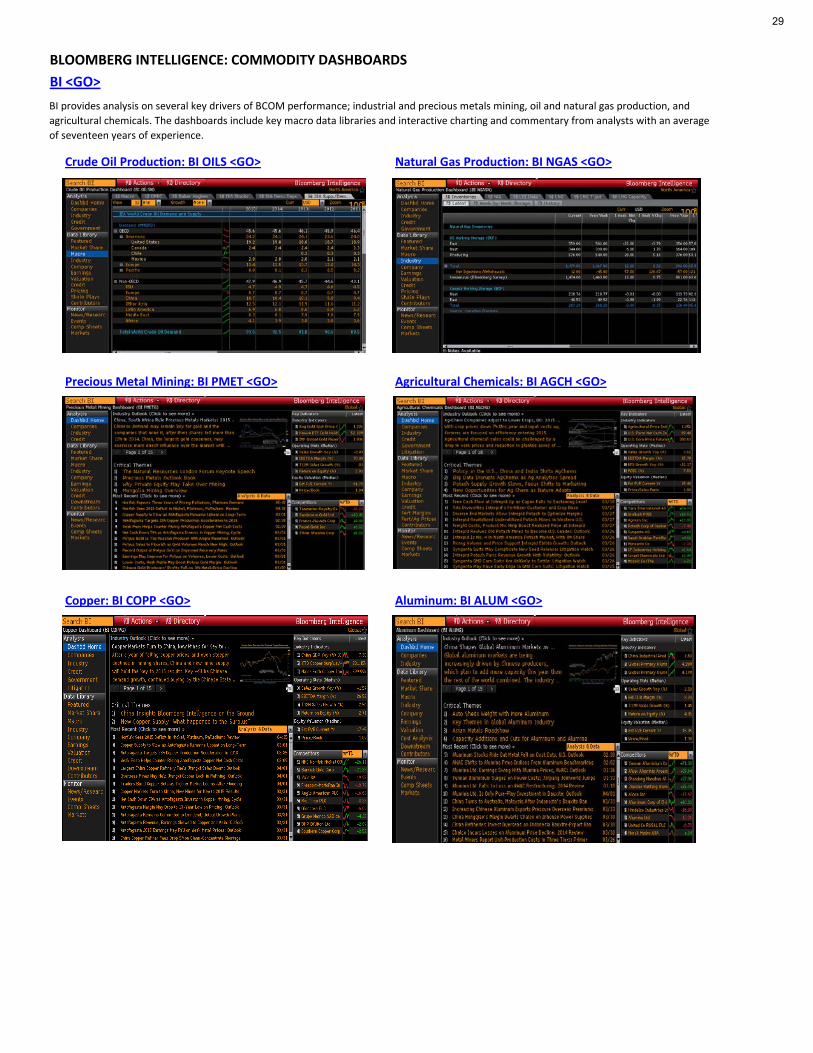
BLOOMBERG INTELLIGENCE: COMMODITY DASHBOARDS BI <GO>
Crude Oil Production: BI OILS <GO> Natural Gas Production: BI NGAS <GO>
Precious Metal Mining: BI PMET <GO> Agricultural Chemicals: BI AGCH <GO>
Copper: BI COPP <GO> Aluminum: BI ALUM <GO>
BI provides analysis on several key drivers of BCOM performance; industrial and precious metals mining, oil and natural gas production, and agricultural chemicals. The dashboards include key macro data libraries and interactive charting and commentary from analysts with an average of seventeen years of experience.
29

COMMODITY CHEAT SHEET FOR THE BLOOMBERG PROFESSIONAL® SERVICE
Broad Commodities EnergyTop commodity news CTOP Top energy news ETOPGlobal commodity prices GLCO Top oil news OTOP Commodity playbook CPLY Crude Oil Production Dashboard BI OILSCommitments of traders report COT First Word oil NI BFWOIL Calendar of commodity events ECO17 News on oil inventories TNI OIL INV Commodity arbitrage calculator CARC Oil Buyer's Guide newsletter NI OBGBRIEFCommodity fundamental data explorer FDM Pipes & Wires newsletter NI PAWSBRIEFCommodity futures overview CMBQ Oil market analysis BOILSecurity finder SECF Nat gas spot prices BGASCommodity data contributors & broker CDAT Forward European utility markets EUMContract table menu CTM News on oil markets NI OILMARKET Seasonality chart SEAG News on OPEC NI OPEC Commodity curve analysis CCRV OPEC production and prices OPECCommodity fair values CFVL Oil markets menu OIL Commodity price forecasts CPFC Crude stored in tankers NOONCommitments of Traders Report COT Refinery outages REFOCommodity maps BMAP Oil’s decline EXT5 Commodity options monitor OMON Oil versus inflation expectations SWIFCommodities charts COSYCommodity Investors menu CMNV MetalsUS exchange traded product fund flows ETF Top metal news METT
Precious metal dashboard BI PMETGBase metals dashboard BI BMET
Commodity Indices Metals prices and data MINE Index description BCOM Index DES Precious metals prices and rates MTL Index constituent weights BCOM Index MEMB Metals Bulletin MB Listed index futures BCOM Index CT COMEX inventories COMX Option volatility surface BCOM Index OVDV LME monitor LME Seasonality chart BCOMNG Index SEAG LME implied volatilities LMIV Commodity index futures movers FMV LME warehouse inventories LMEI Commodity index ranked returns CRR
AgricultureWeather Top agriculture news YTOP Global weather database WETR Agriculture calendar AGRI US snow monitor SNOW Agriculture spot prices AGGPEU weather & utility models EUMM Agriculture supply & demand AGSD
Crop calendar CCAL
BCOM QUICK FACTS
Weighting Bias 2/3 market liquidity and 1/3 world production No. of Commodities 20 Re-balancing Frequency Annual Roll Schedule Monthly (5 day roll) Caps/Limits Single commodity: max 15%
Single commodity and its derivatives: max 25%Related commodity groups: max 33%
First Value Date 30 December 1990
The data provided in this report can be easily accessed on the Bloomberg Professional® service along with numerous news and analytical tools to help you stay on top of the commodity markets.
30