bloomberg data esg analysis_final
TRANSCRIPT

ANALYSIS OF BLOOMBERG ESG DATA FOR 5 LARGEST COMPANIES IN THE AGRICULTURE INDUSTRY
By Kaitlyn Etienne
Calvin College, class of 2016
B.A. Environmental Studies
What this presentation will focus on• Introduction: The meaning of ESG scores and focus company info
• FA ESG Analysis• Focus companies’ ESG scores over the past 5 years
• RV ESG Analysis• Comparison of the focus companies to other companies in the
agriculture/food industry• How well the companies are reporting on Key Performance Indicators (KPIs)
• Supply Chain Analysis• Comparison of the focus companies’ customers
• Remaining Questions and Conclusions
Environmental, Social, Governance • The Environmental, Social, Governance (ESG) score is
based on the company’s annual disclosure of various metrics in its Corporate Social Responsibility (CSR) report. For example:
• Total greenhouse gas (GHG) emissions• Number of women on the board• Percentage of independent directors
• Scores are weighted differently depending on the industry

• A high ESG score indicates that a company is aware of what metrics the Bloomberg terminal measures and how disclosure or lack thereof will appear to stakeholders viewing the ESG data
• The highest scoring companies are actively involved in improving their scores for the various metrics (for example, reducing GHG emissions)
What a high ESG score says about a company

Meet the companies• Archer Daniels Midland (ADM US)
• The Company procures, transports, stores, processes, and merchandises agricultural commodities and products. The company processes oilseeds, corn, milo, oats, barley, peanuts, and wheat.
• Corporate Headquarters: Decatur, IL
• Bunge (BG US)• A global agriculture and food company, Bunge buys, sells,
stores, transports and processes oilseeds and grains to make protein meal for animal feed and edible oil products for commercial customers and consumers. Bunge also produces sugar and ethanol from sugarcane, mills wheat and corn, and sells fertilizer.
• Corporate Headquarters: White Plains, NY
• Ingredion (INGR US)• Refines corn and produces sweeteners and starches. The
Company has customers in a wide range of industries, including the food, soft drink, brewing, pharmaceutical, corrugating, paper, and textile industries.
• Corporate Headquarters: Westchester, IL

Meet the companies, continued• Seaboard (SEB US)
• A global food, energy, and transportation company, Seaboard is comprised of a family of innovative companies, which includes Seaboard Foods (Premium pork foods like Prairiefresh and Daily’s) , Seaboard Marine (containerized shipping service), Butterball, LLC, Seaboard Overseas Trading Group and many others.
• Corporate Headquarters: Shawnee Mission, KS
• Chiquita (CQB US)• Chiquita Brands International, Inc. markets, produces,
and distributes fresh bananas and other fresh produce. The Company also distributes and markets fresh-cut fruit and other branded fruit products.
• Corporate Headquarters: Charlotte, NC

FA ESG score analysis
• The FA ESG data includes the company’s Environmental, Social and Government scores separately, as well as the ESG combined score, over past years
• The focus companies’ ESG scores over the past five years were compared. These scores are on a range from 1 to 100, with 100 being the highest score
• Gaps in scoring were observed for some companies, while others received a score every year

How have the companies scored overall in recent years? (FA ESG scores)
Company Name
ESG Score by Fiscal Year
2009 2010 2011 2012 2013*
Archer Daniels Midland 18 0 0 19 N/A
Bunge 29 29 21.07 37 N/A
Ingredion 16 19 25 25 21
Seaboard 11 11 11 11 11
Chiquita 0 11 11 23 N/A
*Not all companies may have completed 2013 reporting at the time these scores were observed on the Bloomberg Terminal.
Red= did not report, Orange= lowest score per year, Green= highest score per year. Scores rounded to the nearest whole number

FA ESG score observations
• Bunge has repeatedly received the highest ESG scores over the past 5 years, with Ingredion also receiving higher scores as well
• Seaboard, although reporting, has received the lowest scores over the past 5 years
• Curiously, Seaboard has also received the same score of 11.16 (un-rounded) for the past 5 years. Chiquita also received this same score of 11.16 two years in a row. Why is this?

Observing gap years in scoring
• Archer Daniels Midland and Chiquita have had gaps in their reporting
• Is it better for a company to report a low score repeatedly from year to year, or to have gaps, but still have high scores on the years that they do report?
• Without taking into account the years in which ADM did not report, the company has had higher scores than Seaboard, which has reported all 5 years

RV ESG score analysis• The RV ESG compares a company’s metrics to those of others in its
industry
• The agriculture companies researched interestingly have different sets of companies they were compared to in the RV ESG appearing on the Bloomberg Terminal
• ADM, Bunge, Ingredion, and Seaboard were each compared to 45 of their industry peers
• Chiquita was compared to 11 of its industry peers, meaning Chiquita has fewer comparable publicly traded companies
• The overall ESG disclosure scores for each company were compared to those of the companies’ respective top five highest-scoring industry peers
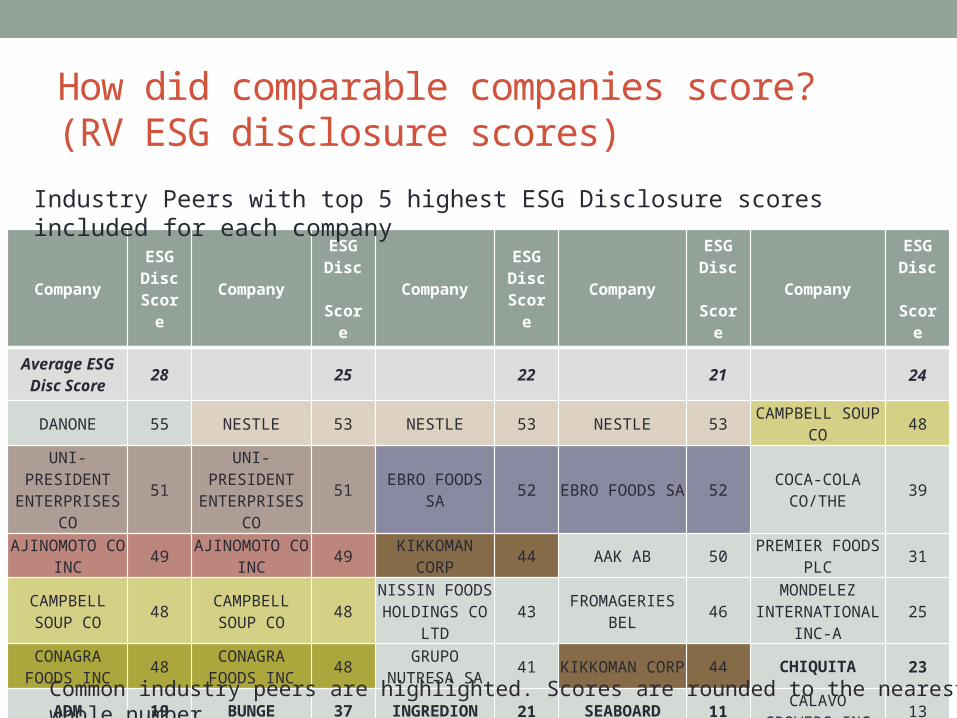
How did comparable companies score? (RV ESG disclosure scores)
CompanyESG Disc
ScoreCompany
ESG Disc Score
CompanyESG Disc
ScoreCompany
ESG Disc Score
CompanyESG Disc Score
Average ESG Disc
Score28 25 22 21 24
DANONE 55 NESTLE 53 NESTLE 53 NESTLE 53CAMPBELL SOUP CO
48
UNI-PRESIDENT
ENTERPRISES CO
51
UNI-PRESIDENT
ENTERPRISES CO
51EBRO FOODS
SA52
EBRO FOODS SA
52COCA-COLA
CO/THE39
AJINOMOTO CO INC
49AJINOMOTO
CO INC49
KIKKOMAN CORP
44 AAK AB 50PREMIER
FOODS PLC31
CAMPBELL SOUP CO
48CAMPBELL SOUP CO
48NISSIN FOODS HOLDINGS CO
LTD43
FROMAGERIES BEL
46MONDELEZ
INTERNATIONAL INC-A
25
CONAGRA FOODS INC
48CONAGRA
FOODS INC48
GRUPO NUTRESA SA
41KIKKOMAN
CORP44 CHIQUITA 23
ADM 19 BUNGE 37 INGREDION 21 SEABOARD 11CALAVO
GROWERS INC13
Industry Peers with top 5 highest ESG Disclosure scores included for each company
Common industry peers are highlighted. Scores are rounded to the nearest whole number.

RV ESG observations• Most Common Top-Performing Peers
• Nestle • Campbell Soup Co• Uni-President Enterprises Co• Ebro Foods SA• Ajinomoto Co Inc• Kikkoman Corp• Conagra Foods Inc
• Average ESG Disclosure scores in the 20s indicate that the peers of these agriculture/food companies are generally not reporting on many metrics, or are not reporting high numbers. However, some are reporting better than others. Danone, Nestle, and Ebro Foods to name a few.

How do the focus companies’ scores compare to those of their industry peers?
• Bunge stands out again, as its ESG Disc score is above average among its industry peers
• ADM, Ingredion, and Seaboard’s ESG Disc scores are below average among their industry peers
• Chiquita has so few industry peers, it ranks in the top five, although its score is also lower than the average in its industry

Comparison of companies’ RV ESG metrics
• A company’s ESG score takes into account ~800 Key Performance Indicators (KPIs) that companies may or may not report on
• This project compared the focus companies on 12 KPIs
Environmental
• Total CO2• GHG Emissions• Energy Consumption• Fuel Used• Total Water Use• Total Waste
Social• % Women Employed• Community Spending
Governance
• % Independent Directors• Investment in
Operational Sustainability
• % Women in Management
• % Women on Board
ESG Disclosure
Score

KPIs the focus companies are reporting on
ADM
% Independent
Directors
% Women on Board
Bunge
GHG Emissions
Energy Consumption
Total Water Use
Total Waste
% Independent Directors
% Women on Board
Ingredion
Community Spending
% Independent Directors
Investment in Operational
Sustainability
% Women on Board
Seaboard
% Independent
Directors
Chiquita
% Independent
Directors
% Women on Board

KPI overall observations• Bunge is reporting on the most metrics, and is the only one of the focus
companies to have scores in the environmental category of indicators. It does not have scores in the social category of indicators, however.
• Ingredion is the only company to have a score in the social category of indicators
• The most common category for these companies to have scores in is governance
• The most common KPI for these companies to score on is % of Independent Directors
• % of Independent Directors is the only indicator that Seaboard scores on, which may explain why it has had the same ESG Disclosure score for the past 5 years in a row

KPI observations—Ingredion
• Ingredion has the highest % of Independent Directors score among its industry peers, at ~92
NameCommunity Spending
% Independent Directors
Investment in Operational
Sustainability
ESG Disclosure
ScoreMEIJI HOLDINGS CO
LTD$76,043 22 $11,482,419 37
GRUPO NUTRESA SA 57 $8,752,491 41
KIKKOMAN CORP 27 $8,338,433 44
INGREDION INC $1,350,000 92 $8,000,000 21
Average* $2,729,833 47 $4,773,384 22
• The company also ranks among the top of its peers in Investment in Operational Sustainability, spending $8,000,000 in 2013
*Although only 4 companies are shown in the table, the ‘Average’ row here displays the average of all industry peers of Ingredion. Scores rounded to nearest whole number
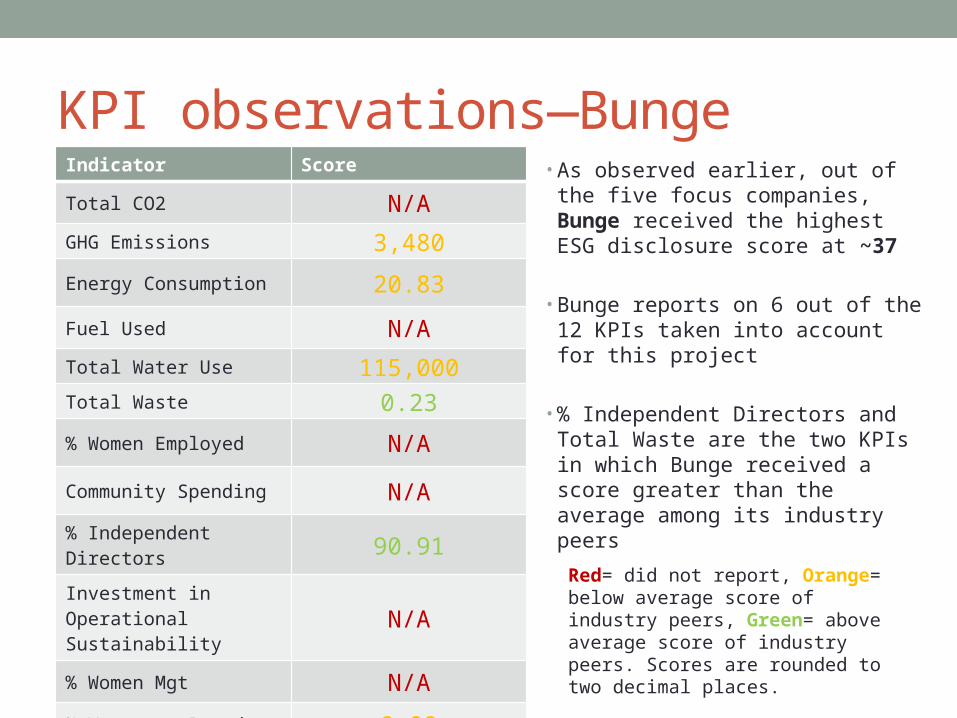
KPI observations—Bunge • As observed earlier, out of the five
focus companies, Bunge received the highest ESG disclosure score at ~37
• Bunge reports on 6 out of the 12 KPIs taken into account for this project
• % Independent Directors and Total Waste are the two KPIs in which Bunge received a score greater than the average among its industry peers
Indicator Score
Total CO2 N/AGHG Emissions 3,480
Energy Consumption 20.83
Fuel Used N/ATotal Water Use 115,000Total Waste 0.23
% Women Employed N/A
Community Spending N/A
% Independent Directors 90.91
Investment in Operational Sustainability N/A
% Women Mgt N/A
% Women on Board 9.09
Red= did not report, Orange= below average score of industry peers, Green= above average score of industry peers. Scores are rounded to two decimal places.

Intensity Metrics
Company GHG Emissions
Total Water Use
Total GHG / CO2
Emissions Intensity per
Sale
Water Intensity per Sale
ARCHER-DANIELS-
MIDLAND CON/A N/A N/A N/A
INGREDION INC N/A N/A N/A N/A
BUNGE LTD 2,760 105,000 NA 1,712
SEABOARD N/A N/A N/A N/A
CHIQUITA N/A N/A N/A N/A
• Bunge was the only focus company to report on Total GHG/CO2 Emissions Intensity per Sale and Water Intensity per Sale
• This was likely also a contributor to its higher ESG score
Scores rounded to the nearest whole number

Value Chain analysis• Information on companies’ top suppliers and customers is
available on the Bloomberg Terminal
• The suppliers and customers of the focus companies were looked at to see if any of the companies have value chain components in common
• Why information about the value chain is important• Customers wishing to improve their own environmental practices
may consider their suppliers’ ESG information• Customers may put pressure on suppliers to improve
environmental practices or look for companies with good environmental records to do business with

What suppliers do these companies have in common? (Value Chain information)
AD
M
Mitsubishi
Oracle Corp
EMC Corp
CSX Corp
Clariant AG
Norfolk Southern Co
ITT Corp
Citrix Systems Inc
VMware Inc
Ing
red
ion
MeadWestvaco Corp
International Paper
Se
abo
ard
Sealed Air Corp
Ch
iqu
ita
Workday Inc
MicroStrategy Inc
Bu
ng
e
Kansas City Southern
TIBCO Software
CSX Corp
Clariant AG
Norfolk Southern Co
Alfa Laval AB
Navios Maritime
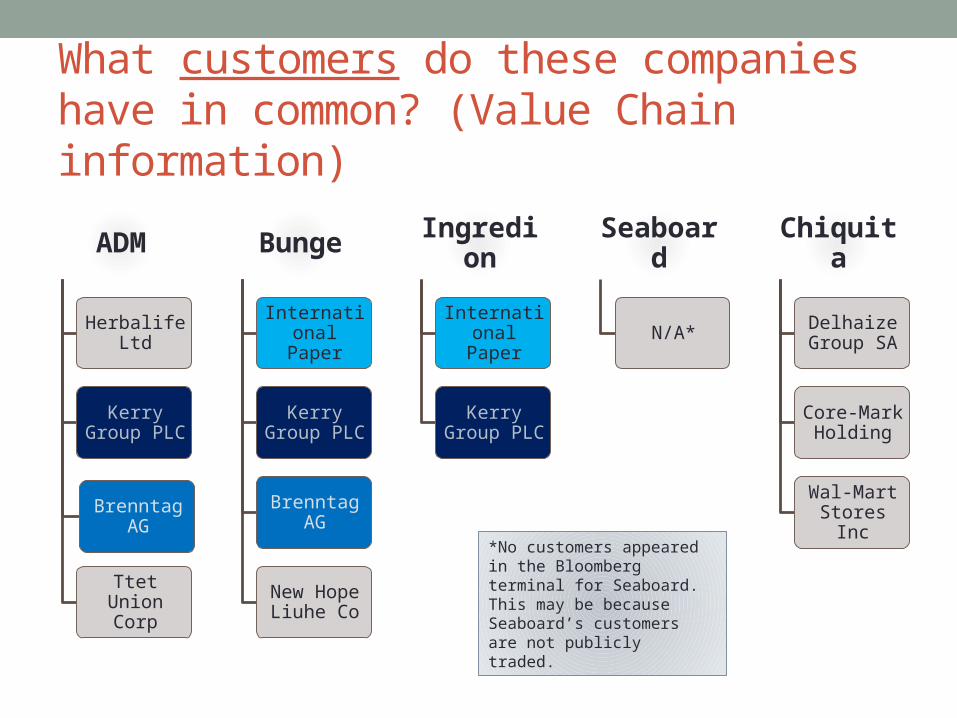
What customers do these companies have in common? (Value Chain information)
ADM
Herbalife Ltd
Kerry Group PLC
Brenntag AG
Ttet Union Corp
Bunge
International Paper
Kerry Group PLC
Brenntag AG
New Hope Liuhe Co
Ingredion
International Paper
Kerry Group PLC
Seaboard
N/A*
Chiquita
Delhaize Group SA
Core-Mark Holding
Wal-Mart Stores Inc
*No customers appeared in the Bloomberg terminal for Seaboard. This may be because Seaboard’s customers are not publicly traded.
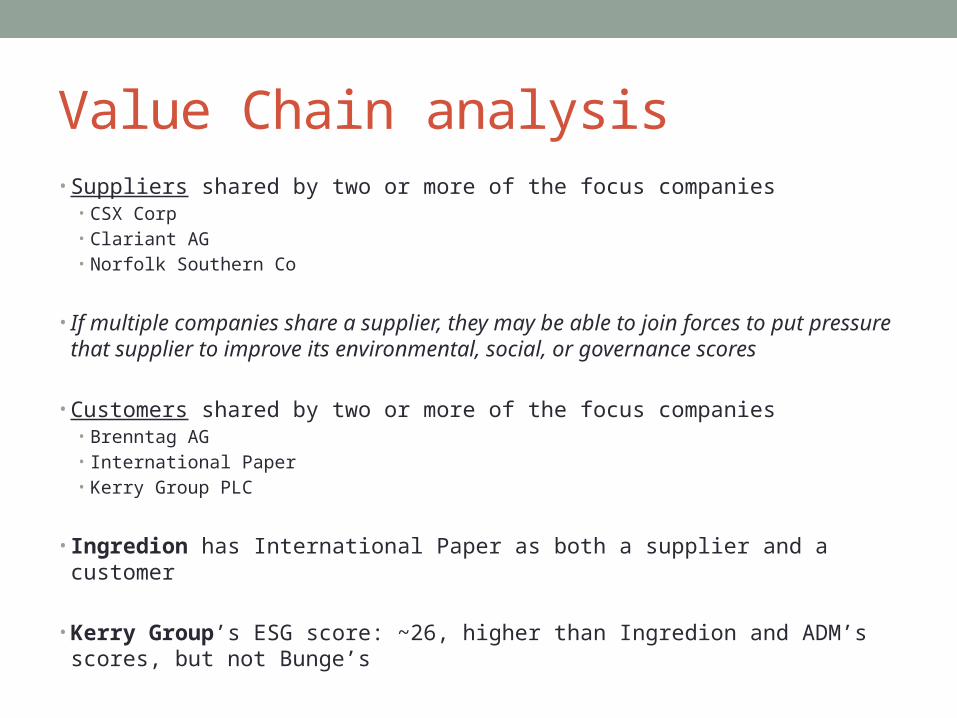
Value Chain analysis• Suppliers shared by two or more of the focus companies
• CSX Corp• Clariant AG• Norfolk Southern Co
• If multiple companies share a supplier, they may be able to join forces to put pressure that supplier to improve its environmental, social, or governance scores
• Customers shared by two or more of the focus companies• Brenntag AG• International Paper• Kerry Group PLC
• Ingredion has International Paper as both a supplier and a customer
• Kerry Group’s ESG score: ~26, higher than Ingredion and ADM’s scores, but not Bunge’s
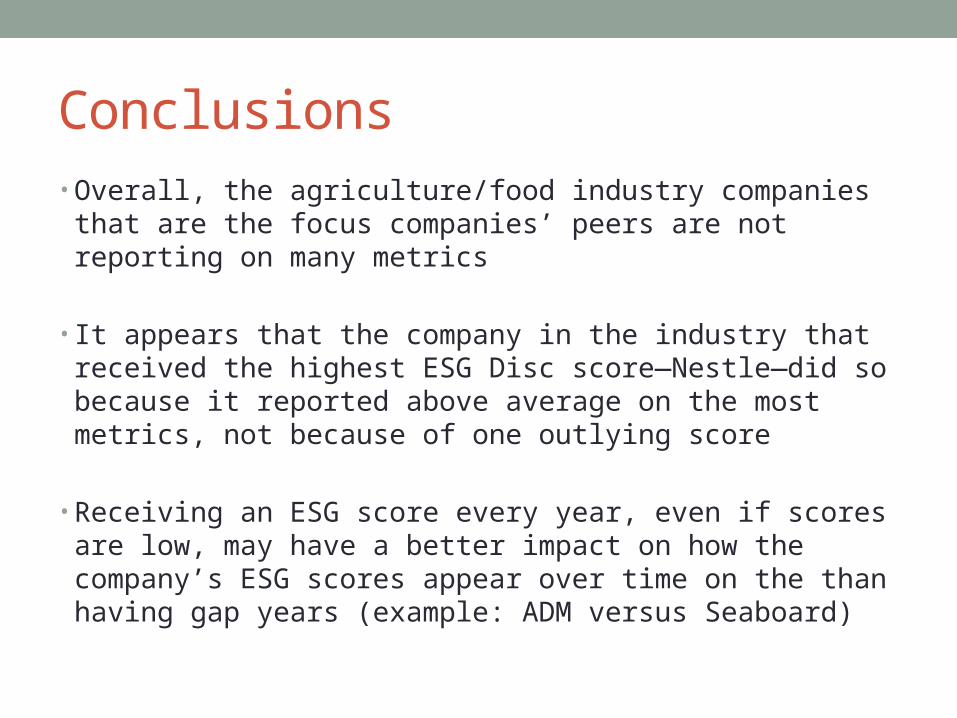
Conclusions• Overall, the agriculture/food industry companies that are the
focus companies’ peers are not reporting on many metrics
• It appears that the company in the industry that received the highest ESG Disc score—Nestle—did so because it reported above average on the most metrics, not because of one outlying score
• Receiving an ESG score every year, even if scores are low, may have a better impact on how the company’s ESG scores appear over time on the than having gap years (example: ADM versus Seaboard)

Thank you!