walmart_financial analysis_final version
TRANSCRIPT

Walmart Company and Financial
Analysis
Nina Schmiedt, Ivana Bodrozic, Rabia Saleem
1
Table of Contents
Table of Contents ................................................................................................................ 1
1) Company Overview and History .................................................................................. 3
PART 1 ................................................................................................................................. 4
2) Corporate Governance ................................................................................................. 4
2.1 Ownership structure ................................................................................................ 4
2.2 Top Shareholders .................................................................................................... 4
2.3 CEO and Top Management ..................................................................................... 5
2.4 Board of Directors ................................................................................................... 6
2.5 Compensation structure .......................................................................................... 6
3) Bondholder Concerns .................................................................................................. 8
3.1 Debt type ................................................................................................................. 8
3.2 Debt covenants ....................................................................................................... 8
3.3 Default risk measure ............................................................................................... 8
4) Financial Markets ......................................................................................................... 9
4.1 Trading and liquidity ................................................................................................ 9
4.2 Analyst following ..................................................................................................... 9
5) Society and other Stakeholders .................................................................................11
5.1 Employee Satisfaction and Customer Care ............................................................11
5.2 Society: News ........................................................................................................11
PART 2 ................................................................................................................................13
6) Financial Analysis .......................................................................................................13
6.1 Profitability .............................................................................................................13
6.2 Liquidity ..................................................................................................................14
6.3 Leverage ................................................................................................................15
PART 3 ................................................................................................................................16
7) Estimation of the cost of capital.................................................................................16
PART 4 ................................................................................................................................20
8) Financing decisions ....................................................................................................20
8.1 Current financing ....................................................................................................20
8.2 Advantages and disadvantages of debt ..................................................................20
8.3 Evaluation of level of debt ......................................................................................21
9) Optimal Capital Structure ...........................................................................................22
9.1 Estimation of Optimal Capital Structure ..................................................................22
9.2 Comparison of debt level with the market ...............................................................23
10) Evaluation of Optimal Capital Structure .................................................................25

2
10.1 Should Walmart move to the optimal, and if so, how? ............................................25
Part 5 ..............................................................................................................................26
11) Evaluation of cash redistribution to shareholders ................................................26
11.1 Cash redistributed to shareholder (dividends and buybacks) ..................................26
11.2 Walmart’s FCFE .....................................................................................................28
11.3 Recap on Investment quality ..................................................................................28
11.4 Dividend policy and recommendations for the future ..............................................28
11.5 Comparison with competitors .................................................................................29
.............................................................................................................................................29
12) Table of Abbreviations ............................................................................................30
13) List of Tables............................................................................................................30
14) List of Figures ..........................................................................................................32
15) Bibliography .............................................................................................................32

3
1) Company Overview and History
“Walmart as we know it today evolved from Sam Walton’s goals for great value and great customer service. “Mr. Sam,” as he was known, believed in leadership through service. This belief that true leadership depends on willing service was the principle on which Walmart was built, and drove the decisions the company has made for the past 50 years” (Wal-Mart Stores, Inc. 2015c).
Sam Walton gained retail experience by running his own variety store in 1945. In the 1950s the Waltons opened a 5&10 (nickel and dime) store in Bentonville, Arkansas. This can actually be compared to today’s dollar shops that are found all over the US and are emerging in Europe as well. Inspired by his previous success, Sam Walton opened his first Walmart store in Rogers, Arkansas in 1962. He shares his visions with associates and made them partners in the business which is ultimately believed to have caused Walmart’s success. By the end of 1976 the Walton family owned 24 stores with sales totaling $12.7million. In 1970 it was incorporated and shares were sold at an IPO price of 16.5$. By 1980 Walmart reached 1 billion of annual sales, owned 276 stores and employed 21,000 people. As early as 1983 cash registers were replaced with computerized point-of-sale system. In 1990 Walmart became number one retailer in the United States. Sam Walton received the Presidential Medal of Freedom in 1992. By that time Walmart employed 371,000 people in 1,928 stores. Since then Walmart has expanded rapidly. In 2014, it employed 2.2 million people serving 200 million customers per week in 11,000 stores in 27 countries. (Wal-Mart Stores, Inc. 2015c). It had a market share of 13.4% in fiscal year (FY) 2015. Before analyzing Walmart’s past and current performance it is important to note the following. Walmart’s system of fiscal versus actual years. The following table summarizes this:
This means that we are currently in fiscal year 2016. In this report, whenever we mention years, we always refer to fiscal years and not actual years, unless stated otherwise.
1.February -
31. January
Fiscal year 2010 2009-2010
Fiscal year 2011 2010-2011
Fiscal year 2012 2011-2012
Fiscal year 2013 2012-2013
Fiscal year 2014 2013-2014
Fiscal year 2015 2014-2015
Fiscal year 2016 2015-2016Table 1: Fiscal year vs actual year

4
Part 1
2) Corporate Governance
2.1 Ownership structure
Beneficial owners: Alice L. Walton Jim C. Walton John T. Walton Estate Trust S. Robson Walton Together, they own 51% of common stock outstanding, also known as Walton Enterprises LLC. 49.95% is owned by Walton Enterprises LLC (the founders), and the marginal difference to 51% is the result of additional shares owned by family members.
2.2 Top Shareholders
(Finance, Yahoo. 2015b) 1 49.95% owned by Walton Enterprises LLC - the founders 2 Vanguard Group 3 State Street Group 4 Berkshire Hathaway (Warren Buffet) 5 Wal-Mart Stores Profit Planning and 401K Plan 6 BlackRock Fund Advisors 7 Dodge and Cox 8 Vanguard Total Stock Market Index Fund 9 Wellington Management Company LLP (was featured in an investment symposium sponsored by Walmart) 10 Northern Trust Investments 11 Dodge and Cox Stock Fund 12 Vanguard 500 Index Investment Fund 13 Vanguard Institutional Index I Fund 14 State Farm Mutual Automobile Ins CO 15 Barrow, Hanley, Mewhinney & Strauss, LLC
Breakdown
% of Shares Held by All Insider
and 5% Owners:51%
% of Shares Held by
Institutional & Mutual Fund
Owners:
31%
% of Shares Held by other
shareholders18%
% of Float Held by Institutional
& Mutual Fund Owners:63%
Number of Institutions Holding
Shares: 1,554
Table 2: Breakdown of Ownership

5
16 SPDR ® S&P 500 ETF F (may have been featured in the investment symposium sponsored by Walmart) 17 State Street Global Advisors (Aus) Ltd 18 Geode Capital Management, LLC 19 Vanguard Dividend Appreciation ETF Fund 20 Gates Bill & Melinda Foundation (co-sponsered an investment symposium with Walmart) 21 Merill Lynch & Co Incorp. (was featured in the investment symposium sponsored by Walmart) (Morningstar, Investors. 2015) 14 out of 20 top shareholders are Institutions, the biggest shareholder is Walton Enterprises, the owners. I tried finding indicators as to possible conflicts of interests of the shareholders, but the only link I found is that Walmart and the Bill and Melinda Gates foundation sponsored a symposium that featured/advertised for some of its shareholders. This is indicated in brackets after the respective names. Following is an example of shareholder’s opinions in light of the bribery scandal in Mexico in 2012.The following are newspaper articles demonstrating an important point. 21.5.2012: Shareholders were advised to vote against certain board members in light of a bribery scandal (used illegal payments in Mexico to win market leadership) 23.5.2012: CalPERS (biggest pension fund), CalSTRS (2nd largest pension fund) announced to vote against member including CEO Mike Duke and Chairman Robson Walton and suing top executives. 1.6.2012: Walmart family founders own more than 50%, so activist shareholders who voted against board members had little chance in winning 4.6.2012: Including shares of Walmart founders, around 13% of the 3.4b shares were voted against each of 4 board members. However, they were re-elected because of the influence of the founders. Not counting the votes of the founders, 30% of shares were voted against each of 4 board members, which shows loss of trust; in the past it was on average 98.4% of shares support for the board. (Huffington Post, 2012) This demonstrates that even though distribution of shares and shareholder power seem distributed in a fair way on the outside, this is not always the case. More often than that, the owners or founders still have the most influence and power.
2.3 CEO and Top Management
CEO and President of Walmart Stores, Inc.: C. Douglas McMillon Age: 49 1984: hourly summer associate manager in a Walmart distribution center 1990: rejoined Walmart as an assistant manager in Tulsa 2005-2009: served as president and CEO of Sam’s Club (operating segment of Walmart) 2009-2014: served as president and CEO of Walmart International February 1, 2014: became CEO of Walmart Stores, Inc., joined board of directors immediately board wanted an insider as CEO Top Management Charles M. Holley, Jr.: Executive Vice President (EVP) and CFO, joined Walmart in 1994 and became CFO in 2010

6
Gregory S. Foran: EVP and President and CEO, Walmart U.S., got his position in FY 2015
David Cheesewright: EVP and President and CEO, Walmart International, got his position in 2015 Rosalind G. Brewer: EVP and President and CEO, Sam’s Club, got her position in 2013
Neil M. Ashe: EVP and President and CEO, Global eCommerce, got his position in 2012
2.4 Board of Directors
Chairman: Gregory B. Penner
15 members (three insiders of Walmart)
regulation: there have to be at least three “non-employees” or “outsiders”
CEO is part of the board
majority of board must be independent
2.5 Compensation structure
This was the compensation structure in FY 2015. As can be seen, the base salary is quite a low percentage, the highest part of the salary comes from performance based units. This is
good, as it is supposed to incentivize managers to act in the company’s interests and not their own. The table below shows the compensation structure for the top managers in more detail. The former CEO, Michael Duke, retired at the end of FY 2015, and Douglas McMillon succeeded him. That year, the top managers increased to 6. The top managers appear to receive a bonus when they enter the company, the majority of their pay scheme is based on success of their respective area of responsibility.
Figure 1: Executive Compensation

7
Name / Title
2011 2012 2013 2014 2015 Total
Michael T. Duke CEO CEO CEO CEO -
Salary 1,232,670 1,264,775 1,315,731 1,366,593 - 5,179,769
Stock Awards 12,652,363 13,066,877 13,649,520 0 - 39,368,760
Incentives 3,852,059 2,878,305 4,373,180 2,846,793 - 13,950,337
Pension Value 499,062 544,523 710,664 940,201 - 2,694,450
other Compensation 476,567 377,258 644,450 490,090 - 1,988,365
Total 18,712,721 18,131,738 20,693,545 5,643,677 - 63,181,681
C. Douglas McMillon EVP EVP EVP EVP CEO
Salary 880,077 904,521 929,748 954,408 1,200,930 4,869,684
Stock Awards 5,669,428 8,568,298 6,544,249 23,011,020 14,597,374 58,390,369
Incentives 1,901,440 1,126,230 1,553,986 1,035,019 2,878,272 8,494,947
Pension Value 148,724 172,318 246,652 338,400 322,359 1,228,453
other Compensation 206,739 190,037 288,458 254,091 393,673 1,332,998
Total 8,806,408 10,961,404 9,563,093 25,592,938 19,392,608 74,316,451
Charles M. Holley, Jr. EVP, CFO EVP, CFO EVP, CFO EVP, CFO EVP, CFO
Salary 631,896 731,598 752,002 793,617 885,165 3,794,278
Stock Awards 6,368,101 3,284,162 4,272,120 6,227,241 4,798,975 24,950,599
Incentives 1,021,676 832,454 1,246,554 827,762 1,349,190 5,277,636
Pension Value 70,416 85,790 107,876 140,435 137,129 541,646
other Compensation 94,074 178,168 260,118 210,336 261,382 1,004,078
Total 8,186,163 5,112,172 6,638,670 8,199,391 7,431,841 35,568,237
William S. Simon EVP EVP EVP EVP -
Salary 802,335 869,732 899,732 939,684 - 3,511,483
Stock Awards 12,187,555 6,099,191 6,544,249 9,073,207 - 33,904,202
Incentives 950,997 1,288,918 3,558,426 2,900,410 - 8,698,751
Pension Value 120 340 5,775 12,457 - 18,692
other Compensation 113,817 184,987 213,615 128,602 - 641,021
Total 14,054,824 8,443,168 11,221,797 13,054,360 - 46,774,149
Neil M. Ashe - EVP EVP EVP EVP
Salary - 36,996 804,396 843,544 935,303 2,620,239
Bonus - 500,000 500,000 0 0 1,000,000
Stock Awards - 10,710,952 5,706,985 11,252,483 6,648,142 34,318,562
Incentives - 0 1,297,076 1,030,705 1,618,926 3,946,707
Pension Value - 0 0 842 2,205 3,047
other Compensation - 40 42,488 51,169 232,199 325,896
Total - 11,247,988 8,350,945 13,178,743 9,436,775 42,214,451
Rosalind G. Brewer - - EVP EVP EVP
Salary - - 801,992 843,544 893,819 2,539,355
Stock Awards - - 11,914,550 9,181,738 6,698,382 27,794,670
Incentives - - 1,463,770 1,281,066 1,711,746 4,456,582
Pension Value - - 8,650 8,166 11,051 27,867
other Compensation - - 268,160 349,909 245,237 863,306
Total - - 14,457,122 11,664,423 9,560,235 35,681,780
Gregory S. Foran - - - - EVP
Salary - - - - 846,910 846,910
Bonus - - - - 500,000 500,000
Stock Awards - - - - 15,781,823 15,781,823
Incentives - - - - 1,273,491 1,273,491
Pension Value - - - - 4,084 4,084
other Compensation - - - - 1,128,815 1,128,815
Total - - - - 19,535,123 19,535,123
David Cheesewright - - - - EVP
Salary - - - - 1,152,850 1,152,850
Bonus - - - - 551,852 551,852
Stock Awards - - - - 5,598,373 5,598,373
Incentives - - - - 2,503,814 2,503,814
Pension Value - - - - 605,579 605,579
other Compensation - - - - 252,586 252,586
Total - - - - 10,665,054 10,665,054
49,760,116 53,896,470 70,925,172 77,333,532 76,021,636 327,936,926
Year
Table 3: Compensation of Top Management, based on Proxy Statements 2011-2015 (Walmart. 2011b-2015b)

8
3) Bondholder Concerns
3.1 Debt type
Walmart has short-term borrowings in the form of commercial paper and lines of credit. It also has various committed lines of credit, committed with 23 financial institutions, totaling $15.0 billion as of January 31, 2015 and with 24 financial institutions, totaling $15.4 billion as of January 31, 2014. It also has trade and stand-by letters of credit which are utilized in normal business activities. Debt Issuances Information on significant long-term debt issued during fiscal 2015 is as follows: (Amounts in millions) Issue Date Principal Amount Maturity Date Fixed/Floating Interest Rate Proceeds April 08, 2014 850 Euro April 8, 2022 Fixed 1.900% $ 1,161 April 08, 2014 650 Euro April 8, 2026 Fixed 2.550% 885 April 22, 2014 500 USD April 21, 2017 Fixed 1.000% 499 April 22, 2014 1,000 USD April 22, 2024 Fixed 3.300% 992 April 22, 2014 1,000 USD April 22, 2044 Fixed 4.300% 985 Oct 22, 2014 500 USD April 22, 2024 Fixed 3.300% 508 Total $5,030 (Walmart. 2015a)
3.2 Debt covenants
Rating agencies believe there’s a high probability that Walmart will meet its debt servicing commitments in a time.
3.3 Default risk measure
Analyst estimates: Example of an article: New York, October 14, 2015 -- Moody's Investors Service today affirmed all ratings of Wal-Mart Stores, Inc. ("Walmart"), including the Aa2 senior unsecured and Prime-1 commercial paper ratings. The stable outlook is continued (Moody’s Investors Service. 2015) Walmart has received excellent ratings on both commercial papers (CP) and Long-term debt from all rating agencies. Therefore Walmart’s risk of default is very small
Table 4: Credit Ratings (Walmart. 2010a-2015a)
Credit Rating 2010 2011 2012 2013 2014 2015
S&P's CP A-1+ A-1+ A-1+ A-1+ A-1+ A-1+
L-T Debt AA AA AA AA AA AA
Moody's CP P-1 P-1 P-1 P-1 P-1 P-1
L-T Debt Aa2 Aa2 Aa2 Aa2 Aa2 Aa2
Fitch CP F1+ F1+ F1+ F1+ F1+ F1+
L-T Debt AA AA AA AA AA AA
DBRS CP R-1 (middle) R-1(middle) R-1(middle)
L-T Debt AA AA AA

9
4) Financial Markets
4.1 Trading and liquidity
This chart shows details as to Walmart’s trading activities. Around half of its shares outstanding are free float and trading volume relative to market capitalization is 2.57%. That trading volume is only 3% of market capitalization could be a result of the stable share price. If investors don’t have any expectations of tremendously fluctuating rates, they might not trade as much.
4.2 Analyst following
WMT Industry Sector S&P 500
Current Qtr. -9.3% 38.3% -19.8% 2.7%
Next Qtr. -11.7% 53.2% 32.7% 14.1%
This Year -9.9% 9.8% 10.3% -0.8%
Next Year -8.8% 18.8% 12.9% 7.9%
Past 5 Years
(per annum)1.6% N/A N/A N/A
Next 5 Years
(per annum)1.2% 13.7% 14.8% 5.6%
Price/Earnings
(avg. for
comparison
categories)
13.11 16.28 16.74 17.36
PEG Ratio
(avg. for
comparison
categories)
10.93 1.87 -0.24 1.6
Growth Est
Table 6: Analysts: Growth Est. (Finance, Yahoo. 2015a)
Table 5: Free Float and Trading Volume (Walmart. 2015a ) (Finance, Yahoo. 2015d)
Shares outstanding 3.20bn
Free float 1.56bn
(The Financial Times LTD. 2015b)
% Held by Insiders: 51.35%
% Held by Institutions: 30.60%
(Finance,Yahoo. 2015c)
Average Trading volume FY 2015 (shares) 83,087,800
Average Trading volume FY 2015 ($) 6,343,172,262
Market Cap 31.1.2015 ($) 246,587,903,458
Trading volume relative
to Market Cap 2.57%

10
In this quarter, Walmart experiences negative growth, which is the same for the sector, but the industry and the S&P 500 are experiencing positive growth. Next year, growth is also forecasted to be negative, with all other ones having positive growth, which is not a very good sign. However, Walmart already announced that its earnings will fall in the years to come, therefore this is not totally unexpected. Its average P/E ratio is the lowest out of al. three, it is 13.11, meaning an investor would spend 13.11$ for 1$ of current earnings. A high P/E ratio means investors are expecting higher earnings from the company compared to companies with low P/E ratios. Looking at the PEG ratio, it is the highest out of all three. The lower the PEG ratio, the more the stock might be undervalued given its earnings performance. A PEG ratio below 1 is desirable. Therefore, by applying this rule only, Walmart’s shares seems to be overvalued.
This table indicates that earnings are estimated to be lower next year than they were last year, which has been announced by the company and led to drop in stock price.
Sales are estimated to be remain constant and therefore should be similar than last year.
Earnings Est Current Qtr. Next Qtr.Current
YearNext Year
16-Jan 16-Apr 16-Jan 17-Jan
Avg. Estimate 1.46 0.91 4.57 4.17
No. of
Analysts25 15 24 29
Low Estimate 1.32 0.85 4.45 3.96
High Estimate 1.51 0.98 4.62 4.91
Year Ago EPS 1.61 1.03 5.07 4.57
Table 7: Analysts: Earnings Est. (Finance, Yahoo. 2015a)
Current Qtr. Next Qtr.Current
YearNext Year
16-Jan 16-Apr 16-Jan 17-Jan
Avg. Estimate 131.14B 116.46B 483.61B 494.94B
No. of
Analysts17 9 22 24
Low Estimate 128.17B 114.33B 480.63B 484.52B
High Estimate 132.82B 118.77B 485.32B 511.59B
Year Ago
Sales131.56B 114.83B 485.65B 483.61B
Sales Growth
(year/est)-0.30% 1.40% -0.40% 2.30%
Revenue Est
Table 8: Analysts: Revenue Est. (Finance, Yahoo. 2015a)
11
5) Society and other Stakeholders
5.1 Employee Satisfaction and Customer Care
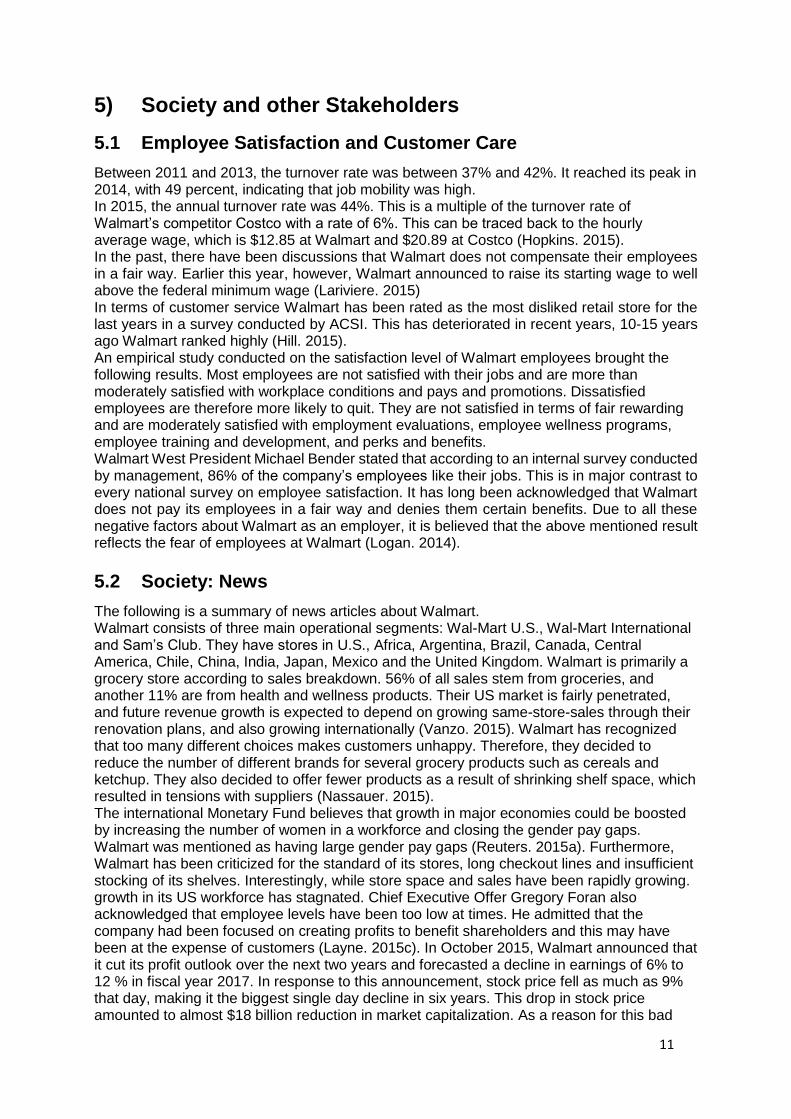
Between 2011 and 2013, the turnover rate was between 37% and 42%. It reached its peak in 2014, with 49 percent, indicating that job mobility was high. In 2015, the annual turnover rate was 44%. This is a multiple of the turnover rate of Walmart’s competitor Costco with a rate of 6%. This can be traced back to the hourly average wage, which is $12.85 at Walmart and $20.89 at Costco (Hopkins. 2015). In the past, there have been discussions that Walmart does not compensate their employees in a fair way. Earlier this year, however, Walmart announced to raise its starting wage to well above the federal minimum wage (Lariviere. 2015) In terms of customer service Walmart has been rated as the most disliked retail store for the last years in a survey conducted by ACSI. This has deteriorated in recent years, 10-15 years ago Walmart ranked highly (Hill. 2015). An empirical study conducted on the satisfaction level of Walmart employees brought the following results. Most employees are not satisfied with their jobs and are more than moderately satisfied with workplace conditions and pays and promotions. Dissatisfied employees are therefore more likely to quit. They are not satisfied in terms of fair rewarding and are moderately satisfied with employment evaluations, employee wellness programs, employee training and development, and perks and benefits. Walmart West President Michael Bender stated that according to an internal survey conducted by management, 86% of the company’s employees like their jobs. This is in major contrast to every national survey on employee satisfaction. It has long been acknowledged that Walmart does not pay its employees in a fair way and denies them certain benefits. Due to all these negative factors about Walmart as an employer, it is believed that the above mentioned result reflects the fear of employees at Walmart (Logan. 2014).
5.2 Society: News
The following is a summary of news articles about Walmart. Walmart consists of three main operational segments: Wal-Mart U.S., Wal-Mart International and Sam’s Club. They have stores in U.S., Africa, Argentina, Brazil, Canada, Central America, Chile, China, India, Japan, Mexico and the United Kingdom. Walmart is primarily a grocery store according to sales breakdown. 56% of all sales stem from groceries, and another 11% are from health and wellness products. Their US market is fairly penetrated, and future revenue growth is expected to depend on growing same-store-sales through their renovation plans, and also growing internationally (Vanzo. 2015). Walmart has recognized that too many different choices makes customers unhappy. Therefore, they decided to reduce the number of different brands for several grocery products such as cereals and ketchup. They also decided to offer fewer products as a result of shrinking shelf space, which resulted in tensions with suppliers (Nassauer. 2015). The international Monetary Fund believes that growth in major economies could be boosted by increasing the number of women in a workforce and closing the gender pay gaps. Walmart was mentioned as having large gender pay gaps (Reuters. 2015a). Furthermore, Walmart has been criticized for the standard of its stores, long checkout lines and insufficient stocking of its shelves. Interestingly, while store space and sales have been rapidly growing. growth in its US workforce has stagnated. Chief Executive Offer Gregory Foran also acknowledged that employee levels have been too low at times. He admitted that the company had been focused on creating profits to benefit shareholders and this may have been at the expense of customers (Layne. 2015c). In October 2015, Walmart announced that it cut its profit outlook over the next two years and forecasted a decline in earnings of 6% to 12 % in fiscal year 2017. In response to this announcement, stock price fell as much as 9% that day, making it the biggest single day decline in six years. This drop in stock price amounted to almost $18 billion reduction in market capitalization. As a reason for this bad

12
forecast CFO Charles Holley stated they will undertake significant investments, especially in wages, training and improving customer experience. He also stated that earnings are expected to increase again in fiscal year 2019 (Oyedele. 2015). The drop in stock price due to this announcement caused Walmart’s share price to be at a 3-year low. Walmart had been under severe pressure to pay employees more. A critical union, however, said that Walmart uses these wage increases only as an excuse for its poor performance. It supposedly cut employee working hours soon after the new wages were announced. An additional problem Walmart had to deal with were falling sales, due to increased competition from Target, Costco and Amazon (La Monica. 2015). At current prices, the company valuation of Walmart is very reasonable. There is not so much room to make large amounts of money, but the company is 30% above its historical mean and median valuation levels (Vanzo. 2015).
13
Part 2
6) Financial Analysis
6.1 Profitability
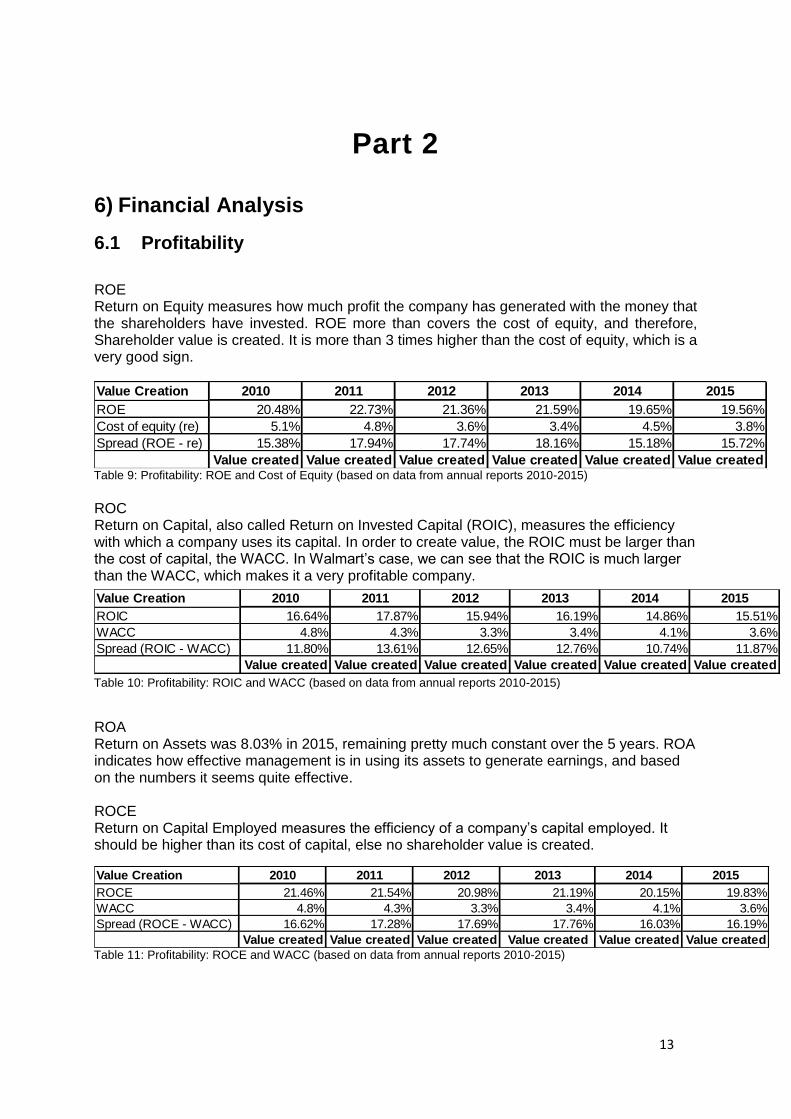
ROE Return on Equity measures how much profit the company has generated with the money that the shareholders have invested. ROE more than covers the cost of equity, and therefore, Shareholder value is created. It is more than 3 times higher than the cost of equity, which is a very good sign.
ROC Return on Capital, also called Return on Invested Capital (ROIC), measures the efficiency with which a company uses its capital. In order to create value, the ROIC must be larger than the cost of capital, the WACC. In Walmart’s case, we can see that the ROIC is much larger than the WACC, which makes it a very profitable company.
ROA Return on Assets was 8.03% in 2015, remaining pretty much constant over the 5 years. ROA indicates how effective management is in using its assets to generate earnings, and based on the numbers it seems quite effective. ROCE Return on Capital Employed measures the efficiency of a company’s capital employed. It should be higher than its cost of capital, else no shareholder value is created.
Value Creation 2010 2011 2012 2013 2014 2015
ROE 20.48% 22.73% 21.36% 21.59% 19.65% 19.56%
Cost of equity (re) 5.1% 4.8% 3.6% 3.4% 4.5% 3.8%
Spread (ROE - re) 15.38% 17.94% 17.74% 18.16% 15.18% 15.72%
Value created Value created Value created Value created Value created Value createdTable 9: Profitability: ROE and Cost of Equity (based on data from annual reports 2010-2015)
Value Creation 2010 2011 2012 2013 2014 2015
ROIC 16.64% 17.87% 15.94% 16.19% 14.86% 15.51%
WACC 4.8% 4.3% 3.3% 3.4% 4.1% 3.6%
Spread (ROIC - WACC) 11.80% 13.61% 12.65% 12.76% 10.74% 11.87%
Value created Value created Value created Value created Value created Value created
Table 10: Profitability: ROIC and WACC (based on data from annual reports 2010-2015)
Value Creation 2010 2011 2012 2013 2014 2015
ROCE 21.46% 21.54% 20.98% 21.19% 20.15% 19.83%
WACC 4.8% 4.3% 3.3% 3.4% 4.1% 3.6%
Spread (ROCE - WACC) 16.62% 17.28% 17.69% 17.76% 16.03% 16.19%
Value created Value created Value created Value created Value created Value created
Table 11: Profitability: ROCE and WACC (based on data from annual reports 2010-2015)

14
As can be seen in Table 11 above, Walmart seems to employ its capital very efficiently, the ratio is multiple times higher than the cost of capital. ROS Return on sales, or Operating Profit Margin, measures how effectively a company can turn their sales into profit. Walmart’s ROS has been decreasing over the years, and was 5.63% at the end of fiscal 2015. A decreasing ROS ratio may indicate slowing growth, but 5.63% I still quite a good ratio. Under 5% it should be seen as a warning signal. Based on these ratios and evaluations, Walmart seems to be a very profitable company.
6.2 Liquidity
Current Ratio The current ratio measures if a company can cover current liabilities with current assets. In 2015, Walmart’s current ratio was 0.97, meaning for 1$ of liabilities it has 0.97$ of current assets. This ratio has remained stable over the years. Quick ratio Is almost the same as the current ratio, only without considering inventory. Walmart’s quick ratio was 0.28 in 2015, and has also remained stable. Cash Conversion Cycle (CCC) The CCC describes the gap between accounts payable and receivable. The longer the time span after bills are paid (accounts payable) until cash is collected from customers (accounts receivable), the larger the CCC. The CCC is negative if a company pays its suppliers before receiving money from customers. It gives an indication of how well a company manages it working capital assets and how efficient is it at paying back current liabilities. The cash conversion cycle is calculated as Accounts Receivables Days – Inventory Days + Accounts Payable Days.
Walmart has moderate cash gaps. The shorter the cycle, the more liquid a company. According to the first two ratios, Walmart does not score high on liquidity. However, looking at the CCC a different picture is painted. Walmart’s CCC is quite good, the gap between receivables and payables is just a few days. This also shows the limitations of the current and quick ratio.
2010 2011 2012 2013 2014 2015
Acc.Rec.
Days 3.60 3.99 4.50 4.95 5.15 5.06
Inventory
Days 40.54 40.33 42.01 43.78 45.19 44.99
Acc.Pay.
Days 35.68 36.78 37.79 38.35 38.37 37.87
CCC 8.45 7.55 8.72 10.38 11.98 12.17Table 12: Liquidity: Cash Conversion Cycle (based on data from annual reports 2010-2015)

15
6.3 Leverage
The gearing ratio is quite low and has been decreasing over the last years. It compares net debt with shareholder’s equity. The Debt ratio is similar, it compares Total Liabilities with Total Assets, and in 2015, Total Liabilities were 60% of Total Assets, which is quite acceptable. I calculated the D/E ratio in two different ways, once with the book value and once with the market value of equity. The results are very different, but in both cases they are very good and nothing to be concerned about. D/E ratio measures how much money creditors have in the company compared with shareholders. It depends on the industry, but often if the ratio is more than 100% it can be a reason for concern. However, in Walmart’s case both versions of the ratio are far from 100%. I calculated Interest coverage ratio in two ways as well, once with EBIT and once with EBITDA, and the results are slightly different. In both cases though the ratio is very good, in 2015 Walmart could cover its interest expense with operating profit 15.47 times. A coverage ratio below 3 is a reason for concern, and below 1 means the company cannot cover their interest expense even once. Overall, the leverage situation of Walmart looks very good.
Ratio 2010 2011
%
change
10-11
2012
%
change
11-12
2013
%
change
12-13
2014
%
change
13-14
2015
%
change
14-15
Gearing 41.0% 54.7% 33% 57.5% 5% 52.6% -8% 56.9% 8% 44.6% -22%
Debt Ratio 57.3% 60.6% 6% 60.8% 0% 59.8% -2% 60.3% 1% 57.8% -4%
Debt to Equity (BV) 51.8% 65.1% 26% 66.1% 2% 62.1% -6% 65.8% 6% 55.3% -16%
Debt to Equity (MV) 22.3% 27.3% 22% 29.1% 7% 23.8% -18% 22.8% -4% 19.3% -16%
Debt to Capital 36.8% 42.1% 14% 42.0% 0% 40.7% -3% 42.1% 3% 38.2% -9%
Interest coverage 16.53 16.54 0% 16.06 -3% 17.59 10% 16.13 -8% 15.47 -4%
Interest coverage 12.71 12.75 0% 12.30 -4% 13.47 10% 12.13 -10% 11.56 -5%
Table 13: Leverage: various ratios (based on data from annual reports 2010-2015)

16
Part 3
7) Estimation of the cost of capital
Risk profile: The financial situation of Walmart’s store has been discussed extensively above. In terms of leverage, the company is in a very good situation. Looking at the beta, there are different ones stated on different websites.
Our beta estimated by regression is 0.29, meaning if the market moves up or down by 1, Walmart will move by 0.29. The beta symbolizes systematic, or market risk, which cannot be diversified. The lower the beta, the less risky the company, therefore it can be concluded that Walmart is not a very volatile and risky company and market risk is not very large.
(Finance, Yahoo. 2015b) The marginal investor seems to be institutions, since the owners will not try to influence the share price. The major institutional owners are listed in part 1. Walmart first offered common stock to the public in 1970 and began trading on the New York Stock Exchange (NYSE: WMT) on August 25, 1972 (Wal-Mart Stores, Inc.2015). It does not have any listings in foreign markets (Wal-Mart Stores, Inc. 2015d). The regression of Walmart’s stock against returns on The S&P 500 yielded the following results.
Table 14: Beta comparison (Finance, Yahoo. 2015c), (Finance, Google. 2015), (Reuters. 2015b), (Nasdaq. 2015)
Beta comparison
Yahoo Finance 0.44
Google Finance 0.27
Reuters 0.30
Nasdaq 0.58
Estimated 0.29
Breakdown
% of Shares Held by All Insider
and 5% Owners:51%
% of Shares Held by
Institutional & Mutual Fund
Owners:
31%
% of Shares Held by other
shareholders18%
% of Float Held by Institutional
& Mutual Fund Owners:63%
Number of Institutions Holding
Shares: 1,554
Table 15: Ownership breakdown
17
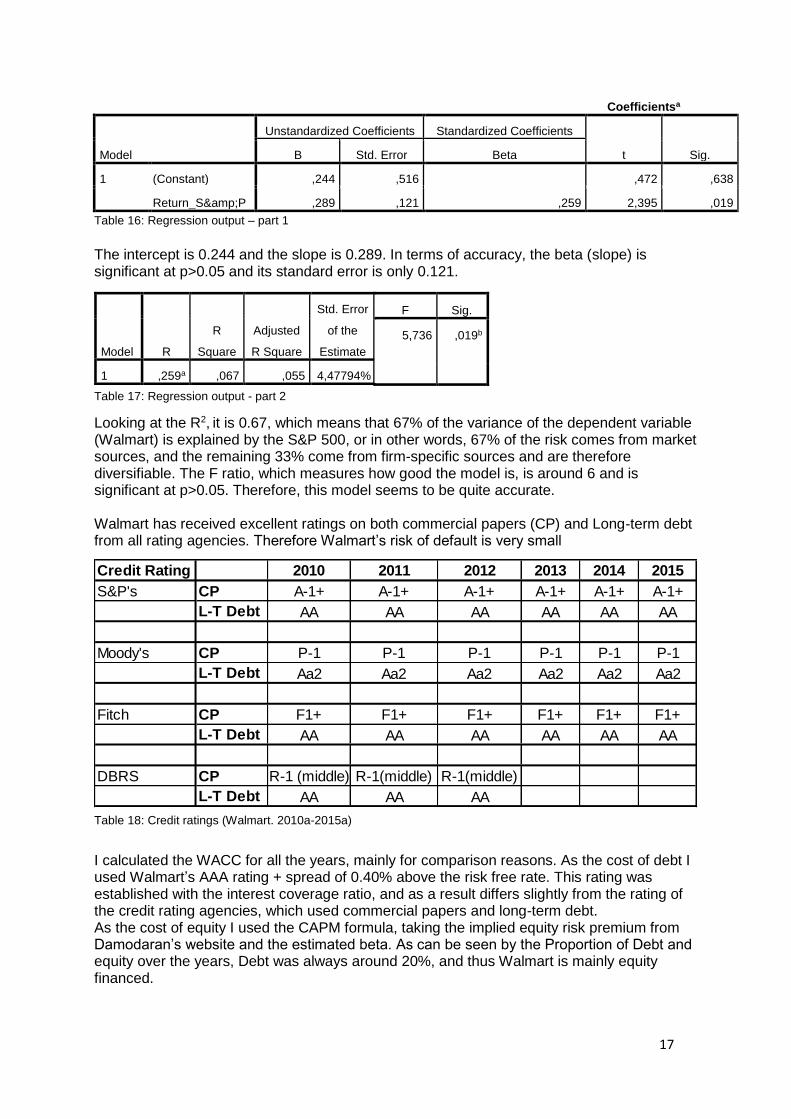
Coefficientsa
Model
Unstandardized Coefficients Standardized Coefficients
t Sig. B Std. Error Beta
1 (Constant) ,244 ,516 ,472 ,638
Return_S&P ,289 ,121 ,259 2,395 ,019
The intercept is 0.244 and the slope is 0.289. In terms of accuracy, the beta (slope) is significant at p>0.05 and its standard error is only 0.121.
Looking at the R2, it is 0.67, which means that 67% of the variance of the dependent variable (Walmart) is explained by the S&P 500, or in other words, 67% of the risk comes from market sources, and the remaining 33% come from firm-specific sources and are therefore diversifiable. The F ratio, which measures how good the model is, is around 6 and is significant at p>0.05. Therefore, this model seems to be quite accurate. Walmart has received excellent ratings on both commercial papers (CP) and Long-term debt from all rating agencies. Therefore Walmart’s risk of default is very small I calculated the WACC for all the years, mainly for comparison reasons. As the cost of debt I used Walmart’s AAA rating + spread of 0.40% above the risk free rate. This rating was established with the interest coverage ratio, and as a result differs slightly from the rating of the credit rating agencies, which used commercial papers and long-term debt. As the cost of equity I used the CAPM formula, taking the implied equity risk premium from Damodaran’s website and the estimated beta. As can be seen by the Proportion of Debt and equity over the years, Debt was always around 20%, and thus Walmart is mainly equity financed.
Model R
R
Square
Adjusted
R Square
Std. Error
of the
Estimate
1 ,259a ,067 ,055 4,47794%
F Sig.
5,736 ,019b
Table 16: Regression output – part 1
Table 17: Regression output - part 2
Table 18: Credit ratings (Walmart. 2010a-2015a)
Credit Rating 2010 2011 2012 2013 2014 2015
S&P's CP A-1+ A-1+ A-1+ A-1+ A-1+ A-1+
L-T Debt AA AA AA AA AA AA
Moody's CP P-1 P-1 P-1 P-1 P-1 P-1
L-T Debt Aa2 Aa2 Aa2 Aa2 Aa2 Aa2
Fitch CP F1+ F1+ F1+ F1+ F1+ F1+
L-T Debt AA AA AA AA AA AA
DBRS CP R-1 (middle) R-1(middle) R-1(middle)
L-T Debt AA AA AA

18
If I were to calculate WACC based on the cost of debt from their bonds for 2015, there would be only a slight difference, the post-tax cost of debt would be 2% and the WACC would be 3.5%, almost the same as with the other version. I also tried calculating the cost of equity with the Dividend Discount Model, and was surprised to find it much higher than with CAPM.
Obviously, this makes the WACC much higher as well.
WACC (based on rating+spread)
($ millions, except per share data
and %)
2010 2011 2012 2013 2014 2015
S-t debt 523 1,031 4,047 6,805 7,670 1,592
L-t debt 37,281 45,347 46,045 43,981 45,874 45,896
Total debt 37,804 46,378 50,092 50,786 53,544 47,488
Interest expense 1,884 2,004 2,160 2,064 2,216 2,348
Post-tax interest expense 1,130 1,202 1,296 1,238 1,330 1,409
Rd (Rating+spread) 3.7% 2.3% 2.2% 3.4% 2.6% 2.6%
Re (%) 5.1% 4.8% 3.6% 3.4% 4.5% 3.8%
Share price 43.78 46.52 49.75 63.32 71.77 76.34
Number of shares (millions) 3,866 3,656 3,460 3,374 3,269 3,230
E (share price* # of shares) 169,249 170,089 172,149 213,633 234,619 246,588
Total Value (D+E) 207,053 216,467 222,241 264,419 288,163 294,076
Proportion of Debt 18.3% 21.4% 22.5% 19.2% 18.6% 16.1%
Proportion of Equity 81.7% 78.6% 77.5% 80.8% 81.4% 83.9%
Marginal tax rate (%) 40.0% 40.0% 40.0% 40.0% 40.0% 40.0%
WACC 4.8% 4.3% 3.3% 3.4% 4.1% 3.6%
Table 19: WACC calculation (based on data from annual reports 2010-2015 and Damodaran. 2015)
CAPM (rf+ß*ierp) (%) 2010 2011 2012 2013 2014 2015
Rf (yield on 10y US treasury bond) (%) 3.84% 3.29% 1.88% 1.76% 3.04% 2.17%
Implied equity risk premium 4.36% 5.2% 6.0% 5.8% 5.0% 5.8%
ß (based on regression) 0.29 0.29 0.29 0.29 0.29 0.29
CAPM 5.1% 4.8% 3.6% 3.4% 4.5% 3.8%
Table 20: CAPM calculation (based on data from annual reports 2010-2015 and Damodaran. 2015)
Dividend Discount Model 2010 2011 2012 2013 2014 2015
Re=D1/P0 + g
D1 (Dividend per share next year) 1.21 1.46 1.59 1.88 1.92 1.96
P0 (Price per share this year) 43.78 46.52 49.75 63.32 71.77 76.34
Growth rate 14.5% 16.6% 14.5% 14.8% 12.1% 12.1%
Re 17.2% 19.7% 17.7% 17.7% 14.8% 14.7%Table 21: Dividend Discount Model (based on data from annual reports 2010-2015)
WACC 14.8% 16.0% 14.2% 15.0% 12.5% 12.8%
Table 22: Dividend Discount Model – WACC (based on data from annual reports 2010-2015)

19
I tried calculating the cost of equity with the Dividend growth rate of 9.6% as of October 2015, estimated by analysts. This changes the cost of equity and the WACC to 12.2% and 10.6%, respectively, for 2015. One limitation of the Dividend Discount Model is that it doesn’t work with non-constant dividend growth rates. Looking at the historic changes in dividends, this could be the explanation for these unreasonably high numbers.
In my opinion, the first approach of using the WACC with the cost of equity as calculated by CAPM is the best one. The company uses very little debt and is generally not very risky, therefore I find no justification in such a high rate of equity. Furthermore, the cost of equity in the analysis of the Optimal Capital Structure, at the highest level of debt (90%) is 10.71% and therefore lower than this estimated cost of equity. As a result of this, I chose the original WACC calculation with the cost of equity according to CAPM for the whole analysis.
Ratio 2010 2011
%
change
10-11
2012
%
change
11-12
2013
%
change
12-13
2014
%
change
13-14
2015
%
change
14-15
Dividend per share 1.09 1.21 11% 1.46 21% 1.59 9% 1.88 18% 1.92 2%
Table 23: Dividend per share and % change (Walmart. 2010a-2015a)

20
Part 4
8) Financing decisions
8.1 Current financing
Walmart uses intercompany financing arrangements in order to always have cash available in the country where it is needed. In their financial report of 2015, management says it believes that the domestic liquidity needs will be met through long-term debt and short term borrowings. They use short-term borrowings mainly to fund operations, dividend payments, share repurchases, capital expenditures and other cash requirements. Short-term borrowing consists of commercial papers and lines of credit. Short-term borrowings outstanding at January 31, 2015 and 2014 were $1.6 billion and $7.7 billion, respectively. In FY 2015 the weighted-average interest rate was 0.5% (Walmart. 2015a). They had committed lines of credit with 23 financial institutions in 2015, totaling $15 billion. In 2015 they used less of their net cash from operating activities for share repurchases and capital expenditure, which resulted in a reduction in working capital and short-term borrowings (Walmart. 2015a). The proceeds of smaller, long term debt issuances by several of its non-U.S. operations in fiscal years 2015 and 2014 were used to pay down and refinance existing debt and for other general corporate purposes. During fiscal 2015 and 2014, the company also repaid other, smaller long-term debt as it matured in several of its non-U.S. operations (Walmart. 2015a).
8.2 Advantages and disadvantages of debt
Currently, Walmart is financed by 16.1% debt and 83.9% equity. Its cost of debt and equity are 2.6% and 3.8%, respectively.
In FY 2015, its interest tax shield was 3%, meaning they saved 3% of taxes as a result of their debt (interest payments). Their annual tax savings due to interest payments increased over the years and amounted to $ 939 million. The present value of the interest tax shield increased from 2011-2014 due to increase in debt and interest rate remaining stable. Even though the tax savings were at its highest level in 2015, the tax shield declined, most likely as a result of the interest rate rising.
Tax savings from debt
After tax cost of debt =
interest rate - tax savings2010 2011 2012 2013 2014 2015
Interest rate r 5.0% 4.3% 4.3% 4.1% 4.1% 4.9%
1- marginal tax rate 60.0% 60.0% 60.0% 60.0% 60.0% 60.0%
Interest Tax shield (r*(1-t) 3.0% 2.6% 2.6% 2.4% 2.5% 3.0%
Total Debt 37,804 46,378 50,092 50,786 53,544 47,488
Annual tax savings from
interest payments (t*r*D) 754 802 864 826 886 939
PV (tax savings)=(t*r*D ) / r= t*D 15,122 18,551 20,037 20,314 21,418 18,995Table 24: Interest Tax Shield (based on data from annual reports 2010-2015)
21
In my opinion, the interest tax shield is a large advantage to the firm. At this level of debt, no disadvantages of debt are apparent. If sensitivity analysis would be conducted, different scenarios of debt could be analyzed and the topic could be evaluated into more detail.
8.3 Evaluation of level of debt
The company is exploiting the interest tax shield as shown and evaluated above. The evaluation of different levels of debt and the optimal capital structure is continued below.

22
9) Optimal Capital Structure
9.1 Estimation of Optimal Capital Structure
I estimated the optimal capital structure for Walmart based on the scenario analysis with different proportions of debt. The different proportions of debt had to be adjusted a number of times, especially at 90% debt. The ratings ranged from AAA at 0% debt to CCC at 90% debt. After having calculated the pre-tax cost of debt, I calculated the cost of equity. The different levels of cost of equity were estimated with the help of the unlevered beta, which is 0.22 for Walmart. The next step was to calculate the WACC, to see at which level of debt the cost of capital is minimized. In order to calculate the Firm Value and compare it to the WACC, an annual growth rate of 2.16% was calculated based on Free Cash Flow to Firm. Our result was that the optimal capital structure would be 80% debt, since at that level of debt the WACC would be minimized (3.01%). The following chart displays the comparison of Firm Value and cost of capital at the different levels of debt.
Figure 2: Optimal Capital Structure: Firm Value and Cost of Capital (based on data from annual reports 2010-2015)

23
If we look at factors other than the WACC, we can see that the post-tax cost of debt is the smallest at debt levels up to 30% (1.57%). The cost of equity is minimized at a debt level of 0%.
9.2 Comparison of debt level with the market
The average D/E ratio among listed companies is approximately 1.5. A ratio lower than 1 is considered favorable, since that indicates a company is relying more on equity than on debt to finance its operating costs. Ratios higher than 2 are generally unfavorable, although industry and similar company averages have to be considered in the evaluation. The D/E ratio of Walmart indicates that generally it is a successful company which attracts equity
Figure 3: Optimal Capital Structure: WACC, Cost of Equity, Cost of Debt (based on data from annual reports 2010-2015)
Company D/E ratio 2015
Walmart 56%
Carrefour 152%
Tesco 205%
Costco Wholesale Corp 58%
Kroger 191%Table 25: D/E ratio - Comparison with Competitors (GuruFocus 2015a, GuruFocus. 2015c, GuruFocus. 2015e, GuruFocus. 2015g, Walmart. 2015a)

24
investors. With the exception of Costco the other companies in the industry all have much higher D/E ratios.

25
10) Evaluation of Optimal Capital Structure
10.1 Should Walmart move to the optimal, and if so, how?
Currently, Walmart has a debt level of 16%, and the cost of debt is minimized according to the scenario analysis. Furthermore, all its leverage ratios are very good and have been for the last years. Therefore we do not see the need to move to a different level of debt. At the moment, Walmart has a WACC of 3.6%, the optimal would be 3.01%. However, factors other than the WACC have to be considered. At an 80% debt level the cost of capital is minimized, the cost of debt would rise only a bit (to 2.08%, from 2% now), but the cost of equity would rise to 6.73% (it was 3.8% in FY 2015). The risk of default would rise enormously, and the company might lose trust from investors and shareholders, with the latter imposing restrictive covenants on Walmart. Furthermore, more than 50% of shares are owned by the Walton family, who would not be in favor of increasing the risk of their company. For all these reasons, we would not recommend Walmart to move to a debt level of 80%.
26
Part 5
11) Evaluation of cash redistribution to shareholders
11.1 Cash redistributed to shareholder (dividends and buybacks)
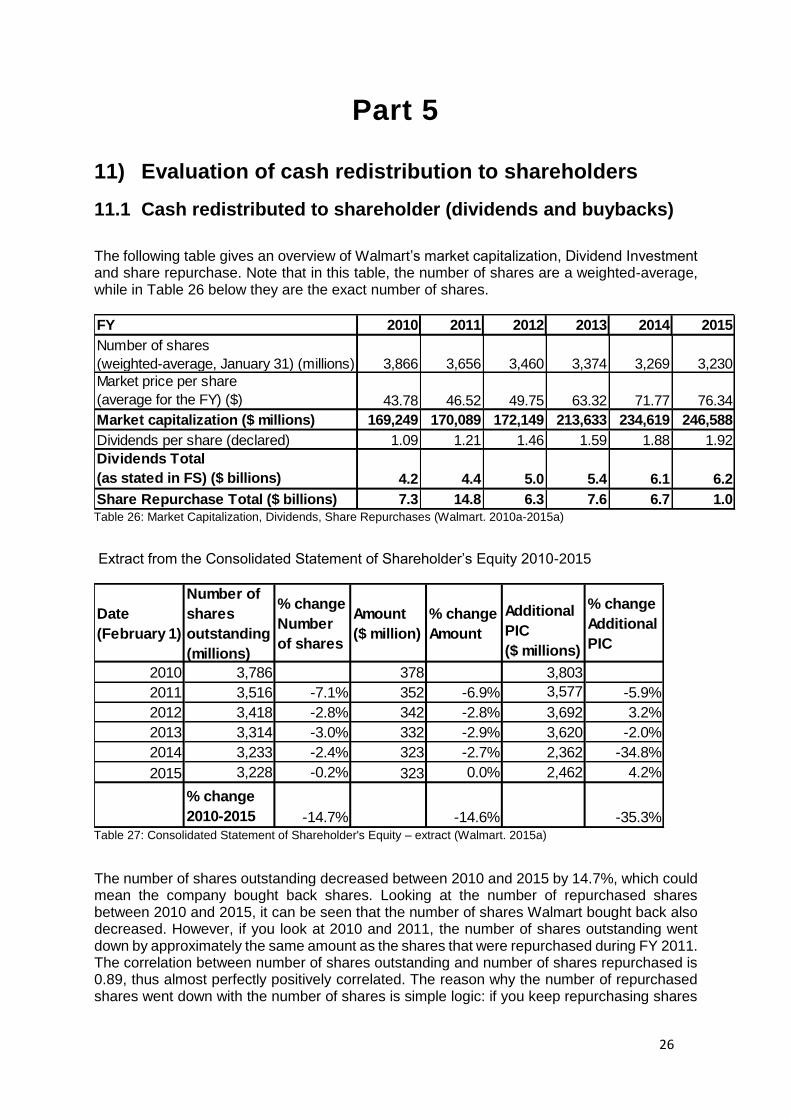
The following table gives an overview of Walmart’s market capitalization, Dividend Investment and share repurchase. Note that in this table, the number of shares are a weighted-average, while in Table 26 below they are the exact number of shares.
Extract from the Consolidated Statement of Shareholder’s Equity 2010-2015
The number of shares outstanding decreased between 2010 and 2015 by 14.7%, which could mean the company bought back shares. Looking at the number of repurchased shares between 2010 and 2015, it can be seen that the number of shares Walmart bought back also decreased. However, if you look at 2010 and 2011, the number of shares outstanding went down by approximately the same amount as the shares that were repurchased during FY 2011. The correlation between number of shares outstanding and number of shares repurchased is 0.89, thus almost perfectly positively correlated. The reason why the number of repurchased shares went down with the number of shares is simple logic: if you keep repurchasing shares
FY 2010 2011 2012 2013 2014 2015
Number of shares
(weighted-average, January 31) (millions) 3,866 3,656 3,460 3,374 3,269 3,230
Market price per share
(average for the FY) ($) 43.78 46.52 49.75 63.32 71.77 76.34
Market capitalization ($ millions) 169,249 170,089 172,149 213,633 234,619 246,588
Dividends per share (declared) 1.09 1.21 1.46 1.59 1.88 1.92
Dividends Total
(as stated in FS) ($ billions) 4.2 4.4 5.0 5.4 6.1 6.2
Share Repurchase Total ($ billions) 7.3 14.8 6.3 7.6 6.7 1.0Table 26: Market Capitalization, Dividends, Share Repurchases (Walmart. 2010a-2015a)
Date
(February 1)
Number of
shares
outstanding
(millions)
% change
Number
of shares
Amount
($ million)
% change
Amount
Additional
PIC
($ millions)
% change
Additional
PIC
2010 3,786 378 3,803
2011 3,516 -7.1% 352 -6.9% 3,577 -5.9%
2012 3,418 -2.8% 342 -2.8% 3,692 3.2%
2013 3,314 -3.0% 332 -2.9% 3,620 -2.0%
2014 3,233 -2.4% 323 -2.7% 2,362 -34.8%
2015 3,228 -0.2% 323 0.0% 2,462 4.2%
% change
2010-2015 -14.7% -14.6% -35.3%Table 27: Consolidated Statement of Shareholder's Equity – extract (Walmart. 2015a)

27
you reduce the number of outstanding shares. Thus the amount the company repurchased every year automatically becomes less with less outstanding shares.
Year
Number of
shares
repurchased
(millions
% change
Number of
shares
Average
price paid
per share ($)
% change
average
price
2010
2011 279 53.03
2012 115 -58.7% 55 3.0%
2013 113 -1.8% 67.15 22.9%
2014 89 -21.3% 74.99 11.7%
2015 13 -85.0% 76 1.1%
% change
2010-2015 -95.2% 43.0%Table 28: Share repurchases and price paid (based on data from annual reports 2010-2015)
Year
Dividends
($ billion)
% change
Dividends
Buybacks
($ billion)
% change
Buybacks
20104.2 7.3
20114.4 4.8% 14.8 102.7%
20125 13.6% 6.3 -57.4%
2013
5.4 8.0% 7.6 20.6%
20146.1 13.0% 6.7 -12.1%
20156.2 1.6% 1.0 -84.8%
% change
2010-2015 47.6% -86.1%
Table 29: Dividends and Buybacks (based on data from annual reports 2010-2015)

28
11.2 Walmart’s FCFE
Walmart’s Free Cash Flow to Equity was positive over all the years, and has decreased a lot between FY 2014 and 2015.
11.3 Recap on Investment quality
Both ROE and ROC cover their respective costs. I tried calculating the Jensen’s Alpha based on the formula a > rf*(1-β), but due to the large intercept (24.4%), the annualized excess return is very unrealistic (1257%). Therefore I recalculated it with the formula total expected return – CAPM. Then the Jensen’s Alpha is 12.80%; the function of total stock return minus cost of equity is true, therefore Walmart did 12.80% better than expected during the regression period. Put in different words, investors get 12.80% more return over the firm-specific risk of the company. Overall, the situation looks quite good and Walmart seems to create value.
11.4 Dividend policy and recommendations for the future
The company paid out more than its FCFE in almost all the years except 2011 and 2012. In 2015, it paid out more than 300% of its FCFE. This is an extremely high payout ratio.
FCFE 2010 2011 2012 2013 2014 2015
Net Income + 14,335 16,389 15,699 16,999 16,022 16,363
Depreciation - 7,200 7,600 8,130 8,501 8,870 9,173
Capital Expenditures - 12,184 12,699 13,510 12,898 13,115 12,174
Change in Working Capital + (789) 639 (734) (4,553) 3,718 6,166
Net Borrowings
(debt issued - debt repaid) (1,520) 7,819 3,485 1,487 3,015 (5,018)
FCFE 8,620 18,470 14,538 18,642 11,074 2,178Table 30: Free Cash Flow to Equity (based on data from annual reports 2010-2015)
ROC WACC ROE Cost of Equity Jensen's Alpha
15.51% 3.6% 19.56% 3.8% 12.80%Table 31: Investment quality (based on data from annual reports, 2010-2015)
Payout Ratio 2010 2011 2012 2013 2014 2015
Dividends (millions) 4,200 4,400 5,000 5,400 6,100 6,200
Earnings (millions) 14,335 16,389 15,699 16,999 16,022 16,363
Payout Ratio 29.30% 26.85% 31.85% 31.77% 38.07% 37.89%
Buybacks (millions 7,300 14,800 6,300 7,600 6,683 1,015
Total Cash Returned (millions) 11,500 19,200 11,300 13,000 12,783 7,215
FCFE (millions) 8,620 18,470 14,538 18,642 11,074 2,178
Distribution/FCFE 133.4% 104.0% 77.7% 69.7% 115.4% 331.3%
Table 32: Payout Ratio and Distribution (based on data from annual reports 2010-2015)

29
Over the years Walmart increased its dividend payout ratio to around 38%, meaning they paid more out to shareholders versus what they kept to reinvest in the company than in the previous years. The Dividend Yield ratio stayed more or less constant at a level of around 3%. The Dividend Yield ratio measure how much a company pays out in dividends relative to its shares price.
More than 50% of Walmart’s shares are owned by the Walton family. This could a reason for the high payout ratio. For future recommendations, I would suggest reducing the payout ratio from 300%, which would not be feasible in the long-term anyway.
11.5 Comparison with competitors
The Dividend Yield ratio is pretty much the same for Walmart’s competitors, around 1%, which is also the industry average. Walmart has the highest ratio with 2.51%. Tesco has the highest dividend payout ratio with more than 100%. All the other companies have a payout ratio of between 20 and 40%. The Industry average is around 14%, so slightly below that.
Dividend Payout + Yield 2010 2011 2012 2013 2014 2015
Dividend per share 1.09 1.21 1.46 1.59 1.88 1.92
EPS 3.71$ 4.48$ 4.54$ 5.04$ 4.90$ 5.07$
Price per share 43.78$ 46.52$ 49.75$ 63.32$ 71.77$ 76.34$
Dividend Payout 29.4% 27.0% 32.2% 31.6% 38.4% 37.9%
Dividend Yield 2.5% 2.6% 2.9% 2.5% 2.6% 2.5%
Table 33: Dividend Payout and Yield ratio (based on data from annual reports 2010-2015)
FY 2015 Dividend Yield Dividend PayoutMarket Cap.
(millions)
Wal Mart 2.51% 37.9% 246,588
Carrefour 1.53% 29.0% 21,819
Tesco 0.62% 135.0% 20,570
Costco Wholesale Corp 0.93% 28.0% 70,606
Kroger 0.97% 18.0% 36,660
Industry Average 1.03% 13.87% $76,414.59Table 34: Dividend Yield and Payout ratio, Comparison with competitors (GuruFocus. 2015b, GuruFocus. 2015d, GuruFocus. 2015f, GuruFocus. 2015h, Walmart 2015a)

30
12) Table of Abbreviations
In alphabetical order. Avg. Average BV Book Value CAPM Capital Asset Pricing Model CCC Cash Conversion Cycle CEO Chief Executive Officer CFO Chief Financial Officer CP Commercial Paper D Debt D/E Ratio Debt to Equity Ratio D1 Dividend next year E Equity EBIT Earnings before Interest and Taxes EBITDA Earnings before Interest, Taxes, Depreciation, Amortization EPS Earnings per Share Est. Estimate EVP Executive Vice President F Measure of goodness of fit FCFE Free Cash Flow to Equity FY Fiscal Year IPO Initial Public Offering L-T Long-term Market Cap Market Capitalization MV Market Value No. Number p Measure of statistical significance P/E Ratio Price-Earnings Ratio P0 Price this year PIC Paid-in Capital Qtr. Quarter R / r Interest rate R2 Measure of variance and volatility Rd / rd Cost of Debt Re / re Cost of Equity Rf / rf Risk-free rate ROA Return on Assets ROC Return on Capital ROCE Return on Capital Employed ROE Return on Equity ROIC Return on Invested Capital ROS Return on Sales S-T Short-term T / t Tax rate WACC Weighted-Average Cost of Capital
13) List of Tables
TABLE 1: FISCAL YEAR VS ACTUAL YEAR ......................................................................................... 3 TABLE 2: BREAKDOWN OF OWNERSHIP ........................................................................................... 4 TABLE 3: COMPENSATION OF TOP MANAGEMENT, BASED ON PROXY STATEMENTS 2011-
2015 (WALMART. 2011B-2015B) ................................................................................................... 7 TABLE 4: CREDIT RATINGS (WALMART. 2010A-2015A) .................................................................... 8

31
TABLE 5: FREE FLOAT AND TRADING VOLUME (WALMART. 2015A ) (FINANCE, YAHOO. 2015D)
......................................................................................................................................................... 9 TABLE 6: ANALYSTS: GROWTH EST. (FINANCE, YAHOO. 2015A) ................................................... 9 TABLE 7: ANALYSTS: EARNINGS EST. (FINANCE, YAHOO. 2015A) .............................................. 10 TABLE 8: ANALYSTS: REVENUE EST. (FINANCE, YAHOO. 2015A) ................................................ 10 TABLE 9: PROFITABILITY: ROE AND COST OF EQUITY (BASED ON DATA FROM ANNUAL
REPORTS 2010-2015) .................................................................................................................. 13 TABLE 10: PROFITABILITY: ROIC AND WACC (BASED ON DATA FROM ANNUAL REPORTS
2010-2015) .................................................................................................................................... 13 TABLE 11: PROFITABILITY: ROCE AND WACC (BASED ON DATA FROM ANNUAL REPORTS
2010-2015) .................................................................................................................................... 13 TABLE 12: LIQUIDITY: CASH CONVERSION CYCLE (BASED ON DATA FROM ANNUAL REPORTS
2010-2015) .................................................................................................................................... 14 TABLE 13: LEVERAGE: VARIOUS RATIOS (BASED ON DATA FROM ANNUAL REPORTS 2010-
2015) .............................................................................................................................................. 15 TABLE 14: BETA COMPARISON (FINANCE, YAHOO. 2015C), (FINANCE, GOOGLE. 2015),
(REUTERS. 2015B), (NASDAQ. 2015) ......................................................................................... 16 TABLE 15: OWNERSHIP BREAKDOWN ............................................................................................. 16 TABLE 16: REGRESSION OUTPUT – PART 1 .................................................................................... 17 TABLE 17: REGRESSION OUTPUT - PART 2 .................................................................................... 17 TABLE 18: CREDIT RATINGS (WALMART. 2010A-2015A) ................................................................ 17 TABLE 19: WACC CALCULATION (BASED ON DATA FROM ANNUAL REPORTS 2010-2015 AND
DAMODARAN. 2015) .................................................................................................................... 18 TABLE 20: CAPM CALCULATION (BASED ON DATA FROM ANNUAL REPORTS 2010-2015 AND
DAMODARAN. 2015) .................................................................................................................... 18 TABLE 21: DIVIDEND DISCOUNT MODEL (BASED ON DATA FROM ANNUAL REPORTS 2010-
2015) .............................................................................................................................................. 18 TABLE 22: DIVIDEND DISCOUNT MODEL – WACC (BASED ON DATA FROM ANNUAL REPORTS
2010-2015) .................................................................................................................................... 18 TABLE 23: DIVIDEND PER SHARE AND % CHANGE (WALMART. 2010A-2015A) .......................... 19 TABLE 24: INTEREST TAX SHIELD (BASED ON DATA FROM ANNUAL REPORTS 2010-2015) ... 20 TABLE 25: D/E RATIO - COMPARISON WITH COMPETITORS (GURUFOCUS 2015A,
GURUFOCUS. 2015C, GURUFOCUS. 2015E, GURUFOCUS. 2015G, WALMART. 2015A) ..... 23 TABLE 26: MARKET CAPITALIZATION, DIVIDENDS, SHARE REPURCHASES (WALMART. 2010A-
2015A) ........................................................................................................................................... 26 TABLE 27: CONSOLIDATED STATEMENT OF SHAREHOLDER'S EQUITY – EXTRACT
(WALMART. 2015A) ...................................................................................................................... 26 TABLE 28: SHARE REPURCHASES AND PRICE PAID (BASED ON DATA FROM ANNUAL
REPORTS 2010-2015) .................................................................................................................. 27 TABLE 29: DIVIDENDS AND BUYBACKS (BASED ON DATA FROM ANNUAL REPORTS 2010-
2015) .............................................................................................................................................. 27 TABLE 30: FREE CASH FLOW TO EQUITY (BASED ON DATA FROM ANNUAL REPORTS 2010-
2015) .............................................................................................................................................. 28 TABLE 31: INVESTMENT QUALITY (BASED ON DATA FROM ANNUAL REPORTS, 2010-2015) .. 28 TABLE 32: PAYOUT RATIO AND DISTRIBUTION (BASED ON DATA FROM ANNUAL REPORTS
2010-2015) .................................................................................................................................... 28 TABLE 33: DIVIDEND PAYOUT AND YIELD RATIO (BASED ON DATA FROM ANNUAL REPORTS
2010-2015) .................................................................................................................................... 29 TABLE 34: DIVIDEND YIELD AND PAYOUT RATIO, COMPARISON WITH COMPETITORS
(GURUFOCUS. 2015B, GURUFOCUS. 2015D, GURUFOCUS. 2015F, GURUFOCUS. 2015H,
WALMART 2015A) ........................................................................................................................ 29

32
14) List of Figures
FIGURE 1: EXECUTIVE COMPENSATION ........................................................................................... 6 FIGURE 2: OPTIMAL CAPITAL STRUCTURE: FIRM VALUE AND COST OF CAPITAL (BASED ON
DATA FROM ANNUAL REPORTS 2010-2015) ............................................................................ 22 FIGURE 3: OPTIMAL CAPITAL STRUCTURE: WACC, COST OF EQUITY, COST OF DEBT (BASED
ON DATA FROM ANNUAL REPORTS 2010-2015) ..................................................................... 23
15) Bibliography
Christensen, Rika. 2013. Addicting Info. Wal-Mart’s Employment Mode is a Recipe for Eventual Self-Destruction. Cited on December 7, 2015 at: http://www.addictinginfo.org/2013/07/16/walmarts-employment-model-is-a-recipe-for-eventual-self-destruction/ CNBC. Earnings. 2015. Wal-Mart earnings beat expectations; shares up. Cited on December 5, 2015 at: http://www.cnbc.com/2015/11/17/walmart-quarterly-earnings.html CSI Market Stocks. 2015. Wal-Mart Stores INC, Net Income per Employee. Cited on December 5, 2015 at: http://csimarket.com/stocks/singleEfficiencyeit.php?code=WMT Damodaran, Aswath. 2015. Damodaran Online. Cited on December 3, 2015 at: http://people.stern.nyu.edu/adamodar/ Finance, Google. 2015. Wal-Mart Stores Inc. Cited on November 30 at: http://www.google.com/finance?cid=38230 Finance, Yahoo. 2015a. Analyst Estimates. Cited on October 12 at: http://finance.yahoo.com/q/ae?s=wmt+Analyst+Estimates Finance, Yahoo. 2015b. Major Holders. Cited on October 5 at: https://finance.yahoo.com/q/mh?s=WMT+Major+Holders Finance, Yahoo. 2015c. Wal-Mart Stores Inc. Cited on December 9, 2015 at: https://finance.yahoo.com/q/ks?s=WMT Finance, Yahoo. 2015d. Wal-Mart Stores Inc. Historical Prices. Cited on November 15 at: http://finance.yahoo.com/q/hp?s=WMT+Historical+Prices Forbes. 2015. Why Wal-Mart's Revenue Per Square Feet Will Improve Going Forward. Cited on December 5, 2015 at: http://www.forbes.com/sites/greatspeculations/2014/12/19/why-wal-marts-revenue-per-square-feet-will-improve-going-forward/ GuruFocus. 2015a. Carrefour Debt to Equity. Cited on December 5, 2015 at: http://www.gurufocus.com/term/deb2equity/CRRFY/Debt%252Bto%252BEquity/Carrefour GuruFocus. 2015b. Carrefour Dividend Yield and Payout. Cited on December 3, 2015 at: http://www.gurufocus.com/term/yield/CRRFY/Dividend%2BYield/Carrefour GuruFocus. 2015c. Costco Wholesale Corp Debt to Equity. Cited on December 5, 2015 at: http://www.gurufocus.com/term/deb2equity/COST/Debt+to+Equity+%2528%2525%2529/Costco+Wholesale+Corp

33
GuruFocus. 2015d. Costco Wholesale Corp Dividend Yield and Payout. Cited on December 5, 2015 at: http://www.gurufocus.com/term/yield/COST/Dividend%2BYield/Costco%2BWholesale%2BCorp GuruFocus. 2015e. Kroger Debt to Equity. Cited on December 5, 2015 at: http://www.gurufocus.com/term/deb2equity/KR/Debt%2Bto%2BEquity/The%2BKroger%2BCo GuruFocus. 2015f. Kroger Dividend Yield and Payout. Cited on December 3, 2015 at: http://www.gurufocus.com/term/yield/KR/Dividend%2BYield/The%2BKroger%2BCo GuruFocus. 2015g. Tesco Debt to Equity. Cited on December 5, 2015 at: http://www.gurufocus.com/term/deb2equity/OTCPK:TSCDY/Debt%2Bto%2BEquity%2B%2528%2525%2529/Tesco%2BPLC GuruFocus. 2015h. Tesco Dividend Yield and Payout. Cited on December 3, 2015 at: http://www.gurufocus.com/term/yield/OTCPK:TSCDY/Dividend%2BYield/Tesco%2BPLC Gustafson, Krystina. CNBC. 2015. What Wal-Mart’s wage woes mean for Gap, TJX. Cited on December 7, 2015 at: http://www.cnbc.com/2015/10/16/what-wal-marts-wage-woes-mean-for-gap-tjx.html Hennessy’s Index. 2013. Rabble.ca. A number is never just a number: Wal-Mart or Costco. Cited on December 7, 2015 at: http://rabble.ca/columnists/2013/11/number-never-just-number-wal-mart-or-costco Hill, Catey. 2015. Marketwatch. 4 reasons Walmart is the most-hated retailer in America. Cited on December 8, 2015 at: http://www.marketwatch.com/story/4-reasons-walmart-is-the-most-hated-retailer-in-america-2015-02-18 Hopkins, Curt. 2015. Alternet. The Real Reason Walmart U-Turned on Wages. Cited on December 10 at: http://www.alternet.org/labor/real-reason-walmart-u-turned-wages Huffington Post. 2012. Articles. Cited on October 6, 2015 at: http://www.huffingtonpost.com/news/walmart-shareholders/ Investopedia Staff. n.d. The Industry Handbook. The Retailing Industry. Cited on December 7, 2015 at: http://www.investopedia.com/features/industryhandbook/retail.asp La Monica, Paul R. 2015. CNN Money. Walmart: Wage hikes are killing our profits. Cited on December 8, 2015 at: http://money.cnn.com/2015/10/14/investing/walmart-outlook-wages/index.html Lariviere, Marty. 2015. Operationsroom, Wordpress. Higher wages and employee turnover. Cited on December 10, 2015 at: https://operationsroom.wordpress.com/2015/03/19/higher-wages-and-turnover/ Layne, Nathan. 2015a. Wal-Mart puts the squeeze on suppliers to share its pain as earnings sag. Cited on December 5, 2015 at: http://www.reuters.com/article/2015/10/19/us-wal-mart-suppliers-insight-idUSKCN0SD0CZ20151019#OdUTCkdbsuAOakZ7.97
34
Layne, Nathan. 2015b. Walmart Earnings Beat Expectations; Shares Rise. Cited on December 4, 2015 at: http://www.dailyfinance.com/2015/11/17/walmart-earnings/ Layne, Nathan. 2015c. Reuters. Wal-Mart scrimped on hiring as store space grew rapidly. Cited on December 8 at: http://news.yahoo.com/wal-mart-scrimped-hiring-store-space-grew-rapidly-124916030.html Logan, John. 2014. In these times and the Institute for Public Affairs. Walmart’s Fishy Claim of 86 Percent Employee Satisfaction. Cited on December 7, 2015 at: http://inthesetimes.com/article/14279/discounting_lives_walmart_impoverishes_workers_at_home_and_endangers_them_o Moody’s Investors Service. 2015. Cited on November 4, 2015 at: https://www.moodys.com/research/Moodys-affirms-Walmarts-ratings-Aa2-long-term-and-Prime-1--PR_336536 Morningstar. 2015. Shareholders. Wal-Mart Stores Inc. Cited on 5.10.2015 at: http://investors.morningstar.com/ownership/shareholders-major.html?t=WMT®ion=usa&culture=en-US&ownerCountry=USA Nasdaq. 2015. Wal-Mart Stores Inc. Cited on November 27 at: http://www.nasdaq.com/symbol/wmt Nassauer, Sarah. 2015. Wall Street Journal. Wal-Mart Shrinks the Big Box, Vexing Vendors. Cited on December 6, 2015 at: http://www.wsj.com/articles/wal-mart-shrinks-the-big-box-vexing-vendors-1445820469 Osten, Matt. Vahey, Chris. Champagne, Matt. n.d. Wal-Mart vs Target SAR. Cited on December 7, 2015 at: https://sites.google.com/site/walmartvstargetsar2/home Oyedele, Akin. 2015. Business Insider UK. WALMART WARNS: Our profits will fall next year. Cited on December 10 at: http://uk.businessinsider.com/wal-mart-cuts-profit-outlook-2015-10?&platform=bi-androidapp?r=US&IR=T Peterson, Hayley. 2015. Business Insider. Walmart outlines strategies for growth. Cited on December 5, 2015 at: http://uk.businessinsider.com/wal-mart-outlines-strategies-for-growth-2015-2?r=US&IR=T Peterson, Hayley. 2015. Business Insider. Walmart, Target and TJ Maxx are facing a worker crises. Cited on December 7, 2015 at: http://uk.businessinsider.com/walmart-target-and-tj-maxx-are-facing-a-worker-crisis-2015-10?r=US&IR=T Rego, Matt. Investopedia. n.d. Why Wal-Mart’s Stock Price keeps falling. Cited on December 7, 2015 at: http://www.investopedia.com/articles/markets/111115/why-walmarts-stock-price-keeps-falling.asp?partner=mediafed Reuters. 2015a. The Globe and Mail. IMF study finds hiring more women can boost growth. Cited December 8, 2015 at: http://www.theglobeandmail.com/report-on-business/economy/imf-study-finds-hiring-more-women-can-boost-growth/article26943669/ Reuters. 2015b. Wal-Mart Stores Inc. Cited on November 25 at: http://www.reuters.com/finance/stocks/overview?symbol=WMT.N

35
Sandberg, Erik. n.d. The retail Industry In Western Europe. Trends, facts and logistics challenges. Cited on December 7, 2015 at: http://liu.diva-portal.org/smash/get/diva2:309658/FULLTEXT01.pdf Stock Analysis on Net. 2015. Costco Wholesale Corp. Cited on December 5, 2015 at: https://www.stock-analysis-on.net/NASDAQ/Company/Costco-Wholesale-Corp/Ratios/Long-term-Debt-and-Solvency Stock Analysis on Net. 2015. Wal-Mart Stores Inc. Profitability Analysis. Cited on December 5, 2015 at: https://www.stock-analysis-on.net/NYSE/Company/Wal-Mart-Stores-Inc/Ratios/Profitability The Financial Times LTD. 2015a. Tesco PLC. Cited on December 5, 2015 at: http://markets.ft.com/research/Markets/Tearsheets/Financials?s=TSCO:LSE The Financial Times LTD. 2015b. Wal Mart Stores Inc. Cited on December 9, 2015 at: http://markets.ft.com/research/Markets/Tearsheets/Summary?s=WMT:NYQ Walmart. 2015a. Annual Report. Cited on November 5, 2015 at: http://s2.q4cdn.com/056532643/files/doc_financials/2015/annual/2015-annual-report.pdf Walmart. 2015b. Proxy Statement. Cited on December 11, 2015 at: http://s2.q4cdn.com/056532643/files/doc_financials/2015/annual/2015-proxy-statement.pdf Walmart. 2014a. Annual Report. Cited on November 5, 2015 at: http://s2.q4cdn.com/056532643/files/doc_financials/2014/Annual/2014-annual-report.pdf Walmart. 2014b. Proxy Statement. Cited on December 11, 2015 at: http://s2.q4cdn.com/056532643/files/doc_financials/2014/Annual/2014-proxy-statement.pdf Walmart. 2013a. Annual Report. Cited on November 5, 2015 at: http://s2.q4cdn.com/056532643/files/doc_financials/2014/Annual/2014-annual-report.pdf Walmart. 2013b. Proxy Statement. Cited on December 11, 2015 at: http://s2.q4cdn.com/056532643/files/doc_financials/2013/Annual/2013-proxy-statement-for-walmart-stores-inc_130221025125760317.pdf Walmart. 2012a. Annual Report. Cited on November 5, 2015 at: http://s2.q4cdn.com/056532643/files/doc_financials/2012/Annual/2012-annual-report-for-walmart-stores-inc_130221023846998881.pdf Walmart. 2012b. Proxy Statement. Cited on December 11, 2015 at: http://s2.q4cdn.com/056532643/files/doc_financials/2012/Annual/2012-proxy-statement-for-walmart-stores-inc_130221024194646231.pdf Walmart. 2011a. Annual Report. Cited on November 5, 2015 at: http://s2.q4cdn.com/056532643/files/doc_financials/2011/Annual/2011-annual-report-for-walmart-stores-inc_130221022810084579.pdf Walmart. 2011b. Proxy Statement. Cited on December 11, 2015 at: http://s2.q4cdn.com/056532643/files/doc_financials/2011/Annual/2011-proxy-statement-for-walmart-stores-inc_130221023203045705.pdf

36
Walmart. 2010a. Annual Report. Cited on November 5, 2015 at: http://s2.q4cdn.com/056532643/files/doc_financials/2010/Annual/2010-annual-report-for-walmart-stores-inc_130221021765802161.pdf Walmart. 2010b. Proxy Statement. Cited on December 11, 2015 at: http://s2.q4cdn.com/056532643/files/doc_financials/2010/Annual/2010-proxy-statement-for-walmart-stores-inc_130221022355965651.pdf Wal-Mart Stores, Inc. 2015a. Corporate & Financial Facts. Cited on December 5, 2015 at: http://corporate.walmart.com/_news_/walmart-facts/corporate-financial-fact-sheet Wal-Mart Stores, Inc. 2015b. Corporate Governance. Governance documents. Cited on December 7, 2015 at: http://stock.walmart.com/investors/corporate-governance/governance-documents/ Wal-Mart Stores, Inc. 2015c. Our History. Cited on December 11, 2015 at: http://corporate.walmart.com/our-story/our-history Wal-Mart Stores, Inc. 2015d. Stock Information. Cited on December 9, 2015 at: http://stock.walmart.com/investors/stock-information/quote-and-chart/ Ycharts. 2015. Wal-Mart Stores Debt to Equity Ratio. Cited on December 5, 2015 at: https://ycharts.com/companies/WMT/debt_equity_ratio Vanzo, R. 2015. Guru Focus. Is Wal-Mart a Buy After a 52-Week Low? Cited on December 8, 2015 at: http://www.gurufocus.com/news/338603/is-walmart-a-buy-after-a-52week-low Zimmermann, Ann. 2004. Wall Street Journal. Wal-Mart vs Costco. Cited on December 7, 2015 at: http://www.vizettes.com/perspectives/tc/walmart/walmart-vs-costco.htm