bmc bioinformatics biomed central · giulio pavesi* 1, federico zambelli and graziano pesole*2,3...
TRANSCRIPT

BioMed CentralBMC Bioinformatics
ss
Open AcceResearch articleWeederH: an algorithm for finding conserved regulatory motifs and regions in homologous sequencesGiulio Pavesi*1, Federico Zambelli1 and Graziano Pesole*2,3Address: 1Dipartimento di Scienze Biomolecolari e Biotecnologie, University of Milan, Milan, Italy, 2Dipartimento di Biochimica e Biologia Molecolare "E. Quagliariello", University of Bari, Bari, Italy and 3Istituto Tecnologie Biomediche – Consiglio Nazionale delle Ricerche, Bari, Italy
Email: Giulio Pavesi* - [email protected]; Federico Zambelli - [email protected]; Graziano Pesole* - [email protected]
* Corresponding authors
AbstractBackground: This work addresses the problem of detecting conserved transcription factorbinding sites and in general regulatory regions through the analysis of sequences from homologousgenes, an approach that is becoming more and more widely used given the ever increasing amountof genomic data available.
Results: We present an algorithm that identifies conserved transcription factor binding sites in agiven sequence by comparing it to one or more homologs, adapting a framework we previouslyintroduced for the discovery of sites in sequences from co-regulated genes. Differently from themost commonly used methods, the approach we present does not need or compute an alignmentof the sequences investigated, nor resorts to descriptors of the binding specificity of knowntranscription factors. The main novel idea we introduce is a relative measure of conservation,assuming that true functional elements should present a higher level of conservation with respectto the rest of the sequence surrounding them. We present tests where we applied the algorithmto the identification of conserved annotated sites in homologous promoters, as well as in distalregions like enhancers.
Conclusion: Results of the tests show how the algorithm can provide fast and reliable predictionsof conserved transcription factor binding sites regulating the transcription of a gene, with betterperformances than other available methods for the same task. We also show examples on how thealgorithm can be successfully employed when promoter annotations of the genes investigated aremissing, or when regulatory sites and regions are located far away from the genes.
BackgroundGenome sequencing projects have told researchers wheregenes are located, in human and an ever increasingnumber of other species, and microarrays and othersources of information can tell when genes are activated:but the complete understanding of how genes expressionis regulated at the transcriptional and post-transcriptional
levels, as well as the characterization of all the elementsinvolved in the process still remain an open question inmolecular biology. Transcription is a fundamental step inthe regulation of gene expression, and it is modulated bythe interaction of transcription factors (TFs) with theircorresponding binding sites (TFBS) on the DNA [1],mostly located near the transcription start site (TSS) of the
Published: 7 February 2007
BMC Bioinformatics 2007, 8:46 doi:10.1186/1471-2105-8-46
Received: 29 August 2006Accepted: 7 February 2007
This article is available from: http://www.biomedcentral.com/1471-2105/8/46
© 2007 Pavesi et al; licensee BioMed Central Ltd. This is an Open Access article distributed under the terms of the Creative Commons Attribution License (http://creativecommons.org/licenses/by/2.0), which permits unrestricted use, distribution, and reproduction in any medium, provided the original work is properly cited.
Page 1 of 14(page number not for citation purposes)
BMC Bioinformatics 2007, 8:46 http://www.biomedcentral.com/1471-2105/8/46
gene or far apart organized in cis-regulatory modules(CRMs, i.e. enhancers, silencers, etc.).
Computational methods for the discovery of conservedTFBSs (motifs) can be split into two broad categories: the'single species, many genes' approach [2], and the 'singlegene, many species' one [3]. In the former case, a set ofregions (i.e., promoters) from co-regulated genes are ana-lyzed looking for over-represented motifs, that is, theTFBSs responsible for the co-regulation of the genes; whilein the latter approach, known as phylogenetic footprinting (aterm first introduced in [4]), a single gene is investigated,and non coding regions flanking it are compared to theirhomologs in other species. Non coding sequence ele-ments that are found to be conserved by evolution arelikely to be involved in the regulation of the expression ofthe gene. Clearly, the two approaches can be merged, andeach of a set of co-regulated genes can be compared bothto its homologs, and to the others [5,6], and this analysiscan be also performed on a full-genomic scale [7-10].Given the ever increasing number of annotated genomicsequences available, phylogenetic footprinting hasbecome more and more widely used, since it avoids theneed of assembling a set of co-regulated genes (that inturn implies the need of building reliable datasets) andallows for the investigation of single genes alone.
The comparison of homologous non coding sequencescan be performed both for the identification of singleTFBSs, for example in promoter regions, and on a largerscale for the discovery of distal CRMs, an approach thathas been successful in several cases ever since the firsthuman-mouse comparisons have been possible (see [3]for a review). The available methods that are more com-monly used first build an alignment (either local or glo-bal) of the sequences investigated [11], or take advantageof the pre-computed full genomic alignments now availa-ble [12,13]. Then, one simple solution to identify con-served functional elements is to use descriptors of thebinding specificity of TFBSs (like position specific weightmatrices [14] provided for example in the TRANSFACdatabase [15]) and look for conserved aligned regions fit-ting the descriptor. This approach can be used both for thedetection of single TFBSs (see for example [16]) as well asof clusters of TFBSs likely to form conserved CRMs(among many others, [17,18]).
Methods of this kind have to face two issues: first of all,the need of reliable descriptors of the binding specificityof the different TFs. Usually, PWMs yield a large numberof false positive matches [19], and while requiring amatch to be conserved throughout different sequencesreduces them, the problem of defining whether a match issignificant in all the species considered remains. Second,and most important, is the need of having a reliable align-
ment of the sequences investigated. TFBSs tend to be quiteshort (6–15 nucleotides), when compared to a typicalregion analyzed (a promoter of 500–1000 bps): in casethe sequences aligned are too divergent, the result is thatconserved TFBSs can be missed simply because not cor-rectly aligned. A dual solution, of using matches of TFBSsas anchors for the alignment has indeed been proposed inorder to overcome this problem and improve alignmentreliability [20]. Sequence alignments are avoided by theFooter algorithm [21], that performs human-mouse com-parisons by using distinct descriptors for the TFBSs of thetwo species, and looks for matches for homologous TFsthat fall at similar positions with respect to the genes stud-ied.
When known TFBSs descriptors are not used, the idea isnaturally to identify elements or regions that can be con-sidered to be "significantly conserved", and hence likely topossess a regulatory function. The simplest strategy is justto single out the most conserved parts of the alignments,according to identity percentage: while a non-codingregion highly (or "ultra") conserved can be reasonablysuspected to possess a functional role [22,23], the prob-lem is often to define how much conserved regionsshould be to be considered significant. In fact, while con-served TFBSs and CRMs can be qualitatively defined as"islands of conservation in a sea of much less conservedDNA" [24], suitable measures able to quantify this con-cept have to be introduced [25]. Indeed, recent researchhas focused on this point. MBA is an algorithm that looksfor blocks of highly constrained alignments, weights themaccording to phylogenetic distance, and estimates signifi-cance according to neutral substitution rates [26]. A regu-latory potential (RP) score is defined in [27], by lookingfor patterns of conservation frequently found in con-served regulatory regions. Evolutionary and hiddenMarkov models are combined in phastCons [28], in orderto define a measure of significance for the conservation ofa multiple genomic alignment.
While all these methods can perform well in the identifi-cation of quite large conserved regulatory regions likeCRMs or whole promoters [29], they are less powerful forthe identification of single TFBSs. Size and conservation ofTFBSs are in fact often not enough to constitute "signifi-cant" parts of the alignments (or significant local align-ments) [30]. Another important issue is defining howmuch conserved a region should be to be considered asworth of further investigation. Different homologousgenomic regions, for example in a human-rodent compar-ison, show a varying degree of conservation, that is, seemto evolve at different rates [31]. Thus, for example, if aunique significance threshold is used in some cases awhole promoter region can be considered as "significantlyconserved" (thus missing the locations of single TFBSs),
Page 2 of 14(page number not for citation purposes)

BMC Bioinformatics 2007, 8:46 http://www.biomedcentral.com/1471-2105/8/46
while in others no significant sequence element isreported.
Indeed, some methods that do not compute a global orlocal sequence alignment have already been proposed.Several motif discovery algorithms for the detection ofconserved sequence elements in co-regulated genesalready exist [2,32], and sometimes have been successfullyapplied to homologous sequences as well [33]. Algo-rithms of this kind, however, assume that input sequencesare not related by evolution, and thus look for subtle sim-ilarities: the result is that a human-mouse comparison canreport a deluge of conserved motifs, regardless of the algo-rithmic strategy and significance evaluation employed.
Footprinter [34], instead, is an algorithm for the discoveryof conserved motifs explicitly devised for phylogeneticfootprinting, that looks for conserved sequence motifsmaking use of the phylogenetic relationships among thesequences. Motifs conservation is first of all evaluatedaccording to parsimony scores. While this approachbypasses the need of pre-aligning the sequences, parsi-mony scores alone do not provide a fine-grained rankingof the motifs found, especially when a few sequences areinvestigated, i.e., in a typical human-rodent comparison.A statistical evaluation of the results of the algorithm ispossible, by comparing motifs found with a "random"dataset of simulated orthologous sequences. The problemis, again, that even when the same species are comparedthe degree of conservation in the promoters of differentgenes can vary significantly according to the genes investi-gated, and thus establishing unique significance thresh-olds has the effect of yielding too many significant motifsin some cases, too few in others.
The aim of this work is to introduce a novel strategy toidentify significantly conserved motifs and regions inhomologous sequences. Given a reference sequence, andone or more homologs, the algorithm we propose is basedon the idea that functional conserved elements should beconserved both in sequence and in position with respectto the genes they regulate. Starting from this considera-tion, we adapted to this case a statistical measure we pre-viously used for the discovery of TFBSs in sequences fromco-regulated genes, by adding to it positional conserva-tion. Moreover, as we discussed before, defining absolutemeasures of significance for conservation is hard, giventhat sequence conservation varies greatly according to thespecies and the genes considered. We tackle this problemby measuring conservation not in an absolute, but in a rel-ative way, according to the average degree of conservationof the whole sequences compared, with the idea that func-tional elements should be more conserved than the rest:in other words, what the algorithm evaluates is not signif-icant conservation, but rather significant variation of con-
servation within the same sequences. Clearly, the motifsand regions selected by the algorithm can be further proc-essed by matching them against descriptors of knownTFBSs, or compared to regions extracted from other co-regulated genes.
ResultsIn this section we first present the algorithm, then weassess its performance showing results obtained on testsperformed on collections of known functional elements.
AlgorithmThe WeederH algorithm takes as input a referencesequence S, and any number k ≥ 1 of homologoussequences H1 ... Hk. Also, it assumes that all the sequenceshave been taken from the different genomes with respectto the same reference points: that is, all sequences areupstream of the TSS or the ATG codon of homologousgenes, or are intergenic regions between two genes andbetween their homologs in other species, and so on. Con-served motifs are identified in the reference sequence, bycomparing it to the homologs. The steps performed by thealgorithm can be summarized as follows:
1. Each oligo of suitable size of the reference sequence ismatched against the homologous sequences;
2. Matches not exceeding a given substitution thresholdare scored with a measure taking into account sequenceand position conservation, and the highest scoring matchis kept;
3. Oligo scores are transformed into relative scores,according to the average scores obtained by oligos of thesame size;
4. High scoring oligos are merged, whenever possible, inorder to obtain longer motifs and regions.
It can be immediately seen that we used for modeling con-served sites the oligos themselves, rather than moreinvolved representations of TFBSs like profiles and posi-tion weight matrices [14]. The latter are clearly more pow-erful than oligos and consensi for modeling the bindingspecificity of a given TF: however, for the ab initio discov-ery of novel motifs and sites, which in turn is essentiallybased on the detection of similar oligos and its statisticalevaluation [2], recent results have shown no definite prev-alence, and rather consensus- (or oligo-) based modelshave often yielded better results [32].
Finding conserved motifsIn the first step, each oligo of a given length m of the ref-erence sequence S is matched against each of the homol-ogous sequences, and all its occurrences with at most e
Page 3 of 14(page number not for citation purposes)
BMC Bioinformatics 2007, 8:46 http://www.biomedcentral.com/1471-2105/8/46
substitutions are collected. Given si, the m-mer at positioni of the reference sequence, a match at position j of the k-th homologous sequence Hk presenting d ≤ e substitutionsis scored by taking into account sequence and positionconservation:
Bk (i, j, m) = - log (E (si, d, k)) - log (Δ (i, j) + 1)
Where E(si, d, k) is the expected frequency of si with atmost d substitutions in the species of sequence k (seeMethods), and Δ (i,j) is the distance between the two posi-tions, measured according to the reference points defined(e.g. i and j bps upstream of the TSS of the respectivegenes). This function is similar to the one we employed inthe original Weeder algorithm [35,36], that anyway didnot make any assumption on the positional conservationof the motifs.
The score of oligo si with respect to the k-th homolog Hk isgiven by the maximum among the matching positions:
If no match is found for si in sequence Hk, or all matchesyield negative scores (that is, the distance exceeds theexpected value) this score is set to zero. At this point, theoverall score associated with si could be defined as thesum of the scores in each homologous sequence: but, theBk(i) values can vary greatly according to the overall con-servation of the sequences compared (e.g., a human-mouse comparison will yield scores greater than a human-chicken comparison). However, regardless of the speciesconsidered, the idea underlying the algorithm is that func-tional elements should be more conserved than the rest ofthe sequences: thus, instead of using directly the Bk(i)scores the algorithm first transforms them into relativescores. Let
and
Be the mean and the variance of the scores obtained by m-mers of the reference sequence when matched againstsequence Hk. The term |S| indicates the length of the ref-erence sequence. The score of each m-mer is standardizedinto a χ2 relative score:
The overall relative score for the m-mer at position i of thereference sequence is finally defined as the sum of the rel-ative score contributions of each homologous sequence:
χ2 scores are computed only when Bk (i, m) > μ (k,m) foreach homologous sequence Hk, otherwise it is set to zero.Concerning suitable values for the motif length m that hasto be considered, in the experiments we present in thisarticle we ran the algorithm on size m = 8 and m = 12,computing for each mean and variance values: longermotifs or regions are detected by combining and mergingshorter ones, as explained in the following section.
Merging motifsVery often, the regulation of the transcription of aneukaryotic gene is the result of the simultaneous action ofdifferent TFs. Binding sites for cooperative or competitivefactors are often adjacent or overlapping each other, withthe result that regions longer than a single site are oftenfound to be conserved throughout different species. Inorder to detect explicitly these regions, in the second stepthe algorithm merges motifs adjacent in the referencesequence (e.g., motif m1 in position i of length l and motifm2 in position i + l), if their best occurrences (the ones thatwere used to compute their scores) are adjacent in all thehomologs.
Since the occurrences of the two motifs do not overlapand are independent, the sum of the original Bi scores oftwo motifs m1 and m2 (denoted here for sake of simplicityas Bi(m1) and Bi(m2)) has mean μ1 i + μ2 i and variance σ2
1
i+σ22 i, that is, are the sum of mean and variance of the first
and second motif Bi scores, respectively, computedaccording to the motifs' length for each homologoussequence Hi. The resulting χ2 score of the merged motifcan be then defined as:
Merging is performed by the algorithm only on motifsthat in the first step had positive χ2 score, and thus weremore conserved than the average in each homologoussequence. This step is iterated for each position of the ref-erence sequence, that is, single motifs are first comparedto the adjacent ones; then, motifs resulting from mergingare compared to the adjacent ones, and so on until no fur-ther merging is possible. The result is that in this way long
B i m B i j mkj
k( , ) max ( , , )=
μ( , )( , )
k mB i m
S mki=
− +∑
1
σμ2
2
1( , )
( ( , ) ( , ))k m
B i m k m
S mki=
−
− +∑
χ μσ
kki m
B i m k m
k m2
2
2( , )
( ( , ) ( , ))
( , )=
−
χ χ2 2( , ) ( , )i m i mkk
= ∑
χ μ μσ σ
21 2
1 2 1 22
12
22
( )( ( ) ( ) )
m mB m B mi i i i
i ii
=+ − −
+∑
Page 4 of 14(page number not for citation purposes)

BMC Bioinformatics 2007, 8:46 http://www.biomedcentral.com/1471-2105/8/46
conserved regions can be detected, but the regions have tobe conserved also locally: they must be built by fragmentsthat, taken singularly, fit our model for conserved TFBSs.Thus, in the merging step the algorithm is able to detectregions of size 16, 20, 24, and so on.
Input parametersThe only parameters needed by the algorithm, other thanthe species of origin of the input sequence, are the motifs'size and the maximum number of substitutions allowedwhen collecting occurrences. As introduced before, in ourexperiments we used oligos of length m = 8 and 12, withe = 2 and 3 substitutions, respectively. The choice of theseparameters was based first of all on the parameters used inthe original Weeder algorithm, and also on studies thatshowed how variation of 25% of the sequence seems to bea critical value, at least for human-rodent comparisons.This, in turn, implies that also longer regions must presentat most 25% of substitutions in their occurrences in thehomologs. Usually, TFBSs presenting 30% or more muta-tions in their homologs are in fact much less likely to pre-serve their function [37].
OutputIn a typical application, like a human-rodents compari-son, several overlapping motifs (before and after merging)with positive χ2 scores are found. To trim down the size ofthe output, the algorithm avoids reporting motifs thatoverlap by more than 2 bps for eightmers, 3 bps fortwelve-mers, and 4 bps for longer motifs, with a simpletop-down greedy procedure. If a motif overlaps anothermotif with higher score by more than the defined numberof nucleotides, it is removed from the ranked output ofmotifs.
An example of a typical output of the algorithm is shownin Figure 1, for the 500 bp upstream and non-coding firstexon of the p53 gene of human, mouse, and rat. The high-est scoring motifs are shown, displayed within a UCSCgenome browser window. Known TFBSs annotated for thehuman gene in the TRANSFAC database are also shown. Itcan be seen how a quite long region has been reported, onwhich adjacent binding sites map, while other shortermotifs are scattered along the sequence, the distal onesfalling within a region not deemed to be conservedaccording to genomic alignments ("Conservation" track).We also show the location on the human sequence ofmotifs predicted by MEME [38] (run in one occurrenceper sequence mode), that cover most of the sequenceitself: in fact, since algorithms of this kind are mainlyaimed at the detection of very subtle similarities [2], thehigh level of overall conservation and the few sequencesavailable lead to the prediction of several long signifi-cantly conserved motifs.
Experimental setupTo test the algorithm, we used data taken from the ABSdatabase [39], a collection of experimentally validatedtranscription factor binding sites conserved in at least twospecies, together with the homologous promoters con-taining them. We retrieved from the database 99 sets ofhomologous sequences 500 bps long, containing a totalof 302 experimentally validated binding sites. Sevensequence sets contained human-mouse-rat sequences, 66a human-mouse pair, 17 a human-rat pair, and 9 mouse-rat sequences. We used these data first to build simulateddatasets, then to test the algorithm on real orthologoussequences.
Results on simulated sequencesWe built a dataset of simulated sequences as follows. Foreach human sequence retrieved from the database, wegenerated simulated mouse and rat sequences by usingthe Dawg program [40], that permits the simulation ofsequence evolution also including insertion and dele-tions. We set different substitution rates yielding differentsequence identity percentages, while gap and the otherparameters needed were estimated by the Dawg algorithmfrom the alignment of the sequences retrieved from thedatabase. Since our algorithm selects motifs according tomaximum substitution rates, rather than defining substi-tution rates also for the evolution of binding sites wechose to use the original sites annotated in the ABS data-
An example of the output of WeederHFigure 1An example of the output of WeederH. An example of the output of WeederH, showing the highest scoring motifs in core promoter and first non-coding exon of the human p53 gene, compared to mouse and rat homologs. Motifs are displayed within the UCSC genome browser. Sites annotated in the TRANSFAC database are shown in green. The longest (and highest scoring) motif encompasses several adjacent sites. Regulatory potential (RP) score [27] and phastCons [45] tracks are also displayed (see Results), together with the motifs output by MEME [38] on the same dataset (run in "oops" mode).
Page 5 of 14(page number not for citation purposes)

BMC Bioinformatics 2007, 8:46 http://www.biomedcentral.com/1471-2105/8/46
base. Thus, once a simulated rodent sequence set was gen-erated, we selected a single site annotated in the humansequence and we planted its annotated homologs in therodent sequences, together with the five nucleotides flank-ing them on each side. Motifs were planted at their origi-nal positions, since WeederH scores motifs according totheir conservation in position. In this way, we obtained254 sequence sets, each containing a single planted motif.Eighteen sets were composed by human-mouse-ratsequences, 185 by a human-mouse pair, and 51 containedhuman-rat sequences.
We assessed the performance of the algorithm by usingdifferent measures. First of all, at the nucleotide level, wecalculated the percentage of the nucleotides of the truesites planted in the sequences that were predicted as partof a conserved motif by the algorithm (nucleotide cover-age – Nc). This measure is equivalent to sensitivity (ratioof true positives vs. overall sites length). Then, at the sitelevel, by defining a site as correctly predicted if either atleast eight of its nucleotides or at least 75% of the sitenucleotides overlapped a predicted motif (site coverage –Sc). In order to have an estimate of the false positive pre-dictions of the algorithm we also computed the overalllength of the motifs predicted by the algorithm in eachsequence set, that is, the percentage of the referencesequence covered by motifs (%pred), and according tothis the specificity (ratio of true negatives vs. overalllength of the part of the reference sequence not containinga site).
Table 1 shows the results of the algorithm applied to sim-ulated sequences with an average identity of 50%, whichhas been shown to be average identity percentage on2,000 bp regions in non-coding human-rodent homolo-gous sequences [5,41]. The performance varies according
to the χ2 score threshold used. At threshold value 2 weobtain 85% and 93% of nucleotide and site coverage,respectively, but 44% of the reference sequence is coveredby motifs, with a specificity of .54. Increasing the scorethreshold significantly lowers the number of motifsreported, with the percentage of motifs correctly predictedremains at satisfactory values. With threshold 7.5, thealgorithm identifies more than 85% of the planted sites,with only 15% of the reference sequence covered bymotifs (specificity .85).
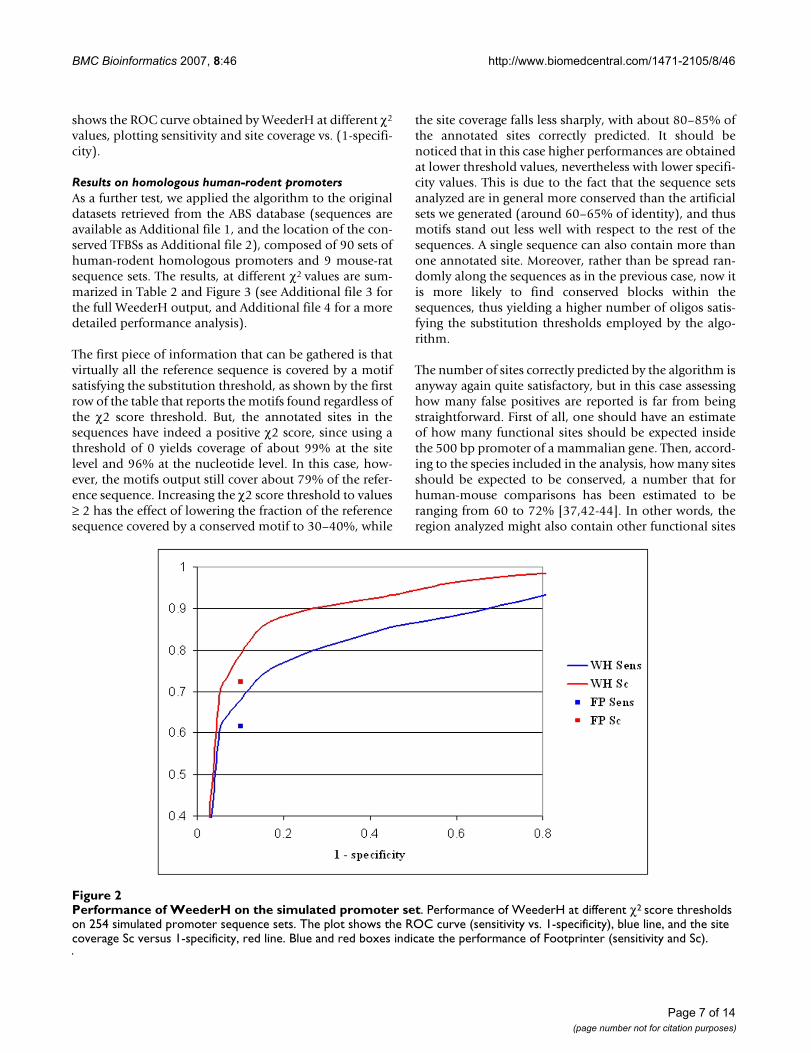
To make a comparison, the core of the Footprinter algo-rithm is based on the same idea, finding matching oligosin the sequences examined, and computing a parsimonyscore according to the number of mismatches in motifs'instances and the phylogenetic relationship among thespecies investigated. When no substitution was allowed inmotifs instances, Footprinter yielded a nucleotide cover-age (sensitivity) of 61%, and a site coverage of 72%, withmotifs predicted only on small fraction of the referencesequence (10% – specificity .9). With threshold 10, how-ever, WeederH reached the same specificity, but with sen-sitivity of .67 and site coverage of about 78%, respectively.
Other than yielding lower accuracy, the parsimony scoreemployed by Footprinter makes a fine grained ranking ofmotifs more difficult, especially when few (two or three)homologous sequences are examined. Allowing one ortwo substitutions when searching for conserved motifs(eightmers with two substitutions are exactly the sameparameters employed by WeederH) improved the resultsup to 99% when allowing two substitutions, but alsoincreased significantly the percentage of the referencesequence covered by a motif: 99% with two substitutions(as in WeederH with no score threshold employed, datanot shown) and 72% with one substitution. Figure 2
Table 1: Performance of WeederH on simulated promoter sets
χ2 Score Threshold %pred Nc Sc Sp
0 82.98 94.99 99.21 0.121 57.97 88.51 96.45 0.392 44.50 85.74 93.30 0.543 34.98 82.89 91.73 0.645 24.00 78.87 89.37 0.767.5 15.59 74.23 85.82 0.8510 10.90 67.44 77.95 0.9012 8.33 64.30 73.62 0.9315 6.15 60.23 69.29 0.95
FP 10.54 61.48 72.44 0.90
Performance of WeederH at different χ2 score thresholds on the 254 simulated sequence sets. %pred indicates the percentage of nucleotides of the reference sequence belonging to a motif output by the algorithm. Nc indicates the nucleotide coverage, the percentage of nucleotides in annotated sites matched by a predicted motif (equalling sensitivity); Sc indicates the site coverage, the percentage of annotated sites matched (at least by 75% of their length) by a motif predicted by WeederH; finally, Sp is specificity. The bottom row reports the performance of the Footprinter algorithm on the same set.
Page 6 of 14(page number not for citation purposes)
BMC Bioinformatics 2007, 8:46 http://www.biomedcentral.com/1471-2105/8/46
shows the ROC curve obtained by WeederH at different χ2
values, plotting sensitivity and site coverage vs. (1-specifi-city).
Results on homologous human-rodent promotersAs a further test, we applied the algorithm to the originaldatasets retrieved from the ABS database (sequences areavailable as Additional file 1, and the location of the con-served TFBSs as Additional file 2), composed of 90 sets ofhuman-rodent homologous promoters and 9 mouse-ratsequence sets. The results, at different χ2 values are sum-marized in Table 2 and Figure 3 (see Additional file 3 forthe full WeederH output, and Additional file 4 for a moredetailed performance analysis).
The first piece of information that can be gathered is thatvirtually all the reference sequence is covered by a motifsatisfying the substitution threshold, as shown by the firstrow of the table that reports the motifs found regardless ofthe χ2 score threshold. But, the annotated sites in thesequences have indeed a positive χ2 score, since using athreshold of 0 yields coverage of about 99% at the sitelevel and 96% at the nucleotide level. In this case, how-ever, the motifs output still cover about 79% of the refer-ence sequence. Increasing the χ2 score threshold to values≥ 2 has the effect of lowering the fraction of the referencesequence covered by a conserved motif to 30–40%, while
the site coverage falls less sharply, with about 80–85% ofthe annotated sites correctly predicted. It should benoticed that in this case higher performances are obtainedat lower threshold values, nevertheless with lower specifi-city values. This is due to the fact that the sequence setsanalyzed are in general more conserved than the artificialsets we generated (around 60–65% of identity), and thusmotifs stand out less well with respect to the rest of thesequences. A single sequence can also contain more thanone annotated site. Moreover, rather than be spread ran-domly along the sequences as in the previous case, now itis more likely to find conserved blocks within thesequences, thus yielding a higher number of oligos satis-fying the substitution thresholds employed by the algo-rithm.
The number of sites correctly predicted by the algorithm isanyway again quite satisfactory, but in this case assessinghow many false positives are reported is far from beingstraightforward. First of all, one should have an estimateof how many functional sites should be expected insidethe 500 bp promoter of a mammalian gene. Then, accord-ing to the species included in the analysis, how many sitesshould be expected to be conserved, a number that forhuman-mouse comparisons has been estimated to beranging from 60 to 72% [37,42-44]. In other words, theregion analyzed might also contain other functional sites
Performance of WeederH on the simulated promoter setFigure 2Performance of WeederH on the simulated promoter set. Performance of WeederH at different χ2 score thresholds on 254 simulated promoter sequence sets. The plot shows the ROC curve (sensitivity vs. 1-specificity), blue line, and the site coverage Sc versus 1-specificity, red line. Blue and red boxes indicate the performance of Footprinter (sensitivity and Sc).
Page 7 of 14(page number not for citation purposes)

BMC Bioinformatics 2007, 8:46 http://www.biomedcentral.com/1471-2105/8/46
not conserved in the other species. Finally, the conserva-tion of functional sites often spans a region longer thanthe sites themselves, increasing the number of predictednucleotides.
We then ran Footprinter also on this sequence set. Again,the best performance (79% at the site level, 70% at thenucleotide level) was obtained by using a parsimony scorethreshold of 0 (no substitution allowed in motifs' occur-rences), with motifs covering more than 37% of the refer-ence sequence. With χ2 score threshold of 3.0 WeederHmotifs covered the same percentage of the referencesequence, with 84% of success at the site level and 76% atthe nucleotide level (see Table 1). Thus, with the samespecificity, WeederH yields a higher sensitivity. Introduc-ing for Footprinter significance evaluation of motifs(using the different significance settings available and try-ing different combinations) did not improve the results,increasing the specificity but also reducing the percentageof correctly identified sites to 70%. The same specificitywas reached by WeederH with χ2 score threshold of 5.0,but with 79% of the annotated sites correctly predicted.
We also compared our results to the phastCons annota-tions [28,45] available at the UCSC genome browser [13].The overall percentage of the reference sequences used inthis test annotated as "most conserved" is around 25%,and about 55% of the sites annotated in the database are
covered (50% at the nucleotide level). Although the tracksare generated by comparing human to all the vertebrategenomic sequences available, instead of rodents alone(and vice versa), this result nevertheless highlights the factthat methods like phastCons are better suited to identifylarge conserved regions rather than single sites. Examplesare shown in Figures 4 and 5, with the results of WeederHcompared to the conserved regions predicted by phast-Cons and RP [27] available at the UCSC genome browser.Indeed, these examples show typical situations in whichthe two methods either do not detect any conserved ele-ment in the core promoter because single TFBSs are toosmall to reach a significant level of conservation (Figure4), or can single out only large conserved regions (Figure5, as also in the p53 example, see Figure 1). This is also adrawback deriving from the usage of a single, globalthreshold of significance. These examples show howWeederH can work at a much more fine grained level ofdetail, actually being able to identify correctly conservedTFBSs either with little or, vice versa, a very high level ofoverall sequence conservation.
Given the difference in performance on the same thresh-old values for the artificial and real datasets, it might seemthat the problem of defining a significance thresholdremains, only recast at a relative level, that is, dependingon the overall degree of conservation of the sequencesinvestigated. However, useful information can be gath-
Table 2: Performance of WeederH on the ABS promoter set
χ2 Score Threshold %pred Nc Sc Sp
None 98.37 99.70 100.0 0.020 78.90 95.77 98.68 0.231 51.04 83.91 91.72 0.52
1.5 45.79 81.42 89.07 0.572 41.93 78.26 86.75 0.61
2.5 39.53 76.35 85.10 0.643 37.55 75.24 84.11 0.664 34.55 73.96 82.45 0.69
4.5 33.26 72.42 80.79 0.705 32.30 71.56 79.14 0.71
5.5 31.44 70.77 78.48 0.726 30.58 68.96 77.48 0.738 27.51 64.81 72.18 0.75
FP 37.18 70.32 79.47 0.65FPSIG 31.55 62.61 70.19 0.71
phastCons 25.97 50.02 55.51 0.73
Performance of WeederH at different χ2 score thresholds on the 99 orthologous promoter sets retrieved from the ABS database. %pred indicates the percentage of nucleotides of the reference sequence belonging to a conserved motif output by the algorithm. Nc indicates the nucleotide coverage, the percentage of nucleotides in annotated sites matched by a predicted motif; Sc indicates the site coverage, the number of annotated sites matched (at least by 75% of their length) by a motif predicted by WeederH; Sp is specificity. The next two rows report the performance of the Footprinter algorithm on the same set, using parsimony score alone (FP), and with the introduction of significance estimation (FPSIG). Finally, the bottom row shows the same data for the phastCons most conserved tracks available at the UCSC genome browser (on genomes: human and mouse, March 2006; rat, November 2004).
Page 8 of 14(page number not for citation purposes)

BMC Bioinformatics 2007, 8:46 http://www.biomedcentral.com/1471-2105/8/46
ered by examining the ranking, in the lists output by thealgorithm, of the motifs matching a planted site. The over-all distribution is shown in Figure 6. In artificialsequences, more than 60% of the planted sites matched atop-scoring motif, and nearly 80% one of the first three.Also in the real promoter case, motifs corresponding to afunctional site tend to appear within the first five posi-tions (blue bars in the histogram of Figure 6), thus provid-ing further evidence to the fact that indeed the measureused by the algorithm highlights conserved real TFBSs,that are as we stated in the introduction, "more conservedthan the rest". One third of the 302 sites are matched bythe highest ranking motif, 17% by a second-ranking motifand 13% by the third one. 75% of the annotated sites arematched by a motif ranking among the first five, 90%among the first ten. The percentage is increased if weremove from the ranking those higher-scoring motifs thatmatch an annotated site, in other words, if we count in theranking of a motif only those preceding it that do notmatch an annotated site (hence "putative false positives").In this case, almost half of the sites are matched by the
highest ranking motif, or by a motif that is preceded byother motifs matching a solution (red bars in Figure 6).Vice versa, in 62 sequence sets out of 99 the highest scor-ing motif matched an annotated site (or more than one,since the algorithm can report regions longer than a singlesite, that hence can contain more than one site), and in 91out of 99 one of the first three motifs matched an anno-tated site. A rapid inspection of the highest scoring motifsnot matching a site annotated in the ABS database, how-ever, revealed that in all the cases but one the highest scor-ing motif matched at least one site annotated inTRANSFAC, or a signal like TATA- or CAAT-boxes thatgiven their constrained position are perfect candidates tobe picked by the algorithm.
The scoring function employed by the algorithm seemsthus to be reliable, and scanning the output list from topto bottom is very likely to produce satisfactory results. Aninteresting result is also the fact that in the case of mouse-rat comparisons, where the sequences presents a muchhigher degree of similarity, the percentage of annotated
Performance of WeederH on the ABS promoter setFigure 3Performance of WeederH on the ABS promoter set. Performance of WeederH at different χ2 score thresholds on the 99 promoter sequence sets retrieved from the ABS database. The plot shows the ROC curve (sensitivity vs. 1-specificity), blue line, and the site coverage Sc versus 1-specificity, red line. Blue and red boxes indicate the performance of Footprinter (sensi-tivity and Sc), blue and red triangles Footprinter with significance measure, blue and red diamond the results of phastCons most conserved regions.
Page 9 of 14(page number not for citation purposes)

BMC Bioinformatics 2007, 8:46 http://www.biomedcentral.com/1471-2105/8/46
sites correctly identified remains fixed at 90% even at highscore thresholds, showing that true sites are higher scoringalso in the presence of a higher level of sequence conser-vation.
Finding conserved distal motifs and regionsAs we have shown in the previous section, the scoringfunction employed by the algorithm can successfully dis-criminate motifs and regions corresponding to true func-tional sites. The dataset we used for the test, however, wascomposed of sequences carefully selected, in other words,truly orthologous promoters. In this way, the positionalconservation term in the scoring function quite naturallyyields the best results. Very often, however, the selectionof the input sequences is far from being straightforward:even in largely annotated genomes like human andmouse, genes present several different transcription startsites, alternative promoters, and so on, making difficultthe choice of which "upstream" region has to be consid-ered. Moreover, in other recently sequenced genomes likedog, no transcripts are often available, and genes areannotated only starting from the ATG codon [32]. Toassess whether the scoring scheme employed is efficientalso in the case of longer sequences less carefully selectedwe performed further tests.
The Actin cardiac alpha chain gene (ACTC) has the ATGcodon located within the second exon, with a fully non-coding first exon. WeederH successfully identified all the7 sites contained in the 500 bp promoter region retrievedfrom the ABS database (ABS 3 in Additional file 1). Werepeated the experiment, but this time retrieving the10,000 base pairs upstream of the ATG codon of themouse and human genes. The results are shown in Figure7, displayed within a UCSC genome browser window. Thetopmost track (WeederH motifs) shows the location ofthe highest scoring motifs. It can be seen that they are clus-tered around the TSS of the gene, falling within the 500 bppromoter of the ABS database (indicated by the "Yoursequence from BLAT search" track). Motifs shown in thisarea cover all the ABS annotated sites. Also interestinglyenough, other clusters of motifs are visible, namely ataround -2000, -6000, and -8000 from the TSS. As a matterof fact, three distal enhancers are annotated for the ACTCgene, driving developmental and cardiac-muscle specificexpression of the gene [46].
To ease the identification of clusters of conserved motifs,we added to the basic algorithm the computation of theaverage motif χ2 score (for 12-mers) in regions 500 bplong. Figure 7 shows the regions with average 12-mer χ2
score greater than 1, matching the experimentally anno-tated enhancers.
Another example is the Actin, skeletal muscle gene(ACTA1, ABS 4 in Additional file 1). In this case, weretrieved for human, mouse, and rat the whole intergenicregion (of about 7000 bps) upstream of the gene. In thiscase, two regions were selected as densely populated ofsignificant motifs (see Figure 8): the core promoter, again,
WeederH output on the 500 bp promoter of the ADH1B gene (as defined in the ABS database)Figure 4WeederH output on the 500 bp promoter of the ADH1B gene (as defined in the ABS database). Top three motifs output by WeederH (top track), ABS annotated sites (in green), sequence of the ABS database (obtained by BLAT search) and predictions according to RP score [27], light blue) and phastCons ([45], bottom track). Notice how neither of the latter two methods reports anything signifi-cantly conserved in the core promoter itself, where motifs are located.
WeederH output on the promoter and 5'UTR of the MYB gene (as defined in the ABS database)Figure 5WeederH output on the promoter and 5'UTR of the MYB gene (as defined in the ABS database). Highest scoring motif output by WeederH (top track), ABS anno-tated site (in green), sequence of the ABS database (S66422 – aligned with BLAT), and conserved regions predicted by RP score [27], light blue) and phastCons ([45], bottom track). Notice how both the latter methods predict conserved long regions spanning most of the promoter itself, making difficult the identification of single conserved TFBSs.
Page 10 of 14(page number not for citation purposes)

BMC Bioinformatics 2007, 8:46 http://www.biomedcentral.com/1471-2105/8/46
and another region at around -1,500 matching an experi-mentally validated enhancer [47].
These examples, as well as other tests we performed, showhow the conservation principle the algorithm is based oncan work also on input sequences whose size spans welloutside the typical length of a core promoter, where posi-tional conservation is looser. While not explicitly devisedfor the identification of distal enhancers, WeederH never-theless can be applied to cases where the exact location ofthe TSS of a gene in different species is not available, or ingeneral to identification of conserved motifs located atseveral hundreds of base pairs of distance from the refer-ence point selected, on which other methods that do notcompute global sequence alignments cannot be applied.
ConclusionThe ever increasing availability of annotated genomicsequences, as well as the observation that several non cod-ing regulatory sequence elements are highly conservedthroughout different species, have made phylogeneticfootprinting one of the most widely used approaches tothe identification of sequence cis-acting elements regulat-ing gene expression. The algorithm we presented in thiswork was aimed at overcoming some of the drawbacks ofthe methods currently used, namely, the need of reliablegenomic alignments and/or descriptors for the bindingspecificity of transcription factors. The introduction of arelative scoring strategy, moreover, bypasses the problemof defining global significance thresholds. The algorithmis also quite efficient, requiring less than one minute for atypical promoter analysis and a few minutes for sequencesa few kbp long. The results we obtained from the tests weperformed show that the algorithm can reliably predict
conserved TFBSs in homologous promoters, with betterperformance over existing methods and annotations, butalso can identify conserved sites and regions in longersequences. Clearly, other methods are more suited for thediscovery of distal regions and enhancers, that can belocated at several thousands or millions of base pairs fromthe gene they regulate; nevertheless, WeederH can providesignificantly more information than traditional motif-finding algorithms.
MethodsComputing motifs expected frequency valuesThe scoring function employed by WeederH is based onthe comparison of the observed oligo frequencies withexpected values. The term E(s,d,k), indicating the expectedfrequency of a given oligo s with d substitutions in the spe-cies of origin of sequence Hk is computing according tothe observed frequency of oligos within d substitutionsfrom s in intergenic regions of the species sequence Hk istaken from:
where N(s,d) is the set of oligos differing from s in nomore than d positions. Frequency values for eightmers(E(s,k)) were retrieved from the RSAT Tools database [48],while the expected frequency of longer oligos is computedstarting from the eightmer frequencies with a seventh-order Markov model.
For oligos longer than 8 nts, we modeled the expected fre-quency by using a seventh order Markov chain. In otherwords, let p = p1 .... pn be an n-mer, with n greater than 8:
where P (pi | pi-7 ... pi-1) is the conditional probability ofhaving nucleotide pi preceded by nucleotides pi-7 ... pi-1,computed by using the expected frequencies of 8-mers:
The motivation for the choice of a seventh order model isbased on the fact that a high order background models (atleast third or fourth) have been proven in several experi-ments to improve significantly the reliability of motif dis-covery methods (see for example [49-51]). Moreover, wechose to use directly the n-mer count for computing theExp(p) values of n-mers, up to the maximum length forwhich each oligo appeared at least once in the regulatorysequences of the organisms we examined (avoiding the
E s d k E s ks N s d
( , , ) ( , )( , )
= ′′∈∑
Exp p Exp p p P p p pi i ii
n( ) ( ... ) ( | ... )= − −
=∏1 8 7 1
9
P p p pExp p p p p
Exp p p pi i ii i i i
i i i( | ... )
( ... )
( ...− −− − −
− − −=1 7
7 6 1
7 6 11nn A C G T
){ , , , }∈
∑
WeederH ranking of the sites annotated in the simulated and ABS promoter setsFigure 6WeederH ranking of the sites annotated in the simu-lated and ABS promoter sets. Ranking of the motifs out-put by WeederH matching a planted site in the simulated promoter set (green bars) and the ABS promoter set (red and blue bars, see text for explanation).
Page 11 of 14(page number not for citation purposes)

BMC Bioinformatics 2007, 8:46 http://www.biomedcentral.com/1471-2105/8/46
introduction of pseudo-counts to compensate for missingoligo counts). Then, we computed the Exp(p) values ofoligos longer than 8 nucleotides starting from the eight-mer count values.
Availability and requirements• Project name: WeederH
• Project home page: Part of the Motif Discovery Toolsweb server, http://www.beacon.unimi.it/modtools/ orhttp://www.pesolelab.it/modtools/.
• Operating systems: web interface that can be accessedfrom any OS.
• Programming language: C/C++, Java (web interface).
• Restrictions to use by non-academics: none.
AbbreviationsTF, transcription factor; TFBS, transcription factor bindingsite; TSS, transcription start site; bp, base pair.
Authors' contributionsGiP came up with the core idea of the algorithm, designedit together with GrP, and finally implemented it; FZ testedextensively the algorithm during its development, andimplemented parts of the algorithm itself and of the Webinterface. All authors read and approved the final manu-script.
Additional material
Additional file 1Orthologous sequence sets. Orthologous sequence sets taken from the ABS database used for testing the algorithm.Click here for file[http://www.biomedcentral.com/content/supplementary/1471-2105-8-46-S1.gz]
Additional file 2Motif solutions. Motifs annotated in the ABS database in the test sequences.Click here for file[http://www.biomedcentral.com/content/supplementary/1471-2105-8-46-S2.txt]
Additional file 3Output of WeederH on orthologous sequence sets. Full output of WeederH on the orthologous sequence sets taken from the ABS database used for testing the algorithm.Click here for file[http://www.biomedcentral.com/content/supplementary/1471-2105-8-46-S3.gz]
WeederH identifies the promoter and the three annotated enhancers upstream of the mouse actin, alpha cardiac geneFigure 7WeederH identifies the promoter and the three annotated enhancers upstream of the mouse actin, alpha cardiac gene. Highest scoring motifs predicted by WeederH in the 10,000 bps region upstream of the ATG codon of the mouse actin alpha cardiac gene, displayed within the UCSC genome browser. Track "Weeder H motifs" shows the location of the motifs; the track "Weeder-H" 500 shows 500 bps regions in which the average 12-mer χ2 score is greater than 1. Track "Your sequence from Blat Search" shows the location of the original promoter retrieved from the ABS database. The three regions, other than the just upstream of the TSS (the promoter), match three experi-mentally known enhancers of the gene.
WeederH identifies the promoter and the annotated enhancer upstream of the human skeletal actin geneFigure 8WeederH identifies the promoter and the annotated enhancer upstream of the human skeletal actin gene. Highest scoring motifs predicted by WeederH in the inter-genic region upstream of the ATG codon of the human skel-etal actin gene, displayed within the UCSC genome browser. Track "Weeder H motifs" shows the location of the motifs; the track "Weeder-H" 500 shows 500 bps regions in which the average 12-mer χ2 score is higher than 1. The two regions selected, are the promoter and an annotated enhancer located at about 1500 bps upstream of the TSS [47]. Track "Your sequence from Blat Search" shows the location of the original promoter retrieved from the ABS database.
Page 12 of 14(page number not for citation purposes)

BMC Bioinformatics 2007, 8:46 http://www.biomedcentral.com/1471-2105/8/46
AcknowledgementsWe thank David Horner for the help in the generation of the simulated datasets. This work has been supported by the Italian Ministry of University and Research, under the project FIRB 2003 "Laboratorio Italiano di Bioin-formatica", and by EU grant "Transcode".
References1. Levine M, Tjian R: Transcription regulation and animal diver-
sity. Nature 2003, 424:147-151.2. Pavesi G, Mauri G, Pesole G: In silico representation and discov-
ery of transcription factor binding sites. Brief Bioinform 2004,5:217-236.
3. Bulyk ML: Computational prediction of transcription-factorbinding site locations. Genome Biol 2003, 5:201.
4. Tagle DA, Koop BF, Goodman M, Slightom JL, Hess DL, Jones RT:Embryonic epsilon and gamma globin genes of a prosimianprimate (Galago crassicaudatus). Nucleotide and amino acidsequences, developmental regulation and phylogenetic foot-prints. J Mol Biol 1988, 203:439-455.
5. Wang T, Stormo GD: Combining phylogenetic data with co-regulated genes to identify regulatory motifs. Bioinformatics2003, 19:2369-2380.
6. Sinha S, Blanchette M, Tompa M: PhyME: a probabilistic algo-rithm for finding motifs in sets of orthologous sequences.BMC Bioinformatics 2004, 5:170.
7. Harbison CT, Gordon DB, Lee TI, Rinaldi NJ, Macisaac KD, DanfordTW, Hannett NM, Tagne JB, Reynolds DB, Yoo J, Jennings EG, Zei-tlinger J, Pokholok DK, Kellis M, Rolfe PA, Takusagawa KT, Lander ES,Gifford DK, Fraenkel E, Young RA: Transcriptional regulatorycode of a eukaryotic genome. Nature 2004, 431:99-104.
8. Elemento O, Tavazoie S: Fast and systematic genome-wide dis-covery of conserved regulatory elements using a non-align-ment based approach. Genome Biol 2005, 6:R18.
9. Pritsker M, Liu YC, Beer MA, Tavazoie S: Whole-genome discov-ery of transcription factor binding sites by network-levelconservation. Genome Res 2004, 14:99-108.
10. Xie X, Lu J, Kulbokas EJ, Golub TR, Mootha V, Lindblad-Toh K,Lander ES, Kellis M: Systematic discovery of regulatory motifsin human promoters and 3' UTRs by comparison of severalmammals. Nature 2005, 434:338-345.
11. Prakash A, Tompa M: Discovery of regulatory elements in ver-tebrates through comparative genomics. Nat Biotechnol 2005,23:1249-1256.
12. Giardine B, Riemer C, Hardison RC, Burhans R, Elnitski L, Shah P,Zhang Y, Blankenberg D, Albert I, Taylor J, Miller W, Kent WJ,Nekrutenko A: Galaxy: a platform for interactive large-scalegenome analysis. Genome Res 2005, 15:1451-1455.
13. Hinrichs AS, Karolchik D, Baertsch R, Barber GP, Bejerano G, Claw-son H, Diekhans M, Furey TS, Harte RA, Hsu F, Hillman-Jackson J,Kuhn RM, Pedersen JS, Pohl A, Raney BJ, Rosenbloom KR, Siepel A,Smith KE, Sugnet CW, Sultan-Qurraie A, Thomas DJ, Trumbower H,Weber RJ, Weirauch M, Zweig AS, Haussler D, Kent WJ: TheUCSC Genome Browser Database: update 2006. Nucleic AcidsRes 2006, 34:D590-8.
14. Stormo GD: DNA binding sites: representation and discovery.Bioinformatics 2000, 16:16-23.
15. Matys V, Kel-Margoulis OV, Fricke E, Liebich I, Land S, Barre-DirrieA, Reuter I, Chekmenev D, Krull M, Hornischer K, Voss N, StegmaierP, Lewicki-Potapov B, Saxel H, Kel AE, Wingender E: TRANSFACand its module TRANSCompel: transcriptional gene regula-tion in eukaryotes. Nucleic Acids Res 2006, 34:D108-10.
16. Wasserman WW, Palumbo M, Thompson W, Fickett JW, LawrenceCE: Human-mouse genome comparisons to locate regula-tory sites. Nat Genet 2000, 26:225-228.
17. Blanchette M, Bataille AR, Chen X, Poitras C, Laganiere J, Lefebvre C,Deblois G, Giguere V, Ferretti V, Bergeron D, Coulombe B, RobertF: Genome-wide computational prediction of transcriptionalregulatory modules reveals new insights into human geneexpression. Genome Res 2006, 16:656-668.
18. Moses AM, Chiang DY, Pollard DA, Iyer VN, Eisen MB: MONKEY:identifying conserved transcription-factor binding sites inmultiple alignments using a binding site-specific evolutionarymodel. Genome Biol 2004, 5:R98.
19. Rahmann S, Muller T, Vingron M: On the power of profiles fortranscription factor binding site detection. Stat Appl Genet MolBiol 2003, 2:Article7.
20. Berezikov E, Guryev V, Plasterk RH, Cuppen E: CONREAL: con-served regulatory elements anchored alignment algorithmfor identification of transcription factor binding sites by phy-logenetic footprinting. Genome Res 2004, 14:170-178.
21. Corcoran DL, Feingold E, Dominick J, Wright M, Harnaha J, TruccoM, Giannoukakis N, Benos PV: Footer: a quantitative compara-tive genomics method for efficient recognition of cis-regula-tory elements. Genome Res 2005, 15:840-847.
22. Gottgens B, Barton LM, Chapman MA, Sinclair AM, Knudsen B, Graf-ham D, Gilbert JG, Rogers J, Bentley DR, Green AR: Transcrip-tional regulation of the stem cell leukemia gene (SCL)--comparative analysis of five vertebrate SCL loci. Genome Res2002, 12:749-759.
23. Bejerano G, Pheasant M, Makunin I, Stephen S, Kent WJ, Mattick JS,Haussler D: Ultraconserved elements in the human genome.Science 2004, 304:1321-1325.
24. Pennacchio LA, Rubin EM: Genomic strategies to identify mam-malian regulatory sequences. Nat Rev Genet 2001, 2:100-109.
25. Sidow A: Sequence first. Ask questions later. Cell 2002,111:13-16.
26. Margulies EH, Blanchette M, Haussler D, Green ED: Identificationand characterization of multi-species conserved sequences.Genome Res 2003, 13:2507-2518.
27. Kolbe D, Taylor J, Elnitski L, Eswara P, Li J, Miller W, Hardison R, Chi-aromonte F: Regulatory potential scores from genome-widethree-way alignments of human, mouse, and rat. Genome Res2004, 14:700-707.
28. Siepel A, Haussler D: Combining phylogenetic and hiddenMarkov models in biosequence analysis. J Comput Biol 2004,11:413-428.
29. King DC, Taylor J, Elnitski L, Chiaromonte F, Miller W, Hardison RC:Evaluation of regulatory potential and conservation scoresfor detecting cis-regulatory modules in aligned mammaliangenome sequences. Genome Res 2005, 15:1051-1060.
30. Emberly E, Rajewsky N, Siggia ED: Conservation of regulatoryelements between two species of Drosophila. BMC Bioinformat-ics 2003, 4:57.
31. Dubchak I, Frazer K: Multi-species sequence comparison: thenext frontier in genome annotation. Genome Biol 2003, 4:122.
32. Tompa M, Li N, Bailey TL, Church GM, De Moor B, Eskin E, FavorovAV, Frith MC, Fu Y, Kent WJ, Makeev VJ, Mironov AA, Noble WS,Pavesi G, Pesole G, Regnier M, Simonis N, Sinha S, Thijs G, van HeldenJ, Vandenbogaert M, Weng Z, Workman C, Ye C, Zhu Z: Assessingcomputational tools for the discovery of transcription factorbinding sites. Nat Biotechnol 2005, 23:137-144.
33. McCue L, Thompson W, Carmack C, Ryan MP, Liu JS, Derbyshire V,Lawrence CE: Phylogenetic footprinting of transcription fac-tor binding sites in proteobacterial genomes. Nucleic Acids Res2001, 29:774-782.
34. Blanchette M, Tompa M: FootPrinter: A program designed forphylogenetic footprinting. Nucleic Acids Res 2003, 31:3840-3842.
35. Pavesi G, Mereghetti P, Mauri G, Pesole G: Weeder Web: discov-ery of transcription factor binding sites in a set of sequencesfrom co-regulated genes. Nucleic Acids Res 2004, 32:W199-203.
36. Li N, Tompa M: Analysis of computational approaches formotif discovery. Algorithms Mol Biol 2006, 1:8.
37. Dermitzakis ET, Clark AG: Evolution of transcription factorbinding sites in Mammalian gene regulatory regions: conser-vation and turnover. Mol Biol Evol 2002, 19:1114-1121.
38. Bailey TL, Elkan C: The value of prior knowledge in discoveringmotifs with MEME. Proc Int Conf Intell Syst Mol Biol 1995, 3:21-29.
Additional file 4WeederH performance on ortholgous promoters. detailed results of Weed-erH applied to the ABS database data set, split in the different sequence sets and sites.Click here for file[http://www.biomedcentral.com/content/supplementary/1471-2105-8-46-S4.xls]
Page 13 of 14(page number not for citation purposes)
BMC Bioinformatics 2007, 8:46 http://www.biomedcentral.com/1471-2105/8/46
Publish with BioMed Central and every scientist can read your work free of charge
"BioMed Central will be the most significant development for disseminating the results of biomedical research in our lifetime."
Sir Paul Nurse, Cancer Research UK
Your research papers will be:
available free of charge to the entire biomedical community
peer reviewed and published immediately upon acceptance
cited in PubMed and archived on PubMed Central
yours — you keep the copyright
Submit your manuscript here:http://www.biomedcentral.com/info/publishing_adv.asp
BioMedcentral
39. Blanco E, Farre D, Alba MM, Messeguer X, Guigo R: ABS: a data-base of Annotated regulatory Binding Sites from ortholo-gous promoters. Nucleic Acids Res 2006, 34:D63-7.
40. Cartwright RA: DNA assembly with gaps (Dawg): simulatingsequence evolution. Bioinformatics 2005, 21 Suppl 3:iii31-iii38.
41. Shabalina SA, Ogurtsov AY, Kondrashov VA, Kondrashov AS: Selec-tive constraint in intergenic regions of human and mousegenomes. Trends Genet 2001, 17:373-376.
42. Sauer T, Shelest E, Wingender E: Evaluating phylogenetic foot-printing for human-rodent comparisons. Bioinformatics 2006,22:430-437.
43. Liu Y, Liu XS, Wei L, Altman RB, Batzoglou S: Eukaryotic regula-tory element conservation analysis and identification usingcomparative genomics. Genome Res 2004, 14:451-458.
44. Levy S, Hannenhalli S: Identification of transcription factor bind-ing sites in the human genome sequence. Mamm Genome 2002,13:510-514.
45. Siepel A, Bejerano G, Pedersen JS, Hinrichs AS, Hou M, RosenbloomK, Clawson H, Spieth J, Hillier LW, Richards S, Weinstock GM, Wil-son RK, Gibbs RA, Kent WJ, Miller W, Haussler D: Evolutionarilyconserved elements in vertebrate, insect, worm, and yeastgenomes. Genome Res 2005.
46. Lemonnier M, Buckingham ME: Characterization of a cardiac-specific enhancer, which directs {alpha}-cardiac actin genetranscription in the mouse adult heart. J Biol Chem 2004,279:55651-55658.
47. Slepak TI, Webster KA, Zang J, Prentice H, O'Dowd A, Hicks MN,Bishopric NH: Control of cardiac-specific transcription byp300 through myocyte enhancer factor-2D. J Biol Chem 2001,276:7575-7585.
48. van Helden J: Regulatory sequence analysis tools. Nucleic AcidsRes 2003, 31:3593-3596.
49. Thijs G, Lescot M, Marchal K, Rombauts S, De Moor B, Rouze P,Moreau Y: A higher-order background model improves thedetection of promoter regulatory elements by Gibbs sam-pling. Bioinformatics 2001, 17:1113-1122.
50. Sinha S, Tompa M: Discovery of novel transcription factor bind-ing sites by statistical overrepresentation. Nucleic Acids Res2002, 30:5549-5560.
51. Narasimhan C, LoCascio P, Uberbacher E: Background rareness-based iterative multiple sequence alignment algorithm forregulatory element detection. Bioinformatics 2003,19:1952-1963.
Page 14 of 14(page number not for citation purposes)