gbe - digital.csicdigital.csic.es/bitstream/10261/94240/1/griggio et al 2014.pdf · structure such...
TRANSCRIPT

Ascidian Mitogenomics: Comparison of Evolutionary
Rates in Closely Related Taxa Provides Evidence of
Ongoing Speciation Events
Francesca Griggio1, Ayelet Voskoboynik2,3, Fabio Iannelli1, Fabienne Justy4, Marie-Ka Tilak4, Turon Xavier5,Graziano Pesole6,7, Emmanuel J.P. Douzery4, Francesco Mastrototaro8, and Carmela Gissi1,*1Dipartimento di Bioscienze, Universita degli Studi di Milano, Milano, Italy2Institute for Stem Cell Biology and Regenerative Medicine, Stanford University School of Medicine3Department of Developmental Biology, Stanford University4Institut des Sciences de l’Evolution de Montpellier (ISEM), Universite Montpellier II, France5Center for Advanced Studies of Blanes (CEAB-CSIC), CSIC, Blanes, Spain6Istituto di Biomembrane e Bioenergetica, CNR, Bari, Italy7Dipartimento di Bioscienze, Biotecnologie e Biofarmaceutica, Universita degli Studi di Bari, Italy8Dipartimento di Biologia, Universita degli Studi di Bari, Italy
*Corresponding author: E-mail: [email protected].
Accepted: February 19, 2014
Data deposition: This project has been deposited at EMBL under the accessions HF548552, HF548553, HF548554, HF548550, FM177702,
FM177863, HF548555, AM292604, and HG931920–HG931923.
Abstract
Ascidians are a fascinating group of filter-feeding marine chordates characterized by rapid evolution of both sequences and structure
of their nuclear and mitochondrial genomes. Moreover, they include several model organisms used to investigate complex biological
processes in chordates. To study the evolutionary dynamics of ascidians at short phylogenetic distances, we sequenced 13 new
mitogenomes and analyzed them, together with 15 other available mitogenomes, using a novel approach involving detailed whole-
mitogenome comparisons of conspecific and congeneric pairs. The evolutionary rate was quite homogeneous at both intraspecific
and congeneric level, and the lowest congeneric rates were found in cryptic (morphologically undistinguishable) and in morpholog-
ically very similar species pairs. Moreover, congeneric nonsynonymous rates (dN) were up to two orders of magnitude higher than in
intraspecies pairs. Overall, a clear-cut gap sets apart conspecific from congeneric pairs. These evolutionary peculiarities allowed easily
identifying an extraordinary intraspecific variability in the model ascidian Botryllus schlosseri, where most pairs show a dN value
between that observed at intraspecies and congeneric level, yet consistently lower than that of the Ciona intestinalis cryptic species
pair. These data suggest ongoing speciation events producing genetically distinct B. schlosseri entities. Remarkably, these ongoing
speciation events were undetectable by the cox1 barcode fragment, demonstrating that, at low phylogenetic distances, the whole
mitogenomehasahigher resolvingpower than cox1.Our study shows thatwhole-mitogenomecomparativeanalyses,performedon
a suitable sample of congeneric and intraspecies pairs, may allow detecting not only cryptic species but also ongoing speciation
events.
Key words: ascidian, mitochondrial genome, evolutionary rate, species identification.
Introduction
Ascidians, or sea squirts, are the largest and most diverse class
of Tunicata, the chordate subphylum of marine filter-feeding
organisms that for a long time is fascinating biologists for the
extraordinary association of high morphoanatomical (adult)
diversity and close evolutionary affinities to vertebrates. In ad-
dition to being a traditional target of developmental and em-
bryological studies, the interest toward ascidians has recently
grown up and expanded to new fields, also thanks to the
GBE
� The Author(s) 2014. Published by Oxford University Press on behalf of the Society for Molecular Biology and Evolution.
This is an Open Access article distributed under the terms of the Creative Commons Attribution License (http://creativecommons.org/licenses/by/3.0/), which permits unrestricted reuse,
distribution, and reproduction in any medium, provided the original work is properly cited.
Genome Biol. Evol. 6(3):591–605. doi:10.1093/gbe/evu041 Advance Access publication February 25, 2014 591
at CSIC
on March 25, 2014
http://gbe.oxfordjournals.org/D
ownloaded from

advances in molecular biology and genomics. Thus, ascidians
are emerging as model organisms for the study of processes as
diverse as heart development, evolution of the immune
system, conservation of gene regulatory networks in chor-
dates, differentiation of specific cell lines and the respective
molecular mechanisms, transcriptional control of embryonic
development, comparative genomics, and so forth (Holland
and Gibson-Brown 2003; Lemaire et al. 2008; Lemaire 2011;
Tolkin and Christiaen 2012). As an example, the cosmopolitan
and invasive colonial ascidian Botryllus schlosseri has become a
model system for the study of natural transplantation reac-
tions, apoptosis, stem cell-mediated regeneration, and asexual
reproduction (Manni et al. 2007). Therefore, the recently se-
quenced nuclear genome of B. schlosseri (Voskoboynik et al.
2013) and its comparison with the genomes of other model
tunicates, that is, the Ciona intestinalis and C. savignyi solitary
ascidians and the larvacean Oikopleura dioica (Dehal et al.
2002; Small et al. 2007; Denoeud et al. 2010), promises
new insights into the earlier-mentioned processes as well as
into the deuterostome evolution and the origin of chordates.
In fact, most of the interest toward ascidians and tunicates
can be brought back to their key phylogenetic position within
Chordata, and the recently discovered monophyletic grouping
of tunicates and vertebrates with the exclusion of cephalo-
chordates. This finding, initially based on molecular evidences
(Bourlat et al. 2006; Delsuc et al. 2006; Putnam et al. 2008)
and then confirmed by some morphological data (Jeffery
2007), is now widely accepted and contributes to make tuni-
cates in general, and ascidians in particular, invaluable chor-
date invertebrate model organisms. However, it should be
noted that the ambiguities present in some nodes of the tu-
nicate phylogenetic tree can reduce the reliability and the
power of these organisms as models, because the lack of
clear phylogenetic data could complicate the interpretation
of comparative studies carried out both within tunicates and
between tunicates and vertebrates.
It is noteworthy that debated phylogenetic issues in tuni-
cates involve both high and low taxonomic ranks. At high
taxonomic level, the most remarkable questions are the
branching pattern between the three tunicate classes
(Thaliacea, Larvacea, and Ascidiacea), the correlated issue of
the Ascidiacea paraphyly (Wada 1998; Stach and Turbeville
2002; Zeng and Swalla 2005; Yokobori et al. 2006; Zeng et al.
2006; Swalla and Smith 2008; Tsagkogeorga et al. 2009;
Govindarajan et al. 2011), and the Phlebobranchia paraphyly
(Swalla et al. 2000; Turon and Lopez-Legentil 2004; Yokobori
et al. 2005; Zeng and Swalla 2005; Tsagkogeorga et al. 2009;
Stach et al. 2010; Rubinstein et al. 2013). At low taxonomic
level, exemplifying cases are the relationships among the
Aplousobranchia families (Turon and Lopez-Legentil 2004;
Tsagkogeorga et al. 2009), the paraphyly of Pyuridae with
respect to Styelidae (Perez-Portela et al. 2009; Rubinstein
et al. 2013), the possible inclusion of Cionidae within
Aplousobranchia rather than Phlebobranchia (Kott 1990;
Stach and Turbeville 2002; Turon and Lopez-Legentil 2004),
up to the existence of cryptic species in several ascidians
(Tarjuelo et al. 2001, 2004; Perez-Portela and Turon 2008).
Cryptic speciation has been reported even in the model or-
ganisms C. intestinalis (Suzuki et al. 2005; Caputi et al. 2007;
Iannelli, Pesole, et al. 2007; Nydam and Harrison 2007, 2010;
Zhan et al. 2010) and B. schlosseri (Bock et al. 2012).
The resolution of these issues through molecular phyloge-
netic studies is, however, complicated by the high nucleotide
substitution rate found in all tunicates so far analyzed, both at
level of nuclear and mitochondrial (mt) genes (Singh et al.
2009; Tsagkogeorga et al. 2010; Rubinstein et al. 2013 and
references therein). Indeed, the fast evolutionary dynamics
seems to be a pervasive, likely ancestral, tunicate feature,
that affects even the overall organization and structural fea-
tures of the nuclear and mitochondrial genomes (Yokobori
et al. 2005; Gissi et al. 2008; Lemaire et al. 2008; Gissi et al.
2010; Rubinstein et al. 2013). The unresolved phylogenetic
questions and the fast evolutionary dynamics of tunicates
can be quite easily investigated in the small mt genome,
which represents an attractive model system. In fact, the as-
cidian mitogenomes have already proved to be hypervariable
in many genomic features, because they show very high se-
quence divergence, variable tRNA gene content, variable po-
sition of the longest noncoding region (NCR), and rampant
gene order rearrangements even in congeneric and cryptic
species (Iannelli, Pesole, et al. 2007; Gissi et al. 2008, 2010).
In the framework of a wider project on the phylogeny and
mitogenomics of tunicates, we are sequencing the complete
mitogenomes of several ascidians belonging to the three
major groups of Aplousobranchia, Phlebobranchia, and
Stolidobranchia. Here, we analyze 13 new mitogenomes of
congeneric and conspecific samples to study the nucleotide
substitution rate of ascidians at short phylogenetic distances.
As novelty, the nucleotide substitution rate has been com-
pared among different congeneric species as well as among
different individuals of the same species, and also along the
whole mitogenome, considering separately the different func-
tional regions of this molecule (i.e., the different gene catego-
ries as well as the different codon positions and the NCRs).
Thanks to the overall picture of the evolutionary rate inferred
from this data set, we have been able to easily identify a sur-
prisingly high intraspecific variability in the invasive and model
species B. schlosseri. Indeed, the intraspecies and congeneric
comparisons give strong indications of the existence in
B. schlosseri of subtle ongoing speciation events, likely not
yet corresponding to the emergence of fully differentiated
species. Thus, here we demonstrate that our comprehensive
comparative approach at low phylogenetic distance, consist-
ing in the detailed and accurate comparison of the mitochon-
drial nucleotide substitution rate between several congeneric
and intraspecies ascidian pairs, can help solving phylogenetic
controversies at low taxonomic level, even in the absence of
significant differences in the overall mitochondrial genome
Griggio et al. GBE
592 Genome Biol. Evol. 6(3):591–605. doi:10.1093/gbe/evu041 Advance Access publication February 25, 2014
at CSIC
on March 25, 2014
http://gbe.oxfordjournals.org/D
ownloaded from
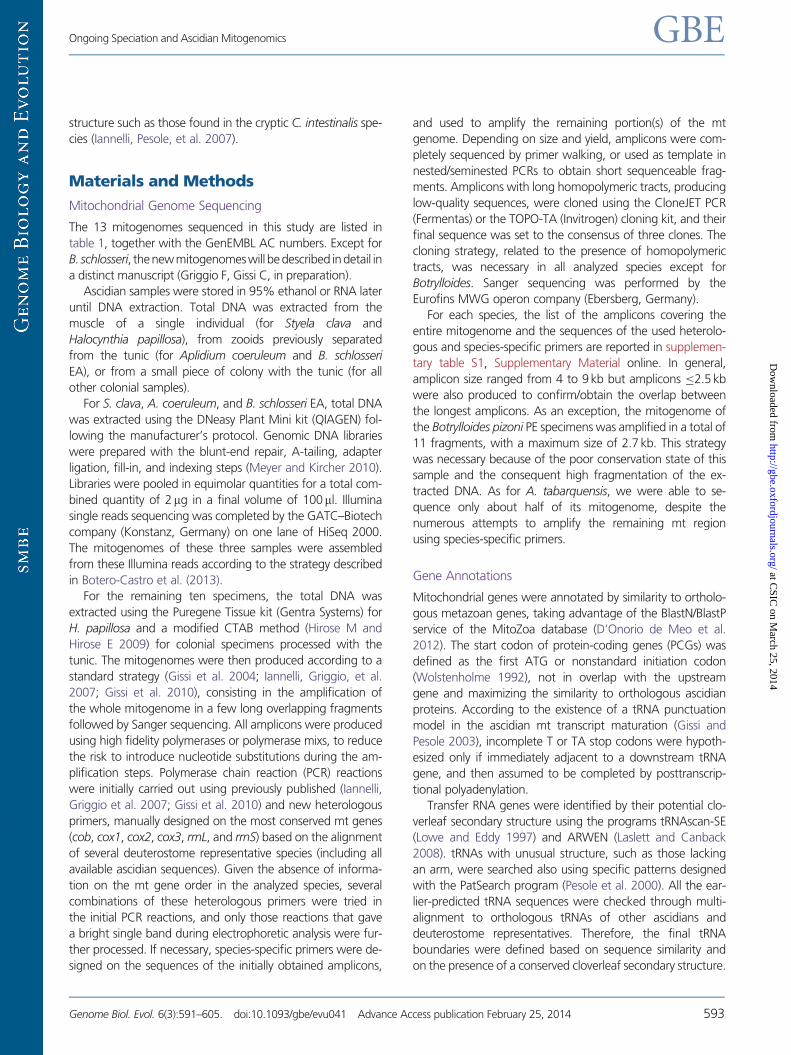
structure such as those found in the cryptic C. intestinalis spe-
cies (Iannelli, Pesole, et al. 2007).
Materials and Methods
Mitochondrial Genome Sequencing
The 13 mitogenomes sequenced in this study are listed in
table 1, together with the GenEMBL AC numbers. Except for
B. schlosseri, thenewmitogenomeswill bedescribed indetail in
a distinct manuscript (Griggio F, Gissi C, in preparation).
Ascidian samples were stored in 95% ethanol or RNA later
until DNA extraction. Total DNA was extracted from the
muscle of a single individual (for Styela clava and
Halocynthia papillosa), from zooids previously separated
from the tunic (for Aplidium coeruleum and B. schlosseri
EA), or from a small piece of colony with the tunic (for all
other colonial samples).
For S. clava, A. coeruleum, and B. schlosseri EA, total DNA
was extracted using the DNeasy Plant Mini kit (QIAGEN) fol-
lowing the manufacturer’s protocol. Genomic DNA libraries
were prepared with the blunt-end repair, A-tailing, adapter
ligation, fill-in, and indexing steps (Meyer and Kircher 2010).
Libraries were pooled in equimolar quantities for a total com-
bined quantity of 2mg in a final volume of 100ml. Illumina
single reads sequencing was completed by the GATC–Biotech
company (Konstanz, Germany) on one lane of HiSeq 2000.
The mitogenomes of these three samples were assembled
from these Illumina reads according to the strategy described
in Botero-Castro et al. (2013).
For the remaining ten specimens, the total DNA was
extracted using the Puregene Tissue kit (Gentra Systems) for
H. papillosa and a modified CTAB method (Hirose M and
Hirose E 2009) for colonial specimens processed with the
tunic. The mitogenomes were then produced according to a
standard strategy (Gissi et al. 2004; Iannelli, Griggio, et al.
2007; Gissi et al. 2010), consisting in the amplification of
the whole mitogenome in a few long overlapping fragments
followed by Sanger sequencing. All amplicons were produced
using high fidelity polymerases or polymerase mixs, to reduce
the risk to introduce nucleotide substitutions during the am-
plification steps. Polymerase chain reaction (PCR) reactions
were initially carried out using previously published (Iannelli,
Griggio et al. 2007; Gissi et al. 2010) and new heterologous
primers, manually designed on the most conserved mt genes
(cob, cox1, cox2, cox3, rrnL, and rrnS) based on the alignment
of several deuterostome representative species (including all
available ascidian sequences). Given the absence of informa-
tion on the mt gene order in the analyzed species, several
combinations of these heterologous primers were tried in
the initial PCR reactions, and only those reactions that gave
a bright single band during electrophoretic analysis were fur-
ther processed. If necessary, species-specific primers were de-
signed on the sequences of the initially obtained amplicons,
and used to amplify the remaining portion(s) of the mt
genome. Depending on size and yield, amplicons were com-
pletely sequenced by primer walking, or used as template in
nested/seminested PCRs to obtain short sequenceable frag-
ments. Amplicons with long homopolymeric tracts, producing
low-quality sequences, were cloned using the CloneJET PCR
(Fermentas) or the TOPO-TA (Invitrogen) cloning kit, and their
final sequence was set to the consensus of three clones. The
cloning strategy, related to the presence of homopolymeric
tracts, was necessary in all analyzed species except for
Botrylloides. Sanger sequencing was performed by the
Eurofins MWG operon company (Ebersberg, Germany).
For each species, the list of the amplicons covering the
entire mitogenome and the sequences of the used heterolo-
gous and species-specific primers are reported in supplemen-
tary table S1, Supplementary Material online. In general,
amplicon size ranged from 4 to 9 kb but amplicons �2.5 kb
were also produced to confirm/obtain the overlap between
the longest amplicons. As an exception, the mitogenome of
the Botrylloides pizoni PE specimens was amplified in a total of
11 fragments, with a maximum size of 2.7 kb. This strategy
was necessary because of the poor conservation state of this
sample and the consequent high fragmentation of the ex-
tracted DNA. As for A. tabarquensis, we were able to se-
quence only about half of its mitogenome, despite the
numerous attempts to amplify the remaining mt region
using species-specific primers.
Gene Annotations
Mitochondrial genes were annotated by similarity to ortholo-
gous metazoan genes, taking advantage of the BlastN/BlastP
service of the MitoZoa database (D’Onorio de Meo et al.
2012). The start codon of protein-coding genes (PCGs) was
defined as the first ATG or nonstandard initiation codon
(Wolstenholme 1992), not in overlap with the upstream
gene and maximizing the similarity to orthologous ascidian
proteins. According to the existence of a tRNA punctuation
model in the ascidian mt transcript maturation (Gissi and
Pesole 2003), incomplete T or TA stop codons were hypoth-
esized only if immediately adjacent to a downstream tRNA
gene, and then assumed to be completed by posttranscrip-
tional polyadenylation.
Transfer RNA genes were identified by their potential clo-
verleaf secondary structure using the programs tRNAscan-SE
(Lowe and Eddy 1997) and ARWEN (Laslett and Canback
2008). tRNAs with unusual structure, such as those lacking
an arm, were searched also using specific patterns designed
with the PatSearch program (Pesole et al. 2000). All the ear-
lier-predicted tRNA sequences were checked through multi-
alignment to orthologous tRNAs of other ascidians and
deuterostome representatives. Therefore, the final tRNA
boundaries were defined based on sequence similarity and
on the presence of a conserved cloverleaf secondary structure.
Ongoing Speciation and Ascidian Mitogenomics GBE
Genome Biol. Evol. 6(3):591–605. doi:10.1093/gbe/evu041 Advance Access publication February 25, 2014 593
at CSIC
on March 25, 2014
http://gbe.oxfordjournals.org/D
ownloaded from

tRNA genes were named according to the common no-
menclature of mt tRNA genes, and to the MitoZoa database
(D’Onorio de Meo et al. 2012). Thus, only the isoacceptor
tRNA genes for Gly, Ser, and Leu were named based on the
recognized codons. Moreover, the two isoacceptor tRNA
genes for Met were named based on the anticodon sequence,
due to the absence of functional data on possible differences
in the recognized codons. The boundaries of the two rRNA
genes were inferred as abutted to the flanking genes.
Comparative Analyses of the Whole Mitogenomes
Comparative analyses at intraspecies and congeneric levels
were carried out on the 28 mitogenomes listed in table 1.
The exact source and sampling date of the specimens ana-
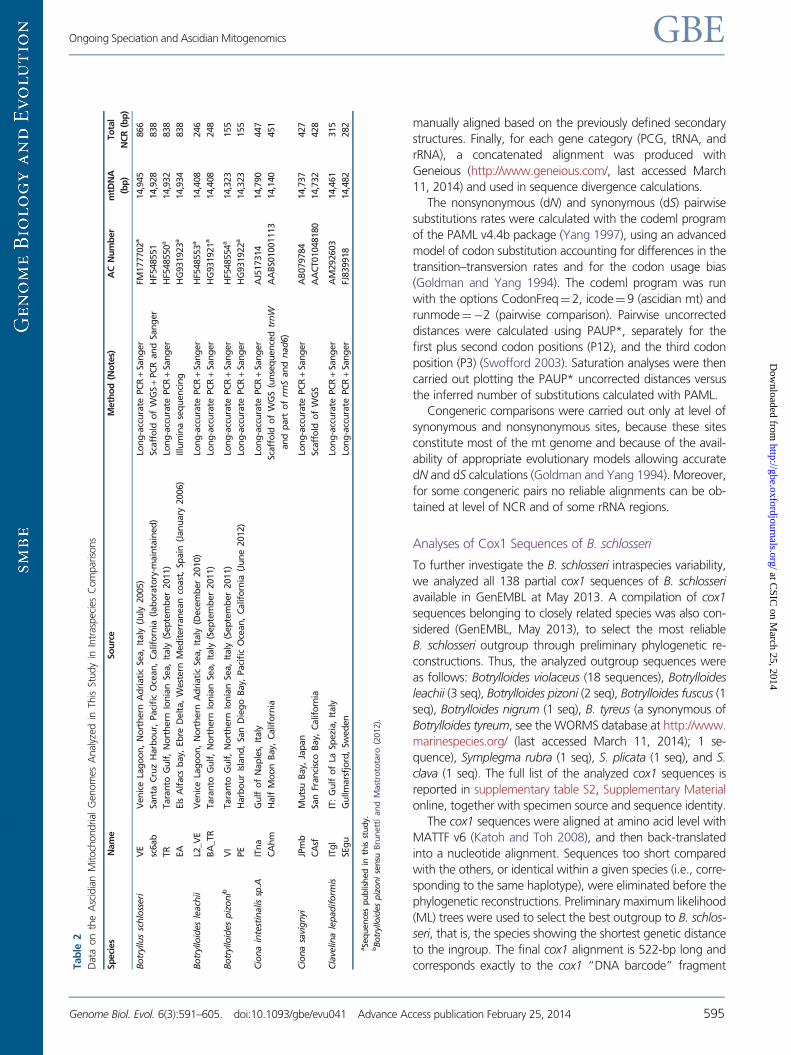
lyzed in intraspecies comparisons are reported in table 2. The
mt scaffolds of C. intestinalis sp.A and C. savignyi listed in
table 2 derive from the whole-genome shotgun (WGS) proj-
ects of these species and were already described in Iannelli,
Pesole, et al. (2007). The mt sequence of Botrylloides nigrum
(table 2) was originally published as belonging to Botrylloides
affinis leachii (Rubinstein et al. 2013) but a reanalysis of the
morphology of the voucher specimen (Shenkar N, personal
communication), together with molecular analyses on addi-
tional samples (our data), has allowed its reassignment to
Botrylloides nigrum, a species that can be easily morphologi-
cally confused with Botrylloides leachii (Brunetti 2009).
The 13 PCGs and the two rRNAs were initially aligned with
MATTF v6 (Katoh and Toh 2008) and then the alignments
were manually optimized. Protein alignments were back-trans-
lated to the nucleotide level using TranslatorX (http://transla-
torx.co.uk/, last accessed March 11, 2014). tRNA genes were
Table 1
Species Classification and Accession Number (AC) of the Mitochondrial Genomes Analyzed in This Study
Classification Species, Sample Name AC Number mtDNA (bp)
Stolidobranchia
Styelidae, Botryllinae Botrylloides nigruma HF548559 14,427
Styelidae, Botryllinae Botrylloides leachii, BA_TR HG931921b 14,408
Styelidae, Botryllinae Botrylloides leachii, L2_VE HF548553b 14,408
Styelidae, Botryllinae Botrylloides pizoni, PE HG931922b 14,323
Styelidae, Botryllinae Botrylloides pizoni, VI HF548554b 14,323
Styelidae, Botryllinae Botrylloides violaceus HF548552b 14,357
Styelidae, Botryllinae Botryllus schlosseri, EA HG931923b 14,934
Styelidae, Botryllinae Botryllus schlosseri, sc6ab HF548551 14,928
Styelidae, Botryllinae Botryllus schlosseri, TR HF548550b 14,932
Styelidae, Botryllinae Botryllus schlosseri, VE FM177702b 14,945
Styelidae Styela clava HG931920b 14,616
Styelidae Styela plicata AM292601 14,414
Pyuridae Halocynthia papillosa FM177863b 14,897
Pyuridae Halocynthia roretzi AB024528 14,771
Pyuridae Halocynthia spinosa HF548558 15,074
Phlebobranchia
Cionidae Ciona intestinalis sp.A, CAhm AABS01001113 14,140c
Cionidae Ciona intestinalis sp.A, ITna AJ517314 14,790
Cionidae Ciona intestinalis sp.B AM292218 14,591
Cionidae Ciona savignyi, CAsf AACT01048180 14,732
Cionidae Ciona savignyi, JPmb AB079784 14,737
Ascidiidae Phallusia fumigata AM292602 15,535
Ascidiidae Phallusia mammillata AM292320 14,579
Aplousobranchia
Polyclinidae Aplidium coeruleumd b 13,959c
Polyclinidae Aplidium conicum FN313538 15,183
Polyclinidae Aplidium tabarquensis HF548555b 8,117c
Clavelinidae Clavelina lepadiformis, ITgl AM292603 14,461
Clavelinidae Clavelina lepadiformis, SEgu FJ839918 14,484
Clavelinidae Clavelina phlegraea AM292604b 14,603
aSequence originally reported as belonging to Botrylloides affinis leachii (Rubinstein et al. 2013).bSequences published in this study.cPartial genomes.dGenome assembled in eight contigs.
Griggio et al. GBE
594 Genome Biol. Evol. 6(3):591–605. doi:10.1093/gbe/evu041 Advance Access publication February 25, 2014
at CSIC
on March 25, 2014
http://gbe.oxfordjournals.org/D
ownloaded from
manually aligned based on the previously defined secondary
structures. Finally, for each gene category (PCG, tRNA, and
rRNA), a concatenated alignment was produced with
Geneious (http://www.geneious.com/, last accessed March
11, 2014) and used in sequence divergence calculations.
The nonsynonymous (dN) and synonymous (dS) pairwise
substitutions rates were calculated with the codeml program
of the PAML v4.4b package (Yang 1997), using an advanced
model of codon substitution accounting for differences in the
transition–transversion rates and for the codon usage bias
(Goldman and Yang 1994). The codeml program was run
with the options CodonFreq¼2, icode¼9 (ascidian mt) and
runmode¼�2 (pairwise comparison). Pairwise uncorrected
distances were calculated using PAUP*, separately for the
first plus second codon positions (P12), and the third codon
position (P3) (Swofford 2003). Saturation analyses were then
carried out plotting the PAUP* uncorrected distances versus
the inferred number of substitutions calculated with PAML.
Congeneric comparisons were carried out only at level of
synonymous and nonsynonymous sites, because these sites
constitute most of the mt genome and because of the avail-
ability of appropriate evolutionary models allowing accurate
dN and dS calculations (Goldman and Yang 1994). Moreover,
for some congeneric pairs no reliable alignments can be ob-
tained at level of NCR and of some rRNA regions.
Analyses of Cox1 Sequences of B. schlosseri
To further investigate the B. schlosseri intraspecies variability,
we analyzed all 138 partial cox1 sequences of B. schlosseri
available in GenEMBL at May 2013. A compilation of cox1
sequences belonging to closely related species was also con-
sidered (GenEMBL, May 2013), to select the most reliable
B. schlosseri outgroup through preliminary phylogenetic re-
constructions. Thus, the analyzed outgroup sequences were
as follows: Botrylloides violaceus (18 sequences), Botrylloides
leachii (3 seq), Botrylloides pizoni (2 seq), Botrylloides fuscus (1
seq), Botrylloides nigrum (1 seq), B. tyreus (a synonymous of
Botrylloides tyreum, see the WORMS database at http://www.
marinespecies.org/ (last accessed March 11, 2014); 1 se-
quence), Symplegma rubra (1 seq), S. plicata (1 seq), and S.
clava (1 seq). The full list of the analyzed cox1 sequences is
reported in supplementary table S2, Supplementary Material
online, together with specimen source and sequence identity.
The cox1 sequences were aligned at amino acid level with
MATTF v6 (Katoh and Toh 2008), and then back-translated
into a nucleotide alignment. Sequences too short compared
with the others, or identical within a given species (i.e., corre-
sponding to the same haplotype), were eliminated before the
phylogenetic reconstructions. Preliminary maximum likelihood
(ML) trees were used to select the best outgroup to B. schlos-
seri, that is, the species showing the shortest genetic distance
to the ingroup. The final cox1 alignment is 522-bp long and
corresponds exactly to the cox1 “DNA barcode” fragmentTab
le2
Dat
aon
the
Asc
idia
nM
itoch
ondrial
Gen
om
esA
nal
yzed
inTh
isSt
udy
inIn
tras
pec
ies
Com
par
isons
Sp
eci
es
Nam
eSo
urc
eM
eth
od
(No
tes)
AC
Nu
mb
er
mtD
NA
(bp
)
To
tal
NC
R(b
p)
Bo
tryl
lus
sch
loss
eri
VE
Ven
ice
Lag
oo
n,
No
rth
ern
Ad
riati
cSe
a,
Italy
(Ju
ly2005)
Lon
g-a
ccu
rate
PC
R+
San
ger
FM177702
a14,9
45
866
sc6ab
San
taC
ruz
Harb
ou
r,Paci
fic
Oce
an
,C
alif
orn
ia(lab
ora
tory
-main
tain
ed
)Sc
aff
old
of
WG
S+
PC
Ran
dSa
ng
er
HF5
48551
14,9
28
838
TR
Tara
nto
Gu
lf,
No
rth
ern
Ion
ian
Sea,
Italy
(Sep
tem
ber
2011)
Lon
g-a
ccu
rate
PC
R+
San
ger
HF5
48550
a14,9
32
838
EA
Els
Alf
acs
bay,
Eb
reD
elt
a,
West
ern
Med
iterr
an
ean
coast
,Sp
ain
(Jan
uary
2006)
Illu
min
ase
qu
en
cin
gH
G931923a
14,9
34
838
Bo
tryl
loid
es
leach
iiL2
_VE
Ven
ice
Lag
oo
n,
No
rth
ern
Ad
riati
cSe
a,
Italy
(Dece
mb
er
2010)
Lon
g-a
ccu
rate
PC
R+
San
ger
HF5
48553
a14,4
08
246
BA
_TR
Tara
nto
Gu
lf,
No
rth
ern
Ion
ian
Sea,
Italy
(Sep
tem
ber
2011)
Lon
g-a
ccu
rate
PC
R+
San
ger
HG
931921
a14,4
08
248
Bo
tryl
loid
es
piz
on
ibV
ITara
nto
Gu
lf,
No
rth
ern
Ion
ian
Sea,
Italy
(Sep
tem
ber
2011)
Lon
g-a
ccu
rate
PC
R+
San
ger
HF5
48554
a14,3
23
155
PE
Harb
ou
rIs
lan
d,
San
Die
go
Bay,
Paci
fic
Oce
an
,C
alif
orn
ia(J
un
e2012)
Lon
g-a
ccu
rate
PC
R+
San
ger
HG
931922
a14,3
23
155
Cio
na
inte
stin
alis
sp.A
ITn
aG
ulf
of
Nap
les,
Italy
Lon
g-a
ccu
rate
PC
R+
San
ger
AJ5
17314
14,7
90
447
CA
hm
Half
Mo
on
Bay,
Calif
orn
iaSc
aff
old
of
WG
S(u
nse
qu
en
ced
trn
W
an
dp
art
of
rrn
San
dn
ad
6)
AA
BS0
1001113
14,1
40
451
Cio
na
savi
gn
yiJP
mb
Mu
tsu
Bay,
Jap
an
Lon
g-a
ccu
rate
PC
R+
San
ger
AB
079784
14,7
37
427
CA
sfSa
nFr
an
cisc
oB
ay,
Calif
orn
iaSc
aff
old
of
WG
SA
AC
T01048180
14,7
32
428
Cla
velin
ale
pad
ifo
rmis
ITg
lIT
:G
ulf
of
LaSp
ezi
a,
Italy
Lon
g-a
ccu
rate
PC
R+
San
ger
AM
292603
14,4
61
315
SEg
uG
ullm
ars
fjo
rd,
Swed
en
Lon
g-a
ccu
rate
PC
R+
San
ger
FJ839918
14,4
82
282
aSe
qu
en
ces
pu
blis
hed
inth
isst
ud
y.bB
otr
yllo
ides
piz
on
ise
nsu
Bru
nett
ian
dM
ast
roto
taro
(2012).
Ongoing Speciation and Ascidian Mitogenomics GBE
Genome Biol. Evol. 6(3):591–605. doi:10.1093/gbe/evu041 Advance Access publication February 25, 2014 595
at CSIC
on March 25, 2014
http://gbe.oxfordjournals.org/D
ownloaded from

analyzed by Bock et al. (2012). This alignment includes 71
B. schlosseri sequences and the three best outgroup sequences
belonging to Botrylloides leachii and Botrylloides nigrum.
The phylogenetic reconstructions were carried out with
PhyML v3.0 (Guindon et al. 2010). The evolutionary models
best fitting to the analyzed alignments were selected among
88 different models with jModelTest v2.1.3, using an ML op-
timized tree for likelihood calculations and according to the
Akaike Information criterion (Guindon and Gascuel 2003;
Darriba et al. 2012). The model best fitting to our final cox1
alignment was TIM3 + G (with G indicating a gamma distri-
bution for rate heterogeneity across sites).
To investigate the substitution saturation of cox1, for all
sequence pairs of the data set, we plotted the PAUP* uncor-
rected distances versus the inferred number of substitutions
calculated as PhyML patristic distances (i.e., the sum of the
lengths of all branches linking two sequences on the PhyML
tree). The PATRISTIC program (Fourment and Gibbs 2006)
was used to extract the patristic distances from the PhyML
tree.
Results and Discussion
Mitogenome Data Set
Using two different approaches, that is, a conventional long
PCR strategy followed by Sanger sequencing and an advanced
next-generation sequencing of a total DNA extract, we have
sequenced a total of 13 mitogenomes: 11 complete genomes,
belonging to 7 different species, and two partial genomes be-
longing to two Aplidium species (table 1). Together with other
available congeneric and conspecific mitogenomes, the new
sequences constitute a suitable data set for investigating the
intraspecies and congeneric variability of ascidians. Indeed, this
data set allows conspecific and congeneric analyses in six dif-
ferent species and seven different genera, respectively (table 1).
For intraspecies comparisons, only specimens sampled in
distant localities and/or in different years have been taken
into account (table 2), to be reasonably confident that
they belong to different populations. As for congeneric
comparisons, our data set includes some noteworthy species,
such as:
. representatives of both genera, Botryllus and Botrylloides,forming the subfamily Botryllinae;
. the two cryptic species of C. intestinalis, named sp.A andsp.B (Suzuki et al. 2005; Caputi et al. 2007; Iannelli, Pesole,et al. 2007; Nydam and Harrison 2007, 2010; Zhan et al.2010);
. Botrylloides leachii and Botrylloides nigrum, that is twoBotrylloides species that are morphologically very similarand are discriminated mainly based on the mode of larvaincubation (Brunetti 2009).
Finally, the analyzed intraspecies and congeneric com-
parisons concern species belonging to all three major
ascidian groups of Aplousobranchia, Phlebobranchia, and
Stolidobranchia, and thus they cover a wide phylogenetic
range (tables 1 and 2).
Intraspecies Divergence
For the ascidian species with at least two available mitogen-
omes, the intraspecies uncorrected distances were calculated
separately for the different functional mt regions, namely the
various gene categories (rRNAs, tRNAs, and PCGs), the first
plus second codon positions (P12), the third codon position
(P3), and the concatenation of the few NCR (fig. 1).
Surprisingly, the pairwise uncorrected distances within
B. schlosseri (four samples listed in table 2) are extraordinarily
higher in the five pairs involving at least one of the two (TR and
VE) Italian specimens (hereafter named Bs_Ita pairs) than in
the comparison between the Spanish (EA) and the Californian
(sc6ab) B. schlosseri samples. Therefore, figure 1 has been split
in two distinct graphs, each using a different scale: figure 1a
shows only the uncorrected distances of the B. schlosseri
Bs_Ita comparisons, while figure 1b shows the uncorrected
distances of the EA-sc6ab B. schlosseri pair and of all remain-
ing intraspecies pairs. Remarkably, the uncorrected distances
of the Bs_Ita pairs are up to one order of magnitude higher
than those of all other intraspecies comparisons and of the B.
schlosseri EA-sc6ab pair (from 4 to 59 times higher, depending
on the analyzed mt region). Taking into account just the PCGs,
that form about 75% of the whole mitogenome, the B.
schlosseri Bs_Ita pairs evolve on average 35 times faster than
the EA-sc6ab pair and 11–40 times faster than other intraspe-
cies pairs (cf. fig. 1a with fig. 1b). Thus, based on the intraspe-
cies sequence divergence, we can recognize within B.
schlosseri three distinct clusters (EA + sc6ab, VE, and TR)
that could correspond to cryptic species or to a still ongoing
speciation event. It should be noted that the existence of cryp-
tic species in B. schlosseri has been already proposed based on
the analyses of nuclear and mitochondrial markers (Bock et al.
2012). However, as discussed later, our specimens belong to
the same B. schlosseri cryptic species sensu Bock et al. (2012)
(see the paragraph “cox1 analyses”). The low sequence diver-
gence between samples coming from very distant localities
(i.e., EA from Spain and sc6ab from California) can be ex-
plained by the widely ascertained invasive nature of this spe-
cies (Lambert CC and Lambert G 1998; Lambert 2001;
Carlton 2005; Carver et al. 2006; Lejeusne et al. 2011).
As for the other analyzed ascidians, the lowest intraspecies
difference is observed within Botrylloides pizoni sensu Brunetti
and Mastrototaro (2012) that shows even no nucleotide sub-
stitutions in the tRNA and rRNA genes (absence of yellow bars
in rRNA and tRNA data of fig. 1b). As expected, in each spe-
cies the fastest evolving mt regions are the P3 or NCR, which
evolve from 1.7 up to 15.6 times faster than the P12, rRNAs,
and tRNAs of the same species (fig. 1a and b).
Griggio et al. GBE
596 Genome Biol. Evol. 6(3):591–605. doi:10.1093/gbe/evu041 Advance Access publication February 25, 2014
at CSIC
on March 25, 2014
http://gbe.oxfordjournals.org/D
ownloaded from

Congeneric Divergence in the PCGs
To clarify the relevance of the high intraspecies sequence var-
iability found in B. schlosseri, we have compared the dS and
dN nucleotide substitution rates in several intraspecies and
congeneric ascidian pairs (PAML calculations, see Materials
and Methods). Assuming that congeneric species are the
most closely related organisms above the species level, we
should observe a considerable difference and a clear-cut gap
between the dN and dS values calculated at intraspecies and
at congeneric level. It should be noted that our data set in-
cludes three different species of Botrylloides, a genus closely
related to Botryllus, so it can be considered adequate to ana-
lyze the evolutionary rate within Botryllinae.
The dS average value of the B. schlosseri Bs_Ita pairs is one
order of magnitude higher than those of other intraspecies
comparisons (0.30�0.06 substitutions/site against 0.06 for
EA-sc6ab, and 0.013�0.008 for other species). Moreover,
no evidence of dS saturation is observed at intraspecies level
(dS<1 substitution/site and saturation plot results, data not
shown), while the dS is fully saturated in all congeneric com-
parisons and even in the cryptic Ciona species pairs (dS
values> 1 substitution/site and saturation plot results, data
not shown; dS range: 3.2–3.4 in the cryptic and Botrylloides
leachii–Botrylloides nigrum species pairs, and 5.3–170.9 in
other congeneric pairs). Overall, the dS data confirm the
surprisingly high substitution rates of the B. schlosseri Bs_Ita
pairs relative to all other intraspecies pairs; however, the dS
saturation at congeneric level does not allow a reliable quan-
tification of the substitution rate differences between in-
traspecies and congeneric pairs.
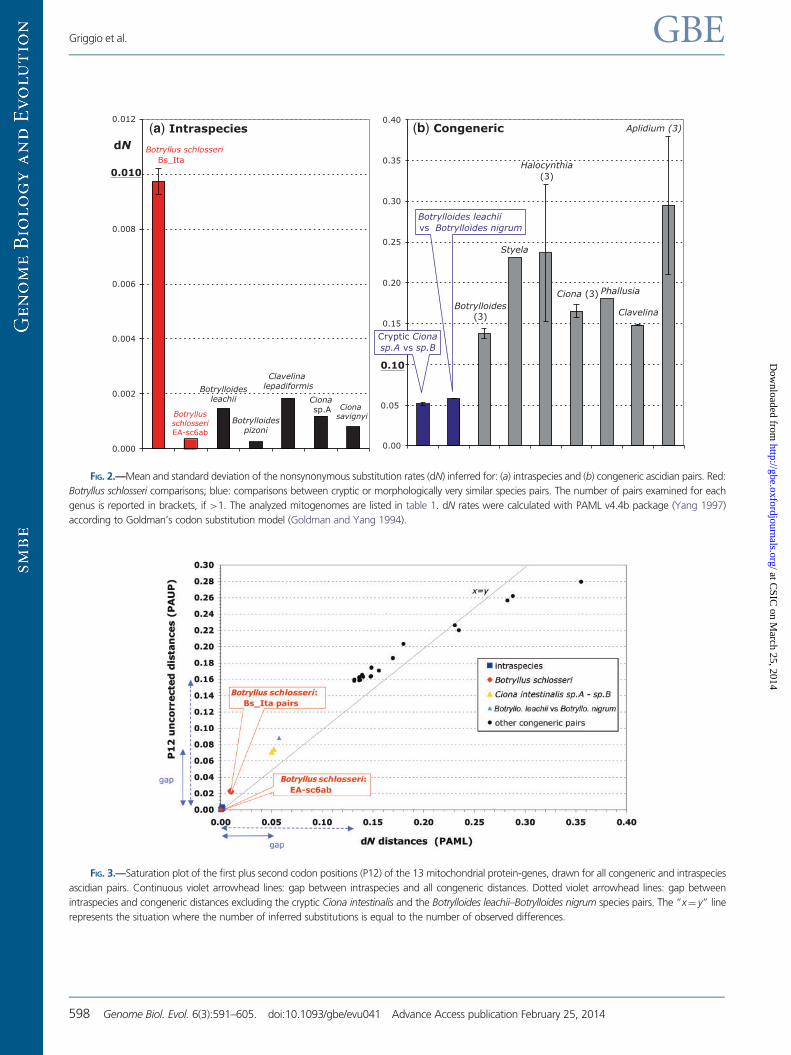
The dN rates of the analyzed intraspecies and congeneric
comparisons are shown in two distinct panels of figure 2, each
using a different scale. In each panel, almost all values have
the same order of magnitude and are well comparable: the
only exception is again provided by the surprisingly high dN
values of the B. schlosseri Bs_Ita pairs (red bar in fig. 2a), which
are 5–39 times higher than that found in other intraspecies
comparisons but still 5–30 times lower than that of congeneric
pairs (fig. 2b). Thus, the dN values of these exceptional
B. schlosseri Bs_Ita pairs are exactly in between those com-
monly observed in intraspecies and congeneric pairs. This is
also evident in the dN saturation plot of figure 3, which not
only demonstrates the absence of nonsynonymous saturation
at both intraspecies and congeneric level but also clearly
shows that the dN values of the Bs_Ita pairs are considerably
above all other intraspecies values and below the lowest in-
terspecies dN values observed in the cryptic C. intestinalis
sp.A–sp.B species and in the two morphologically very close
species Botrylloides leachii and Botrylloides. nigrum (see trian-
gles in fig. 3 and blue bars in fig. 2). These data suggest that
FIG. 1.—Uncorrected distances (in %) of 11 intraspecies comparisons, calculated on the various functional regions of the mitochondrial genome. Note
the different scale used in the two panels. (a) The four Botryllus schlosseri intraspecies pairs involving at least one of the two VE and TR Italian specimens
(Bs_Ita pairs). (b) The EA-sc6ab B. schlosseri pair and all other intraspecies comparisons. P12: first and second codon positions; P3: third codon position. The
analyzed mitogenomes are listed in table 2, together with specimen abbreviation and source data.
Ongoing Speciation and Ascidian Mitogenomics GBE
Genome Biol. Evol. 6(3):591–605. doi:10.1093/gbe/evu041 Advance Access publication February 25, 2014 597
at CSIC
on March 25, 2014
http://gbe.oxfordjournals.org/D
ownloaded from
Botrylloidespizoni
Botrylloidesleachii
Clavelina lepadiformis
Botryllus schlosseri Bs_Ita
BotryllusschlosseriEA-sc6ab
Ciona savignyi
Ciona sp.A
0.000
0.002
0.004
0.006
0.008
0.010
0.012
Styela
Clavelina
Ciona (3)
Halocynthia (3)
Botrylloides(3)
Aplidium (3)
Phallusia
0.00
0.05
0.10
0.15
0.20
0.25
0.30
0.35
0.40
Botrylloides leachii vs Botrylloides nigrum
(b) Congeneric
Cryptic Ciona sp.A vs sp.B
dN
0.010
0.10
(a) Intraspecies
FIG. 2.—Mean and standard deviation of the nonsynonymous substitution rates (dN) inferred for: (a) intraspecies and (b) congeneric ascidian pairs. Red:
Botryllus schlosseri comparisons; blue: comparisons between cryptic or morphologically very similar species pairs. The number of pairs examined for each
genus is reported in brackets, if >1. The analyzed mitogenomes are listed in table 1. dN rates were calculated with PAML v4.4b package (Yang 1997)
according to Goldman’s codon substitution model (Goldman and Yang 1994).
FIG. 3.—Saturation plot of the first plus second codon positions (P12) of the 13 mitochondrial protein-genes, drawn for all congeneric and intraspecies
ascidian pairs. Continuous violet arrowhead lines: gap between intraspecies and all congeneric distances. Dotted violet arrowhead lines: gap between
intraspecies and congeneric distances excluding the cryptic Ciona intestinalis and the Botrylloides leachii–Botrylloides nigrum species pairs. The “x¼ y” line
represents the situation where the number of inferred substitutions is equal to the number of observed differences.
Griggio et al. GBE
598 Genome Biol. Evol. 6(3):591–605. doi:10.1093/gbe/evu041 Advance Access publication February 25, 2014
at CSIC
on March 25, 2014
http://gbe.oxfordjournals.org/D
ownloaded from

the high intraspecies sequence divergence observed in our B.
schlosseri specimens is compatible with an ongoing speciation
process or with the presence of genetically separated cryptic
species.
The conspecific and congeneric comparisons here analyzed
highlight the existence of a substantial gap between intraspe-
cies and congeneric dN rates, that becomes even wider when
the congeneric data set is deprived of the cryptic and morpho-
logically very similar species pairs (fig. 3). In particular, exclud-
ing the B. schlosseri Bs_Ita pairs, the delta between the highest
intraspecies and the lowest interspecies dN values ranges from
0.05 for the whole congeneric data set, to 0.13 for a reduced
data set deprived of the pairs C. intestinalis sp.A–sp.B and
Botrylloides leachii–Botrylloides nigrum (violet arrowed lines
in fig. 3). It can be also noted that, without the B. schlosseri
Bs_Ita pairs, the dN rate is relatively constant at both intraspe-
cies and interspecies level, because it varies only 7 times at
intraspecies level, and 3–7 times at congeneric level depending
on the exclusion/inclusion in the data set of the cryptic Ciona
and Botrylloides leachii–Botrylloides nigrum pairs (fig. 2). As
our data set includes species of all three major ascidian line-
ages, selected without any peculiar bias and only based on
mitogenome availability (tables 1 and 2), we can assume
that the intraspecies and congeneric dN ranges here estimated
are representative of the ascidian variability. This observation
further supports the exceptional character of the Bs_Ita pairs
compared with both intraspecies and congeneric comparisons,
and then the existence of ongoing/cryptic speciation events
separating VE, TR, and the EA+sc6ab B. schlosseri specimens.
cox1 Analyses
Botryllus schlosseri has been the target of many population
genetic studies based on the standard “DNA barcode,” that is
a fragment of the mt cox1 gene, about 650-bp long, hereafter
referred as “cox1 barcode-fragment” (Folmer et al. 1994;
Lopez-Legentil et al. 2006; Lejeusne et al. 2011; Bock et al.
2012). Here, we have checked whether the intraspecies var-
iability observed in our B. schlosseri samples through whole-
mitogenome comparisons is detectable also by the analysis of
the cox1 barcode-fragment.
Our four B. schlosseri specimens have cox1 sequences
equal to haplotypes already sampled in other world localities
(supplementary table S2, Supplementary Material online; see
also square brackets in figure 4, reporting the number of cox1
GenEMBL entries showing a given haplotype). The ML phylo-
genetic tree of all available cox1 sequences of B. schlosseri
(fig. 4) identifies only five well-supported groups, perfectly
corresponding to the monophyletic A to E clades previously
recognized by Bock as distinct and, probably, reproductively
isolated cryptic species (Bock et al. 2012). This data set does
not show substitution saturation in all (supplementary fig. S1,
Supplementary Material online) as well as in the third codon
positions (data not shown), but the slope of the regression line
is very different for the intraclade and the interclade compar-
isons. Moreover, there is a wide gap between intraclade and
interclade distances (supplementary fig. S1 and phylogram of
supplementary fig. S2, Supplementary Material online), a fea-
ture that reminds the well-known “DNA barcode gap”
(Goldstein and DeSalle 2011). Thus, the deep genetic separa-
tion observed between these clades, coupled with inconsis-
tencies in the morphological description of B. schlosseri (Boyd
et al. 1990), could also indicate that each of these clades
corresponds to closely related but distinct species, all incor-
rectly assigned to B. schlosseri due to the intrinsic difficulties in
the morphological identification/description of this species.
In the cox1 phylogenetic tree of figure 4, all our B. schlosseri
specimens fall within clade A, previously described as the most
common and widespread B. schlosseri cryptic species (Bock
et al. 2012). Interestingly, the cox1 tree leaves unresolved
almost all relationships within clade A, except for the identifi-
cation of a highly supported subclade (96% bootstrap) includ-
ing our VE specimen and few other haplotypes (see arrow in
fig. 4). Therefore, the cox1 barcode-fragment does not rec-
ognize the intraspecies differences that were clearly identified
by the whole-mitogenome comparisons. We can hypothesize
that the cox1 barcode-fragment is unable to identify subtle,
yet biologically significant, intraspecies differences due to its
short length and the consequent low phylogenetic signal. In
contrast, our comprehensive nucleotide substitution study car-
ried out on the whole mitogenome captures this information
quite easily, provided that sufficient intraspecies and conge-
neric pairs are available for comparative analyses.
To our knowledge, no other studies have compared the
resolving power of the cox1 barcode-fragment to that of
the whole mitogenome. However, it is known that the cox1
barcode is of limited usefulness not only in animals with slow-
evolving mitogenomes, such as Cnidara and Porifera (Bucklin
et al. 2011), but also in the fast-evolving mitogenomes of
Amphibia, where the absence of a sharp distinction between
intra- and interspecific divergence values complicates the clear
establishment of a threshold for species discrimination (Vences
et al. 2005).
Botryllus schlosseri Mitogenome Structure
To complete the B. schlosseri intraspecies analyses, we have
carefully compared the mt genome structure of our four
B. schlosseri specimens. All these mitogenomes contain the
canonical tunicate gene complement (including the tunicate-
specific trnM(UAU) and trnG(GGN) genes) and have identical
gene order, with all genes encoded by the same strand (fig. 5).
Only small differences have been observed in genome size
(delta range: 4–17 bp) and total NCR length (delta: 29 bp)
(table 2).
As shown in figure 5, differences in the length of NCRs/
overlaps can be found at nine gene adjacencies but are size-
able only in four cases (fig. 5: bold number below the gene
Ongoing Speciation and Ascidian Mitogenomics GBE
Genome Biol. Evol. 6(3):591–605. doi:10.1093/gbe/evu041 Advance Access publication February 25, 2014 599
at CSIC
on March 25, 2014
http://gbe.oxfordjournals.org/D
ownloaded from
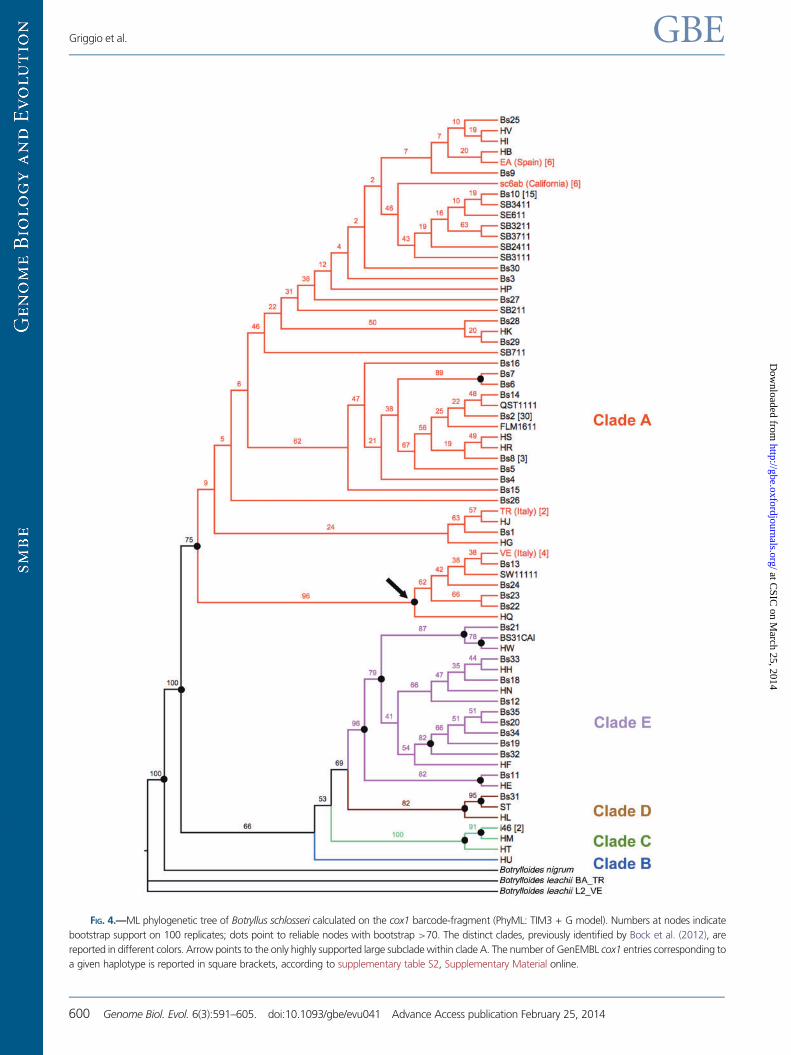
FIG. 4.—ML phylogenetic tree of Botryllus schlosseri calculated on the cox1 barcode-fragment (PhyML: TIM3 + G model). Numbers at nodes indicate
bootstrap support on 100 replicates; dots point to reliable nodes with bootstrap >70. The distinct clades, previously identified by Bock et al. (2012), are
reported in different colors. Arrow points to the only highly supported large subclade within clade A. The number of GenEMBL cox1 entries corresponding to
a given haplotype is reported in square brackets, according to supplementary table S2, Supplementary Material online.
Griggio et al. GBE
600 Genome Biol. Evol. 6(3):591–605. doi:10.1093/gbe/evu041 Advance Access publication February 25, 2014
at CSIC
on March 25, 2014
http://gbe.oxfordjournals.org/D
ownloaded from

order diagram). Remarkably, these sizeable NCR differences
are due to real indels only in two positions (indels of 11 and
13 bp at the adjacencies trnW-trnL(CUN) and trnG(GGN)-trnD,
respectively; large black arrows in fig. 5). On the contrary, at
the two other adjacencies (large white arrows in fig. 5) the
NCR differences are due to the presence of a short sequence
acting as NCR or as coding region depending on the specimen
(11- and 7-bp long in trnS(UCN)-nad6 and trnP-nad4, respec-
tively). In particular, these last two cases are caused by the
different size of a single large homopolymer (�9 T) located
just at the beginning of a protein gene (nad6 and nad4, re-
spectively) and by the consequent shift in the start codon of
the protein-gene itself.
The NCR size variability found within B. schlosseri follows a
pattern similar to that observed in the other analyzed intraspe-
cies comparisons. Indeed, as shown in supplementary figure
S3, Supplementary Material online, only few NCR size differ-
ences, always of small extent, have been found in some in-
traspecies comparisons (no intraspecies NCR differences have
been found in C. savignyi and Botrylloides pizoni). Moreover,
almost all these NCR differences are due to changes in the
length of omopolymeric stretches located within or close to
the same NCRs. For example, within Clavelina lepadiformis all
NCR size differences are due to the variable length of one/
more homopolymers (�9 T) that cause the shift of the start/
stop codon of the adjacent protein-gene (supplementary fig.
S3, Supplementary Material online). Similarly, in C. intestinalis
sp.A, NCR size differences are due to changes in the length of
T or A homopolymers �6 nucleotides or in the number of
dinucleotide repeats.
In conclusion, the structural features are (almost) identical
between the four analyzed B. schlosseri mitogenomes, show-
ing a situation not comparable with that previously observed
in the C. intestinalis cryptic species, where significant changes
in gene order, NCR and base composition have been found
(Iannelli, Pesole, et al. 2007).
As a peculiarity, all B. schlosseri mt genomes encode for
three tRNA-like structures, named K2, K3, and L2 because
they show, at the position corresponding to the possible an-
ticodon, the sequence typical of the trnK or trnL(UUR) genes
(figs. 5 and 6a and b). Although quite conserved at intraspe-
cies level, these tRNA-like structures show several features
quite uncommon in functional mt tRNAs (Kumazawa and
Nishida 1993), which suggest that none of them is a func-
tional tRNA. As shown in figure 6, these unusual features
include the following:
. the lack of the T-arm (in K2),
. the absence of the nucleotide spacer between the D- andthe anticodon (AC)-arm (in K3),
. the presence of a purine instead of a pyrimidine at the semi-invariant position just 50 of the anticodon (in K2),
. the presence of a base mispairing at the basis of the aminoacid acceptor (AA) stem (in K2 and K3),
. the presence of too many mispairing in the AA stem (in L2).
To obtain further hints on their possible functional role, we
have also compared the overall evolutionary pattern of these
three tRNA-like structures to that of the 24 canonical tRNAs of
B. schlosseri (excluding the pair EA-sc6ab, because these se-
quences are almost identical at tRNA level). Although the level
of nucleotide conservation is quite variable among the differ-
ent tRNAs (% differences: 0–6.9% nucleotide differences),
the identified tRNA-like structures evolve faster than most ca-
nonical tRNAs (1.6–10.4% nucleotide differences). As for the
distribution of the nucleotide differences among the various
stem/loop elements of a tRNA, in the canonical tRNAs most
substitutions occur in the T-arm (40�7%), mainly in the rel-
ative loop, followed, in almost equal measure, by the loop of
the D-arm and by the AA-arm (18–20%) (fig. 6c). Remarkably,
this trend is not observed in L2 and K2 that show an excess of
substitutions in the D-arm (up to 67%) and AC-arm (up to
50%), respectively. Finally, in the canonical tRNAs, 90% of the
FIG. 5.—Mitochondrial genome organization of the four Botryllus schlosseri specimens, with size of the NCR. Black boxes: NCRs>20bp; gray boxes:
NCRs> 20 bp containing a tRNA-like structure. Negative numbers indicate gene overlaps. NCRs with equal/different length in the four specimens are shown
above and below the gene order diagram, respectively. Large black arrows: large NCR differences due to real indels. White arrows: large NCR differences due
to the inclusion of a short sequence in a NCR or in a gene region, depending on the specimen. tRNAs are named by the transported amino acid (see also
Materials and Methods). 8, atp8; Ga, tRNA-Gly(AGR); Gg, tRNA-Gly(GGN); Lu, tRNA-Leu(UUR); Lc, tRNA-Leu(CUN); Mc, tRNA-Met(CAU); Mu, tRNA-
Met(UAU); Sa, tRNA-Ser(AGY); Su, tRNA-Ser(UCN).
Ongoing Speciation and Ascidian Mitogenomics GBE
Genome Biol. Evol. 6(3):591–605. doi:10.1093/gbe/evu041 Advance Access publication February 25, 2014 601
at CSIC
on March 25, 2014
http://gbe.oxfordjournals.org/D
ownloaded from

total stem differences are compensatory substitutions, while
in K3 and L2 there is no prevalence of compensatory substi-
tutions. In conclusion, the overall evolutionary pattern of L2,
K2, and K3 (fastest substitution rate, unusual distribution of
the nucleotide substitution among the different stem/loop
regions, and few compensatory substitution) does not support
their role as tRNAs. However, the observed intraspecies con-
servation suggests an unknown function. Finally, the absence
of significant similarity to other mt genes/regions prevents us
from putting forward any hypothesis on their origin.
A T-A
A-TA-TA-T
G-TG-C
T-A TA TATTA T
G A ||||| A TTTCG ATAAT TC ||||| A T GAAGT AT G T G
T-AT-A
T-A A-T A-T
T CT ATTT
T G-T T-A T-A A-T A-T T-A A-T T CCCT R GAG G |||| A A ACG GGGA AG ||| C T TGC A TTA G TT
R-T A-T A-T G-C T T T A C G TAA
T A-T T-A T-A C-G T-A A-T
T T T TG
A A G T TAGG RA |||| T A GTCY G
a G A G T-A T-A A-T T-A G-Y T A
R A TTT
T T-A T-A
T-GHxTHxG
A A A-T TT TAA A TGAT T Y A M |||| C
T YATY ATTA AA xx| A TTAT AYAY A T A T A T ATY A-T T A-T A-T A A G-T A T C A TAA
G T-A A-T A-T A-T G-C G-C
T T TT T TAA Y A A |x| Y TTGA AYT A
A |||| T TT T AACT T
R T-A T-A T-G A-T G-C T G T A TTT
trnL(UUR)
K2 K3
L2
trnK(a)
(b) (c)
FIG. 6.—Secondary structures of trnK, trnL(UUR), and three tRNA-like structures (K2, K3, and L2), together with the overall tRNA nucleotide substitution
pattern within Botryllus schlosseri. (a) Secondary structure of trnK and the tRNA-like structures K2 and K3. (b) Secondary structure of trnL(UUR) and the tRNA-
like structure L2. (c) Distribution of nucleotide substitutions in the different structural elements of the B. schlosseri tRNAs. Numbers indicate average and
standard deviation of the pairwise nucleotide differences (in percentage), over all 24 tRNAs and in five B. schlosseri pairwise comparisons (the EA-sc6ab pair
was excluded due to the almost identity between the tRNA sequences). Gray background: sites with nucleotide substitutions (upper case) or indels (lower
case) in at least one of the six intraspecies B. schlosseri pairs. Borders: sites with uncommon features for functional tRNAs. “x”: nucleotide mispairing in at
least one of the four specimens, due to noncompensatory substitutions.
Griggio et al. GBE
602 Genome Biol. Evol. 6(3):591–605. doi:10.1093/gbe/evu041 Advance Access publication February 25, 2014
at CSIC
on March 25, 2014
http://gbe.oxfordjournals.org/D
ownloaded from

Conclusions
In this study, we have performed congeneric and conspecific
comparative analyses on a total of 28 ascidian mitogenomes,
including 13 new mitogenomes, with the aim of studying the
nucleotide substitution rate of ascidians at short phylogenetic
distances. For the sake of accuracy, the substitution rate anal-
yses have been carried out at whole-genome level considering
separately the different functional regions of this molecule
(i.e., the different gene categories as well the different
codon positions and the NCRs). Although our taxon sampling
is far from being comprehensive, both our intraspecies and
congeneric data sets include species belonging to the main
ascidian groups of Aplouso-, Phlebo-, and Stolido-branchia.
Moreover, the comparisons between cryptic (C. intestinalis
sp.A–sp.B) and morphologically very similar (Botrylloides
leachii–Botrylloides nigrum) species add further validity to
our data set, because they permit a more straightforward in-
terpretation of the identified substitution rate differences.
Thus, despite its small size, our data set can be considered
quite solid for the aim of this study.
Our analyses show that, although each ascidian species
has its own peculiar evolutionary rate, the nucleotide sub-
stitution rate is quite homogeneous at intraspecies level,
thus allowing the easy recognition of extraordinary cases,
such as those of our B. schlosseri specimens. Homogeneous
values in the nucleotide substitution rate are observed even
at congeneric level, with the lowest congeneric rates found
in the comparisons between cryptic and morphologically
very similar species. Noteworthy, the congeneric dN
values are up to two orders of magnitude higher than
those found at intraspecies level, highlighting the presence
of a wide gap between intraspecies and congeneric evolu-
tionary rates. The existence of this gap is again crucial to try
to elucidate the biological meaning of extraordinary cases
of intraspecies divergence, such as those found in the B.
schlosseri Italian specimens. Indeed, the nucleotide substi-
tution rate found in the Bs_Ita pairs is almost in between the
rates observed at intraspecies and at congeneric level, but
yet consistently lower than those found in cryptic (C. intes-
tinalis sp.A–sp.B) and in morphologically very similar
(Botrylloides leachii–Botrylloides nigrum) species pairs.
These data suggest that our B. schlosseri specimens are
the product of ongoing speciation events. Strikingly, the
intraspecies divergence of the Bs_Ita pairs is easily detect-
able by whole-mitogenome nucleotide substitution analy-
ses but indiscernible by the cox1 barcode-fragment. Indeed,
in the cox1 phylogenetic tree, our four specimens fall within
the same clade, whose internal relationships are however
completely unresolved. This observation points to a higher
resolving power of the whole mitogenome compared with
cox1, especially in case of subtle speciation events. To fur-
ther verify this hypothesis, it will be interesting to sequence
and carry out comparative analyses on the entire
mitogenome of specimens belonging to each of the differ-
ent B. schlosseri clades/cryptic species identified by Bock
et al. (2012): we can envisage that these mitogenomes
will exhibit highly divergent sequences and dN values com-
parable with those found in congeneric comparisons.
We need to stress that the high resolving power at short
phylogenetic distances of our whole-mitogenome compara-
tive approach, coupled with the easy mitogenome sequencing
through NGS technology, will be helpful for the investigation
of speciation events and close phylogenetic relationships es-
pecially in taxa representing a challenge for morphological
studies. Among ascidians, Botryllinae is one of these problem-
atical taxa. Indeed, the debated Botryllinae classification has
been revised several times (Saito and Okuyama 2003; Brunetti
2009). Moreover, inconsistencies in the morphological de-
scription of B. schlosseri have already suggested that more
than one species is currently classified as B. schlosseri (Boyd
et al. 1990).
In conclusion, our study underlines how comprehensive mt
comparative analyses of the nucleotide substitution rate, cal-
culated separately for the different functional mitogenomic
regions, is able to solve debatable taxonomic questions at
short phylogenetic distances, such as the existence of subtle
ongoing speciation events. However, to reach this goal, com-
parative analyses need to be performed on an appropriate
number and type of conspecific and congeneric comparisons.
Thus, the mitogenomic comparative approach is valid at low
taxonomic level even in absence of significant differences in
genome structure, such as those observed in the C. intestinalis
cryptic species (Iannelli, Pesole, et al. 2007).
Supplementary Material
Supplementary figures S1–S3 and tables S1 and S2 are avail-
able at Genome Biology and Evolution online (http://www.
gbe.oxfordjournals.org/).
Acknowledgments
The authors thank Riccardo Brunetti and Noa Shenkar for
helpful discussions on the Botryllinae taxonomy; Loriano
Ballarin, Nicola Franchi, and Fabio Gasparini for discussions
on the B. schlosseri intraspecies variability; Adriana Giumbo
and Cosimo Di Fonzo for support on the sequencing of some
mt genomes. This work was supported by the Ministero
dell’Istruzione, dell’Universita e della Ricerca, Italy (PRIN-
2009) to C.G., Lifewatch (Consiglio Nazionale delle Ricerche,
Italy) to G.P., the National Institute of Health grants
RO1GM100315 and 1R01AG037968 to A.V., and the
Agence Nationale de la Recherche “Programme Blanc”
(Tunicate Evo-Devo “TED”) to E.J.P.D. This is contribution
No. 2014-YYY of the Institut des Sciences de l’Evolution de
Montpellier (UMR 5554 – UM2 + CNRS + IRD).
Ongoing Speciation and Ascidian Mitogenomics GBE
Genome Biol. Evol. 6(3):591–605. doi:10.1093/gbe/evu041 Advance Access publication February 25, 2014 603
at CSIC
on March 25, 2014
http://gbe.oxfordjournals.org/D
ownloaded from

Literature CitedBock DG, MacIsaac HJ, Cristescu ME. 2012. Multilocus genetic analyses
differentiate between widespread and spatially restricted cryptic spe-
cies in a model ascidian. Proc Biol Sci. 279:2377–2385.
Botero-Castro F, et al. 2013. Next-generation sequencing and phyloge-
netic signal of complete mitochondrial genomes for resolving the evo-
lutionary history of leaf-nosed bats (Phyllostomidae). Mol Phylogenet
Evol. 10:278–279.
Bourlat SJ, et al. 2006. Deuterostome phylogeny reveals monophyletic
chordates and the new phylum Xenoturbellida. Nature 444:85–88.
Boyd HC, Weissman IL, Saito Y. 1990. Morphologic and genetic verifica-
tion that Monterey Botryllus and Woods Hole Botryllus are the same
species. Biol Bull. 178:239–250.
Brunetti R. 2009. Botryllid species (Tunicata, Ascidiacea) from the
Mediterranean coast of Israel, with some considerations on the sys-
tematics of Botryllinae. Zootaxa 2289:18–32.
Brunetti R, Mastrotoraro F. 2012. Botrylloides pizoni, a new species of
Botryllinae (Ascidiacea) from the Mediterranean Sea. Zootaxa 3258:
28–36.
Bucklin A, Steinke D, Blanco-Bercial L. 2011. DNA barcoding of marine
metazoa. Ann Rev Mar Sci. 3:471–508.
Caputi L, et al. 2007. Cryptic speciation in a model invertebrate chordate.
Proc Natl Acad Sci U S A. 104:9364–9369.
Carlton JT. 2005. Setting ascidian invasions on the global stage.
International invasive sea squirt conference. Woods Hole (MA):
Woods Hole Oceanographic Institution.
Carver CE, Mallet AL, Vercaemer B. 2006. Biological synopsis of the colo-
nial tunicates, Botryllus schlosseri and Botrylloides violaceus. Can Man
Rep Fish Aquat Sci. 2747:1–42.
D’Onorio de Meo P, et al. 2012. MitoZoa 2.0: a database resource and
search tools for comparative and evolutionary analyses of mitochon-
drial genomes in Metazoa. Nucleic Acids Res. 40:D1168–D1172.
Darriba D, Taboada GL, Doallo R, Posada D. 2012. jModelTest 2: more
models, new heuristics and parallel computing. Nat Methods. 9:772.
Dehal P, et al. 2002. The draft genome of Ciona intestinalis: insights into
chordate and vertebrate origins. Science 298:2157–2167.
Delsuc F, Brinkmann H, Chourrout D, Philippe H. 2006. Tunicates and not
cephalochordates are the closest living relatives of vertebrates. Nature
439:965–968.
Denoeud F, et al. 2010. Plasticity of animal genome architecture un-
masked by rapid evolution of a pelagic tunicate. Science 330:
1381–1385.
Folmer O, Black M, Hoeh W, Lutz R, Vrijenhoek R. 1994. DNA primers for
amplification of mitochondrial cytochrome c oxidase subunit I from
diverse metazoan invertebrates. Mol Mar Biol Biotechnol. 3:294–299.
Fourment M, Gibbs MJ. 2006. PATRISTIC: a program for calculating pa-
tristic distances and graphically comparing the components of genetic
change. BMC Evol Biol. 6:1.
Gissi C, Iannelli F, Pesole G. 2004. Complete mtDNA of Ciona intestinalis
reveals extensive gene rearrangement and the presence of an atp8
and an extra trnM gene in ascidians. J Mol Evol. 58:376–389.
Gissi C, Iannelli F, Pesole G. 2008. Evolution of the mitochondrial genome
of Metazoa as exemplified by comparison of congeneric species.
Heredity 101:301–320.
Gissi C, Pesole G. 2003. Transcript mapping and genome annotation of
ascidian mtDNA using EST data. Genome Res. 13:2203–2212.
Gissi C, Pesole G, Mastrototaro F, Iannelli F, Guida V, Griggio F. 2010.
Hypervariability of ascidian mitochondrial gene order: exposing the
myth of deuterostome organelle genome stability. Mol Biol Evol. 27:
211–215.
Goldman N, Yang Z. 1994. A codon-based model of nucleotide
substitution for protein-coding DNA sequences. Mol Biol Evol. 11:
725–736.
Goldstein PZ, DeSalle R. 2011. Integrating DNA barcode data and taxo-
nomic practice: determination, discovery, and description. Bioessays
33:135–147.
Govindarajan AF, Bucklin A, Madin LP. 2011. A molecular phylogeny of
the Thaliacea. J Plankton Res. 33:843–853.
Guindon S, et al. 2010. New algorithms and methods to estimate maxi-
mum-likelihood phylogenies: assessing the performance of PhyML
3.0. Syst Biol. 59:307–321.
Guindon S, Gascuel O. 2003. A simple, fast, and accurate algorithm to
estimate large phylogenies by maximum likelihood. Syst Biol. 52:
696–704.
Hirose M, Hirose E. 2009. DNA barcoding in photosymbiotic
species of Diplosoma (Ascidiacea: Didemnidae), with the description
of a new species from the southern Ryukyus, Japan. Zool Sci. 26:
564–568.
Holland LZ, Gibson-Brown JJ. 2003. The Ciona intestinalis genome: when
the constraints are off. Bioessays 25:529–532.
Iannelli F, Griggio F, Pesole G, Gissi C. 2007. The mitochondrial genome of
Phallusia mammillata and Phallusia fumigata (Tunicata, Ascidiacea):
high genome plasticity at intra-genus level. BMC Evol Biol. 7:155.
Iannelli F, Pesole G, Sordino P, Gissi C. 2007. Mitogenomics reveals two
cryptic species in Ciona intestinalis. Trends Genet. 23:417–422.
Jeffery WR. 2007. Chordate ancestry of the neural crest: new insights from
ascidians. Semin Cell Dev Biol. 18:481–491.
Katoh K, Toh H. 2008. Recent developments in the MAFFT multiple se-
quence alignment program. Brief Bioinform. 9:286–298.
Kott P. 1990. The Australian Ascidiacea, part 2, Aplousobranchiata (1).
Mem Qld Mus. 29:1–299.
Kumazawa Y, Nishida M. 1993. Sequence evolution of mitochondrial
tRNA genes and deep-branch animal phylogenetics. J Mol Evol. 37:
380–398.
Lambert CC, Lambert G. 1998. Non-indigenous ascidians in southern
California harbours and marinas. Mar Biol. 130:675–688.
Lambert G. 2001. A global review of ascidian introduction and their pos-
sible impact on the endemic fauna. In: Sawada R, Yokosawa H,
Lambert CC, editors. The biology of ascidians. Heidelberg, New
York, Tokyo: Springer-Verlag.
Laslett D, Canback B. 2008. ARWEN: a program to detect tRNA genes in
metazoan mitochondrial nucleotide sequences. Bioinformatics 24:
172–175.
Lejeusne C, Bock DG, Therriault TW, MacIsaac HJ, Cristescu ME. 2011.
Comparative phylogeography of two colonial ascidians reveals con-
trasting invasion histories in North America. Biol Inv. 13:635–650.
Lemaire P. 2011. Evolutionary crossroads in developmental biology: the
tunicates. Development 138:2143–2152.
Lemaire P, Smith WC, Nishida H. 2008. Ascidians and the plasticity of the
chordate developmental program. Curr Biol. 18:R620–R631.
Lopez-Legentil S, Turon X, Planes S. 2006. Genetic structure of the star sea
squirt, Botryllus schlosseri, introduced in southern European harbours.
Mol Ecol. 15:3957–3967.
Lowe TM, Eddy SR. 1997. tRNAscan-SE: a program for improved detection
of transfer RNA genes in genomic sequence. Nucleic Acids Res. 25:
955–964.
Manni L, Zaniolo G, Cima F, Burighel P, Ballarin L. 2007. Botryllus schlos-
seri: a model ascidian for the study of asexual reproduction. Dev Dyn.
236:335–352.
Meyer M, Kircher M. 2010. Illumina sequencing library preparation for
highly multiplexed target capture and sequencing. Cold Spring Harb
Protoc. 6:1–10.
Nydam ML, Harrison RG. 2007. Genealogical relationships within and
among shallow-water Ciona species (Ascidiacea). Mar Biol. 151:
1839–1847.
Nydam ML, Harrison RG. 2010. Polymorphism and divergence within the
ascidian genus Ciona. Mol Phylogenet Evol. 56:718–726.
Griggio et al. GBE
604 Genome Biol. Evol. 6(3):591–605. doi:10.1093/gbe/evu041 Advance Access publication February 25, 2014
at CSIC
on March 25, 2014
http://gbe.oxfordjournals.org/D
ownloaded from

Perez-Portela R, Bishop JD, Davis AR, Turon X. 2009. Phylogeny of the
families Pyuridae and Styelidae (Stolidobranchiata, Ascidiacea) inferred
from mitochondrial and nuclear DNA sequences. Mol Phylogenet Evol.
50:560–570.
Perez-Portela R, Turon X. 2008. Cryptic divergence and strong population
structure in the colonial invertebrate Pycnoclavella communis
(Ascidiacea) inferred from molecular data. Zoology (Jena) 111:
163–178.
Pesole G, Liuni S, D’Souza M. 2000. PatSearch: a pattern matcher software
that finds functional elements in nucleotide and protein sequences
and assesses their statistical significance. Bioinformatics 16:439–450.
Putnam NH, et al. 2008. The amphioxus genome and the evolution of the
chordate karyotype. Nature 453:1064–1071.
Rubinstein ND, et al. 2013. Deep sequencing of mixed total DNA without
barcodes allows efficient assembly of highly plastic ascidian mitochon-
drial genomes. Genome Biol Evol. 5:1185–1199.
Saito Y, Okuyama M. 2003. Studies on Japanese botryllid ascidians. IV. A
new species of the genus Botryllus with a unique colony shape, from
the vicinity of Shimoda. Zool Sci. 20:1153–1161.
Singh TR, et al. 2009. Tunicate mitogenomics and phylogenetics: peculiar-
ities of the Herdmania momus mitochondrial genome and support for
the new chordate phylogeny. BMC Genomics 10:534.
Small KS, Brudno M, Hill MM, Sidow A. 2007. A haplome alignment and
reference sequence of the highly polymorphic Ciona savignyi genome.
Genome Biol. 8:R41.
Stach T, Braband A, Podsiadlowski L. 2010. Erosion of phylogenetic signal
in tunicate mitochondrial genomes on different levels of analysis. Mol
Phylogenet Evol. 55:860–870.
Stach T, Turbeville JM. 2002. Phylogeny of Tunicata inferred from molec-
ular and morphological characters. Mol Phylogenet Evol. 25:408–428.
Suzuki MM, Nishikawa T, Bird A. 2005. Genomic approaches reveal un-
expected genetic divergence within Ciona intestinalis. J Mol Evol. 61:
627–635.
Swalla BJ, Cameron CB, Corley LS, Garey JR. 2000. Urochordates are
monophyletic within the deuterostomes. Syst Biol. 49:52–64.
Swalla BJ, Smith AB. 2008. Deciphering deuterostome phylogeny: molec-
ular, morphological and palaeontological perspectives. Philos Trans R
Soc Lond B Biol Sci. 363:1557–1568.
Swofford DL. 2003. PAUP*: Phylogenetic Analysis Using Parsimony (*and
Other Methods). Sunderland (MA): Sinauer Associates.
Tarjuelo I, Posada D, Crandall K, Pascual M, Turon X. 2001. Cryptic species
of Clavelina (Ascidiacea) in two different habitats: harbours and rocky
littoral zones in the northwestern Mediterranean. Mar Biol. 139:
455–462.
Tarjuelo I, Posada D, Crandall KA, Pascual M, Turon X. 2004.
Phylogeography and speciation of colour morphs in the colonial as-
cidian Pseudodistoma crucigaster. Mol Ecol. 13:3125–3136.
Tolkin T, Christiaen L. 2012. Development and evolution of the ascidian
cardiogenic mesoderm. Curr Top Dev Biol. 100:107–142.
Tsagkogeorga G, Turon X, Galtier N, Douzery EJ, Delsuc F. 2010.
Accelerated evolutionary rate of housekeeping genes in tunicates.
J Mol Evol. 71:153–167.
Tsagkogeorga G, et al. 2009. An updated 18S rRNA phylogeny of tuni-
cates based on mixture and secondary structure models. BMC Evol
Biol. 9:187.
Turon X, Lopez-Legentil S. 2004. Ascidian molecular phylogeny inferred
from mtDNA data with emphasis on the Aplousobranchiata. Mol
Phylogenet Evol. 33:309–320.
Vences M, Thomas M, Bonett RM, Vieites DR. 2005. Deciphering amphib-
ian diversity through DNA barcoding: chances and challenges. Philos
Trans R Soc Lond B Biol Sci. 360:1859–1868.
Voskoboynik A, et al. 2013. The genome sequence of the colonial chor-
date, Botryllus schlosseri. Elife 2:e00569.
Wada H. 1998. Evolutionary history of free-swimming and sessile lifestyles
in urochordates as deduced from 18S rDNA molecular phylogeny. Mol
Biol Evol. 15:1189–1194.
Wolstenholme DR. 1992. Animal mitochondrial DNA: structure and evo-
lution. Int Rev Cytol. 141:173–216.
Yang Z. 1997. PAML: a program package for phylogenetic analysis by
maximum likelihood. Comput Appl Biosci. 13:555–556.
Yokobori S, Kurabayashi A, Neilan BA, Maruyama T, Hirose E. 2006.
Multiple origins of the ascidian-Prochloron symbiosis: molecu-
lar phylogeny of photosymbiotic and non-symbiotic colonial
ascidians inferred from 18S rDNA sequences. Mol Phylogenet Evol.
40:8–19.
Yokobori S, Oshima T, Wada H. 2005. Complete nucleotide
sequence of the mitochondrial genome of Doliolum nationalis with
implications for evolution of urochordates. Mol Phylogenet Evol. 34:
273–283.
Zeng L, Jacobs MW, Swalla BJ. 2006. Coloniality has evolved once in
Stolidobranch Ascidians. Integr Comp Biol. 46:255–268.
Zeng L, Swalla BJ. 2005. Molecular phylogeny of protochordates: chordate
evolution. Can J Zool. 83:24–33.
Zhan A, Macisaac HJ, Cristescu ME. 2010. Invasion genetics of the Ciona
intestinalis species complex: from regional endemism to global homo-
geneity. Mol Ecol. 19:4678–4694.
Associate editor: B. Venkatesh
Ongoing Speciation and Ascidian Mitogenomics GBE
Genome Biol. Evol. 6(3):591–605. doi:10.1093/gbe/evu041 Advance Access publication February 25, 2014 605
at CSIC
on March 25, 2014
http://gbe.oxfordjournals.org/D
ownloaded from