bmc genomics biomed central - connecting …additional file 2a-d). results obtained from chip...
TRANSCRIPT
BioMed Central
ss
BMC Genomics
Open AcceResearch articleHistone modifications are specifically relocated during gene activation and nuclear differentiationKatharina Sarah Heyse, Susanne Erika Weber and Hans-Joachim Lipps*
Address: University Witten/Herdecke, Institute of Cell Biology, Stockumer Str 10, 58453 Witten, Germany
Email: Katharina Sarah Heyse - [email protected]; Susanne Erika Weber - [email protected]; Hans-Joachim Lipps* - [email protected]
* Corresponding author
AbstractBackground: Post-translational histone modifications (PTMs) and their specific distribution ongenes play a crucial role in the control of gene expression, but the regulation of their dynamics upongene activation and differentiation is still poorly understood. Here, we exploit the unique genomeorganization of ciliates to analyse PTM dynamics during gene activation in the differentiated cell andduring nuclear differentiation. In the macronucleus of these cells the DNA is organized intonanochromosomes which represent independent functional units. Therefore, ciliated protozoarepresent a simplistic model system to analyse the relevance of histone modifications and theirlocalization for gene expression and differentiation.
Results: We analysed the distribution of three PTMs on six individual nanochromosomes, two ofwhich are silenced in the vegetative cell and only activated during sexual reproduction. We showthat a specific relocation of these PTMs correlates with gene activation. Moreover, macronuclear-destined sequences in the differentiating macronucleus display a distribution of PTMs which differssignificantly from the PTM patterns of actively transcribed genes.
Conclusion: We show for the first time that a relocation of specific histone modifications takesplace during activation of genes. In addition, we demonstrate that genes in a differentiating nucleusare characterised by a specific distribution and composition of PTMs. This allows us to propose amechanistic model about the relevance of PTMs for gene activation, gene silencing and nucleardifferentiation. Results described here will be relevant for eukaryotic cells in general.
BackgroundPost-translational modifications (PTMs) of histones,which include methylation, acetylation, phosphorylationand others, play a major role in regulating gene transcrip-tion and other nuclear processes [1]. It is known that localchromatin structure and thereby transcriptional regula-tion is influenced by these PTMs. Moreover, post-transla-tional histone modifications have long-range effects onthe overall chromatin structure. While transcriptional
activation generally correlates with acetylation of lysines,the function of methylation is more complex, with evenmono-, di- or trimethylation at specific sites having differ-ent effects on the transcriptional status [2]. Furthermore,as PTMs are interdependent, the nucleosomal context ofmodifications plays a crucial role in regulating chromatinstructure [1]. It has been reported that specific modifica-tions tend to cluster at the 5'- or 3'-ends of genes whileothers are evenly spread over entire gene domains [3-5].
Published: 24 November 2009
BMC Genomics 2009, 10:554 doi:10.1186/1471-2164-10-554
Received: 20 July 2009Accepted: 24 November 2009
This article is available from: http://www.biomedcentral.com/1471-2164/10/554
© 2009 Heyse et al; licensee BioMed Central Ltd. This is an Open Access article distributed under the terms of the Creative Commons Attribution License (http://creativecommons.org/licenses/by/2.0), which permits unrestricted use, distribution, and reproduction in any medium, provided the original work is properly cited.
Page 1 of 11(page number not for citation purposes)

BMC Genomics 2009, 10:554 http://www.biomedcentral.com/1471-2164/10/554
The importance of histone PTMs is undoubtedly complex,and while many functional correlations are well-estab-lished further studies are required to establish in detailhow patterns of PTMs differ between actively transcribedand transcriptionally repressed genes and how these pat-terns change upon activation of a gene or during differen-tiation [6-8].
The unique genome organization of stichotrichous cili-ates, such as Stylonychia, provides an attractive biologicalmodel system to study changes in PTM patterns duringgene activation on individual genes and during a nucleardifferentiation process. The macronuclear genome ofthese cells is fragmented into individual short DNA mole-cules (nanochromosomes). They are derived after sexualreproduction (conjugation) from a micronuclear deriva-tive in a well characterised differentiation process, whichincludes extensive DNA-reorganization, DNA-elimina-tion and DNA-fragmentation events [9]. Nanochromo-somes are individual functional units, which operateindependently of the complex effects of chromosomalcontext that normally contribute to expression of eukary-otic genomes. Although the rate of transcription is veryhigh in the macronucleus not all nanochromosomes areactively expressed during vegetative growth. Some areonly expressed in the course of conjugation [10]. Hence, adetailed analysis of the PTM distribution on nanochro-mosomes should provide a simplified system to monitorchromatin structure during changes in gene expression.
We have shown before that after sexual reproduction thedeveloping macronucleus (macronuclear anlage) adopts apermissive chromatin structure, characterised by the pres-ence of histone modifications typical for active chroma-tin. In later stages of differentiation repressive histonemodifications are introduced de novo and specify DNAsequences to be eliminated while permissive histonemodifications stay associated with sequences that will beretained in the macronucleus [11]. This well definednuclear differentiation allows the analysis of PTM patternon genes during a differentiation process.
Here we show that H3K14ac, H3K4me3 and H3K4me1each exhibit a characteristic distribution on nanochromo-somes in the differentiated macronucleus. These patternsdiffer between nanochromosomes expressed during vege-tative growth and those expressed only during sexualreproduction. Moreover, characteristic relocation of thesePTMs occurs during gene activation. Finally, we demon-strate that in the developing anlage macronuclear-des-tined sequences (MDS) show specific distributions ofPTMs, which differ remarkably from those of actively tran-scribed genes within the fully differentiated macronu-cleus. These observations allow us to propose a
mechanistic model how PTM patterns correlate with geneactivation, gene silencing and nuclear differentiation.
ResultsIn the current work we studied the relevance of post-trans-lational histone modifications for gene activation, ana-lysed their dynamics on nanochromosomes specificallyactivated during sexual reproduction and their fate duringa nuclear differentiation process. In our analysis of thegene-wide distribution of histone modifications weselected six macronuclear nanochromosomes of whichfour, the actin I gene, the DNA polymerase alpha gene, thehistone H4 gene and a 1.1 kb gene of unknown functionare transcribed during vegetative growth and two, mdp1and mdp2, are silenced in the vegetative macronucleusand become expressed exclusively during conjugation[10].
These nanochromosomes show significant differences inthe length of sequences flanking the open reading frame(Figure 1A, B). While the actin I nanochromosome [Gen-Bank accession number DQ108617] and the nanochro-mosome encoding the DNA polymerase alpha gene[GenBank accession number AF194338] have short flank-ing sequences, the nanochromosome encoding a histoneH4 gene [GenBank accession number X16018] was cho-sen because of its unusually long 5'-flanking region. Nei-ther the protein encoded on the 1.1 kb nanochromosome[pCE7, GenBank accession number X72958] nor its pre-cise open reading frame are characterised, therefore thelengths of the flanking sequences are unknown. For anal-ysis of conjugation-specific gene activation the genesencoding mdp1 and mdp2 were chosen. Mdp1 [GenBankaccession number AY261996] encodes a PIWI-homo-logue [10], a protein which is a member of the RNAi-path-way in many organisms and is known to play a crucial rolein the course of conjugation in ciliates. The proteinexpressed by mdp2 [GenBank accession numberAY261997] is not known. The PTM pattern on the mdp1and mdp2 nanochromosomes was studied both in theirsilenced form in vegetative cells and after activation dur-ing conjugation. For further details on sequences seeAdditional file 1. Finally, we studied histone modifica-tions on genes in the differentiating macronucleus afterconjugation. We analysed the PTM patterns on the actin I[GenBank accession number DQ108616], mdp2 [Gen-Bank accession number GU111958] and the 1.1 kb gene[GenBank accession number X72958, pCE7] sequences inthe macronuclear anlage (Figure 1C) in the early polytenechromosome stage (30 hours post conjugation).
Histone modifications shown to be present in macronu-clei and associated with macronuclear-specific DNAsequences in the developing macronucleus are H3K14ac,
Page 2 of 11(page number not for citation purposes)

BMC Genomics 2009, 10:554 http://www.biomedcentral.com/1471-2164/10/554
H3K4me3 und H3K4me1 [11] and therefore used in thisstudy. Histone acetylations are very dynamic and gener-ally correlate with an open chromatin state and activetranscription [1]. High-resolution analysis revealed thatH3K14ac accumulates predominantly at promoterregions and transcriptional start sites (TSSs) [4,5,12], inmany cases co-localizing with H3K4me3 [4]. Likewise, tri-methylated H3K4 is associated with actively transcribedgenes and decorates their promoters as well as the 5'-ends
of coding regions [13,14]. Although H3K14ac andH3K4me3 are known to be generally associated withactively transcribed genes, these modifications have alsobeen found to decorate repressed genes in humans[15,16].
To date, little is known about the role of H3K4me1 in theregulation of gene expression. H3K4me1 is found to accu-mulate towards the 3'-end of genes and is commonlylinked to active transcription [15,17].
The PTM patterns of actively transcribed genesTo identify patterns of PTMs on nanochromosomesencoding actively transcribed genes, chromatin wasdigested with micrococcus nuclease to yield mononucleo-somes. Chromatin immunoprecipitation (ChIP) experi-ments and subsequent quantitative real-time PCR (qRT-PCR) analyses revealed that on nanochromosomes withshort flanking sequences, e.g. actin I and polymerase?alpha, H3K14ac accumulated at the 5'-ends of genes anddecreased towards the 3'-end (Figure 2). On the actin Inanochromosome the level of acetylated H3K14increased steadily in the first half of the nanochromosomebefore declining in the second half, reaching the mini-mum at the 3'-end (Figure 2A). Interestingly, the amountof H3K14ac in the 5'-flanking region was lower than at thestart of the coding sequence. The relative amount ofH3K14ac in the polymerase alpha nanochromosome wasvery high at the 5'-end, corresponding to the start of thecoding region and decreased significantly within the fol-lowing 2 kb (Figure 2D). The distribution of H3K14ac onthe 1.1 kb nanochromosome (Figure 2G) was very similarto that seen on the actin I (Figure 2A) and polymerasealpha nanochromosome (Figure 2D). In contrast to thedata described above results obtained from the histoneH4 nanochromosome differed remarkably. Whereas onlyone peak was detectable for nanochromosomes withshort flanking sequences, we found two peaks of H3K14acwithin the histone H4 nanochromosome. A first accumu-lation of H4K14ac was observed in the 5'-flanking region,followed by a second peak within the coding region (Fig-ure 2J). We repeated these chromatin immunoprecipita-tion experiments using a combined antibody directedagainst H3K9/14ac. The results obtained were entirelyconsistent with those for the H3K14ac antibody (seeAdditional file 2A-D). Results obtained from ChIP analy-ses for trimethylated H3K4 were very similar to thoseobtained for H3K14ac. Again the examined nanochromo-somes with short flanking untranslated regions, actin I(Figure 2B) and polymerase alpha (Figure 2E) showed anaccumulation of H3K4me3 at the 5'-ends close to the startof the coding region and a significantly lower amount atthe 3'-ends. A similar pattern was observed for the 1.1 kbnanochromosome (Figure 2H). In contrast, as forH3K14ac, two peaks of H3K4me3 were detected on the
Schematic illustration of macronuclear nanochromosomes and their micronuclear sequencesFigure 1Schematic illustration of macronuclear nanochromo-somes and their micronuclear sequences. (A) Macro-nuclear nanochromosomes, transcribed during vegetative growth. (B) Macronuclear nanochromosomes, silenced dur-ing vegetative growth. (A,B) Total length of nanochromo-some is indicated in brackets. DNA sequences are shown in green, telomeres are red. Black bars below nanochromo-somes indicate the coding region of each gene, partly inter-rupted by introns and flanked by non-coding sequences. Blue bars above nanochromosomes show the positions of qRT-PCR fragments. Numbers show the order of PCR fragments, for primer sequences see Additional file 5. (C) Micronuclear sequences of the actin I, mdp2 and the 1.1 kb gene. Macronu-clear-destined sequences (MDS) in green are interrupted by micronucleus-specific internal eliminated sequences (IES) in yellow and partly flanked by further micronucleus-specific sequences (orange). MDSs of the actin I gene are found in a scrambled disorder in micronuclei and anlagen (3-4-5-6-7-8-10-(-2)-(-1)-9) and are reorganized into the correct order (1-2-3-4-5-6-7-8-9-10) upon differentiation [19]. Total length of sequence is indicated in brackets. Blue bars above DNA sequence indicate positions of qRT-PCR fragments. Letters show order of PCR fragments, for corresponding primer sequences see Additional file 6.
Page 3 of 11(page number not for citation purposes)

BMC Genomics 2009, 10:554 http://www.biomedcentral.com/1471-2164/10/554
histone H4 nanochromosome, one in the 5'-flankingsequence and the other in the coding region (Figure 2K).Data obtained from ChIP and qRT-PCR analyses ofH3K4me1 were less consistent compared to the datadescribed for H3K14ac and H3K4me3. In the actin I nan-ochromosome the distribution of H3K4me1 seemed tomirror image the H3K4me3 distribution (Figure 2C). The
level of H3K4me1 was low at the 5'-end and continuouslyincreased towards the 3'-end reaching its highest concen-tration near the end of the coding region. The 1.1 kb geneexhibited a very similar distribution (Figure 2I). In con-trast, the distribution of H3K4me1 on the polymerasealpha nanochromosome showed low amounts at both 5'-end and 3'-end of the coding region while the maximum
H3K14ac, H3K4me3 and H3K4me1 distribution on actively transcribed macronuclear nanochromosomesFigure 2H3K14ac, H3K4me3 and H3K4me1 distribution on actively transcribed macronuclear nanochromosomes. Nanochromosomes encoding actin I (A-C), DNA polymerase alpha (D-F), 1.1 kb gene (G-I) and histone H4 (J-L) were exam-ined. X-axis shows total length of gene, Y-axis shows percent of input. Data shown are derived from three individual ChIP experiments, error bars represent SE.
Page 4 of 11(page number not for citation purposes)
BMC Genomics 2009, 10:554 http://www.biomedcentral.com/1471-2164/10/554
level of H3K4me1 was found to reside in the middle of thegene (Figure 2F). H3K4me1 distribution in the histoneH4 nanochromosome was different again in that its levelwas low at the 5'-end of the nanochromosome but peakedin the 5'-flanking sequence close to the coding region.Within the coding region this modification was almostevenly distributed (Figure 2L).
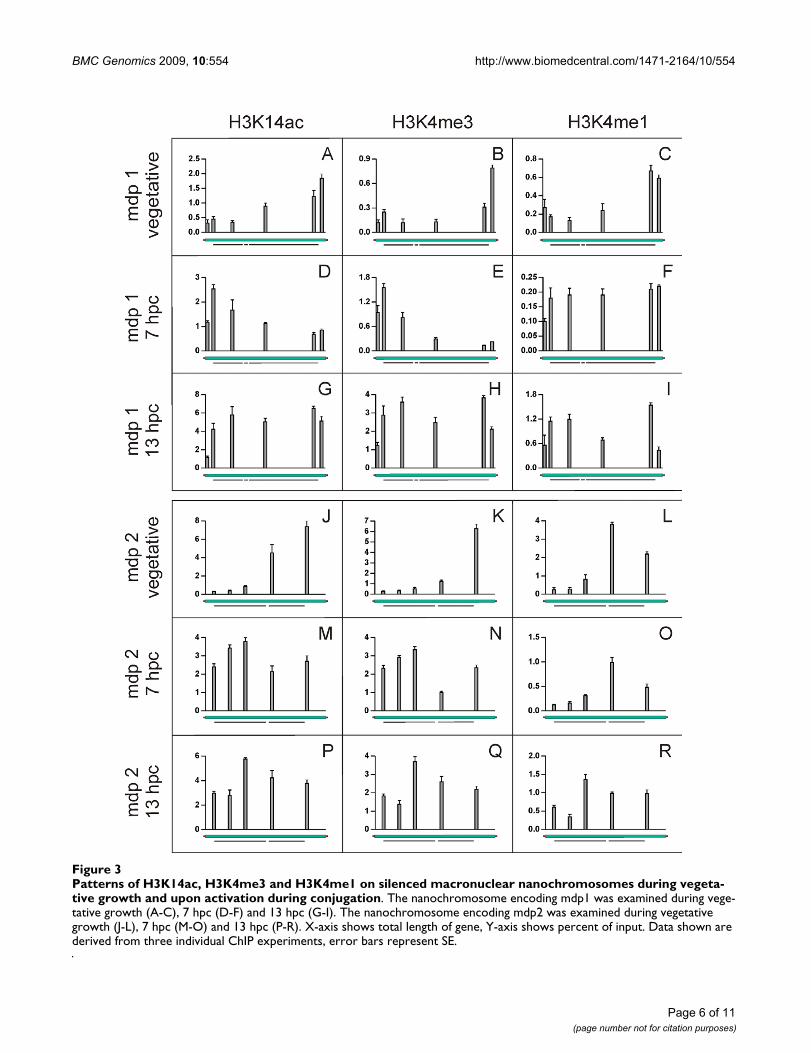
H3K14ac and H3K4me3 do not associate with 5'-ends of silenced genesTo identify the PTM pattern on transcriptionally silentgenes, ChIP and qRT-PCR experiments were performedusing the same antibodies as described above. As shownin Figure 3A-C and Figure 3J-L the distribution of histonemodifications differed significantly from those on activelytranscribed genes (Figure 2). We found inactive genes toalso associate with PTMs typical for open and permissivechromatin, although to a significantly lower amount, anobservation also described in other organisms. However,not only the quantity differed but, more surprisingly, thePTM distribution also showed remarkable qualitative dif-ferences. While in active genes H3K14ac accumulated atthe 5'-end of the nanochromosome, the relative amountof this modification was considerably higher at the 3'-endthan at the 5'-end of the mdp1 (Figure 3A) and the mdp2(Figure 3J) nanochromosomes. The amount of H3K14acsteadily increased over the nanochromosome to reach itsmaximum in the 3'-flanking region. Essentially the samewas true for the distribution of H3K4me3 (Figure 3B, 3K).In contrast, the distribution of H3K4me1 in untranscribednanochromosomes partly resembled that observed onactively transcribed genes. The level of monomethylatedH3K4 was low at the 5'-end and increased towards the 3'-end. In both nanochromosomes the highest amount ofH3K4me1 was found towards the 3'-end of the codingregion (Figure 3C, 3L).
H3K14ac and H3K4me3 are relocated upon gene activationSince we observed significant differences in the PTM pat-terns in genes either actively transcribed or repressed dur-ing vegetative growth it seemed of considerable interest toanalyse the PTM patterns upon gene activation. Mdp1 andmdp2 are not expressed during vegetative growth butmRNAs of both genes can be detected 6-8 hours after theinitiation of conjugation [10]. We therefore isolatedmacronuclear chromatin from conjugating cells at 7 hpc(hours post conjugation) and performed ChIP and qRT-PCR analyses. The distribution of PTMs observed on thesegenes after activation of gene expression differed signifi-cantly from those in a silenced state. Upon activation, thepattern of H3K14ac and H3K4me3 was inverted com-pared to their silent status. On mdp1 the highest levels ofacetylated H3K14 were found at the 5'-end at the begin-ning of the coding region and its concentration decreased
towards the 3'-end (Figure 3D), reminiscent of the patternon transcribed genes during vegetative growth. A similarobservation was made for mdp2 (Figure 3M). These ChIPexperiments were repeated using a combined antibodydirected against H3K9/14ac. The results obtained wereentirely consistent with those for the H3K14ac antibody(see Additional file 3A-F). The distribution of H3K4me3(Figure 3E, 3N) was similar to that of H3K14ac. ChIP dataobtained for H3K4me1 were not as consistent as the othermodifications. While on mdp2 no change in H3K4me1distribution was detected (Figure 3O) a significant redis-tribution on mdp1 was observed (Figure 3F). In therepressed mdp1 gene H3K4me1 was predominantlyfound at the 3'-end but spread after activation almost overthe entire nanochromosome. As a control, we analysedgenes expressed during both, vegetative growth and con-jugation. None of the PTM patterns on the actin I (seeAdditional file 4A-C) or the polymerase alpha nanochro-mosome (see Additional file 4D-F) changed during conju-gation, indicating that relocation of PTMs is induced onlyupon gene activation. It has been reported that in thecourse of conjugation overall gene expression increases at6-8 hpc [18] before it declines and reaches a low level.Therefore, we also analysed PTM patterns on the mdp1and mdp2 nanochromosomes at a later time point afterconjugation (13 hpc) when the overall transcription ratehad already decreased. At this point PTM patterns werenot as clearly structured as described for 7 hpc. H3K14ac,H3K4me3 and H3K4me1 were more or less evenly distrib-uted over the entire nanochromosomes of both mdp1 andmdp2 (Figure 3G-I, 3P-R), suggesting that we observe atransitional stage in which transcription rate alreadybecomes reduced.
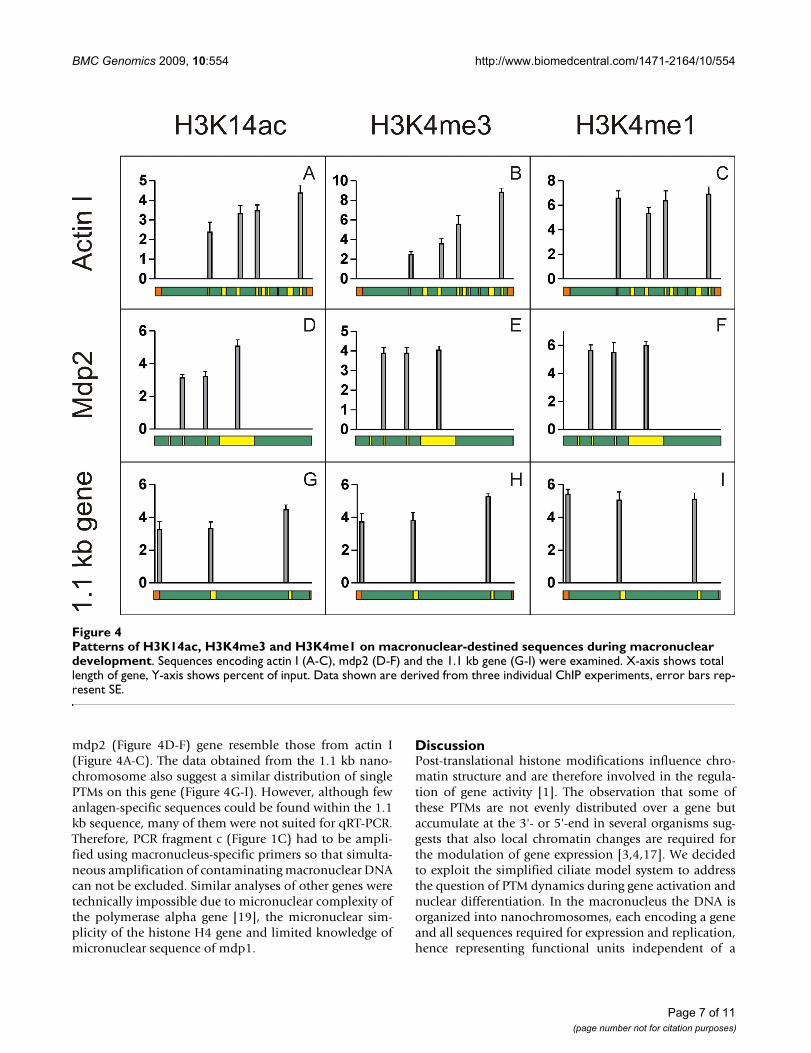
During nuclear development genes exhibit PTM patterns different from those of actively transcribed genesChromatin was isolated from macronuclear anlagen (30hpc) and the distribution of 3 PTMs on macronuclear-spe-cific sequences was analysed by ChIP and qRT-PCR. Toavoid amplification of macronuclear contaminations inChIP with antibodies directed against H3K14ac,H3K4me3 and H3K4me1 anlagen-specific primers wereused for qRT-PCR analyses (Figure 1C). At this stage ofanlagen differentiation the patterns of H3K14ac andH3K4me3 unambiguously differed from those in activelytranscribed genes during vegetative growth. In the actin Igene the level of H3K14ac was low near the 5'-end andsteadily increased towards the 3'-end of the gene (Figure4A). The same was true for H3K4me3 (Figure 4B).H3K4me1 in contrast was evenly distributed over the gene(Figure 4C). Unfortunately, due to the lack of suitableprimer combinations, the very 5'-end of the actin Isequence could not be analysed. With the exception ofH3K4me3 which is evenly distributed over the sequence,results from the analyses of PTM distributions on the
Page 5 of 11(page number not for citation purposes)
BMC Genomics 2009, 10:554 http://www.biomedcentral.com/1471-2164/10/554
Page 6 of 11(page number not for citation purposes)
Patterns of H3K14ac, H3K4me3 and H3K4me1 on silenced macronuclear nanochromosomes during vegetative growth and upon activation during conjugationFigure 3Patterns of H3K14ac, H3K4me3 and H3K4me1 on silenced macronuclear nanochromosomes during vegeta-tive growth and upon activation during conjugation. The nanochromosome encoding mdp1 was examined during vege-tative growth (A-C), 7 hpc (D-F) and 13 hpc (G-I). The nanochromosome encoding mdp2 was examined during vegetative growth (J-L), 7 hpc (M-O) and 13 hpc (P-R). X-axis shows total length of gene, Y-axis shows percent of input. Data shown are derived from three individual ChIP experiments, error bars represent SE.
BMC Genomics 2009, 10:554 http://www.biomedcentral.com/1471-2164/10/554
mdp2 (Figure 4D-F) gene resemble those from actin I(Figure 4A-C). The data obtained from the 1.1 kb nano-chromosome also suggest a similar distribution of singlePTMs on this gene (Figure 4G-I). However, although fewanlagen-specific sequences could be found within the 1.1kb sequence, many of them were not suited for qRT-PCR.Therefore, PCR fragment c (Figure 1C) had to be ampli-fied using macronucleus-specific primers so that simulta-neous amplification of contaminating macronuclear DNAcan not be excluded. Similar analyses of other genes weretechnically impossible due to micronuclear complexity ofthe polymerase alpha gene [19], the micronuclear sim-plicity of the histone H4 gene and limited knowledge ofmicronuclear sequence of mdp1.
DiscussionPost-translational histone modifications influence chro-matin structure and are therefore involved in the regula-tion of gene activity [1]. The observation that some ofthese PTMs are not evenly distributed over a gene butaccumulate at the 3'- or 5'-end in several organisms sug-gests that also local chromatin changes are required forthe modulation of gene expression [3,4,17]. We decidedto exploit the simplified ciliate model system to addressthe question of PTM dynamics during gene activation andnuclear differentiation. In the macronucleus the DNA isorganized into nanochromosomes, each encoding a geneand all sequences required for expression and replication,hence representing functional units independent of a
Patterns of H3K14ac, H3K4me3 and H3K4me1 on macronuclear-destined sequences during macronuclear developmentFigure 4Patterns of H3K14ac, H3K4me3 and H3K4me1 on macronuclear-destined sequences during macronuclear development. Sequences encoding actin I (A-C), mdp2 (D-F) and the 1.1 kb gene (G-I) were examined. X-axis shows total length of gene, Y-axis shows percent of input. Data shown are derived from three individual ChIP experiments, error bars rep-resent SE.
Page 7 of 11(page number not for citation purposes)

BMC Genomics 2009, 10:554 http://www.biomedcentral.com/1471-2164/10/554
large genomic context. Since some genes are activatedonly in the course of sexual reproduction, changes in PTMpattern can easily be analysed after their activation. Inaddition, the morphological events during macronucleusdifferentiation are well defined and specific stages of thisdifferentiating nucleus can be isolated in large quantitiesallowing the characterisation of PTM pattern on definedgenes during differentiation. The histone modificationsgenerally associated with active chromatin considered inthis report were chosen because it has been shown beforethat they are present both in the vegetative and developingmacronucleus [11].
We initially analysed the PTM pattern on actively tran-scribed nanochromosomes and found a distribution sim-ilar to that described in other organisms [4,5,15,17].H3K14ac and H3K4me3 predominantly accumulatednear the transcriptional start site at 5'-end of genes (Figure2). As we were able to detect these PTMs within the imme-diate neighborhood of the promoter region we canexclude the eviction of nucleosomes from these sites as ithas been described in yeast [5]. The maximum amount ofH3K4me1 was found to reside near the middle or the 3'-end of the coding region (Figure 2). Only the nanochro-mosome encoding the histone H4 gene with its extraordi-nary long 5'-flanking region showed a different pattern.H3K14ac and H3K4me3 accumulated both in the 5'-flanking regions and in the open reading frame (Figure 2).The reason for this distribution is not clear. Since we couldnot find an ORF in the 5'-region it may well be that a reg-ulatory element relevant for expression is containedwithin this sequence. It has been described before that e.g.enhancers carry specific PTM patterns [15,20].
The PTM patterns on the silenced genes mdp1 and mdp2differed remarkably from those of actively transcribedgenes. As described in other organisms PTMs characteris-tic for open chromatin decorate these inactive genes onlyin a low amount. Surprisingly however, H3K14ac andH3K4me3 were found to predominantly accumulate notat the 5'-end but at the 3'-end of the nanochromosomeswhile the distribution of H3K4me1 remained unchanged(Figure 3). It has been described that in bivalent domainsthe permissive marker H3K4me3 accumulates togetherwith the repressive marker H3K27me3 [6,7]. By thismechanism inactive genes in embryonic stem cells [21]and CD4+ T cells [8,22] are kept poised for activationwhen needed upon differentiation. Importantly, here wedemonstrate that not only the sole existence but the distri-bution of PTMs on a gene correlates with its transcrip-tional activity.
While in other organisms no qualitative but only quanti-tative differences in PTMs were observed when comparinggenes of different transcriptional status [5,15-17] we
observe a significant relocation of PTMs typical for per-missive chromatin on the nanochromosomes encodingmdp1 and mdp2 upon activation (Figure 3). Histones atthe 5'-end become acetylated and methylated de novowhile these modifications are most likely removed fromhistones at the 3'-end of genes. The patterns of H3K14acand H3K4me3 resemble those of genes actively tran-scribed during vegetative growth. This implies that amechanism must exist that directs the remodelling ofPTMs during gene activation.
It has been described in Stylonychia that immediately fol-lowing the fusion of the gametic nuclei a global de novoacetylation of histones takes place [11] which is reminis-cent of the early embryonic cell nuclei in metazoa [23].Only later repressive histone modifications become intro-duced. It has been described that in Stylonychia macronu-clear-specific DNA sequences to be retained in thevegetative macronucleus stay associated with permissivehistone modifications while all sequences to be elimi-nated during further differentiation are marked by repres-sive histone modifications, a mechanism reminiscent tothe silencing of genes during metazoan development [23].Our analyses now reveal that the distribution of activePTMs in the differentiating macronucleus does not resem-ble that of actively transcribed genes during vegetativegrowth, which suggests a silenced transcriptional statusduring nuclear development (Figure 4). This result is con-sistent with the view that, although these sequences haveto be associated with permissive histone modifications inorder to become processed into vegetative genes, they arenot expressed during macronuclear differentiation buthave to be activated upon termination of the differentia-tion process.
Taking all our observations together, we can propose amechanistic model how PTM patterns correlate withgenetic activity and the relevance of this pattern for genesduring a differentiation process. In expressed genes a typ-ical distribution of PTMs over the gene is observed asalready described in other eukaryotes [3-5,15,17].Silenced genes do also associate with PTMs characteristicfor open chromatin, but only to a low amount. In contrastto actively transcribed genes, the PTM pattern on silencedgenes is almost a mirror image of that of active genes.While in expressed genes H3K14ac and H3K4me3 alwaysaccumulate at the start site of transcription, these modifi-cations are found preferentially in the 3'-region ofsilenced genes. In the course of gene activation, a quanti-tative and qualitative change in PTM patterns is observedand PTMs are relocated on the activated gene. In a processmost probably involving deacetylases and demethylasesas well as acetyltransferases and methyltransferases dis-tinct PTMs are removed from the 3'-end while histonesnear the TSS gain such modifications. During early differ-
Page 8 of 11(page number not for citation purposes)

BMC Genomics 2009, 10:554 http://www.biomedcentral.com/1471-2164/10/554
entiation genes are marked by permissive histone modifi-cations. The differing distribution of permissive markersserves to prevent DNA sequences from being transcribedas well as to prevent them from being eliminated duringdifferentiation. It will be of major interest to perform sim-ilar analyses in metazoan organisms and the experimentsdescribed may serve as guidelines for such investigations.
ConclusionSo far, only a quantitative change of specific PTMs hasbeen observed during gene activation in eukaryotic cellsbut the mechanism directing these is only beginning to beunderstood. We demonstrate in the simplified model sys-tem ciliate that gene activation correlates not only with aquantitative but also a qualitative change in specificPTMs. This process has to be regulated by concerteddemethylation and deacetylation followed by de novomethylation and acetylation. Furthermore, we show therelevance of PTMs in a differentiating nucleus. Resultsdescribed in this paper may serve as guidelines to performsimilar analyses in higher eukaryotes.
MethodsGrowth of Stylonychia lemnaeGrowth of Stylonychia lemnae was performed as describedelsewhere [18]. For mating, cells of two different matingtypes were mixed and allowed to conjugate [18].
Native chromatin preparation from vegetative macronuclei, macronuclei from conjugating cells and macronuclear anlagenTo all buffers 1 mM PMSF or protease inhibitor cocktail(Roche Diagnostics) was added to avoid protein degrada-tion as well as 5 mM sodium butyrate to avoid histonedeacetylation. Nuclei were isolated as described elsewhere[18], washed once with cold PBS and resuspended in 1 mlmicrococcus nuclease (MNase) digestion buffer (50 mMNaCl, 20 mM Tris-HCl (pH 7.5), 3 mM MgCl2, 1 mMCaCl2). Nuclei were digested with 0.25 units MNase perμg DNA for 10 min at 37°C. Reaction was stopped with0.5 mM EDTA. Nuclei were placed on ice for 1 h andhomogenized to release mononucleosomes. The nuclearsuspension was centrifuged for 5 min at 2500 × g and thesupernatant was transferred to a new reaction tube. Thepelleted nuclei were resuspended in 600 μl MNase washbuffer (10 mM Tris-HCl (pH 7.5), 250 μM EDTA) andkept on ice for 1 h with repeated homogenization. The laststep was repeated once. Finally, the combined superna-tants were concentrated in VivaSpin4 concentrators (Sar-torius). For the isolation of macronuclear chromatin fromcells after conjugation, Stylonychia clones of different mat-ing types were mixed and macronuclei were isolated 7 and13 hours, respectively, after the start of conjugation. Chro-matin from macronuclear anlagen was isolated 30 hoursafter the start of conjugation. All chromatin preparations
used for ChIP analyses were analysed by agarose gel elec-trophoresis.
Chromatin immunoprecipitation (ChIP)Protease inhibitor cocktail was added to all buffers andwhen appropriate 5 mM sodium butyrate was added toavoid histone deacetylation. The lysate containing mono-nucleosomes was cleared by centrifugation (14,000 × g, 5min, 4°C). For each ChIP 0.5 OD260 chromatin corre-sponding to 25 μg DNA were diluted in 500 μl ChIP incu-bation buffer (50 mM NaCl, 20 mM Tris-HCl (pH 7.5), 5mM EDTA), and pre-cleared with Sepharose A beads for 2h at 4°C. Beads were pelleted by centrifugation (150 × g,5 min, 4°C), and the supernatant was transferred to a newreaction tube. At this step one aliquot of pre-cleared chro-matin was kept as 'input DNA' for future qRT-PCR analy-sis. Sepharose A beads were blocked with BSA and shearedsalmon sperm DNA for 2 h at 4°C in buffer A (50 mMNaCl, 50 mM Tris-HCl (pH 7.5), 10 mM EDTA), centri-fuged (150 × g, 5 min, 4°C) and resuspended in buffer A.Immunoprecipitation was performed overnight using 3μg of specific antibody and blocked Sepharose A beads at4°C at gentle rotation. Antibodies used were anti-H3K14ac (Upstate, up07-353), anti-H3K9/14ac (SantaCruz, sc-8655-R), anti-H3K4me3 (Abcam, ab8580) andanti-H3K4me1 (Abcam, ab8895). Immunocomplexeswere washed under gentle rotation at 4°C for 10 min asfollows: once with buffer A, twice with buffer B (100 mMNaCl, 50 mM Tris-HCl (pH 7.5), 10 mM EDTA) and twicewith buffer C (150 mM NaCl, 50 mM Tris-HCl (pH 7.5),10 mM EDTA). To elute the precipitated chromatin,immunocomplexes were incubated with elution buffer(50 mM NaCl, 20 mM Tris-HCl (pH 7.5), 5 mM EDTA,1% SDS) for 30 min at 65°C on a shaker. Proteinase K wasadded to the eluate and incubated at 65°C for 2 h. DNAwas purified using phenol-chloroform extraction and eth-anol precipitation. ChIP experiments were repeated threetimes.
Quantitative real-time PCRQuantitative real-time PCR (qRT-PCR) analyses were per-formed as described before [11]. Primers used for qRT-PCR analyses are listed in Additional files 5 and 6, theirpositions are shown in Figure 1.
AbbreviationsPTM: Post-translational histone modification; mdp:Macronuclear development protein; hpc: Hours post con-jugation; H3K14ac: Histone H3 acetylated at lysine 14;H3K4me3: Histone H3 trimethylated at lysine 4;H3K4me1: Histone H3 monomethylated at lysine 4; qRT-PCR: Quantitative Real-Time PCR
Authors' contributionsKSH performed ChIP and qRT-PCR analyses of actin I, his-tone H4, mdp1 and mdp2 in the vegetative macronucleus,
Page 9 of 11(page number not for citation purposes)

BMC Genomics 2009, 10:554 http://www.biomedcentral.com/1471-2164/10/554
ChIP and qRT-PCR analyses in the macronucleus duringsexual reproduction, ChIP and qRT-PCR analyses in thedifferentiating macronucleus, participated in the designand coordination of the study and in drafting the manu-script. SEW performed the ChIP and qRT-PCR analyses ofpolymerase alpha and the 1.1 kb gene in the vegetativemacronucleus. HJL participated in the design and coordi-nation of the study and drafted the manuscript. Allauthors read and approved the final manuscript.
Additional material AcknowledgementsThis work was supported by the Deutsche Forschungsgemeinschaft [LI 231/19-4].
References1. Kouzarides T: Chromatin modifications and their function.
Cell 2007, 128(4):693-705.2. Martin C, Zhang Y: The diverse functions of histone lysine
methylation. Nat Rev Mol Cell Biol 2005, 6(11):838-849.3. Liang G, Lin JC, Wei V, Yoo C, Cheng JC, Nguyen CT, Weisenberger
DJ, Egger G, Takai D, Gonzales FA, Jones PA: Distinct localizationof histone H3 acetylation and H3-K4 methylation to thetranscription start sites in the human genome. Proc Natl AcadSci USA 2004, 101(19):7357-7362.
4. Bernstein BE, Kamal M, Lindblad-Toh K, Bekiranov S, Bailey DK, Hue-bert DJ, McMahon S, Karlsson EK, Kulbokas EJ, Gingeras TR, Sch-reiber SL, Lander ES: Genomic maps and comparative analysisof histone modifications in human and mouse. Cell 2005,120(2):169-181.
5. Pokholok DK, Harbison CT, Levine S, Cole M, Hannett NM, Lee TI,Bell GW, Walker K, Rolfe PA, Herbolsheimer E, Zeitlinger J, LewitterF, Gifford DK, Young RA: Genome-wide map of nucleosomeacetylation and methylation in yeast. Cell 2005,122(4):517-527.
6. Cui K, Zang C, Roh TY, Schones DE, Childs RW, Peng W, Zhao K:Chromatin signatures in multipotent human hematopoieticstem cells indicate the fate of bivalent genes during differen-tiation. Cell Stem Cell 2009, 4(1):80-93.
7. Bernstein BE, Mikkelsen TS, Xie X, Kamal M, Huebert DJ, Cuff J, FryB, Meissner A, Wernig M, Plath K, Jaenisch R, Wagschal A, Feil R, Sch-reiber SL, Lander ES: A bivalent chromatin structure marks keydevelopmental genes in embryonic stem cells. Cell 2006,125(2):315-326.
8. Wei G, Wei L, Zhu J, Zang C, Hu-Li J, Yao Z, Cui K, Kanno Y, RohTY, Watford WT, Schones DE, Peng W, Sun HW, Paul WE, O'SheaJJ, Zhao K: Global mapping of H3K4me3 and H3K27me3reveals specificity and plasticity in lineage fate determina-tion of differentiating CD4+ T cells. Immunity 2009,30(1):155-167.
9. Prescott DM: The DNA of ciliated protozoa. Microbiol Rev 1994,58(2):233-267.
10. Fetzer CP, Hogan DJ, Lipps HJ: A PIWI homolog is one of theproteins expressed exclusively during macronuclear devel-opment in the ciliate Stylonychia lemnae. Nucleic Acids Res2002, 30(20):4380-4386.
11. Postberg J, Heyse K, Cremer M, Cremer T, Lipps HJ: Spatial andtemporal plasticity of chromatin during programmed DNA-reorganization in Stylonychia macronuclear development.Epigenetics Chromatin 2008, 1(1):3.
12. Roh TY, Cuddapah S, Zhao K: Active chromatin domains aredefined by acetylation islands revealed by genome-widemapping. Genes Dev 2005, 19(5):542-552.
13. Santos-Rosa H, Schneider R, Bannister AJ, Sherriff J, Bernstein BE,Emre NC, Schreiber SL, Mellor J, Kouzarides T: Active genes aretri-methylated at K4 of histone H3. Nature 2002,419(6905):407-411.
14. Bernstein BE, Humphrey EL, Erlich RL, Schneider R, Bouman P, Liu JS,Kouzarides T, Schreiber SL: Methylation of histone H3 Lys 4 incoding regions of active genes. Proc Natl Acad Sci USA 2002,99(13):8695-8700.
Additional file 1Characterisation of genes analysed in this study. Indicated are total size, size of 5'- and 3'-flanking regions and number of introns.Click here for file[http://www.biomedcentral.com/content/supplementary/1471-2164-10-554-S1.XLS]
Additional file 2Pattern of H3K9/14ac on macronuclear nanochromosomes. Distribu-tion of H3K9/14ac is shown in actin I (A), DNA polymerase alpha (B), the 1.1 kb gene (C) and histone H4 (D). X-axis shows total length of gene, Y-axis shows percent of input. Data shown are derived from three individual ChIP experiments, error bars represent SE.Click here for file[http://www.biomedcentral.com/content/supplementary/1471-2164-10-554-S2.JPEG]
Additional file 3Pattern of H3K9/14ac on silenced macronuclear nanochromosomes during vegetative growth and upon activation during conjugation. The nanochromosome encoding mdp1 was examined during vegetative growth (A), 7 hpc (B) and 13 hpc (C). The nanochromosome encoding mdp2 was examined during vegetative growth (D), 7 hpc (E) and 13 hpc (F). X-axis shows total length of gene, Y-axis shows percent of input. Data shown are derived from three individual ChIP experiments, error bars rep-resent SE.Click here for file[http://www.biomedcentral.com/content/supplementary/1471-2164-10-554-S3.JPEG]
Additional file 4Distribution of H3K14ac, H3K4me3 and H3K4me1 on actively tran-scribed macronuclear nanochromosomes during conjugation. The nan-ochromosomes encoding actin I (A-C) and polymerase alpha (D-F) were examined 7 hpc. X-axis shows total length of gene, Y-axis shows percent of input. Data shown are derived from three individual ChIP experiments, error bars represent SE.Click here for file[http://www.biomedcentral.com/content/supplementary/1471-2164-10-554-S4.JPEG]
Additional file 5Table of primers used for qRT-PCR analyses of macronuclear nano-chromosomes. Primer names correlate with numbers of PCR fragments indicated in Figure 1A and 1B.Click here for file[http://www.biomedcentral.com/content/supplementary/1471-2164-10-554-S5.XLS]
Additional file 6Table of primers used for qRT-PCR analyses of MDSs in the differen-tiating macronucleus. Primer names correlate with letters of PCR frag-ments indicated in Figure 1C.Click here for file[http://www.biomedcentral.com/content/supplementary/1471-2164-10-554-S6.XLS]
Page 10 of 11(page number not for citation purposes)
BMC Genomics 2009, 10:554 http://www.biomedcentral.com/1471-2164/10/554
Publish with BioMed Central and every scientist can read your work free of charge
"BioMed Central will be the most significant development for disseminating the results of biomedical research in our lifetime."
Sir Paul Nurse, Cancer Research UK
Your research papers will be:
available free of charge to the entire biomedical community
peer reviewed and published immediately upon acceptance
cited in PubMed and archived on PubMed Central
yours — you keep the copyright
Submit your manuscript here:http://www.biomedcentral.com/info/publishing_adv.asp
BioMedcentral
15. Barski A, Cuddapah S, Cui K, Roh TY, Schones DE, Wang Z, Wei G,Chepelev I, Zhao K: High-resolution profiling of histone meth-ylations in the human genome. Cell 2007, 129(4):823-837.
16. Guenther MG, Levine SS, Boyer LA, Jaenisch R, Young RA: A chro-matin landmark and transcription initiation at most promot-ers in human cells. Cell 2007, 130(1):77-88.
17. Wang Z, Zang C, Rosenfeld JA, Schones DE, Barski A, Cuddapah S,Cui K, Roh TY, Peng W, Zhang MQ, Zhao K: Combinatorial pat-terns of histone acetylations and methylations in the humangenome. Nat Genet 2008, 40(7):897-903.
18. Ammermann D, Steinbruck G, von Berger L, Hennig W: The devel-opment of the macronucleus in the ciliated protozoan Styl-onychia mytilus. Chromosoma 1974, 45(4):401-429.
19. Jonsson F, Postberg J, Lipps HJ: The unusual way to make agenetically active nucleus. DNA Cell Biol 2009, 28(2):71-78.
20. Heintzman ND, Stuart RK, Hon G, Fu Y, Ching CW, Hawkins RD,Barrera LO, Van Calcar S, Qu C, Ching KA, Wand W, Weng Z,Green RD, Crawford GE, Ren B: Distinct and predictive chroma-tin signatures of transcriptional promoters and enhancers inthe human genome. Nat Genet 2007, 39(3):311-318.
21. Mikkelsen TS, Ku M, Jaffe DB, Issac B, Lieberman E, Giannoukos G,Alvarez P, Brockman W, Kim TK, Koche RP, Lee W, Mendenhall E,O'Donovan A, Presser A, Russ C, Xie X, Meissner A, Werning M, Jae-nisch R, Nusbaum C, Lander ES, Bernstein BE: Genome-wide mapsof chromatin state in pluripotent and lineage-committedcells. Nature 2007, 448(7153):553-560.
22. Roh TY, Cuddapah S, Cui K, Zhao K: The genomic landscape ofhistone modifications in human T cells. Proc Natl Acad Sci USA2006, 103(43):15782-15787.
23. Meshorer E, Misteli T: Chromatin in pluripotent embryonicstem cells and differentiation. Nat Rev Mol Cell Biol 2006,7(7):540-546.
Page 11 of 11(page number not for citation purposes)