bmo-tr-90-127 ad-a235 675 ad-a235 675 questtr-510 ... small bore probe assembly drawing 10 ......
TRANSCRIPT
AD-A235 675
BMO-TR-90-127 AD-A235 675QUESTTR-510
NoncontactSmall-Diameter-Bore Gauge
M. A. LindR. F. Johnson
QUEST Integrated, Inc.21414 - 68th Avenue SouthKent, Washington 98032(206) 872-9500
October 1990
Prepared for
Ballistic Missile Organization/SSDNorton Air Force Base, California 92409-6468
I Approved for public release; distribution is unlimited
This report was submitted by Quest Integrated Inc., 21414 68th Avenue South, Kent Washington,98032, under conract F04704-90-L-0033. This effort was accomplished in support of the PhaseI SBIR program at the Ballistic Missile Organization (AFSC) Norton AFB, CA. 92409-6468.Thi re rt has been iew and approved for publicatioj.
Chief, Manufacturing Deputy for Program ManagementStaff Engineer amFor Program Management
REPORT DOCUMENTATION PAGE OM cNo 070p-018
~.c 9U~tt~~ t~t @Uf~ 0 l0t~b .ft14" t a..y t~t e' iO'1
e. tC~,d,9 the I..mw to, rfv,...g m.tt'..t weI . t-- oats t0,1tt9tt~~~~~~~~~~~~~~w~~~~~~~q~~~ "' A P4t.0t Att l ~ it~gai P 0I'o t,,o,.to qt ~ .~ ,~ t 6g t , 1;ff qtt*t 0, 4". "t, l m Oft 0 tO,
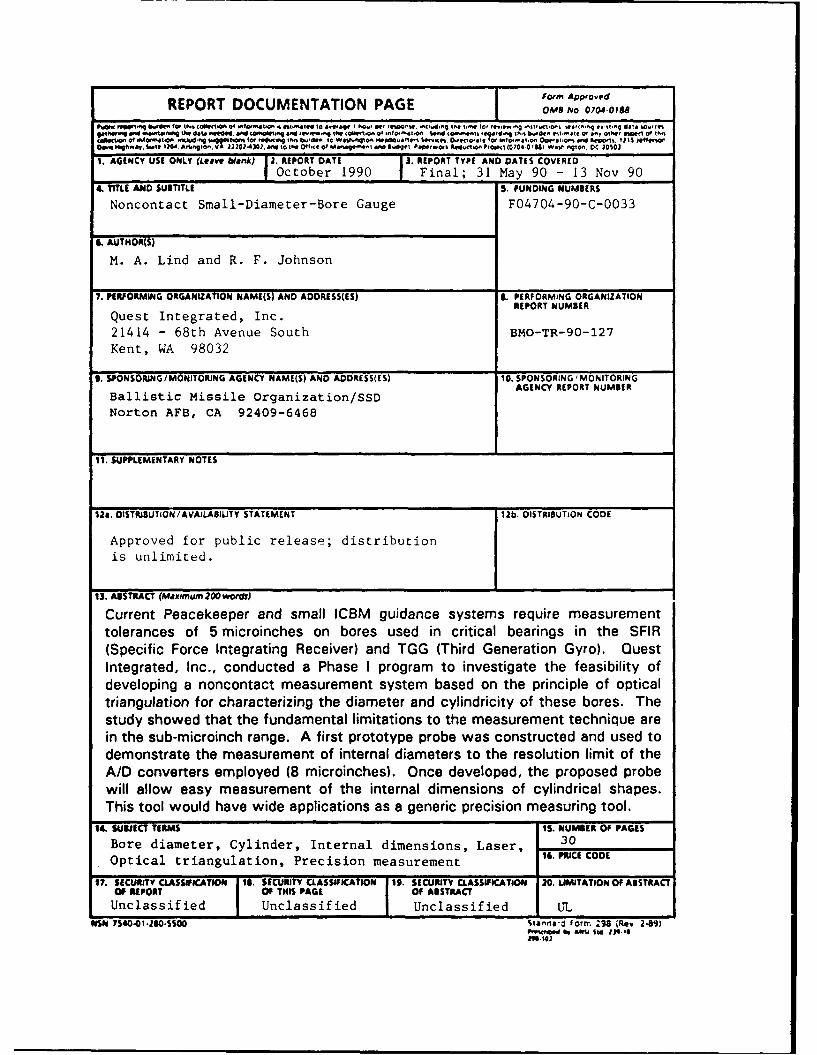
1. AGENCY USE ONLY (L#.aVe blank) 2. RE PO RT OATE 3. REPORT TYPE AND DATES COVEREDIOctober 1990 Final; 31 May 90 - 13 Nov 90
4. TITLE AND SUBTITLE S. FUNDING NUMBERS
Noncontact Small-Diameter-Bore Gauge FO 4704-90-C- 0033
6. AUTHOR(S)
M. A. Lind and R. F. Johnson
7. PERFORMING ORGANIZATION NAME(S) AND ADDRESS(ES) 6. PERFORMING ORGANIZATIONREPORT NUMBER
Quest Integrated, Inc.21414 - 68th Avenue South BMO-TR-90-127Kent, WA 98032
9. SPONSORLNGIMONITORJNG AGENCY NAME(S) AND ADDRESS(ES) 10. SPONSORING /MONITORINGAGENCY REPORT NUMBER
Ballistic Missile Organization/SSDNorton AFB, CA 92409-6468
III. SUPPLEMENTARY NOTES
12s. DISTRIBUTION /AVAILABILITY STATEMENT 1 2b. DISTRIBUhiON CODE
Approved for public release; distributionis unlimited.I_____________
13. ABSTRACT (Maximum 200 words)
Current Peacekeeper and small ICBM guidance systems require measurementtolerances of 5 microinches on bores used in critical bearings in the SFIR(Specific Force Integrating Receiver) and TGG (Third Generation Gyro). QuestIntegrated, Inc., conducted a Phase I program to investigate the feasibility ofdeveloping a noncontact measurement system based on the principle of opticaltriangulation for characterizing the diameter and cylindricity of these bores. Thestudy showed that the fundamental limitations to the measurement technique arein the sub-microinch range. A first prototype probe was constructed and used todemonstrate the measurement of internal diameters to the resolution limit of theAID converters employed (8 microinches). Once developed, the proposed probewill allow easy measurement of the internal dimensions of cylindrical shapes.This tool would have wide applications as a generic precision measuring tool.
14. SUSJECT TERMS I5. NUMBER OF PAGES
Bore diameter, Cylinder, Internal dimensions, Laser, 3
Optical triangulation, Precision measurement 16. PRI CODE
17. SECURITY CLASSIFICATION 18. SECURITY CLASSIFCATION 119. SECURITY CLASSIFICATION 20. IJMITATION OF ABSTRACTOF REPORT Of THIS PAGE Of ABSTRACT
Unclassified Unclassi fied Unclassified n*"SN 7540-01.280-4500 Stnds-c Form~ 29 Rev 2.89)
Frta00 % Astu stas lt is
ACKNOWLEDGEMENTS
The authors gratefully acknowledge the technical assistance of Richard Dougherty, ChrisLentz, and Mark Correa in assembling the probe electronic components; of Bill Gustafsonand Phil Bondurant in the analysis and design of the preamplifiers; and of Steve Craigen,Paul Tacheron, and Eckhart Ullrich in fabricating the glass substrates.
@/'J. i 2 .' jN ? .P F-1
TRIC, __
TR-5 10/10-90 ii
TABLE OF CONTENTS
PageREPORT DOCUMENTATION PAGE i
ACKNOWLEDGEMENTS i
LIST OF FIGURES iv
INTRODUCTION 1Description of the Problem 1Phase I Feasibility Study 1
BACKGROUND 2General Approach 2Theory Of Operation 3Practical Considerations 4
Light Source Noise 4Detector and Amplifier Noise 5Geometrical Error 7Temperature Error 8
PROBE DESIGN AND FABRICATION 9General Probe Layout 9Probe Body 9Optical Source 13
Lasers/Drivers 13Fiber Optics 14GRIN Lenses 14Faceted Mirror 14
Linear Position Detectors 14Preamplifier Electronics 17Data Acquisition System 17Experimental Arrangement 17
VERIFICATION EXPERIMENTS 20Calibration Range and Linearity 20Experimental Measurement Resolution 21Repeatability and Stability of the Measurement 23
CONCLUSIONS AND RECOMMENDATIONS 25Phase I Feasibility Study Conclusions 25Phase 'I Design Recommendations 25
Probe Design 3Support "'::ctronics and Software 27Mechanical Configuration 27
Potential Applicaticns 27
DISTRIBUTION LIST 30
TR-510/10-90 iii

LIST OF FIGURES
PagaeFigure 1. Optical Triangulation for Distance Measurements 2Figure 2. Physical Implementation of Diffuse and Specular 3
Optical Triangulation MeasurementsFigure 3. Lateral-Effect Photodetector 4Figure 4. Small Bore Probe Assembly Drawing 10Figure 5. Final Experimental Assembly 11Figure 6. Probe Body Detail 11Figure 7. Four-Hole Probe Body 12Figure 8. Single-Hole Probe Body 12Figure 9. Diode Laser Assembly 13Figure 10. GRIN to Fiber Assembly 14Figure 11. Faceted Mirror Detail 15Figure 12. Small Bore Trace Pattern 16Figure 13. Preamplifier Schematic 18Figure 14. Experimental Apparatus 19Figure 15. Experimental Calibration of Detectors 20Figure 16. Experimental High-Resolution Calibration Curves, Run 1 21Figure 17. Experimental High-Resolution Calibration Curves, Run 2 22Figure 18. Detector Signal Change per Translation Stage Increment 22Figure 19. Measurement Drift Versus Time 24Figure 20. Probe Body Design 26Figure 21. Electronic Signal Processing Block Diagram 28Figure 22. Small Bore Gauge Instrument Configuration 29
TR-510/10-90 iv
INTRODUCTION
Description of the Problem
Current Peacekeeper and small ICBM guidance systems require tolerances of 5 microinches(125 nm) on precision bearing bores used on the SFIR (Specific Force Integrating Receiver)and TGG (Third Generation Gyro). Currently, these bores are inspected using a manually,,aded air gauge. It is possible for the operator to damage these pyroceram bores whileattempting to measure them. The part must then be reworked, or scrapped. Thedevelopment of a mechanically loaded, highly accurate, noncontact measurement systemfor small-diameter bores is desired, since it could save many man-hours and reduce thescrap rate on very expensive parts.
The parts requiring these high-accuracy measurements are cylinders approximately 0.5inch long with an outside diameter of approximately 0.5 inch. They have a concentricinner bore approximately 0.25 inch in diameter. The specified rms surface finish of theparts varies between 2 and 8 microinches, depending upon the point in the manufacturingprocess. The high-quality surface finish of the pyroceram material used for the partsleaves the surfaces to be measured highly reflective and highly specular (mirror-like).
The objective of this program was to demonstrate the feasibility of providing a relativelylow cost, temperature-stable, noncontact caliper-based tool that can be applied to themeasurement of the diameter and cylindricity (circularity, straightness, and taper) of theabove parts. A longer term objective of the program is to be able to expand thecapabilities of the tool to include the measurement of flatness, parallelism, andperpendicularity of the surfaces surrounding the bore as well as true position of the borewith respect to the overall diameter and external cylindricity of the part.
Phase I Feasibility Study
The most often discussed noncontact measurement systems used over the dimensionalranges of interest are based on heterodyne laser interferometry. While such measurementsystems are technically feasible for the required application, the cost and complexity ofthese systems are relatively high. The approach taken by Quest Integrated, Inc., in thisPhase I feasibility study was to investigate the possibility of developing a high-accuracynoncontact measuring system based on the principle of optical triangulation.
This final report presents the measurement approach and describes the operational caveatsand sources of error for the selected approach. It then discusses the methodologyemployed in fabricating the laboratory prototype probe and describes the experimentalresults obtained on the resolution, repeatability, and overall accuracy of the probe. Finally,it presents recommendations for a Phase II program leading to a low-cost measurementtool for accurately characterizing the diameter and cylindricity of bored holes and othertubular structures to better than 1 microinch.
The Phase II program will involve the finalizing of the design and the manufacture, testing,and validation of a full-function prototype measuring system. The potential advantages tothe proposed optical triangulation bore measurement gauges are low cost, ruggedconstruction, and ease of use.
TR-510/10-90 1
BACKGROUND
General Approach
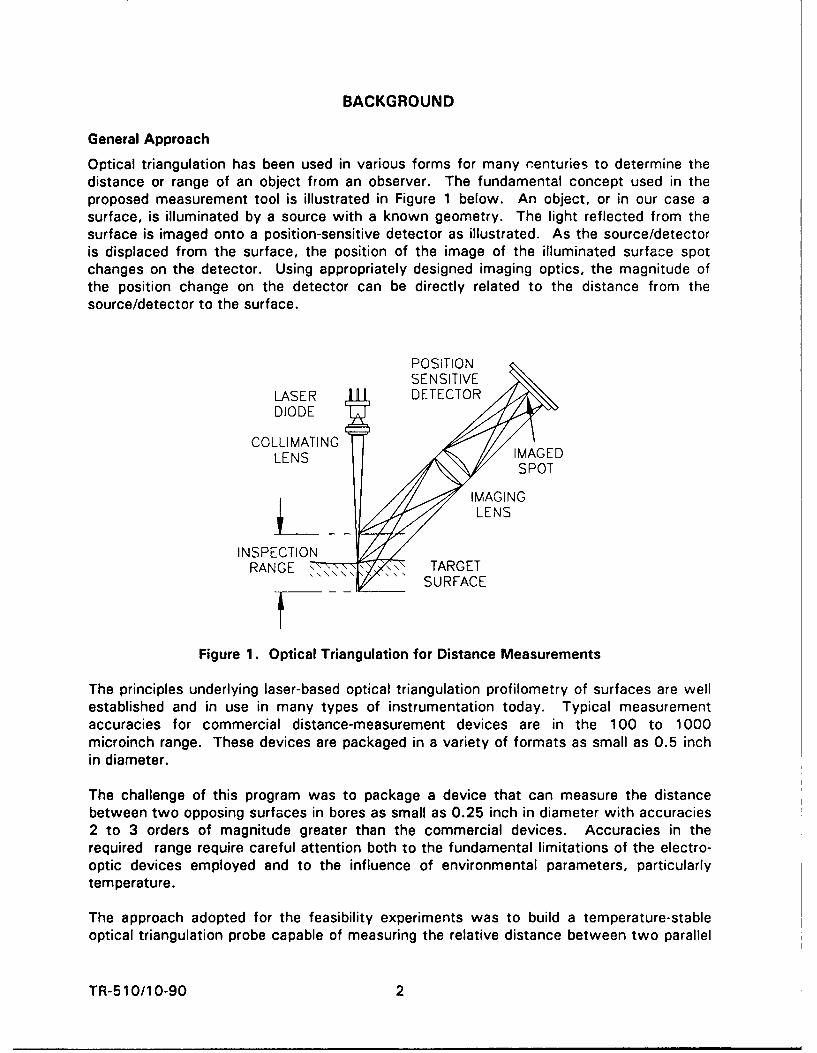
Optical triangulation has been used in various forms for many renturies to determine thedistance or range of an object from an observer. The fundamental concept used in theproposed measurement tool is illustrated in Figure 1 below. An object, or in our case asurface, is illuminated by a source with a known geometry. The light reflected from thesurface is imaged onto a position-sensitive detector as illustrated. As the source/detectoris displaced from the surface, the position of the image of the illuminated surface spotchanges on the detector. Using appropriately designed imaging optics, the magnitude ofthe position change on the detector can be directly related to the distance from thesource/detector to the surface.
POSITIONSENSITIVE
LASER DETECTORDIODE
COLLIMATINGLENS IMAGED
SPOTIMAGING
~LENS
INSPECTIONRANGE ,\,-. i .#" TARGET
SURFACE
Figure 1. Optical Triangulation for Distance Measurements
The principles underlying laser-based optical triangulation profilometry of surfaces are wellestablished and in use in many types of instrumentation today. Typical measurementaccuracies for commercial distance-measurement devices are in the 100 to 1000microinch range. These devices are packaged in a variety of formats as small as 0.5 inchin diameter.
The challenge of this program was to package a device that can measure the distancebetween two opposing surfaces in bores as small as 0.25 inch in diameter with accuracies2 to 3 orders of magnitude greater than the commercial devices. Accuracies in therequired range require careful attention both to the fundamental limitations of the electro-optic devices employed and to the influence of environmental parameters, particularlytemperature.
The approach adopted for the feasibility experiments was to build a temperature-stableoptical triangulation probe capable of measuring the relative distance between two parallel
TR-510/10-90 2
opposing surfaces with a relative resolution exceeding 1 microinch. The intent of theprogram was to demonstrate this caliper diameter measurement as the first step inmeasuring multiple diameters to characterize the interior of high-reflectivity specular bores.
Theory of Operation
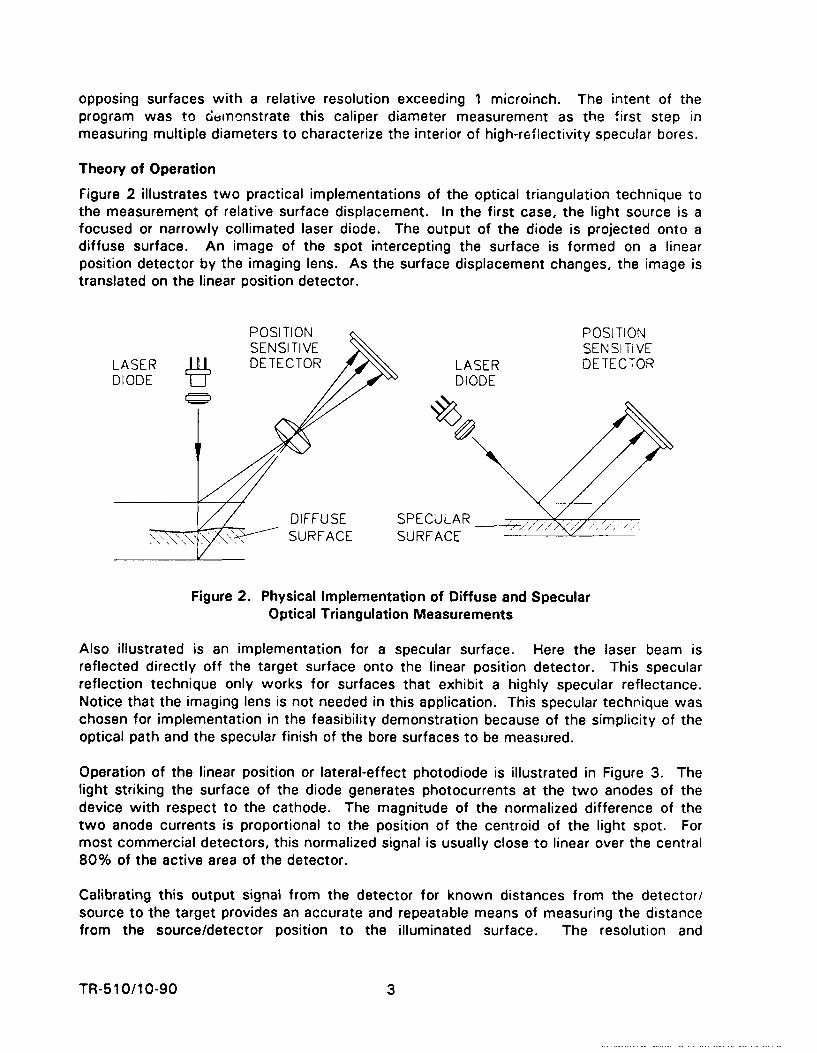
Figure 2 illustrates two practical implementations of the optical triangulation technique tothe measurement of relative surface displacement. In the first case, the light source is afocused or narrowly collimated laser diode. The output of the diode is projected onto adiffuse surface. An image of the spot intercepting the surface is formed on a linearposition detector by the imaging lens. As the surface displacement changes, the image istranslated on the linear position detector.
POSITION POSITIONSENSITIVE SENSITIVE
LASER DETECTOR LASER DETECTORDIODE DIODE
DIFFUSE SPECULAR777 7-, SURFACE SURFACE
Figure 2. Physical Implementation of Diffuse and SpecularOptical Triangulation Measurements
Also illustrated is an implementation for a specular surface. Here the laser beam isreflected directly off the target surface onto the linear position detector. This specularreflection technique only works for surfaces that exhibit a highly specular reflectance.Notice that the imaging lens is not needed in this application. This specular technique waschosen for implementation in the feasibility demonstration because of the simplicity of theoptical path and the specular finish of the bore surfaces to be measured.
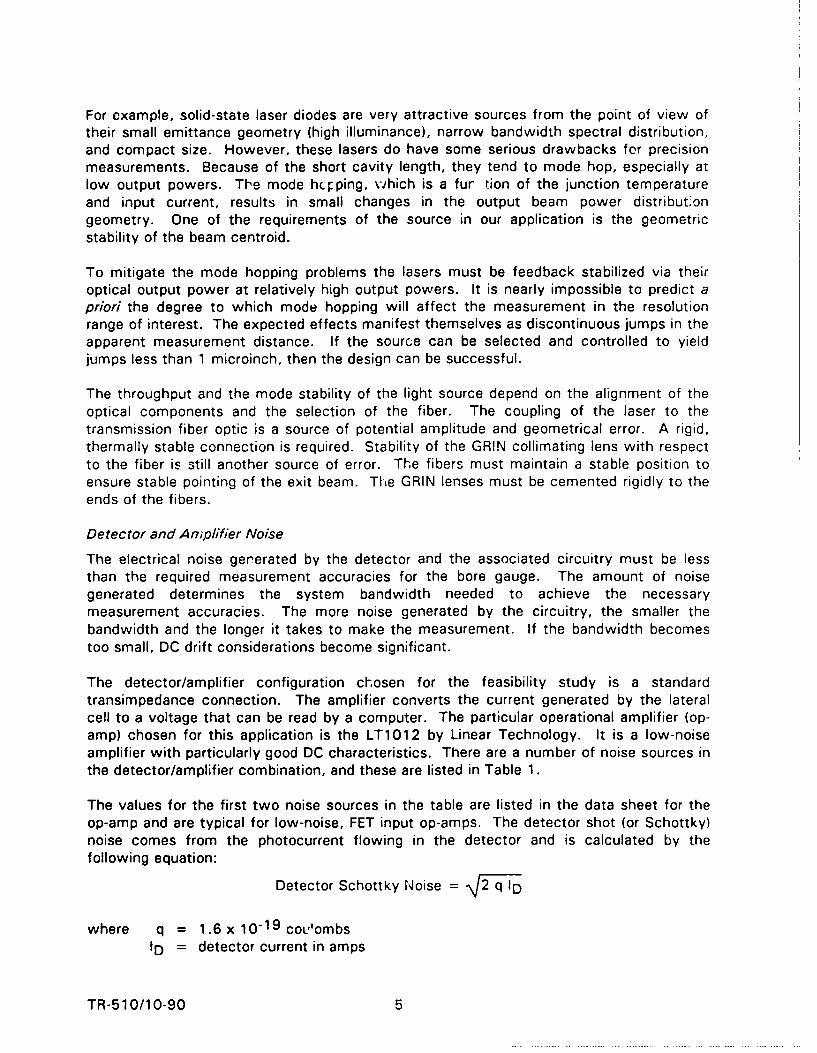
Operation of the linear position or lateral-effect photodiode is illustrated in Figure 3. Thelight striking the surface of the diode generates photocurrents at the two anodes of thedevice with respect to the cathode. The magnitude of the normalized difference of thetwo anode currents is proportional to the position of the centroid of the light spot. Formost commercial detectors, this normalized signal is usually close to linear over the central80% of the active area of the detector.
Calibrating this output signal from the detector for known distances from the detector/source to the target provides an accurate and repeatable means of measuring the distancefrom the source/detector position to the illuminated surface. The resolution and
TR-510/10-90 3
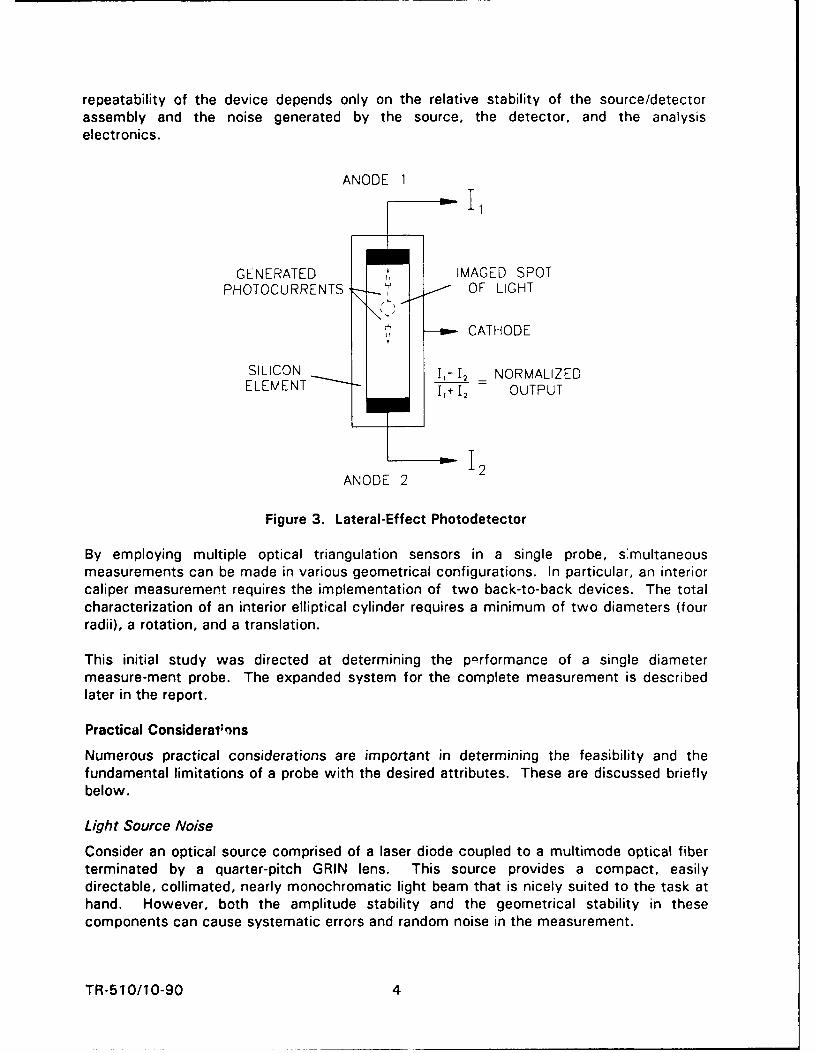
repeatability of the device depends only on the relative stability of the source/detectorassembly and the noise generated by the source, the detector, and the analysiselectronics.
ANODE 1
GENERATED IMAGED SPOTPHOTOCURRENTS OF LIGHT
CATHODE
SILICON ,- I2 NORMALIZEDELEMENT i + - OUTPUT
S12
ANODE 2
Figure 3. Lateral-Effect Photodetector
By employing multiple optical triangulation sensors in a single probe, s*multaneousmeasurements can be made in various geometrical configurations. In particular, an interiorcaliper measurement requires the implementation of two back-to-back devices. The totalcharacterization of an interior elliptical cylinder requires a minimum of two diameters (fourradii), a rotation, and a translation.
This initial study was directed at determining the parformance of a single diametermeasure-ment probe. The expanded system for the complete measurement is describedlater in the report.
Practical Considerat .ns
Numerous practical considerations are important in determining the feasibility and thefundamental limitations of a probe with the desired attributes. These are discussed brieflybelow.
Light Source Noise
Consider an optical source comprised of a laser diode coupled to a multimode optical fiberterminated by a quarter-pitch GRIN lens. This source provides a compact, easilydirectable, collimated, nearly monochromatic light beam that is nicely suited to the task athand. However, both the amplitude stability and the geometrical stability in thesecomponents can cause systematic errors and random noise in the measurement.
TR-510/10-90 4
For example, solid-state laser diodes are very attractive sources from the point of view oftheir small emittance geometry (high illuminance), narrow bandwidth spectral distribution,and compact size. However, these lasers do have some serious drawbacks fer precisionmeasurements. Because of the short cavity length, they tend to mode hop, especially atlow output powers. The mode hclping, which is a fur tion of the junction temperatureand input current, results in small changes in the output beam power distribut'ongeometry. One of the requirements of the source in our application is the geometricstability of the beam centroid.
To mitigate the mode hopping problems the lasers must be feedback stabilized via theiroptical output power at relatively high output powers. It is nearly impossible to predict apriori the degree to which mode hopping will affect the measurement in the resolutionrange of interest. The expected effects manifest themselves as discontinuous jumps in theapparent measurement distance. If the source can be selected and controlled to yieldjumps less than 1 microinch, then the design can be successful.
The throughput and the mode stability of the light source depend on the alignment of theoptical components and the selection of the fiber. The coupling of the laser to thetransmission fiber optic is a source of potential amplitude and geometrical error. A rigid,thermally stable connection is required. Stability of the GRIN collimating lens with respectto the fiber is still another source of error. The fibers must maintain a stable position toensure stable pointing of the exit beam. The GRIN lenses must be cemented rigidly to theends of the fibers.
Detector and Amplifier Noise
The electrical noise generated by the detector and the associated circuitry must be lessthan the required measurement accuracies for the bore gauge. The amount of noisegenerated determines the system bandwidth needed to achieve the necessarymeasurement accuracies. The more noise generated by the circuitry, the smaller thebandwidth and the longer it takes to make the measurement. If the bandwidth becomestoo small, DC drift considerations become significant.
The detector/amplifier configuration chosen for the feasibility study is a standardtransimpedance connection. The amplifier converts the current generated by the lateralcell to a voltage that can be read by a computer. The particular operational amplifier (op-amp) chosen for this application is the LT1012 by Linear Technology. It is a low-noiseamplifier with particularly good DC characteristics. There are a number of noise sources inthe detector/amplifier combination, and these are listed in Table 1.
The values for the first two noise sources in the table are listed in the data sheet for theop-amp and are typical for low-noise, FET input op-amps. The detector shot (or Schottky)noise comes from the photocurrent flowing in the detector and is calculated by thefollowing equation:
Detector Schottky Noise = I q ID
where q = 1.6 x 10 "19 coL'ombsID = detector current in amps
TR-510/10-90 5
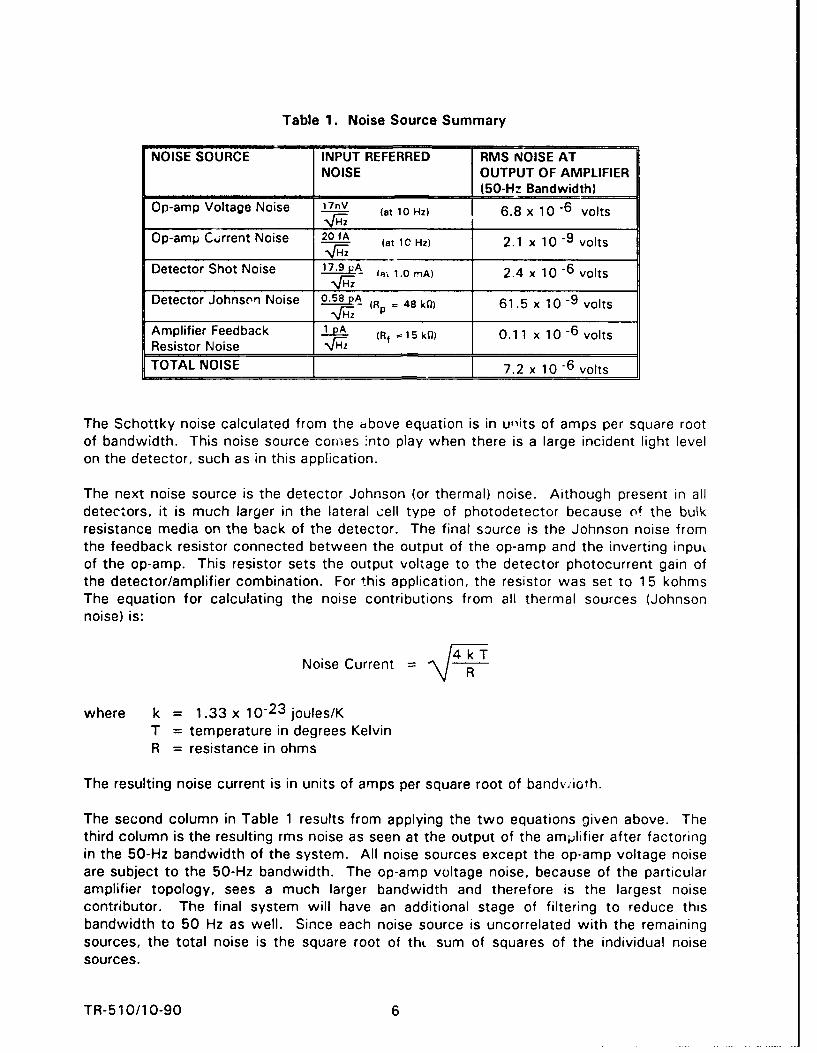
Table 1. Noise Source Summary
NOISE SOURCE INPUT REFERRED RMS NOISE ATNOISE OUTPUT OF AMPLIFIER
(50-H: Bandwidth)Op-amp Voltage Noise 17 (at 10 Hz) 6.8 x 10 -6 volts
Op-amp Current Noise 20 fA (at 10 Hz) 2.1 x 10 -9 volts
Detector Shot Noise 17.9 pA Z&i 1.0 mA) 2.4 x 10 -6 volts
Detector Johnson Noise 0.58 pA (R 4B k) 61.5 x 10 - volts
Amplifier Feedback 1 pA (Rf -15 k0) 0.11 x 10 -6 voltsResistor Noise qr
TOTAL NOISE 1 7.2 x 10 -6 volts
The Schottky noise calculated from the above equation is in units of amps per square rootof bandwidth. This noise source comes ;nto play when there is a large incident light levelon the detector, such as in this application.
The next noise source is the detector Johnson (or thermal) noise. Aithough present in alldetectors, it is much larger in the lateral cell type of photodetector because of the bulkresistance media on the back of the detector. The final source is the Johnson noise fromthe feedback resistor connected between the output of the op-amp and the inverting inputof the op-amp. This resistor sets the output voltage to the detector photocurrent gain ofthe detector/amplifier combination. For this application, the resistor was set to 15 kohmsThe equation for calculating the noise contributions from all thermal sources (Johnsonnoise) is:
Noise Current 4 kT-\R
where k = 1.33 x 10⁻²³ joules/KT = temperature in degrees KelvinR = resistance in ohms
The resulting noise current is in units of amps per square root of bandwioth.
The second column in Table 1 results from applying the two equations given above. Thethird column is the resulting rms noise as seen at the output of the amplifier after factoringin the 50-Hz bandwidth of the system. All noise sources except the op-amp voltage noiseare subject to the 50-Hz bandwidth. The op-amp voltage noise, because of the particularamplifier topology, sees a much larger bandwidth and therefore is the largest noisecontributor. The final system will have an additional stage of filtering to reduce thisbandwidth to 50 Hz as well. Since each noise source is uncorrelated with the remainingsources, the total noise is the square root of thL sum of squares of the individual noisesources.
TR-510/10-90 6
The feasibility test probe has a sensitivity of approximately 50 microvolts per microinch.Comparing this value with the total rms noise output of 7.2 microvolts indicates that thenoise from the detector or amplifier will not be a limiting factor in the system, particularlyconsidering that the noise can easily be lowered to 2.4 microvolts rms by further reducingthe bandwidth.
Geometrical Error
There are numerous sources of design-specific geometrical error that are possible with theproposed noncontact optical caliper measurement technique. Detector nonlinearity, tilt
error, taper error, and concentricity error are discussed below for a probe with a 45-degreeincident source beam configuration.
The linearity error of the detector (the output signal verses the position of the centroid ofthe light spot on the detector) is a large source of potential error. Typically, only thecenter 60% to 80% of the active area of the detector is specified by the detectormanufacturer to be linear. In practice, Quest has found even this limited range to be
optimistic. Fortunately, a simple calibration of the detectors can effectively eliminate thissource of error. The calibration is performed by measuring a standard set of knowndisplacements (or diameters) and recording the output signal(s). Since the output signalsfrom a single detector rire always monotonic, the output signal of each detector can berelated to actual wall displacement via a look-up table. This process is illustrated in theexperimental results below.
If the measurement probe is tilted within the opposing surfaces to be measured, thenadditional errors may occur depending on the specific geometry of the probe in relation tothe surfaces being measured. In the case of measuring right circular cylinders, two typesof error should be considered: ellipticity error and specular direction.
First consider the ellipticity error. Unless the measurement is performed perpendicular tothe axis of the cylinder, the probe will measure an elongated dimension along the axis oftilt. The diameter will increase as 1/cos(a) in the direction of the tilt, but the diametor canremain constant perpendicular to the direction of the tilt. In the case of the cylinders ofinterest, this tilt (ellipticity) error can be shown by simple geometry to be less than 40microinches per degree of tilt for small angles.
Of larger consequence is the tilt error due to changes in the specular reflectance angle andthe particular geometry of the probe used in the feasibility experiments. This source oferror is the major disadvantage of an optical triangulation device that relies on specularlight. It can be shown by simple geometry to exceed 8 mils per degree of tilt for small
angles for the probe configuration used in the feasibility study. The large magnitude of theerror is primarily because the detectors are not oriented perpendicular to the reflectedbeam. It is therefore extremely important to insert the probe along the axis of the cylinder.Axial alignment to 0.5 millidegree is required to obtain the specified absolute accuraciesfor the probe used in the feasibility studies. It should also be noted that this error can beeliminated in the case of measuring a true cylinder by adding a rotational degree offreedom to the measurement process. For example, an accurate diameter measurement
can be made by rotating the probe or the cylinder on its axis and looking for the minimum
TR-510/10-90 7
diameter. By adding still another rotational degree of freedom synchronized to the first,elliptical, and multimodal cylinders can also be measured.
Another large source of potential error is due to taper in the bore of the cylinder. Again,for a probe geometry similar to the one used in the feasibility experiments, which isoriented axisymmetric with the cylinder, the error is relatively large (4 mils/degree or 2 milsfrom one end of the cylinder to the other for a 1-degree full-width taper). Thus,the taper inthe cylinders of interest can vary no more than about 2.5 microinches to maintain therequired 5 microinch tolerance limit. However, it is worth noting that the measurementdegeneracy can again be mitigated by adding another degree of freedom to themeasurement system. In this case, translation through the bore is required.
The last source of geometrical error considered is concentricity or displacement error whenthe probe is not coaxial with the cylinder to be measured. The primary strength of theprobe configuration chosen for the feasibility demonstration is that displacement error canbe effectively eliminated. After calibration, the probe will measure the true diameter of thebore across any arbitrary axis subject to the constraints mentioned above. If twoorthogonal axes are measured simultaneously, then a unique diameter can be determinedfor any true cylinder. Again, an elliptical or multimodal cylinder will require a rotationaldegree of freedom to remove the measurement degeneracy.
Although the geometrical error is relatively large, it can be kept within tolerance limits by ajudicious choice of probe geometry and measurement fixturing.
Temperature Error
The thermal expansion coefficient of the pyroceram material used in the parts to bemeasured is on the order of 30 microinches/inch/K at room temperature. Themeasurement must be performed in an environment controlled to better than 1 0 C to obtainmeasurement accuracies in the required 5 microinch range. Good measurement practicedictates actual temperature control approximately one order of magnitude greater than thisminimum requirement. In practice, this implies that the measurements must be doneisolated from varying or moving heat sources such as found with human proximity.
In the ideal case, the measurement probe would be constructed of ultra-low expansion(ULE) coefficient materials and designed in such a way as to minimize geometrical errordue to thermal expansion of the probe body. ULE glasses (30 ppb) are available fromCorning Glass and were used in the feasibility experiments described below.
TR-510/10-90 8
PROBE DESIGN AND FABRICATION
General Probe Layout
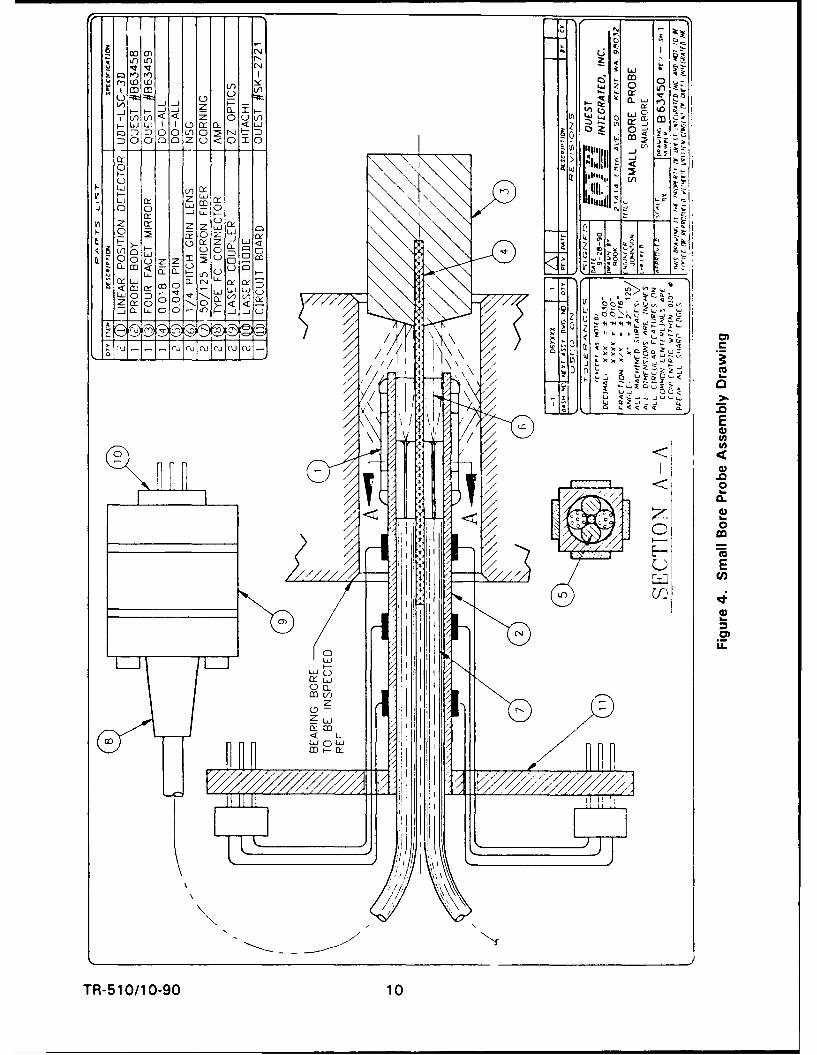
Figure 4 shows the detailed assembly drawing of the probe used in the feasibility study.The design takes advantage of commercially available fiber-optic light source componentsto provide the required collimated illumination beams. It also uses commercial lateral-effect photodiodes mounted to a special thermally stable glass substrate to detect thedisplacement of the specularly reflected light beams. The probe is designed with two setsof opposing detectors that are used to gauge the surface at four places 90 degrees apart.Due to experimental limitations, only one set of opposing detectors was used at a time forthe feasibility experiments.
For the sake of expediency during the feasibility experiments, the four-faceted mirror wasmounted via a steel dowel pin to the glass substrate as shown in the diagram. This steelrod represents the largest contributor of thermal error for the feasibility experiments. A1 OF temperature drift causes a 7-microinch error. Alternate designs for the final probewill eliminate this high thermal expansion connection.
In the final design the probe body will be mechanically protected by a cylindrical low-thermal-expansion cover with the mirror attached to the cover. Windows will allow thelaser beams to exit and enter the probe body. Again, for the sake of expediency in thefeasibility experiments, the probe body was left exposed and the detectors unprotected.
Another compromise made for the sake of expediency in the feasibility design was theselection of the incident angle for the source onto the wall of the cylinder bore. An angleof 30 degrees with respect to the wall was chosen. This shallow angle is undesirable fromthe point of view of adding error to the measurement (and unnecessary sensitivity via theadditional mechanical advantage). The angle selection was necessary, however, to ac-commodate the oversized geometry of the detectors, as they were the only ones availablefor the feasibility experiments at the onset of the program. Since that time, new detectorshave been located that will allow the angle to be increased to more than 45 degrees.
The glass substrate comprising the exposed probe body with the mirror attached wasepoxied to a printed circuit board to supply a rigid disconnectable ground plane. Theground plane board was then mounted to twin preamplifier boards, which were in turnconnected to a precision translation assembly. The assembled configuration is illustratedin the photograph in Figure 5.
Probe Body
A close-up photograph of a typical probe body with the detectors mounted is shown inFigure 6. Three of these probe bodies using two different designs were constructed forthe feasibility experiments. The more desirable four-hole substrate (see Figure 7),whichwas designed to hold the four 1.0-mm-diameter GRIN lenses in a precise orientation, wasincorrectly masked during the detector mounting process and therefore not available forthe feasibility experiments. One of the single-hole substrates (see Figure 8), which wasdesigned to be fitted with two GRIN lenses separated by the mirror support pin and held inplace by two spacer pins, was used to collect the data presented below.
TR-510/10-90 9
00 (3
(AE L.J n(L 0 v z-
Li < L / Li 0 C
oLf~ or OUL <. mL L -
0~uw 1ck kill
C/IIII~ Z IIL
I- zw
z -j
CL D u z Z u ~I< t/
La C- '
0' -
:j a-) E o 'n j u
0 u aor
Oj
H-H-
Eto
____ ____ ____ _ <
17=1 <
v0
E-- c
TR-510/1090 1
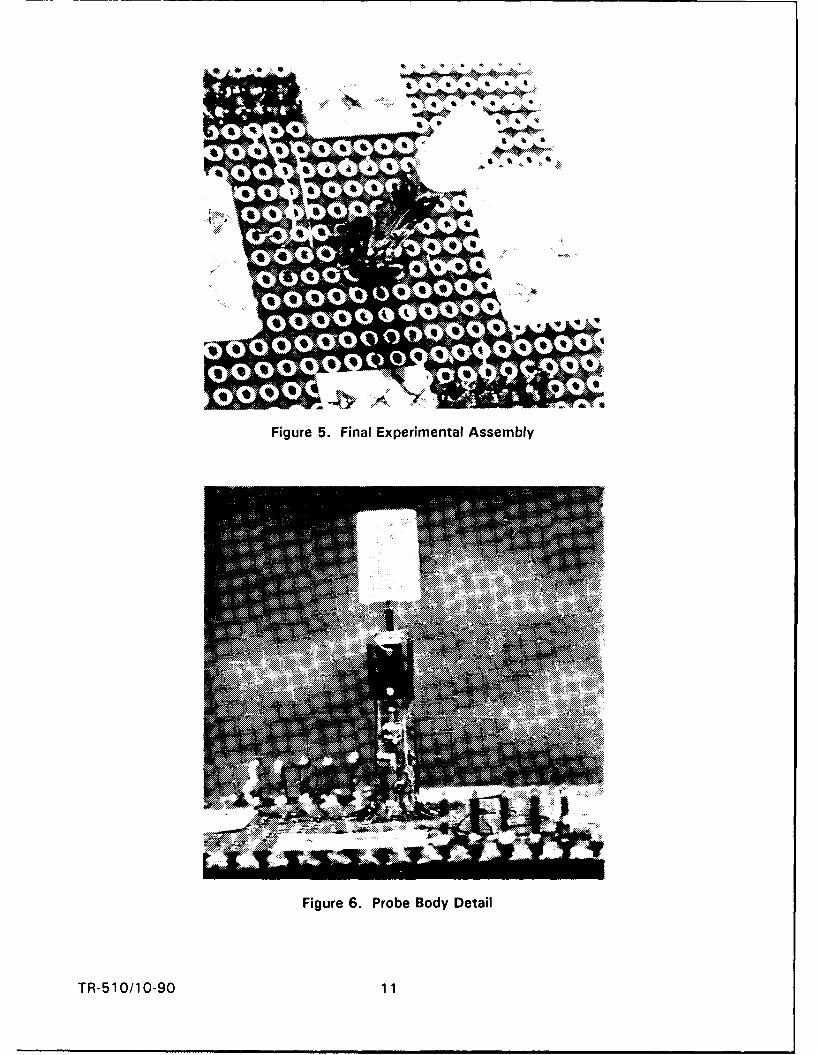
Figure 5. Final Experimental Assembly
Figure 6. Probe Body Detail
TR-51 0/10-90 11
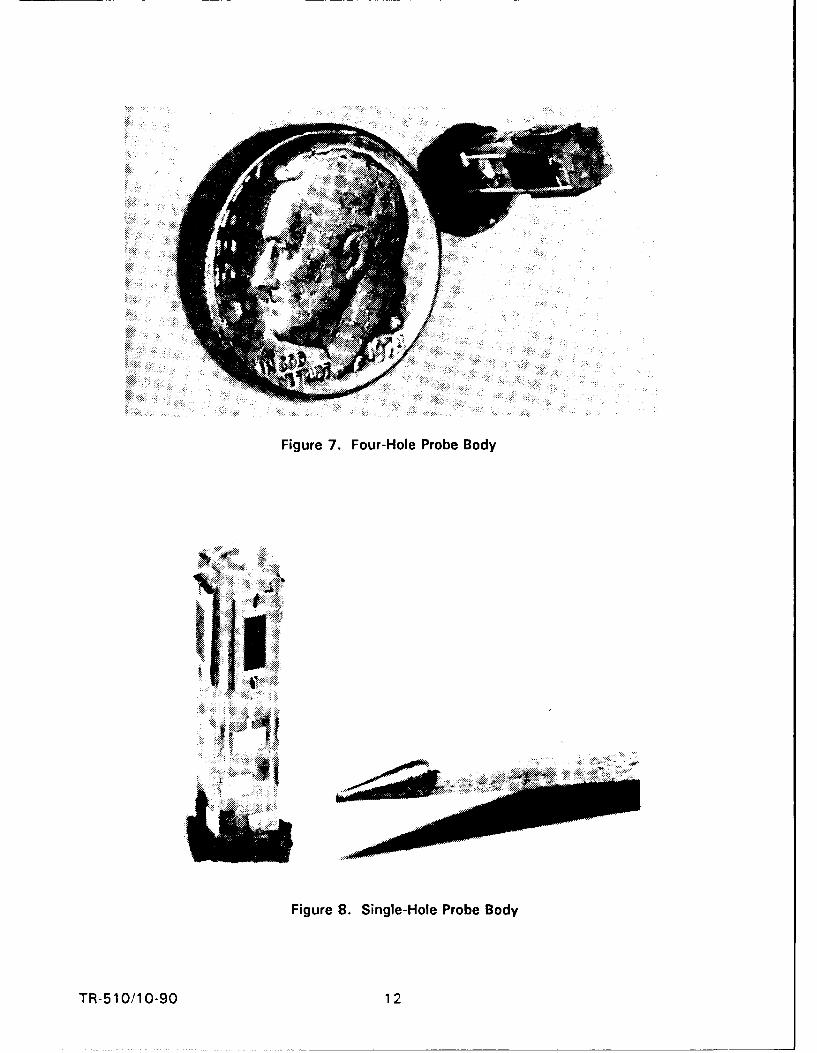
Figure 7. Four-Hole Probe Body
Figure 8. Single-Hole Probe Body
TR-510/10-90 12
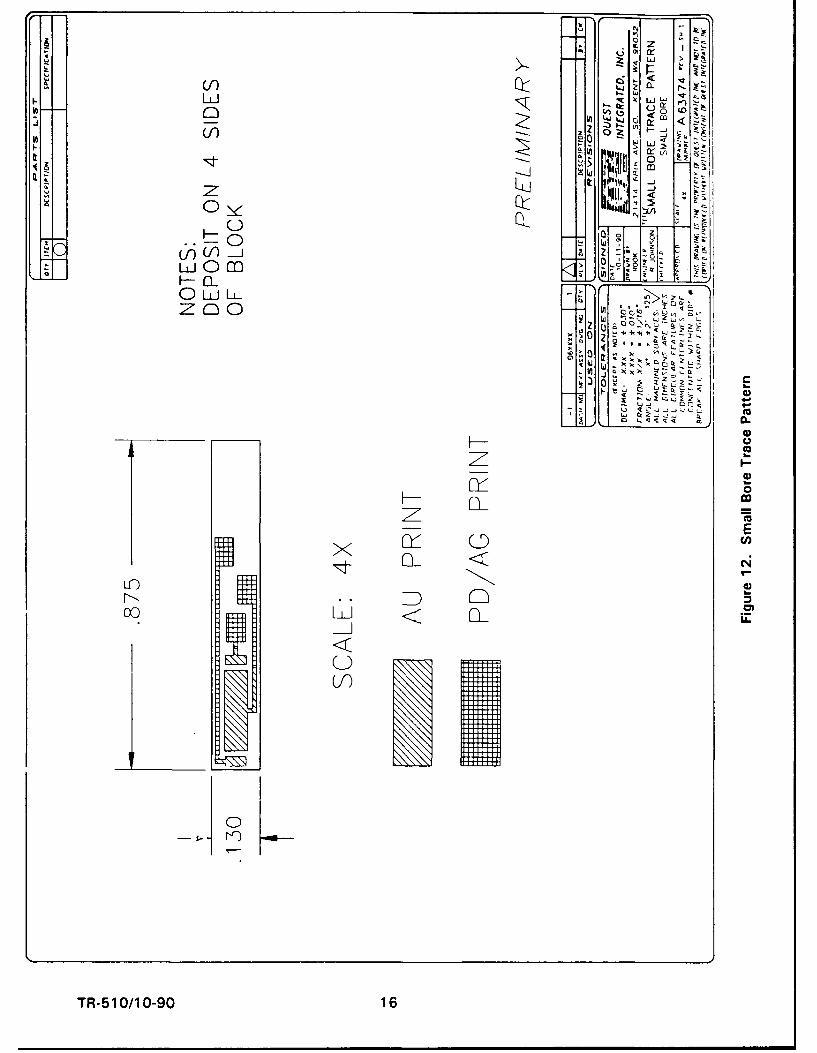
The substrates used for the probe body were abrasive-waterjet (AWJ) machined and drilledat Quest from ULE coefficient glass. This high titanium glass supplied by Corning Glasshas a thermal expansion coefficient of approximately 30 ppb per degree Fahrenheit atroom temperature. The substrates were AWJ cut to 0.130-inch square blocks 0.875-inchlong. They were then AWJ drilled. With a few days of experimentation, the two one-holesubstrates were drilled without damage to a hole diameter of 0.098 inch with less than0.001 inch of taper over the entire length of the hole. The four-hole substrate provedmore difficult to machine without taper. The final holes had a uniform diameter of 0.040inch to a depth of approximately 0.6 inch followed by a taper to approximately 0.020 inchin diameter. Coincidentally, this tapered undersized hole diameter is ideally suited formounting standard 0.5-mm-diameter GRIN lenses, a feature that was not explored in thisfeasibility study due to the lead time required for acquisition of the 0.25 pitch lenses.
The substrates were then sent to a hybrid circuit manufacturer (Pacific Hybrids, Beaverton,OR) where the 0.005-inch-wide conductive traces with solder pads were laid on each ofthe four sides of the substrate. The detectors were then mounted and wire-bonded to thetraces before returning to Quest for final assembly and testing. Unfortunately, during ship-ment many of the delicate wire-bonds connecting the two ends of each detector to thesubstrate conductors on the unprotected substrates were broken. Attempts at reconnec-tion with silver conductive epoxy and #30 magnet wire were met with enough success tocontinue the experiment.
Optical Source
As mentioned previously, each of the light sources consisted of a diode laser coupled to afiber optic and terminated by a collimating GRIN lens. This assembly produced a stable,high-intensity, collimated light beam with a diameter somewhat less than 1 mm.
Lasers/Drivers
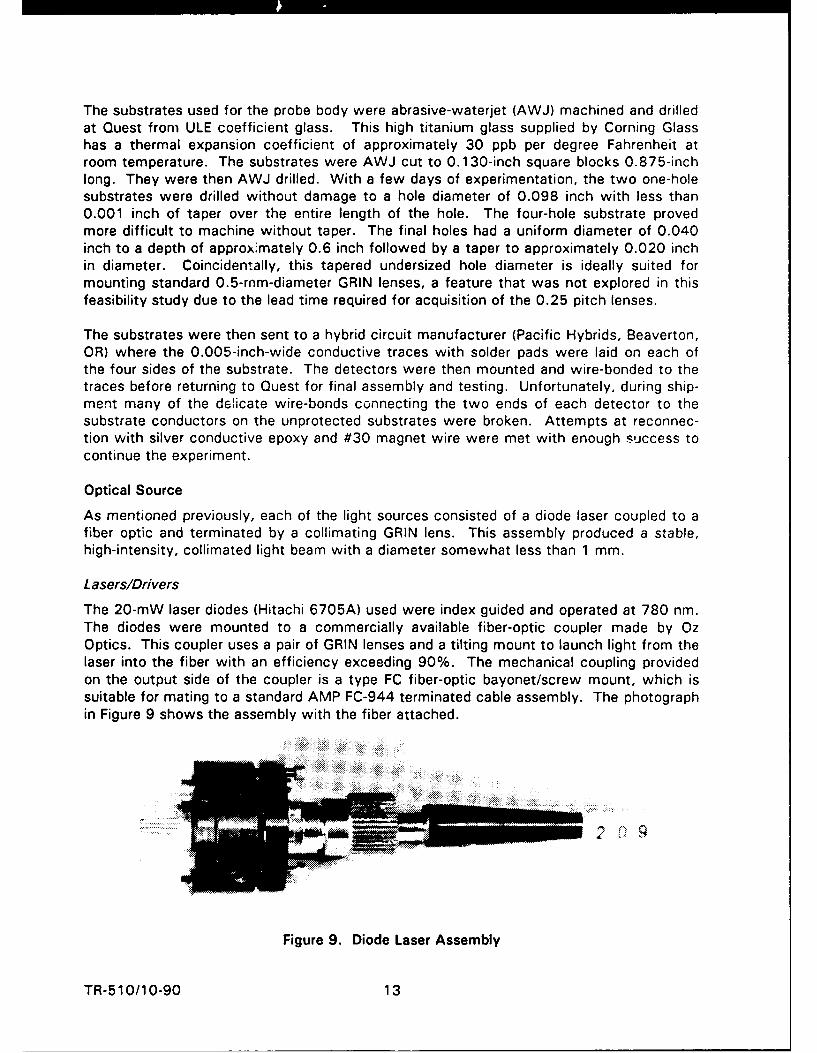
The 20-mW laser diodes (Hitachi 6705A) used were index guided and operated at 780 nm.The diodes were mounted to a commercially available fiber-optic coupler made by OzOptics. This coupler uses a pair of GRIN lenses and a tilting mount to launch light from thelaser into the fiber with an efficiency exceeding 90%. The mechanical coupling providedon the output side of the coupler is a type FC fiber-optic bayonet/screw mount, which issuitable for mating to a standard AMP FC-944 terminated cable assembly. The photographin Figure 9 shows the assembly with the fiber attached.
Figure 9. Diode Laser Assembly
TR-510/10-90 13
The lasers were powered by Sharp IC3C02 laser drivers. These current drivers are feed-back stabilized via the back-faceted diode on the laser package to provide a constant opti-cal power output to approximately one part in a thousand, which is sufficient for thefeasibility study.
Fiber Optics
The multimode optical fiber used had a 50-micron core diameter with a 1 25-microncladding diameter surrounded by a 900-micron polyethylene jacket.
GRIN Lenses
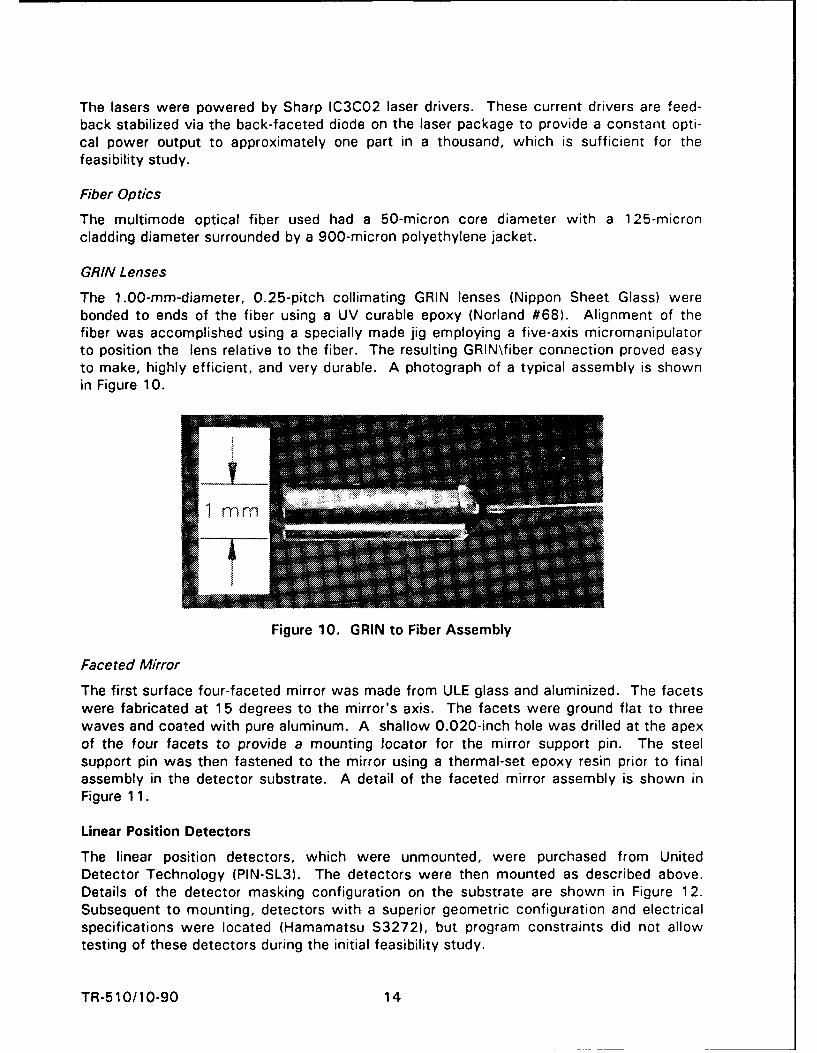
The 1.00-mm-diameter, 0.25-pitch collimating GRIN lenses (Nippon Sheet Glass) werebonded to ends of the fiber using a UV curable epoxy (Norland #68). Alignment of thefiber was accomplished using a specially made jig employing a five-axis micromanipulatorto position the lens relative to the fiber. The resulting GRIN\fiber connection proved easyto make, highly efficient, and very durable. A photograph of a typical assembly is shownin Figure 10.
Figure 10. GRIN to Fiber Assembly
Faceted Mirror
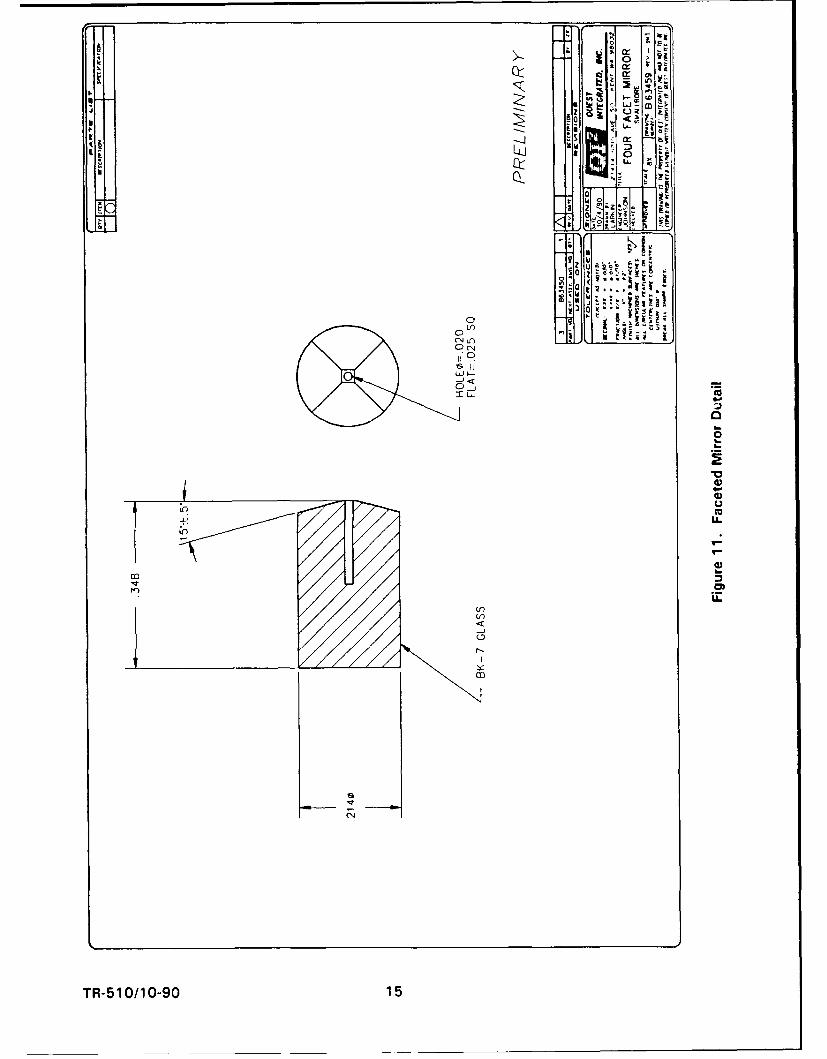
The first surface four-faceted mirror was made from ULE glass and aluminized. The facetswere fabricated at 15 degrees to the mirror's axis. The facets were ground flat to threewaves and coated with pure aluminum. A shallow 0.020-inch hole was drilled at the apexof the four facets to provide a mounting locator for the mirror support pin. The steelsupport pin was then fastened to the mirror using a thermal-set epoxy resin prior to finalassembly in the detector substrate. A detail of the faceted mirror assembly is shown inFigure 11.
Linear Position Detectors
The linear position detectors, which were unmounted, were purchased from UnitedDetector Technology (PIN-SL3). The detectors were then mounted as described above.Details of the detector masking configuration on the substrate are shown in Figure 12.Subsequent to mounting, detectors with a superior geometric configuration and electricalspecifications were located (Hamamatsu S3272), but program constraints did not allowtesting of these detectors during the initial feasibility study.
TR-510/10-90 14
I.*
0
Lz j0 _j&J~
In-
0
CNI
TR-50/1090 1
z
hii
L- 20 aLJ
m
OLLJLL
0 L0'
z Cr::0
L ., L 1
0V
zz
- E
x -U-)-
001.- aJ LL
TR-5 10/10-90 16
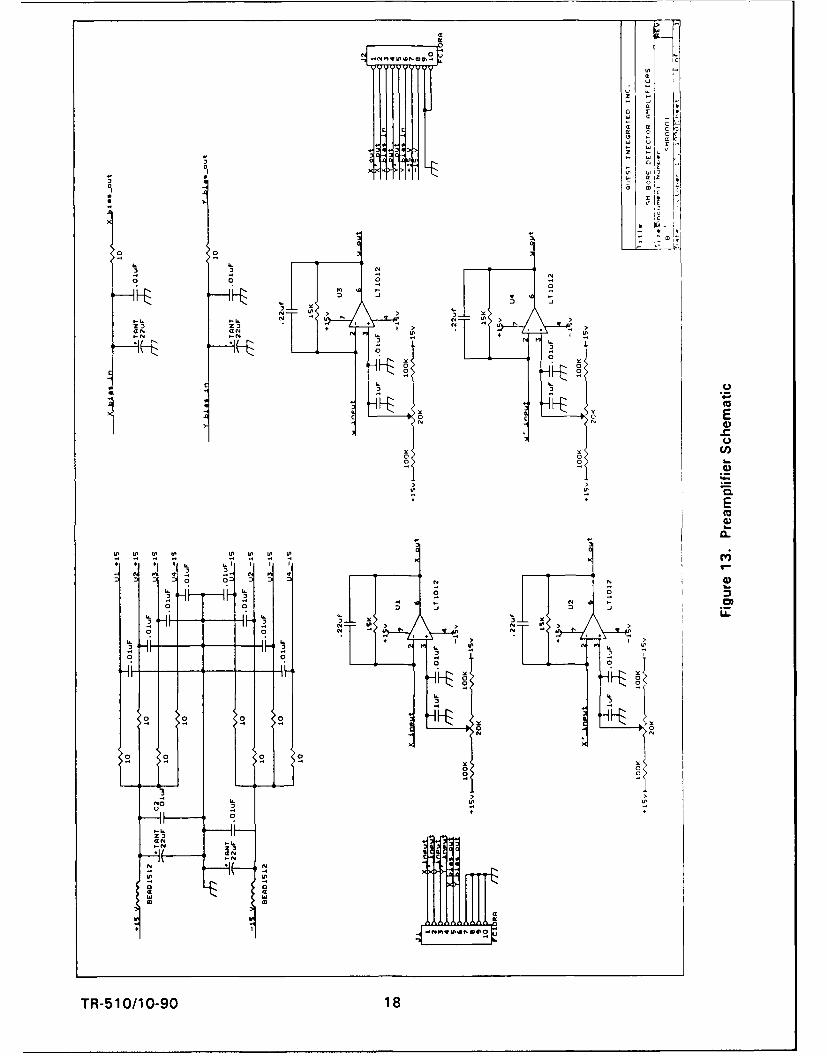
Preamplifier Electronics
The preamplifier electronics shown schematically in Figure 13 were designed to be bothlow in noise and versatile, allowing for both AC and DC operation. Only DC operation wasused in the feasibility experiments.
Data Acquisition System
The data acquisition system consisted of a PC and an eight-channel 1 2-bit analog-digitalconverter. The A/D was operated in differential mode to monitor two opposing detectorssimultaneously. The signals from each side of the two linear position detectors were thusdigitized prior to performing the necessary arithmetic with the computer. The laser powerand the gains of the preamplifiers were adjusted to take maximum advantage of the fulldynamic range of the A/D over a 0.010-inch measurement range for the probe. With thisarrangement, the switching resolution of the digitizer limits the resolution in the diametermeasurement to approximately one part in four thousand for each input channel or 5microinches in the calculated distance value in the optimum situation (perfect linearity andidentical sensitivities for both detectors). In practice, as shown below, the resolution ofmeasurement was limited to approximately 8 microinches. Additional measurementresolution will require a higher resolution A/D.
To provide data on noise, stability, and repeatability, the software was designed toperform a series of 100 sequential measurements at 0.1-second intervals, to calculate thenormalized difference signal for each data point, and to perform a statistical analysis onthe data sample to yield the average and standard deviations for the measurement. Theraw data were displayed in real time in A/D counts for operator monitoring, and thestatistical data were presented after each measurement sequence was completed. Theresulting data were fed into a standard spreadsheet program for further analysis.
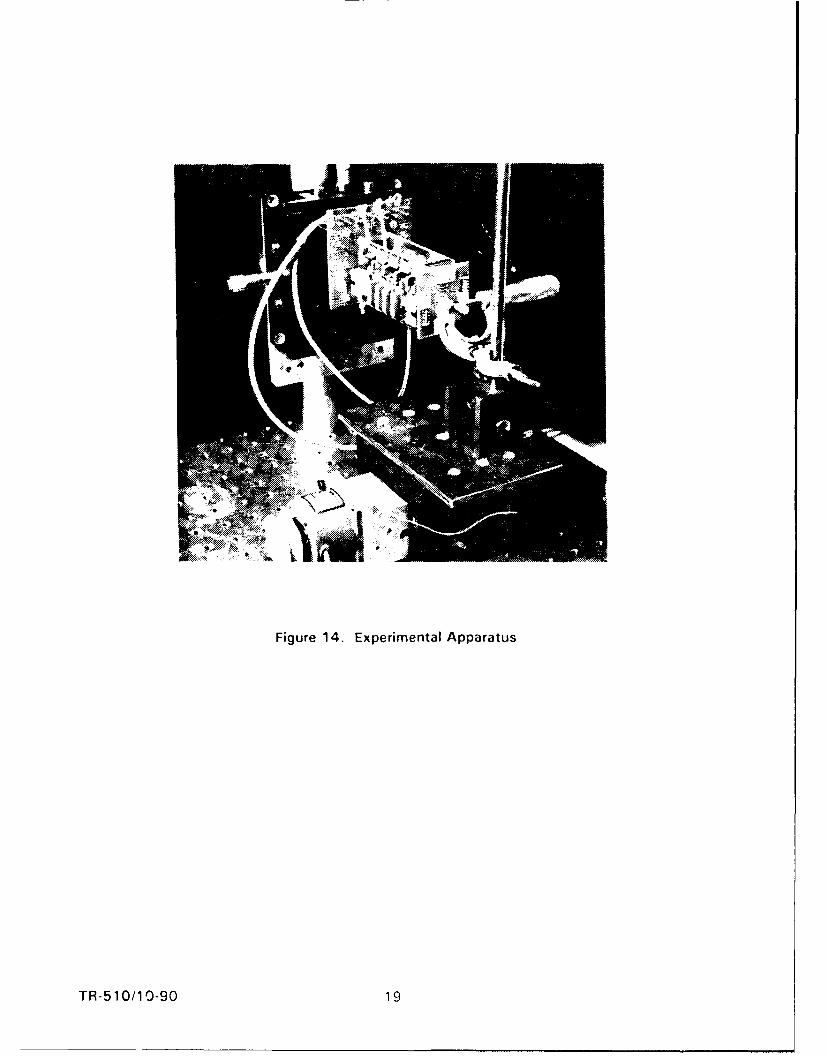
Experimental Arrangement
The experimental apparatus was assembled as shown in the photograph in Figure 14. Forthe calibration and stability measurements, the probe assembly was positioned betweenthe faces of a precision caliper micrometer as shown. The caliper diameter was adjustedto yield signals that were optimum for digitization (approximately 0.2470 inch for thefeasibility experiment device tested). The appropriate measurements were made bytranslating the caliper relative to the probe using a precision computer-controlledtranslation stage.
No special account was taken of the thermal environment for these feasibility experiments.However, the apparatus was placed in a cardboard enclosure to suppress thermaltransients that would affect the short-term diameter measurements.
TR-510/10-90 17
010
22
CE
0~
00
o 0
3 3 N3
-
N
o 0
zN I
'K W Jw -
m -J
N1 N -N
TR-510/0N90 1
.ll ... .. .. ..
Figure 14. Experimental Apparatus
TR-510/10-90 19
VERIFICATION EXPERIMENTS
Calibration Range and Linearity
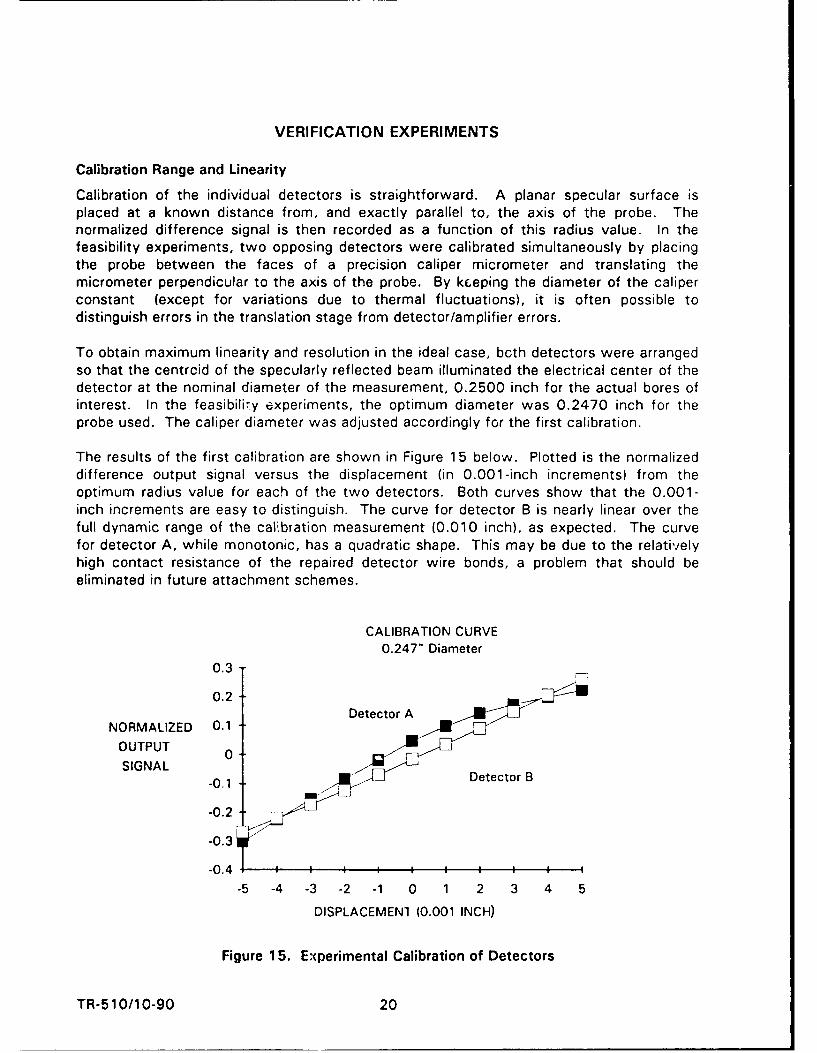
Calibration of the individual detectors is straightforward. A planar specular surface isplaced at a known distance from, and exactly parallel to, the axis of the probe. Thenormalized difference signal is then recorded as a function of this radius value. In thefeasibility experiments, two opposing detectors were calibrated simultaneously by placingthe probe between the faces of a precision caliper micrometer and translating themicrometer perpendicular to the axis of the probe. By kceping the diameter of the caliperconstant (except for variations due to thermal fluctuations), it is often possible todistinguish errors in the translation stage from detector/amplifier errors.
To obtain maximum linearity and resolution in the ideal case, bcth detectors were arrangedso that the centrcid of the specularly reflected beam illuminated the electrical center of thedetector at the nominal diameter of the measurement, 0.2500 inch for the actual bores ofinterest. In the feasibility experiments, the optimum diameter was 0.2470 inch for theprobe used. The caliper diameter was adjusted accordingly for the first calibration.
The results of the first calibration are shown in Figure 15 below. Plotted is the normalizeddifference output signal versus the displacement (in 0.001-inch increments) from theoptimum radius value for each of the two detectors. Both curves show that the 0.001-inch increments are easy to distinguish. The curve for detector B is nearly linear over thefull dynamic range of the calibration measurement (0.010 inch), as expected. The curvefor detector A, while monotonic, has a quadratic shape. This may be due to the relativelyhigh contact resistance of the repaired detector wire bonds, a problem that should beeliminated in future attachment schemes.
CALIBRATION CURVE0.247" Diameter
0.3
0.2DetectorA
NORMALIZED 0.1 DetetorOUTPUT 0
-0.3
-0.4
-5 -4 -3 -2 -1 0 1 2 3 4 5
DISPLACEMEN1 (0.001 INCH)
Figure 15. Experimental Calibration of Detectors
TR-510/10-90 20
If each detector response (normalized difference signal) is linear and has the same slope,then in the easiest case (no ti!t or wedge) the diameter measurement is simply a matter ofadding Lfne two normalized difference signals and applying the calibration scale factor.Since the detector response function remains relatively stable for a specified temperature,a periodic check on a reference diameter will ensure the accuracy of the measurementover the full measurement range of the probe. In the real world, however, nothing can berelied upon to be that simple, and a computer-assisted look-up table or function generatorwill likely be used to translate the output signals to real diameters.
Experimental Measurement Resolution
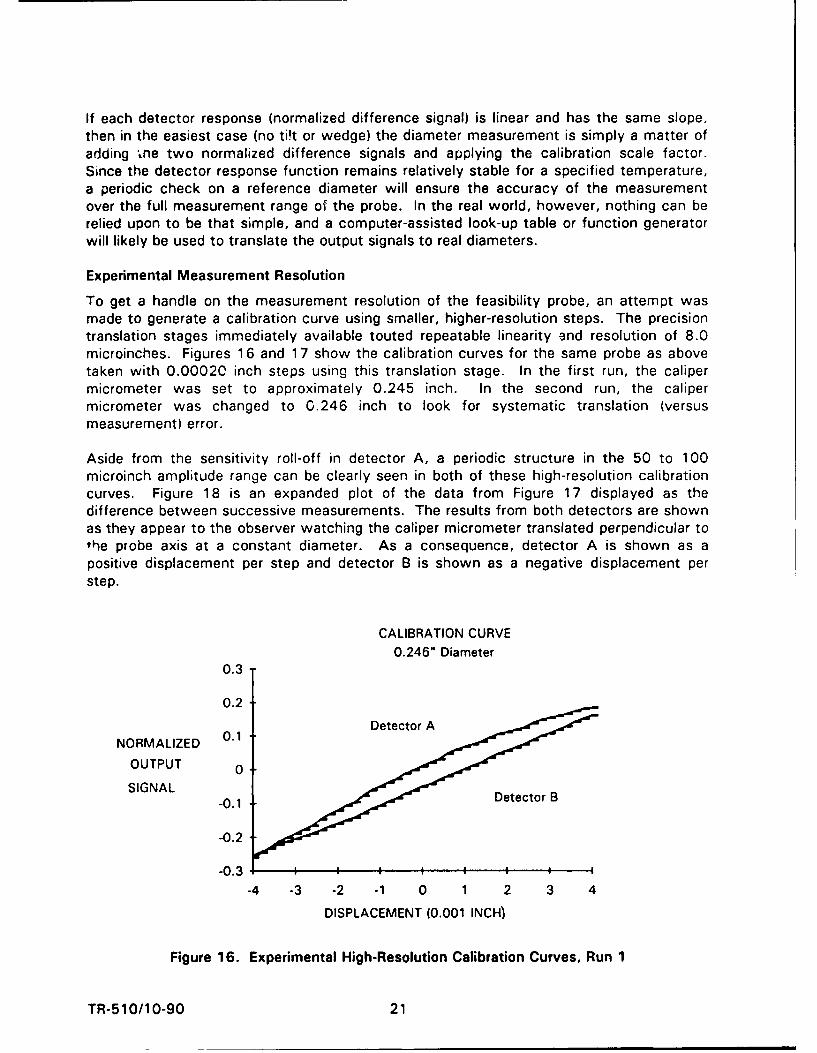
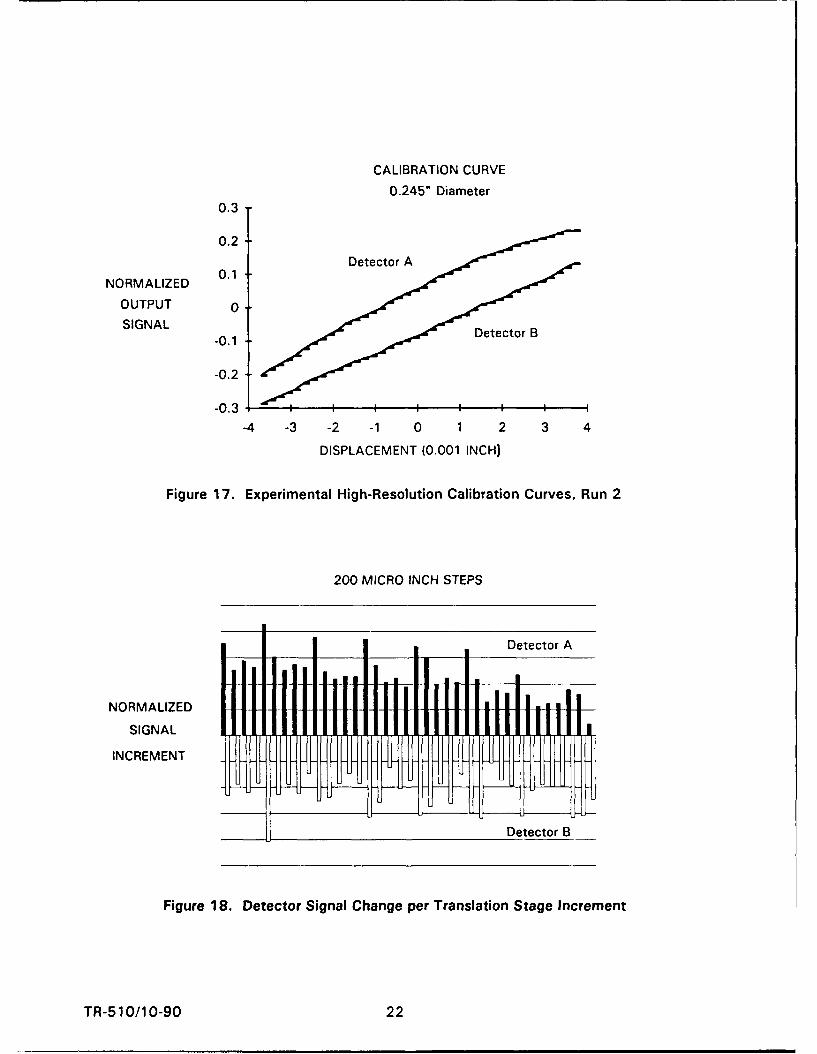
To get a handle on the measurement resolution of the feasibility probe, an attempt wasmade to generate a calibration curve using smaller, higher-resolution steps. The precisiontranslation stages immediately available touted repeatable linearity -nd resolution of 8.0microinches. Figures 16 and 17 show the calibration curves for the same probe as abovetaken with 0.00020 inch steps using this translation stage. In the first run, the calipermicrometer was set to approximately 0.245 inch. In the second run, the calipermicrometer was changed to 0.246 inch to look for systematic translation (versusmeasurement) error.
Aside from the sensitivity roll-off in detector A, a periodic structure in the 50 to 100microinch amplitude range can be clearly seen in both of these high-resolution calibrationcurves. Figure 18 is an expanded plot of the data from Figure 17 displayed as thedifference between successive measurements. The results from both detectors are shownas they appear to the observer watching the caliper micrometer translated perpendicular tothe probe axis at a constant diameter. As a consequence, detector A is shown as apositive displacement per step and detector B is shown as a negative displacement perstep.
CALIBRATION CURVE0.246" Diameter
0.3
0.2
NORMALIZED 0.1
OUTPUT 0SIGNAL -0.1 Detector B
-0.2
-0.3
-4 -3 -2 -1 0 1 2 3 4
DISPLACEMENT (0.001 INCH)
Figure 16. Experimental High-Resolution Calibration Curves, Run 1
TR-510/10-90 21
CALIBRATION CURVE
0.245" Diameter0.3
0.2
NORMALIZED 0.1
OUTPUT 0
SIGNAL
-0.1
-0.3
-4 -3 -2 -1 0 1 2 3 4
DISPLACEMENT (0.001 INCH)
Figure 17. Experimental High-Resolution Calibration Curves, Run 2
200 MICRO INCH STEPS
ittt ...I, . Detector ANORMALIZED
SIGNAL
INCREMENT
Detector B
Figure 18. Detector Signal Change per Translation Stage Increment
TR-510/10-90 22
The conclusion drawn from the above plot is that the translation stage, contrary tomanufacturers' literature, does not move in uniform step sizes. In fact, there appears tobe a harmonic in the screw thread that results in a periodic component to the translationlinearity approximately every 0.001 inch. Therefore, this stage cannot be used for thefine-step checking as originally hoped.
As an interim measure, a flat-faced piezoelectric translator with a full dynamic range of 10microinches was employed to verify that the measurement resolution achievable was atleast equivalent to the switching resolution achievable with the 12-bit A/D convertersbeing used for the feasibility experiments. The experiment confirmed that an 8-microinchstep was easily detectable at several discrete radii.
As can be seen from the above charts, the experimental sensitivity of the feasibilityexperiments is approximately 55 millivolts/mil or equivalently 55 microvolts/microinch.Thus, even 1-microinch-resolution goals are well above the expected rms detector/amplifiernoise floor of 7 microvolts. Barring some type of unforeseen position granularity on thedetector, measurement sensitivities in the 0.5 microinch range should be possible.Unfortunately, this assumption could not be verified during the feasibility experiments forlack of an appropriate translation platform and a high enough resolution A/D. The fixturingand A/D conversion must be refined in the next phase of work.
Repeatability and Stability of the Measurement
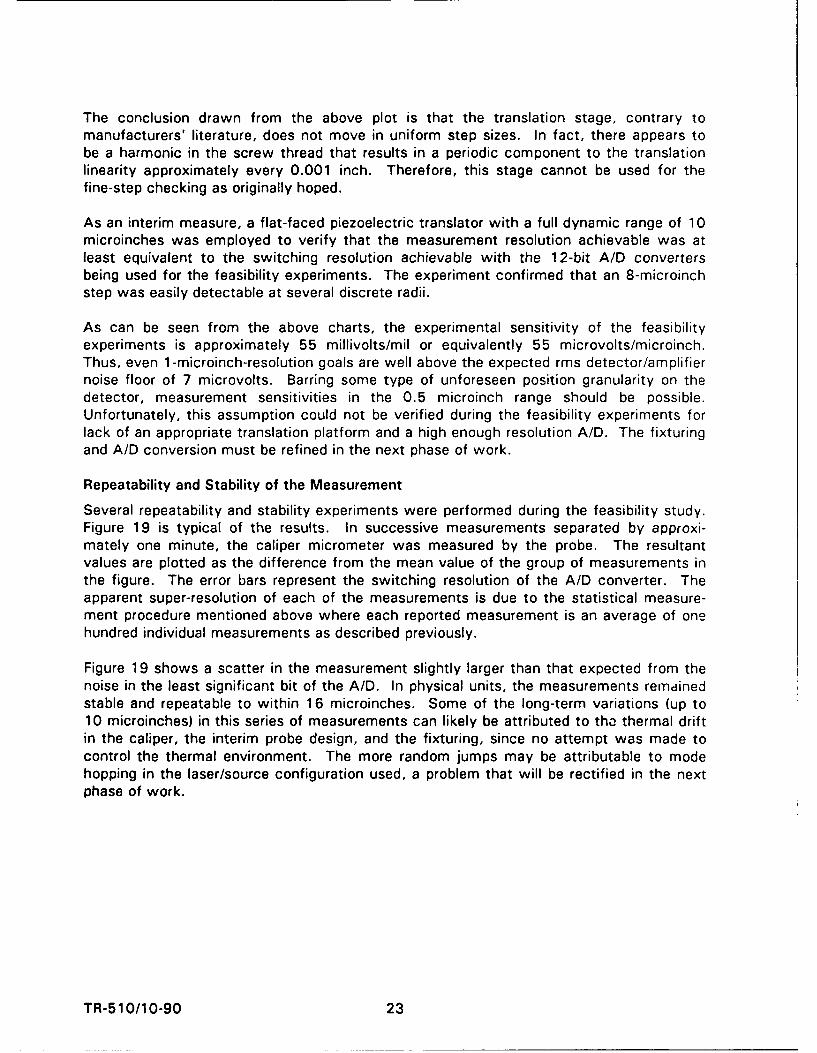
Several repeatability and stability experiments were performed during the feasibility study.Figure 19 is typical of the results. In successive measurements separated by approxi-mately one minute, the caliper micrometer was measured by the probe. The resultantvalues are plotted as the difference from the mean value of the group of measurements inthe figure. The error bars represent the switching resolution of the A/D converter. Theapparent super-resolution of each of the measurements is due to the statistical measure-ment procedure mentioned above where each reported measurement is an average of onehundred individual measurements as described previously.
Figure 19 shows a scatter in the measurement slightly larger than that expected from thenoise in the least significant bit of the A/D. In physical units, the measurements remdinedstable and repeatable to within 16 microinches. Some of the long-term variations (up to10 microinches) in this series of measurements can likely be attributed to tha thermal driftin the caliper, the interim probe design, and the fixturing, since no attempt was made tocontrol the thermal environment. The more random jumps may be attributable to modehopping in the laser/source configuration used, a problem that will be rectified in the nextphase of work.
TR-510/10-90 23
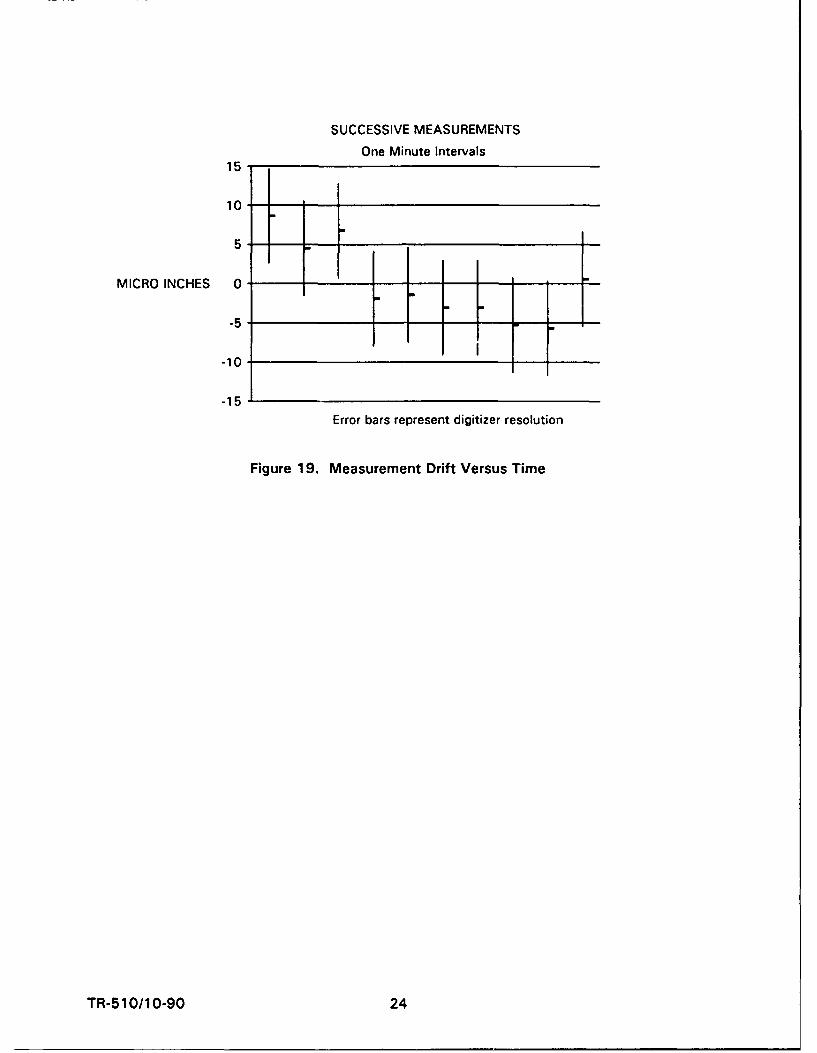
SUCCESSIVE MEASUREMENTS
One Minute Intervals15
10
-5
10
-15Error bars represent digitizer resolution
Figure 19. Measurement Drift Versus Time
TR-51 0/10-90 24

CONCLUSIONS AND RECOMMENDATIONS
Phase I Feasibility Study Conclusions
The Phase I feasibility study showed that optical triangulation profilometry can besuccessfully adapted to the measurement of small-diameter bores. The accuraciesdemonstrated in the feasibility experiments exceeded 20 microinches. A fundamental erroranalysis showed that the accuracies can be extended to better than 1 microinch witnminor changes in the probe design and digitizer resolution. Based on the experimentalresults of the feasibility study, it is easy to visualize a commercial version of this probethat will have the advantages of relatively low cost, high accuracy, and ease of use andthat will meet not only the measurement needs of the Air Force gyro bearing program, butalso a wide range of precision commercial applications.
Phase II Design Recommendations
In the next phase of development, several design improvements are suggested to improvethe performance, ruggedness, and cost effectiveness of the small bore probe. These aredescribed briefly below.
Probe Design
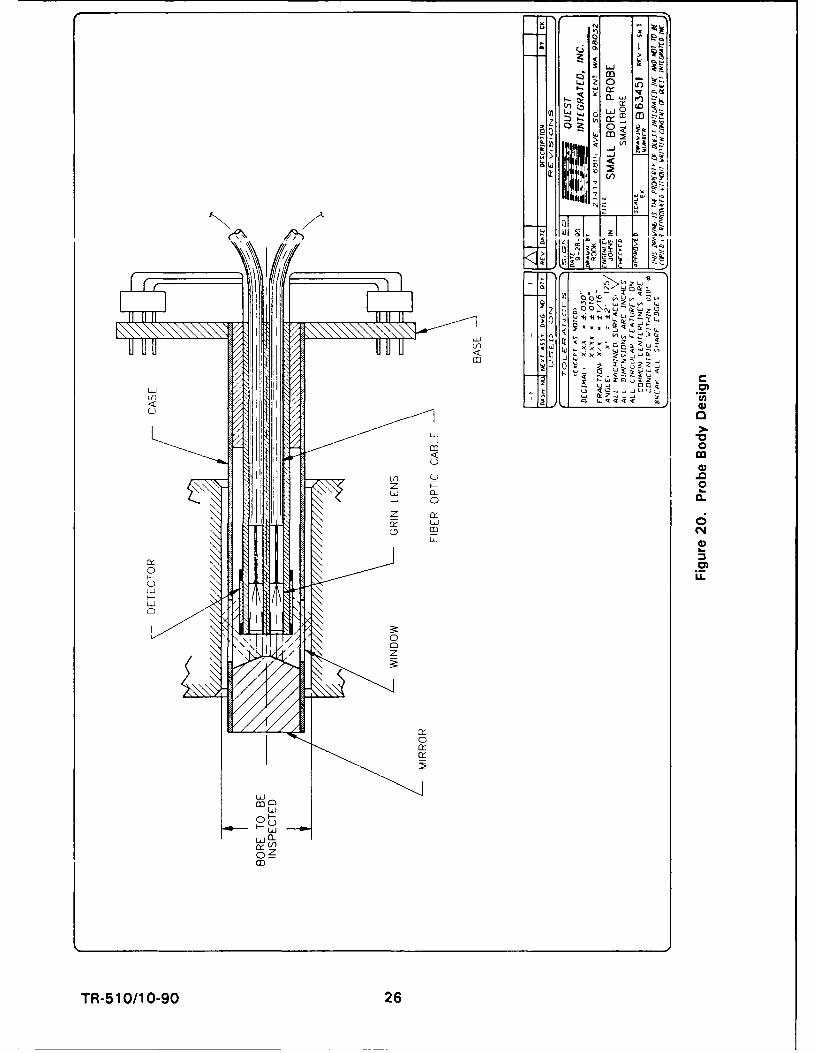
To increase the thermal and mechanical stability of the optical components, it isrecommended that all the components used in the probe head be constructed from ULEglass. The concept outlined in Figure 20 will assure a rigid optical path with high thermalimmunity. In the recommended design, the substrate that holds the detectors and theGRIN lenses is connected to the four-faceted mirror via an external, windowed supporttube. The tube provides mechanical protection for the delicate detector bonds and keepsthe mirror in a fixed position with respect to the detectors with minimal thermal expansioneffects. A four-hole design is recommended for the probe substrate. This design willsimplify the assembly and alignment of the optics, and it will assure greater mechanicalstability for the optical path.
The use of 0.5-mm quarter-pitch GRIN lenses is recommended rather than the 1.0-mmlenses used in the feasibility experiments. These smaller lenses will form a smaller-diameter beam, which can be more easily contained on the detectors without complexfixturing during initial alignment of the optical path.
Short single-mode fibers are recommended to replace the long multimode fibers used in thefeasibility experiments. If these fibers are mounted in a semirigid environment, thenposition noise due to of the fiber and mode hopping should be eliminated. It is desirablethat source lasers be mounted as close as possible to the probe body to facilitate acompact package for the entire active portion of the probe.
Mounting of the preamplifiers in close proximity to the detectors with adequate groundplane shielding is recommended to reduce the effects of EMI pickup. The annoyingpresence of nearby radio stations in ground loop problems was an issue in the feasibilityexperiments.
TR-510/10-90 25
0
m M
7 -~
CL
ii- - m 4
'nt
LLJ u0
/z
Li~
, i1m
<k
LLJU b
L'i
C0)
090m0
TR-510/0-90 2
Support Electronics and Software
One of the principal difficulties with the feasibility experiments was the lack of digitizerresolution, which prevented demonstration of the theoretical sub-microinch resolutioncapabilities of the system. The use of a 16-bit A/D converter is recommended to replacethe 1 2-bit converter used in the feasibility tests.
Simultaneous eight-channel data acquisition is recommended in order to measure twodiameters simultaneously. Only four channels (one diameter) were used in the feasibilityexperiments. Simultaneous measurements are required to reduce repeatability error due totransient mechanical instabilities in the probe and the fixturing for the measurement.
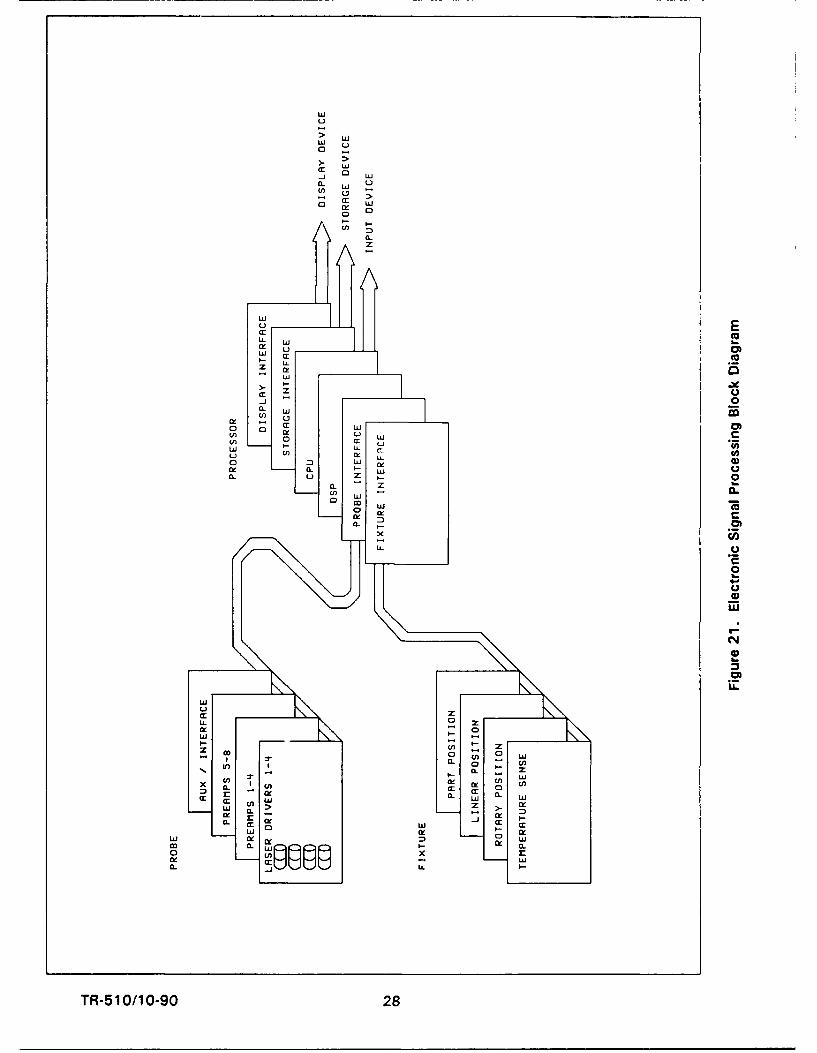
The recommended electronics package is relatively simple. A block diagram of the systemis shown in Figure 21. The detectors drive low-noise preamps as in the feasibilityexperiment. Each detector channel is digitized and read by an internal CPU along with theencoder positions for the translational and rotational degrees of freedom and the localtemperatures.
The system software should compute the normalized difference signal in real time andtranslate the signals to displacement values via look-up tables. The translational androtational degrees of freedom should also be monitored and the geometrical correctionfactors calculated by the CPU in real time. The true temperature-compensated diameter,circularity, taper, and cylindricity should be displayed at the completion of themeasurement sequence. Display options should include either fixed format numbers or agraphical format depending upon customer requirements and cost considerations.
It is recommended that the software support package also include automatic setup andcalibration, automatic measurement sequencing and data acquisition, and extensiveinternal error checking with periodic absolute reference checking. Foremost, the softwareshould provide a simple, easy-to-use operator interface to the complex measurementprocess.
Mechanical Configuration
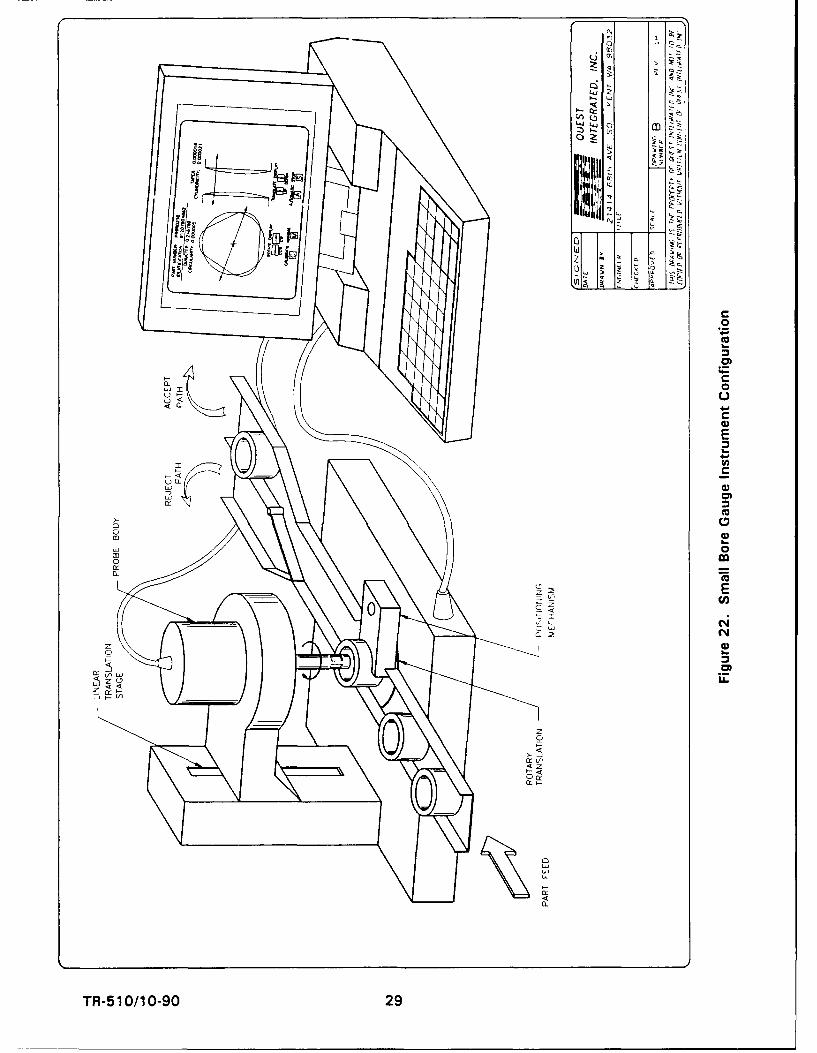
The mechanical fixturing and associated electronic support hardware for the measurementsystem are illustrated in Figure 22. Precision mechanical fixturing for at least onerotational and one translational degree of freedom as indicated in the figure isrecommended. By fixturing the probe precisely on the axis of rotation of the cylindricalbore, the specular reflectance errors, eccentricity errors, and taper errors can be measuredand decoupled. Translation along the axis of the bore will allow measurement of andcompensation for bore taper.
Potential Applications
While development costs on this precision measurement tool are significant, manufacturingcosts are expected to be low. It is also likely that heads for different diameters will beinterchangeable, which would further reduce costs. The significance of being able toobtain microinch-accuracy measurements easily and at moderate costs cannot be ignored.Such a tool will have wide applicability in all forms of tubing and internal bore measure-ments.
TR-510/10-90 27
w
w0
-1 0 w
0 crww0
0
C/)0-
U. E
wo-
z a:-j Ac0
0~3
UX
a:U)
V) CYO
u U) m0 0
CL u z
0. 0
LU
m 0,w -N *s
a. zOD 0 0mmmI _ C
rR-5 10109 28
CS
0 Z.
L.4j~E
CC
C)C
00
z E-
ca)
00
TR-510/0-90 2
DISTRIBUTION LIST
Addressee No. Copies
BMO/SDD 2/0NAFB, CA 92409-6468
BMOIMYCC LTONAFB, CA 92409-6468
BMOISDC 2/0NAFB, CA 92409-6468
TRW/EDC 1/0P.O. Box 1310San Bernardino, CA 92402
TR-5 10/10-90 30