bnp and admission glucose as in-hospital mortality predictors in
TRANSCRIPT
The Scientific World JournalVolume 2012, Article ID 397915, 7 pagesdoi:10.1100/2012/397915
The cientificWorldJOURNAL
Clinical Study
BNP and Admission Glucose as In-Hospital Mortality Predictorsin Non-ST Elevation Myocardial Infarction
Julio Yoshio Takada,1 Rogerio Bicudo Ramos,1 Solange Desiree Avakian,1
Soane Mota dos Santos,2 Jose Antonio Franchini Ramires,1 and Antonio de Padua Mansur1
1 Heart Institute (InCor), University of Sao Paulo Medical School, Avenue Eneas de Carvalho de Aguiar 44,05403-000 Sao Paulo, SP, Brazil
2 Institute of Mathematics and Statistics, University of Sao Paulo, R. do Matao 1010, 05508-090 Sao Paulo, SP, Brazil
Correspondence should be addressed to Julio Yoshio Takada, [email protected]
Received 10 October 2011; Accepted 21 November 2011
Academic Editors: D. Carrie and L. G. Graff
Copyright © 2012 Julio Yoshio Takada et al. This is an open access article distributed under the Creative Commons AttributionLicense, which permits unrestricted use, distribution, and reproduction in any medium, provided the original work is properlycited.
Objectives. Admission hyperglycemia and B-type natriuretic peptide (BNP) are associated with mortality in acute coronarysyndromes, but no study compares their prediction in-hospital death. Methods. Patients with non-ST-elevation myocardialinfarction (NSTEMI), in-hospital mortality and two-year mortality or readmission were compared for area under the curve(AUC), sensitivity (SEN), specificity (SPE), positive predictive value (PPV), negative predictive value (NPV), and accuracy (ACC)of glycemia and BNP. Results. Respectively, AUC, SEN, SPE, PPV, NPV, and ACC for prediction of in-hospital mortality were 0.815,71.4%, 84.3%, 26.3%, 97.4%, and 83.3% for glycemia = 200 mg/dL and 0.748, 71.4%, 68.5%, 15.2%, 96.8% and 68.7% for BNP =300 pg/mL. AUC of glycemia was similar to BNP (P = 0.411). In multivariate analysis we found glycemia ≥200mg/dL related toin-hospital death (P = 0.004). No difference was found in two-year mortality or readmission in BNP or hyperglycemic subgroups.Conclusion. Hyperglycemia was an independent risk factor for in-hospital mortality in NSTEMI and had a good ROC curve level.Hyperglycemia and BNP, although poor in-hospital predictors of unfavorable events, were independent risk factors for death orlength of stay >10 days. No relation was found between hyperglycemia or BNP and long-term events.
1. Introduction
In recent years, incorporation of new laboratory methodsin clinical practice has improved diagnosis and prognosticprediction of outcomes in acute coronary syndromes (ACS).Cardiac troponins, with high sensitivity and specificity fordiagnosing myocardial injury [1], and B type natriureticfactor (BNP), primarily used in acute decompensation ofheart failure but with prognostic significance in ACS [2], areuseful in the initial evaluation of patients with acute chestpain [3–5]. Glycemia, determined by using a simple, low-costlaboratory test, has been associated with a worse prognosis inACS patients, even in the absence of diabetes [6].
Studies have shown BNP as a prognostic factor for bothearly and late outcomes in non-ST elevation ACS, a pre-sumed reflection of left ventricular dysfunction [7]. Non-ST elevation myocardial infarction (NSTEMI) has lower in-hospital mortality than ST elevation myocardial infarction
has, but higher unadjusted events in years following hospi-talization [8]. So, we hypothesized that hyperglycemia andBNP could predict patients at risk for both in-hospital and2-year events.
2. Methods
2.1. Study Design and Population. Patients with ACS admit-ted consecutively between January 2005 and April 2006 toan urban academic cardiology emergency single center inSao Paulo, Brazil were prospectively evaluated with theirdata registered in the institution’s database. Baseline clinicaland admission laboratory characteristics, CAD risk factors,medicines used, in-hospital outcomes, angiography, andtreatments were observed. The Ethics Committee of thehospital approved this study. A total of 1304 ACS patientswere included, and a subgroup of 170 NSTEMI-only patientswith admission BNP were followed up for two years.

2 The Scientific World Journal
Inclusion criteria were ACS hospital admission, accordingto the international consensus definition [9], age olderthan 18 years, and willing to provide written informedconsent. Exclusion criteria were non-NSTEMI ACS andincomplete laboratory data. Completed data were availablefor 96 NSTEMI patients, and written informed consent wasobtained from all participants.
2.2. Definitions and Data Collection. Clinical outcomes weredefined as death, or death and prolonged length of stay (>10days; mean of length of stay). Length of stay was definedas an outcome, because 90% of patients at our emergencydepartment undergo angiographic study in 48 hours. Inthis setting, reinfarction or refractory angina are infrequentevents at hospitalization. Mean length of stay was 10.5 andmedian 3.8 days (range: 0.4 to 124.6), and follow-up meanwas 21.7 and median 23.2 months (range: 0.11 to 31.7),until September 2007. Long-term outcomes included deathor death and hospital readmission for all causes.
Blood samples were collected at admission to the emer-gency department. For BNP determination, a specific kitfor the ADVIA Centaur analyzer (Bayer Health Care Diag-nostics, Tarrytown, NY) was used, with detection limitof 2 pg/mL and range from 2 to 5000 pg/mL. The intra-and inter-assay coefficients of variation ranged from 2.1to 4.7% for concentrations between 29 and 1700 pg/mL.Echocardiographic data were collected in second day ofadmission and ejection fraction was obtained. We calculatedthe best point of BNP in receiver operating characteristic(ROC) curve equal to 300 pg/mL, the highest point ofYouden’s Index [10]. We selected the level of hyperglycemiaabove 200 mg/dL to separate the highest stratum seen inthe literature [11] for admission nonfasting blood glucose.Previous use of medication were assessed.
2.3. Statistical Analysis. All data are described as rates andfrequencies or means with standard deviations, as appropri-ate. Differences in the distribution of selected characteristicsbetween patient groups were examined using the chi-squaretest and Fisher’s exact test for categorical variables. The anal-ysis was performed using the Student’s t-test for normallydistributed continuous variables and the Mann-Whitney andKruskal-Wallis tests for nonparametric variables. Pearsoncorrelation coefficients were used to study the correlations.We built an adjusted model in multivariate regression toanalyze the independent variables associated with in-hospitaldeath or combined in-hospital death and length of stay > 10days: age, hypertension, smoking, diabetes, blood glucose <or ≥ 200 mg/dL, BNP < or ≥ 300 pg/mL, sex, and serumcreatinine. The ROC curve was used to determine the areaunder the curve (AUC) of the C statistic. Cox regressionmodel was used to evaluate independent prognostic factorsof mortality and hospital readmission for all causes in thefollow-up period. Two-sided P values < 0.05 were consideredstatistically significant. All statistical analyses were performedusing SAS software version 9.2 for Windows. To obtainYouden’s Index, AUC, sensitivity (SENS), specificity (SPEC),positive predictive value (PPV), negative predictive value
(NPV), and accuracy (ACCU), we used a macro of the SASsoftware [12].
3. Results
3.1. Admission Blood Glucose Endpoints. Table 1 presentsclinical and demographic patient characteristics, groupedby blood glucose < or ≥ 200 mg/dL. Univariate analysisshowed a predominance of women (73.7% versus 23.4%; P <0.001), lower levels of chest pain (68.4% versus 92.2%; P =0.005), serum hemoglobin (11.8 versus 13.9 g/dL; P < 0.001),coronary angiographic study (73.7% versus 93.5%; P =0.011), and higher levels of diabetes (94.7% versus 38.9%;P < 0.001), heart rate (102.7 versus 77.3 beats/minute; P <0.001), BNP (660.8 versus 283.7 pg/mL; P < 0.001), whiteblood cell count (11,722.2 versus 9,437.3 cells/mm3; P =0.010), platelet count (294,889.0 versus 221,118.0 cells/mm3;P < 0.001), serum urea (65.5 versus 49.5 mg/dL; P = 0.033),serum creatinine (1.81 versus 1.20 mg/dL; P = 0.016), Killippresentation ≥ 2 (47.4% versus 13.0%; P < 0.001), length ofstay (22.8 versus 7.4 days; P < 0.001), in-hospital mortality(26.3% versus 2.6%; P < 0.001), and combined prolongedlength of stay or death (63.2% versus 16.9%; P < 0.001) inthe ≥200 mg/dL blood glucose group.
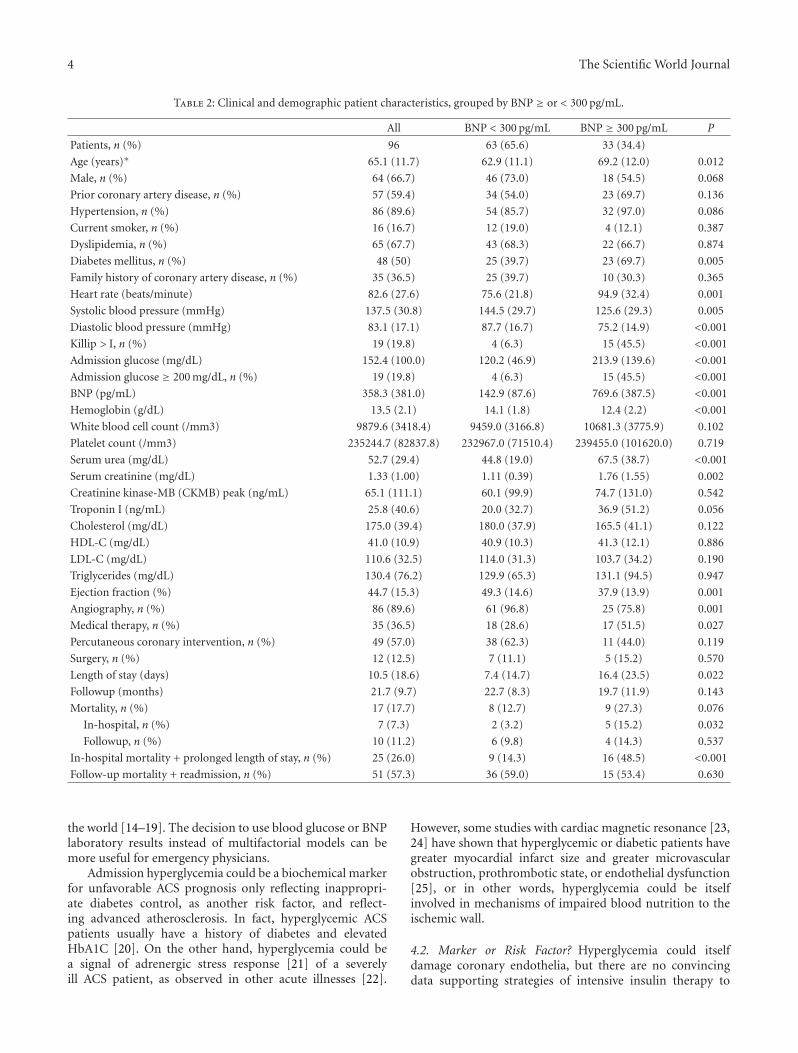
3.2. BNP Endpoints. Table 2 presents clinical and demo-graphic patient characteristics, but grouped by BNP < or≥ 300 pg/mL. The BNP ≥ 300 pg/mL group were older(69.2 versus 62.9 years; P = 0.012) and had lower levelsof chest pain (66.7% versus 98.4%; P < 0.001), systolicblood pressure (125.6 versus 144.5 mmHg; P = 0.005),diastolic blood pressure (75.2 versus 87.7 mmHg; P <0.001), hemoglobin (12.4 versus 14.1 g/dL; P < 0.001),ejection fraction (37.9% versus 49.3%; P = 0.001), coronaryangiography study (75.8% versus 96.8%; P = 0.001), andhigher levels of diabetes (69.7% versus 39.7%; P = 0.005),heart rate (94.9 versus 75.6 beats/minute; P = 0.001), serumurea (67.5 versus 44.8 mg/dL; P < 0.001), serum creatinine(1.76 versus 1.11 mg/dL; P = 0.002), blood glucose (213.9versus 120.2 mg/dL; P < 0.001), Killip presentation ≥ 2(45.5% versus 6.3%; P < 0.001), medical therapy alone(51.5% versus 28.6%; P = 0.027), length of stay (16.4 versus7.4 days; P = 0.022), in-hospital mortality (15.2% versus3.2%; P = 0.032), and combined prolonged length of stayor death (48.5% versus 14.3%; P < 0.001). No difference wasfound in two-year mortality or readmission for all causes inBNP or hyperglycemic subgroups.
3.3. Combination of Laboratory Factors. In multivariate logis-tic analysis of the in-hospital period, the adjusted modelshowed only hyperglycemia ≥ 200 mg/dL as an independentpredictor of mortality (OR = 13.036, IC 95% 2.296–74.022;P < 0.001). Hyperglycemia ≥ 200 mg/dL (OR = 4.588;IC 95% 1.348–15.610; P < 0.001) and BNP ≥ 300 pg/mL(OR = 3.366, IC 95% 1.108–10.223; P = 0.027) wereindependent predictors of length of stay longer than 10 daysor death. Table 3 summarizes AUC, sensitivity, specificity,positive predictive value, negative predictive value, and

The Scientific World Journal 3
Table 1: Clinical and demographic patient characteristics, grouped by blood glucose ≥ or < 200 mg/dL.
All Glucose < 200 mg/dL Glucose ≥ 200 mg/dL P
Patients, n (%) 96 77 (80.2) 19 (19.8)
Age (years)∗ 65.1 (11.7) 64.9 (12.0) 65.7 (10.7) 0.791
Male, n (%) 64 (66.7) 59 (76.6) 5 (26.3) <0.001
Prior coronary artery disease, n (%) 57 (59.4) 43 (55.8) 14 (73.7) 0.156
Hypertension, n (%) 86 (89.6) 67 (87.0) 19 (100) 0.097
Current smoker, n (%) 16 (16.7) 13 (16.7) 3 (15.8) 0.909
Dyslipidemia, n (%) 65 (67.7) 53 (68.8) 12 (63.2) 0.636
Diabetes mellitus, n (%) 48 (50) 30 (38.9) 18 (94.7) <0.001
Family history of coronary artery disease, n (%) 35 (36.5) 29 (37.7) 6 (31.6) 0.622
Heart rate (beats/minute) 82.6 (27.6) 77.3 (71.9) 102.7 (86.4) <0.001
Systolic blood pressure (mmHg) 137.5 (30.8) 140.2 (29.6) 127.8 (33.7) 0.121
Diastolic blood pressure (mmHg) 83.1 (17.1) 84.8 (16.6) 76.8 (17.6) 0.072
Killip > I, n (%) 19 (19.8) 10 (13.0) 9 (47.4) <0.001
Admission glucose (mg/dL) 152.4 (100.0) 113.1 (31.8) 311.9 (122.8) <0.001
BNP (pg/mL) 358.3 (381.0) 283.7 (339.3) 660.8 (399.4) <0.001
Hemoglobin (g/dL) 13.5 (2.1) 13.9 (1.9) 11.8 (2.2) <0.001
White blood cell count (/mm3) 9879.6 (3418.4) 9437.3 (3181.0) 11722.2 (3838.3) 0.010
Platelet count (/mm3) 235244.7 (82837.8) 221118.0 (73987.4) 294889.0 (93436.3) <0.001
Serum urea (mg/dL) 52.7 (29.4) 49.5 (25.9) 65.5 (38.6) 0.033
Serum creatinine (mg/dL) 1.33 (1.00) 1.20 (0.48) 1.81 (1.98) 0.016
Creatinine kinase-MB (CKMB) peak (ng/mL) 65.1 (111.1) 73.2 (119.5) 32.5 (58.7) 0.154
Troponin I (ng/mL) 25.8 (40.6) 26.5 (41.9) 23.1 (35.6) 0.741
Cholesterol (mg/dL) 175.0 (39.4) 174.7 (39.7) 176.4 (39.3) 0.892
HDL-C (mg/dL) 41.0 (10.9) 40.9 (10.9) 41.5 (11.2) 0.872
LDL-C (mg/dL) 110.6 (32.5) 110.0 (32.9) 113.4 (321.2) 0.732
Triglycerides (mg/dL) 130.4 (76.2) 129.2 (72.4) 136.0 (95.9) 0.772
Ejection fraction (%) 44.7 (15.3) 46.4 (14.3) 39.4 (17.4) 0.083
Angiography, n (%) 86 (89.6) 72 (93.5) 14 (73.7) 0.011
Medical therapy, n (%) 35 (36.5) 26 (33.8) 9 (47.4) 0.270
Percutaneous coronary intervention, n (%) 49 (57.0) 43 (59.7) 6 (42.9) 0.243
Surgery, n (%) 12 (12.5) 8 (10.4) 4 (21.0) 0.208
Length of stay (days) 10.5 (18.6) 7.4 (12.9) 22.8 (30.2) <0.001
Followup (months) 21.7 (9.7) 22.5 (8.7) 18.2 (12.8) 0.084
Mortality, n (%) 17 (17.7) 11 (14.3) 6 (31.6) 0.077
In-hospital, n (%) 7 (7.3) 2 (2.6) 5 (26.3) <0.001
Followup, n (%) 10 (11.2) 9 (12.0) 1 (7.1) 0.597
In-hospital mortality + prolonged length of stay, n (%) 25 (26.0) 13 (16.9) 12 (63.2) <0.001
Follow-up mortality + readmission, n (%) 51 (57.3) 43 (57.3) 8 (57.1) 0.989
accuracy of blood glucose and BNP for in-hospital deathprediction, and Figure 1 shows ROC curve comparisonof only blood glucose and BNP. Although blood glucosehad been slightly better, there was no difference betweenadmission glucose and BNP in in-hospital NSTEMI deathprediction. In long-term followup, Cox regression (Figure 2)failed to show any independent predictors of mortality orcombined hospital readmission for all causes or death. Weanalyzed the correlation between blood glucose and BNP, asshown in Table 4. There is a significant correlation betweenglycemia and BNP (Pearson correlation coefficient (PCC) =0.38; P < 0.001), glycemia and hemoglobin (PCC = 0.41;
P < 0.001), BNP and creatinine (PCC = 0.29; P = 0.004),and BNP and hemoglobin (PCC = 0.34; P < 0.001).
4. Discussion
4.1. Hyperglycemia and BNP Mortality of ACS. Hyper-glycemia is a factor long associated with ACS mortality [13],and its capacity for predicting a worse prognosis in NSTEMI,in our study, is at least comparable to that of BNP or betterif we consider only death as the outcome. Several studiesaccessing BNP and admission glucose separately in ACSpatients showed in-hospital and long-term prognosis around
4 The Scientific World Journal
Table 2: Clinical and demographic patient characteristics, grouped by BNP ≥ or < 300 pg/mL.
All BNP < 300 pg/mL BNP ≥ 300 pg/mL P
Patients, n (%) 96 63 (65.6) 33 (34.4)
Age (years)∗ 65.1 (11.7) 62.9 (11.1) 69.2 (12.0) 0.012
Male, n (%) 64 (66.7) 46 (73.0) 18 (54.5) 0.068
Prior coronary artery disease, n (%) 57 (59.4) 34 (54.0) 23 (69.7) 0.136
Hypertension, n (%) 86 (89.6) 54 (85.7) 32 (97.0) 0.086
Current smoker, n (%) 16 (16.7) 12 (19.0) 4 (12.1) 0.387
Dyslipidemia, n (%) 65 (67.7) 43 (68.3) 22 (66.7) 0.874
Diabetes mellitus, n (%) 48 (50) 25 (39.7) 23 (69.7) 0.005
Family history of coronary artery disease, n (%) 35 (36.5) 25 (39.7) 10 (30.3) 0.365
Heart rate (beats/minute) 82.6 (27.6) 75.6 (21.8) 94.9 (32.4) 0.001
Systolic blood pressure (mmHg) 137.5 (30.8) 144.5 (29.7) 125.6 (29.3) 0.005
Diastolic blood pressure (mmHg) 83.1 (17.1) 87.7 (16.7) 75.2 (14.9) <0.001
Killip > I, n (%) 19 (19.8) 4 (6.3) 15 (45.5) <0.001
Admission glucose (mg/dL) 152.4 (100.0) 120.2 (46.9) 213.9 (139.6) <0.001
Admission glucose ≥ 200 mg/dL, n (%) 19 (19.8) 4 (6.3) 15 (45.5) <0.001
BNP (pg/mL) 358.3 (381.0) 142.9 (87.6) 769.6 (387.5) <0.001
Hemoglobin (g/dL) 13.5 (2.1) 14.1 (1.8) 12.4 (2.2) <0.001
White blood cell count (/mm3) 9879.6 (3418.4) 9459.0 (3166.8) 10681.3 (3775.9) 0.102
Platelet count (/mm3) 235244.7 (82837.8) 232967.0 (71510.4) 239455.0 (101620.0) 0.719
Serum urea (mg/dL) 52.7 (29.4) 44.8 (19.0) 67.5 (38.7) <0.001
Serum creatinine (mg/dL) 1.33 (1.00) 1.11 (0.39) 1.76 (1.55) 0.002
Creatinine kinase-MB (CKMB) peak (ng/mL) 65.1 (111.1) 60.1 (99.9) 74.7 (131.0) 0.542
Troponin I (ng/mL) 25.8 (40.6) 20.0 (32.7) 36.9 (51.2) 0.056
Cholesterol (mg/dL) 175.0 (39.4) 180.0 (37.9) 165.5 (41.1) 0.122
HDL-C (mg/dL) 41.0 (10.9) 40.9 (10.3) 41.3 (12.1) 0.886
LDL-C (mg/dL) 110.6 (32.5) 114.0 (31.3) 103.7 (34.2) 0.190
Triglycerides (mg/dL) 130.4 (76.2) 129.9 (65.3) 131.1 (94.5) 0.947
Ejection fraction (%) 44.7 (15.3) 49.3 (14.6) 37.9 (13.9) 0.001
Angiography, n (%) 86 (89.6) 61 (96.8) 25 (75.8) 0.001
Medical therapy, n (%) 35 (36.5) 18 (28.6) 17 (51.5) 0.027
Percutaneous coronary intervention, n (%) 49 (57.0) 38 (62.3) 11 (44.0) 0.119
Surgery, n (%) 12 (12.5) 7 (11.1) 5 (15.2) 0.570
Length of stay (days) 10.5 (18.6) 7.4 (14.7) 16.4 (23.5) 0.022
Followup (months) 21.7 (9.7) 22.7 (8.3) 19.7 (11.9) 0.143
Mortality, n (%) 17 (17.7) 8 (12.7) 9 (27.3) 0.076
In-hospital, n (%) 7 (7.3) 2 (3.2) 5 (15.2) 0.032
Followup, n (%) 10 (11.2) 6 (9.8) 4 (14.3) 0.537
In-hospital mortality + prolonged length of stay, n (%) 25 (26.0) 9 (14.3) 16 (48.5) <0.001
Follow-up mortality + readmission, n (%) 51 (57.3) 36 (59.0) 15 (53.4) 0.630
the world [14–19]. The decision to use blood glucose or BNPlaboratory results instead of multifactorial models can bemore useful for emergency physicians.
Admission hyperglycemia could be a biochemical markerfor unfavorable ACS prognosis only reflecting inappropri-ate diabetes control, as another risk factor, and reflect-ing advanced atherosclerosis. In fact, hyperglycemic ACSpatients usually have a history of diabetes and elevatedHbA1C [20]. On the other hand, hyperglycemia could bea signal of adrenergic stress response [21] of a severelyill ACS patient, as observed in other acute illnesses [22].
However, some studies with cardiac magnetic resonance [23,24] have shown that hyperglycemic or diabetic patients havegreater myocardial infarct size and greater microvascularobstruction, prothrombotic state, or endothelial dysfunction[25], or in other words, hyperglycemia could be itselfinvolved in mechanisms of impaired blood nutrition to theischemic wall.
4.2. Marker or Risk Factor? Hyperglycemia could itselfdamage coronary endothelia, but there are no convincingdata supporting strategies of intensive insulin therapy to

The Scientific World Journal 5
Table 3: Comparison of BNP and blood glucose in outcome predictions. Area under the curve, sensitivity, specificity, positive predictivevalue, negative predictive value, and accuracy.
Biochemical factor Point AUC∗ Sensitivity(%)
Specificity(%)
PPV (%)∗ NPV (%)∗Accuracy
(%)P†
In-hospital mortality 0.411
Glucose (mg/dL) 200 0.819 71.4 84.3 26.3 97.4 83.3
BNP (pg/mL) 300 0.748 71.4 68.5 15.2 96.8 68.7
Combined length of stay≥ 10 days or in-hospital mortality 0.339
Glucose (mg/dL) 200 0.697 48.0 90.1 63.2 83.1 79.2
BNP (pg/mL) 300 0.760 64.0 76.1 48.5 85.7 72.9
Combined hospital readmission or mortality 0.343
Glucose (mg/dL) 200 0.524 15.7 84.3 42.9 57.3 55.1
BNP (pg/mL) 300 0.4631 34.2 70.6 46.4 59 55.1∗
AUC: area under the curve; PPV: positive predictive value; NPV: negative predictive value; †comparison AUC admission blood glucose versus BNP.
0
0.25
0.5
0.75
1
0 0.25 0.5 0.75 1
ROC curves for comparisons
Sen
siti
vity
1-specificity
BNP (0.748)Glucose (0.8154)
ROC curve (area)
Figure 1: Comparison of glucose versus BNP ROC curve.
control hyperglycemia in critically ill or myocardial infarctedpatients that could reverse the increased mortality, mostprobably due to hypoglycemic risk [26], another greatmortality risk factor in the hospital setting. In this context,both blood glucose and BNP are better as prognosticmarkers in ACS patients. For example, elevated BNP canpredict anterior wall ischemic localization at angiography inNSTEMI [27].
In our study, BNP and blood glucose were better mark-ers of in-hospital outcomes. Admission hyperglycemia isassociated with long-term risk for ACS mortality [28],but this association is not homogeneous in different ACS
1
0.8
0.6
0.4
0.2
0
0 10 20 30
Followup (months)
Event-free survival curves according to BNP subgroups
Even
t-fr
ee s
urv
ival
(%
)
< 300 pg/mL≥ 300 pg/mL
BNPBNP
Figure 2: Adjusted two-year event-free survival, according to BNP< or ≥ 300 pg/mL.
Table 4: Correlations between blood glucose, BNP, hemoglobin,and creatinine.
Factor 1 Factor 2 P valuePearson Correlation
Coefficient
Glycemia BNP <0.001 0.381
Glycemia Creatinine 0.140 0.153
Glycemia Hemoglobin <0.001 0.413
BNP Creatinine 0.004 0.292
BNP Hemoglobin <0.001 −0.348
Hemoglobin Creatinine 0.008 −0.273
presentations [15], unstable angina, NSTEMI, or STEMI.Besides, mortality up to 1 year can be predicted both byadmission glucose and fasting blood glucose, but the betterpredictor of mortality for longer periods is fasting glucose[29].

6 The Scientific World Journal
Correlations between BNP, glycemia, hemoglobin, andcreatinine illustrated how measurement of one laboratoryelement can in fact assess other components of body home-ostasis, becoming more difficult to separate a few inde-pendent mortality risk factors in adjusted complex models.These factors may be not related in a particular patient, or allfactors could exist in consequence of a common combinationof diseases: obesity, hypertension and diabetes leading to kid-ney disease, coronary disease, heart failure, anemia, elevatedBNP.
In-hospital stay was defined by clinical criteria. More se-vere patient were related to in-hospital mortality or requiredmore time to be discharged from hospital. Hyperglycemiaand BNP are markers of this severity of illness.
4.3. ROC Curve. At a cutoff point of 200 mg/dL for bloodglucose and 300 pg/dL for BNP, ROC curve analysis showedmodest values of sensitivity and specificity, but a greatnegative predictive value for mortality. Eggers et al. [30]compared NT-pro BNP, CRP, cystatin C, and creatinineclearance to predict reinfarction or death in patients withchest pain and ACS non-STEMI. They found AUC = 0.80in a composite of abnormal EKG, increased cardiac troponinI and NT-pro BNP, best NT-pro BNP cutoff point =550 ng/L, sensitivity around 77%, and specificity around20%, according to the ROC curve. Correia et al. [31] studiedNSTEMI patients and found no improvement in the GraceScore prediction model of in-hospital events with additionof admission glucose to the model: AUC increased from 0.81to 0.82.
The comparison between admission blood glucose andBNP ROC curves showed no statistical difference, but webelieve that blood glucose could be more useful in risk strat-ification of ACS patients mainly in undeveloped countries,where cost limits the adoption of new technologies.
4.4. Study Limitations. We determined admission laboratoryresults as variables to be studied to evaluate risks beyondclinical scores like Grace or TIMI risk. We did not compare oradd BNP and blood glucose to the models of risk prediction,but we simplified NSTEMI assessment by using unadjustedresults to predict mortality or higher length of stay.
Some aspects of the study population like prevalence ofprevious coronary artery disease in up to three-quarters ofpatients could influence initial BNP or blood glucose and thein-hospital prognosis.
5. Conclusion
This study suggests that hyperglycemia is an independentrisk factor of in-hospital mortality in NSTEMI and has agood ROC curve level. Although poor in-hospital predictorsof unfavorable events, both hyperglycemia and BNP wereindependent risk factors for death or length of stay > 10 days.There was no relation between hyperglycemia or BNP withlong-term events in our NSTEMI patients.
Conflict of Interests and Source of Funding
Authors declare no conflict of interests or external financialsupport.
References
[1] O. Hetland and K. Dickstein, “Cardiac markers in the earlyhours of acute myocardial infarction: clinical performance ofcreatine kinase, creatine kinase MB isoenzyme (activity andmass concentration), creatine kinase MM and MB subformratios, myoglobin and cardiac troponin T,” ScandinavianJournal of Clinical and Laboratory Investigation, vol. 56, no. 8,pp. 701–713, 1996.
[2] J. L. Mega, D. A. Morrow, J. A. De Lemos et al., “B-typenatriuretic peptide at presentation and prognosis in patientswith ST-segment elevation myocardial infarction: an ENTIRE-TIMI-23 substudy,” Journal of the American College of Cardiol-ogy, vol. 44, no. 2, pp. 335–339, 2004.
[3] J. A. Beck, C. Meisinger, M. Heier et al., “Effect of bloodglucose concentrations on admission in non-diabetic versusdiabetic patients with first acute myocardial infarction onshort- and long-term mortality (from the MONICA/KORAAugsburg Myocardial Infarction Registry),” American Journalof Cardiology, vol. 104, no. 12, pp. 1607–1612, 2009.
[4] M. Galvani, F. Ottani, L. Oltrona et al., “N-terminal pro-brain natriuretic peptide on admission has prognostic valueacross the whole spectrum of acute coronary syndromes,”Circulation, vol. 110, no. 2, pp. 128–134, 2004.
[5] S. Monteiro, P. Monteiro, F. Goncalves, M. Freitas, and L. A.Providencia, “Hyperglycaemia at admission in acute coronarysyndrome patients: prognostic value in diabetics and non-diabetics,” European Journal of Cardiovascular Prevention andRehabilitation, vol. 17, no. 2, pp. 155–159, 2010.
[6] M. Sewdarsen, S. Vythilingum, I. Jialal, and P. J. Becker, “Prog-nostic importance of admission plasma glucose in diabeticand non-diabetic patients with acute myocardial infarction,”Quarterly Journal of Medicine, vol. 71, no. 265, pp. 461–466,1989.
[7] J. A. De Lemos, D. A. Morrow, J. H. Bentley et al., “The prog-nostic value of B-type natriuretic peptide in patients withacute coronary syndromes,” New England Journal of Medicine,vol. 345, no. 14, pp. 1014–1021, 2001.
[8] L. A. Allen, C. J. O’Donnell, C. A. Camargo Jr., R. P. Giugliano,and D. M. Lloyd-Jones, “Comparison of long-term mortalityacross the spectrum of acute coronary syndromes,” AmericanHeart Journal, vol. 151, no. 5, pp. 1065–1071, 2006.
[9] J. S. Alpert, E. Antman, F. Apple et al., “Myocardial infarctionredefined—a consensus document of The Joint EuropeanSociety of Cardiology/American College of Cardiology Com-mittee f or the redefinition of myocardial infarction,” Journalof the American College of Cardiology, vol. 36, no. 3, pp. 959–969, 2000.
[10] W. J. Youden, “Index for rating diagnostic tests,” Cancer, vol.3, no. 1, pp. 32–35, 1950.
[11] R. M. Cubbon, A. Rajwani, A. Abbas et al., “Hyperglycaemia,in relation to sex, and mortality after acute coronary syn-drome,” European Journal of Cardiovascular Prevention andRehabilitation, vol. 14, no. 5, pp. 666–671, 2007.
[12] J. Lambert and I. Lipkovich, “A macro for getting more out ofyour ROC curve,” Tech. Rep. 231-2008, Eli Lilly and Company,Indianapolis, Ind, USA, 2008.
[13] B. Modan, S. Schor, and M. Shani, “Acute myocardial infarc-tion. Prognostic value of white blood cell count and blood

The Scientific World Journal 7
glucose level,” Journal of the American Medical Association, vol.233, no. 3, pp. 266–267, 1975.
[14] M. De Mulder, J. H. Cornel, T. Van Der Ploeg, E. Boersma,and V. A. Umans, “Elevated admission glucose is associatedwith increased long-term mortality in myocardial infarctionpatients, irrespective of the initially applied reperfusion strat-egy,” American Heart Journal, vol. 160, no. 3, pp. 412–419,2010.
[15] S. Hoshida, M. Teragaki, Y. J. Lim et al., “Admission withmetabolic disorder is a useful predictor of the 1-year prognosisfor patients with unstable angina, but not for patientswith acute myocardial infarction: East-Osaka Acute CoronarySyndrome Registry,” Coronary Artery Disease, vol. 22, no. 6, pp.416–420, 2011.
[16] A. E. P. Pesaro, J. C. Nicolau, C. V. Serrano Jr. et al., “Influenceof leukocytes and glycemia on the prognosis of patientswith acute myocardial infarction,” Arquivos Brasileiros deCardiologia, vol. 92, no. 2, pp. 84–89, 2009.
[17] R. Bassan, B. R. Tura, and A. S. Maisel, “B-type natriureticpeptide: a strong predictor of early and late mortality inpatients with acute chest pain without ST-segment elevationin the emergency department,” Coronary Artery Disease, vol.20, no. 2, pp. 143–149, 2009.
[18] V. S. Narain, N. Gupta, R. Sethi et al., “Clinical correlation ofmultiple biomarkers for risk assessment in patients with acutecoronary syndrome,” Indian Heart Journal, vol. 60, no. 6, pp.536–542, 2008.
[19] S. D. Wiviott, J. A. De Lemos, and D. A. Morrow, “Patho-physiology, prognostic significance and clinical utility of B-type natriuretic peptide in acute coronary syndromes,” ClinicaChimica Acta, vol. 346, no. 2, pp. 119–128, 2004.
[20] G. A. Oswald, S. Corcoran, and J. S. Yudkin, “Prevalence andrisks of hyperglycaemia and undiagnosed diabetes in patientswith acute myocardial infarction,” The Lancet, vol. 1, no. 8389,pp. 1264–1267, 1984.
[21] G. A. Oswald, C. C. T. Smith, D. J. Betteridge, and J. S. Yudkin,“Determinants and importance of stress hyperglycaemia innon-diabetic patients with myocardial infarction,” BritishMedical Journal, vol. 293, no. 6552, pp. 917–922, 1986.
[22] M. Falciglia, R. W. Freyberg, P. L. Almenoff, D. A. D’Alessio,and M. L. Render, “Hyperglycemia-related mortality in criti-cally ill patients varies with admission diagnosis,” Critical CareMedicine, vol. 37, no. 12, pp. 3001–3009, 2009.
[23] C. J. Jensen, H. C. Eberle, K. Nassenstein et al., “Impact ofhyperglycemia at admission in patients with acute ST-segmentelevation myocardial infarction as assessed by contrast-enhanced MRI,” Clinical Research in Cardiology, vol. 100, no.8, pp. 649–659, 2011.
[24] A. N. Mather, A. Crean, N. Abidin et al., “Relationship ofdysglycemia to acute myocardial infarct size and cardiovas-cular outcome as determined by cardiovascular magneticresonance,” Journal of Cardiovascular Magnetic Resonance, vol.12, p. 61, 2010.
[25] J. R. Timmer, J. P. Ottervanger, M. J. De Boer et al., “Hyper-glycemia is an important predictor of impaired coronaryflow before reperfusion therapy in ST-segment elevationmyocardial infarction,” Journal of the American College ofCardiology, vol. 45, no. 7, pp. 999–1002, 2005.
[26] D. Kansagara, R. Fu, M. Freeman, F. Wolf, and M. Helfand,“Intensive insulin therapy in hospitalized patients: a system-atic review,” Annals of Internal Medicine, vol. 154, no. 4, pp.268–282, 2011.
[27] R. B. Ramos, C. M. Strunz, S. D. Avakian, J. A. Ramires, andA. de Padua Mansur, “B-type natriuretic peptide as a predictor
of anterior wall location in patients with non-ST-elevationmyocardial infarction,” Clinics, vol. 66, no. 3, pp. 437–441,2011.
[28] A. Dirkali, T. van der Ploeg, M. Nangrahary, J. H. Cornel, andV. A. W. M. Umans, “The impact of admission plasma glucoseon long-term mortality after STEMI and NSTEMI myocardialinfarction,” International Journal of Cardiology, vol. 121, no. 2,pp. 215–217, 2007.
[29] B. Cid-Alvarez, F. Gude, C. Cadarso-Suarez et al., “Admissionand fasting plasma glucose for estimating risk of deathof diabetic and nondiabetic patients with acute coronarysyndrome: nonlinearity of hazard ratios and time-dependentcomparison,” American Heart Journal, vol. 158, no. 6, pp. 989–997, 2009.
[30] K. M. Eggers, M. Dellborg, J. Oldgren, E. Swahn, P. Venge,and B. Lindahl, “Risk prediction in chest pain patients bybiochemical markers including estimates of renal function,”International Journal of Cardiology, vol. 128, no. 2, pp. 207–213, 2008.
[31] L. C. L. Correia, M. S. Rocha, A. P. Bittencourt et al., “Doesacute hyperglycemia add prognostic value to the GRACEscore in individuals with non-ST elevation acute coronarysyndromes?” Clinica Chimica Acta, vol. 410, no. 1-2, pp. 74–78, 2009.

Submit your manuscripts athttp://www.hindawi.com
Stem CellsInternational
Hindawi Publishing Corporationhttp://www.hindawi.com Volume 2014
Hindawi Publishing Corporationhttp://www.hindawi.com Volume 2014
MEDIATORSINFLAMMATION
of
Hindawi Publishing Corporationhttp://www.hindawi.com Volume 2014
Behavioural Neurology
EndocrinologyInternational Journal of
Hindawi Publishing Corporationhttp://www.hindawi.com Volume 2014
Hindawi Publishing Corporationhttp://www.hindawi.com Volume 2014
Disease Markers
Hindawi Publishing Corporationhttp://www.hindawi.com Volume 2014
BioMed Research International
OncologyJournal of
Hindawi Publishing Corporationhttp://www.hindawi.com Volume 2014
Hindawi Publishing Corporationhttp://www.hindawi.com Volume 2014
Oxidative Medicine and Cellular Longevity
Hindawi Publishing Corporationhttp://www.hindawi.com Volume 2014
PPAR Research
The Scientific World JournalHindawi Publishing Corporation http://www.hindawi.com Volume 2014
Immunology ResearchHindawi Publishing Corporationhttp://www.hindawi.com Volume 2014
Journal of
ObesityJournal of
Hindawi Publishing Corporationhttp://www.hindawi.com Volume 2014
Hindawi Publishing Corporationhttp://www.hindawi.com Volume 2014
Computational and Mathematical Methods in Medicine
OphthalmologyJournal of
Hindawi Publishing Corporationhttp://www.hindawi.com Volume 2014
Diabetes ResearchJournal of
Hindawi Publishing Corporationhttp://www.hindawi.com Volume 2014
Hindawi Publishing Corporationhttp://www.hindawi.com Volume 2014
Research and TreatmentAIDS
Hindawi Publishing Corporationhttp://www.hindawi.com Volume 2014
Gastroenterology Research and Practice
Hindawi Publishing Corporationhttp://www.hindawi.com Volume 2014
Parkinson’s Disease
Evidence-Based Complementary and Alternative Medicine
Volume 2014Hindawi Publishing Corporationhttp://www.hindawi.com