board of directors finance subcommittee...sep 21, 2020 · proposed fy 21 budget adjustment during...
TRANSCRIPT

Board of DirectorsFinance Subcommittee
September 21, 2020
1

Fiscal Year 2020
Year-end Review
2

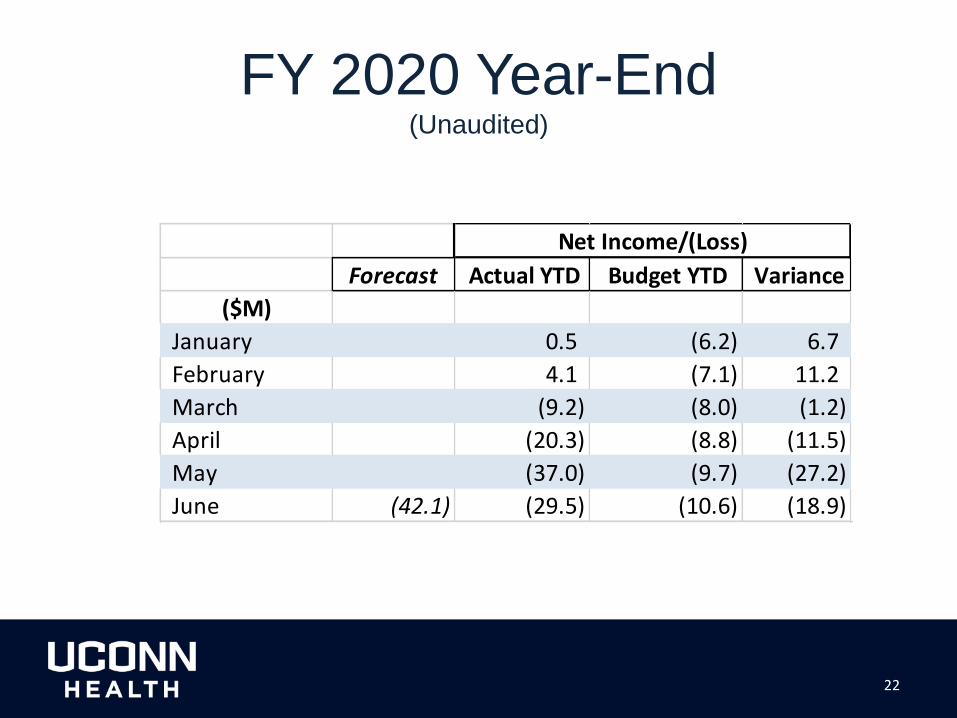
FY 2020 Year-End(Unaudited)
3
Forecast Actual YTD Budget YTD Variance
($M)
January 0.5 (6.2) 6.7
February 4.1 (7.1) 11.2
March (9.2) (8.0) (1.2)
April (20.3) (8.8) (11.5)
May (37.0) (9.7) (27.2)
June (42.1) (29.5) (10.6) (18.9)
Net Income/(Loss)

4
Year - to - Date
Category Actual Budget Variance
Total UCH Excess/(Deficiency) ($29,502) ($10,609) ($18,893)
Key Financial ResultsFor the period ending June 30, 2020

5
Year - to - Date
Category Actual Budget Variance
John Dempsey Hospital (in thousands)
JDH Excess/(Deficiency) ($51,907) ($32,178) ($19,729)
JDH Operating Margin -10.9% -6.4% -4.4%
Inpatient Discharges 9,266 10,264 (998)
Observation Stays 3,989 4,226 (237)
Outpatient Equivalents 17,423 17,366 57
Average Length of Stay 4.4 4.2 0.2
Net Revenue per Adjusted Discharge $15,088 $16,200 ($1,112)
Cost per Adjusted Discharge $19,847 $19,316 $531
Days Revenue in Accounts Receivable 39 42 (3)
Case Mix Index 1.5167 1.5200 (0.0033)
John Dempsey Hospital
6
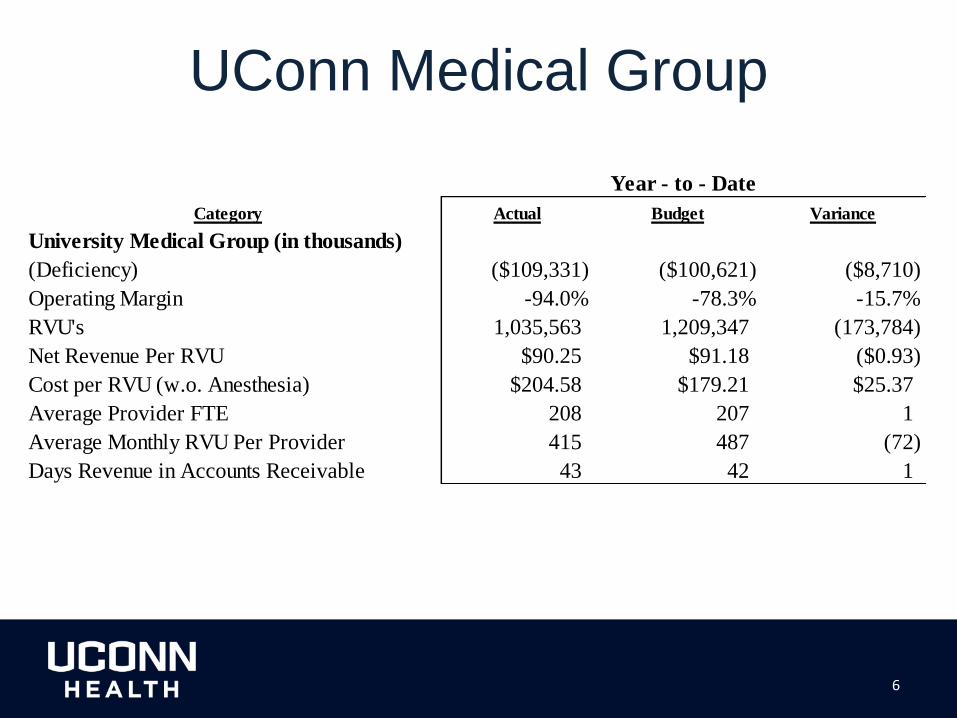
Year - to - Date
Category Actual Budget Variance
University Medical Group (in thousands)
(Deficiency) ($109,331) ($100,621) ($8,710)
Operating Margin -94.0% -78.3% -15.7%
RVU's 1,035,563 1,209,347 (173,784)
Net Revenue Per RVU $90.25 $91.18 ($0.93)
Cost per RVU (w.o. Anesthesia) $204.58 $179.21 $25.37
Average Provider FTE 208 207 1
Average Monthly RVU Per Provider 415 487 (72)
Days Revenue in Accounts Receivable 43 42 1
UConn Medical Group

FY 20 Year-end(Modified cash)
Total Fiscal Year Total Fiscal Year
Actual Budget Variance
Tuition and Fees 29,416,336 28,615,507 800,829
Grants & Contracts 85,910,166 91,117,365 (5,207,198)
Interns/Residents 71,010,165 72,544,484 (1,534,319)
Net Patient Revenue 511,779,727 576,419,793 (64,640,066)
Other Revenue 185,391,660 155,241,881 30,149,779
Total Operating Revenue 883,508,055 923,939,030 (40,430,976)
Salary and Fringes 716,818,373 722,743,462 (5,925,089)
Drugs/Medical Supplies 124,100,582 132,721,308 (8,620,726)
Outside and Other Purchased Services 98,439,142 102,440,392 (4,001,250)
Other Expenses 233,938,997 233,049,589 889,407
Principal Debt Payments 6,748,463 6,748,463 -
Capital lease payments 980,673 1,019,610 (38,937)
Capital projects 11,561,045 10,891,265 669,780
Total Operating Expenses 1,192,587,275 1,209,614,090 (17,026,814)
Net Income/(Loss) (309,079,221) (285,675,059) (23,404,161)
Block Grant 124,934,428 124,934,428 (0)
Fringe Reimbursement 132,051,137 127,540,631 4,510,506
Additional Support-State Unfunded legacy costs 33,200,000 33,200,000 (0)
Net Income/(Loss) After state Support (18,893,656) (0) (18,893,656)
7

Fiscal Year 2021
As of July 31, 2020
8

JDHClinical revenues are ramping up close to pre-COVID
amounts
9

UMGClinical activity is ramping up close to pre-COVID amounts
Encounters vs. Benchmark
10

11
UCH Net Patient Revenue is Favorable for the
Month of July Compared to Budget

FY 2021 Budget Tracker
12
FY 21 Budget
original BOD
UCH Projected Loss (114,936,995)
Mitigation plans
Capital deferral 4,936,995
Unfunded Legacy Cost Support 53,800,000
Financial Improvement Plan (FIP) 40,000,000
Furlough - management 2,000,000
Federal Funds 10,000,000
Unidentified Mitigation for COVID
-19 Losses 4,200,000
114,936,995

FY 2021 UCH Financial
Improvement Project
13
Initiatives Overview
Annualized Cumulative Benefit - Targeted and Realized
7/31/2020 8/31/2020 9/30/2020 10/31/2020 11/30/2020 12/31/2020 1/31/2021 2/28/2021 3/31/2021 4/30/2021 5/31/2021 6/30/2021
Targeted 7,816,629$ 10,742,390$ 13,668,151$ 16,593,912$ 19,519,673$ 22,445,434$ 25,371,195$ 28,296,956$ 31,222,717$ 34,148,478$ 37,074,239$ 40,000,000$
Realized 7,816,629$ 14,909,688$ -$ -$ -$ -$ -$ -$ -$ -$ -$ 14,909,688$ Percent realized 100.0% 138.8% 0.0% 0.0% 0.0% 0.0% 0.0% 0.0% 0.0% 0.0% 0.0% 37.3%
Key Initiatives: Annual Target
Implemented
YTD Savings % Implemented
Estimated
Annual Savings
% Est Annual
Savings
20,381,000 10,108,223 49.6% 15,201,078 74.6%9,457,000 3,442,469 36.4% 4,423,021 46.8%5,131,000 565,453 11.0% 1,374,513 26.8%2,022,000 358,919 17.8% 1,417,094 70.1%3,009,000 434,622 14.4% 2,557,421 85.0%
40,000,000$ 14,909,688$ 37.3% 24,973,127$ 62.4% TOTAL TARGET
Clinical Operational Initiatives - UMG
Academic Initiatives - SODM Research Initiatives
Financial Improvement Project 6.0 - Overview
Clinical Operational Initiatives - JDH
Academic Initiatives - SOM

FY 2021 Mitigation Identified
14
Mitigation plans
Mitigation
Plan
Identified Realized
Capital deferral 4,936,995 4,525,579 411,416
Furlough - management 2,000,000 1,833,333 166,667
Federal Funds 10,000,000 - 10,000,000
16,936,995 6,358,912 10,578,083

FY 2021 Open Mitigation Plans
15
Mitigation plans
Unfunded Legacy Cost Support** 53,800,000
Unidentified Mitigation for COVID
-19 Losses 4,200,000
Per discussions with OPM, for state planning purposes, we have been asked to assume $33.2M for unfunded legacy costs (consistent with Gov. proposed FY 21 budget adjustment during the 2020 legislative session); this represents a portion of the $53.8M we have requested from the legislature to address the financial burden posed by the state’s unfunded legacy costs.

16
Current State Request
As presented to the Appropriations Committee on August 28, 2020

UConn Health FY 21 Budget
17
UConn Health Fiscal Year 2021
Actual
Monthly Spread July Aug Sept Oct Nov Dec Jan Feb March April May June TOTAL
(12.4) (15.3) (11.7) (11.7) (9.0) (10.0) (2.3) (4.2) (8.6) (6.9) (8.3) (14.8) (114.9)
Mitigation Plans
Capital deferral 0.4 0.4 0.4 0.4 0.4 0.4 0.4 0.4 0.4 0.4 0.4 0.5 4.9
Financial Improvement Plan (FIP) 7.8 7.1 14.9
Furlough - management 0.2 0.2 0.1 0.2 0.2 0.1 0.2 0.2 0.1 0.2 0.2 0.1 2.0
Federal Funds 10.0 10.0
Unfunded Legacy Cost Support - -
Block Grant advance 7.9 4.7 4.7 4.7 4.7 4.8 (10.5) (10.5) (10.5) -
Associated In-kind Fringe 6.7 4.6 4.6 4.6 4.6 4.7 (9.9) (9.9) (10.0) -
Adjusted Budget 20.6 1.7 (1.9) (1.8) 0.9 (0.0) (1.7) (3.6) (8.1) (26.7) (28.1) (34.7) (83.1)
Forecast
- Adjusted Budget will change each month based on operational performance and accomplishment of outstanding mitigation initiatives.

Board of DirectorsFinance Subcommittee
September 21, 2020
18

Board of DirectorsSeptember 21, 2020
19

CEO Update
20

Fiscal Year 2020
Year-end Review
21
FY 2020 Year-End(Unaudited)
22
Forecast Actual YTD Budget YTD Variance
($M)
January 0.5 (6.2) 6.7
February 4.1 (7.1) 11.2
March (9.2) (8.0) (1.2)
April (20.3) (8.8) (11.5)
May (37.0) (9.7) (27.2)
June (42.1) (29.5) (10.6) (18.9)
Net Income/(Loss)

Fiscal Year 2021
As of July 31, 2020
23

24
UCH Net Patient Revenue is Favorable for the
Month of July

FY 2021 Budget Tracker
25
FY 21 Budget
original BOD
UCH Loss* (114,936,995)
Mitigation plans
Capital deferral 4,936,995
Unfunded Legacy Cost Support** 53,800,000
Financial Improvement Plan (FIP) 40,000,000
Furlough - management 2,000,000
Federal Funds 10,000,000
Unidentified Mitigation for COVID
-19 Losses 4,200,000
-
Total Mitigation Plans 114,936,995

FY 2021 UCH Financial
Improvement Project
26
Initiatives Overview
Annualized Cumulative Benefit - Targeted and Realized
7/31/2020 8/31/2020 9/30/2020 10/31/2020 11/30/2020 12/31/2020 1/31/2021 2/28/2021 3/31/2021 4/30/2021 5/31/2021 6/30/2021
Targeted 7,816,629$ 10,742,390$ 13,668,151$ 16,593,912$ 19,519,673$ 22,445,434$ 25,371,195$ 28,296,956$ 31,222,717$ 34,148,478$ 37,074,239$ 40,000,000$
Realized 7,816,629$ 14,909,688$ -$ -$ -$ -$ -$ -$ -$ -$ -$ 14,909,688$ Percent realized 100.0% 138.8% 0.0% 0.0% 0.0% 0.0% 0.0% 0.0% 0.0% 0.0% 0.0% 37.3%
Key Initiatives: Annual Target
Implemented
YTD Savings % Implemented
Estimated
Annual Savings
% Est Annual
Savings
20,381,000 10,108,223 49.6% 15,201,078 74.6%9,457,000 3,442,469 36.4% 4,423,021 46.8%5,131,000 565,453 11.0% 1,374,513 26.8%2,022,000 358,919 17.8% 1,417,094 70.1%3,009,000 434,622 14.4% 2,557,421 85.0%
40,000,000$ 14,909,688$ 37.3% 24,973,127$ 62.4% TOTAL TARGET
Clinical Operational Initiatives - UMG
Academic Initiatives - SODM Research Initiatives
Financial Improvement Project 6.0 - Overview
Clinical Operational Initiatives - JDH
Academic Initiatives - SOM

FY 2021 Mitigation Identified
27
Mitigation plans
Mitigation
Plan
Identified Realized
Capital deferral 4,936,995 4,525,579 411,416
Furlough - management 2,000,000 1,833,333 166,667
Federal Funds 10,000,000 - 10,000,000

FY 2021 Open Mitigation Plans
28
Mitigation plans
Unfunded Legacy Cost Support** 53,800,000
Unidentified Mitigation for COVID
-19 Losses 4,200,000
Per discussions with OPM, for state planning purposes, we have been asked to assume $33.2M for unfunded legacy costs (consistent with Gov. proposed FY 21 budget adjustment during the 2020 legislative session); this represents a portion of the $53.8M we have requested from the legislature to address the financial burden posed by the state’s unfunded legacy costs.

29
Current State Request
As presented to the Appropriations Committee on August 28, 2020

UConn Health FY 21 Budget
30
UConn Health Fiscal Year 2021
Actual
Monthly Spread July Aug Sept Oct Nov Dec Jan Feb March April May June TOTAL
(12.4) (15.3) (11.7) (11.7) (9.0) (10.0) (2.3) (4.2) (8.6) (6.9) (8.3) (14.8) (114.9)
Mitigation Plans
Capital deferral 0.4 0.4 0.4 0.4 0.4 0.4 0.4 0.4 0.4 0.4 0.4 0.5 4.9
Financial Improvement Plan (FIP) 7.8 7.1 14.9
Furlough - management 0.2 0.2 0.1 0.2 0.2 0.1 0.2 0.2 0.1 0.2 0.2 0.1 2.0
Federal Funds 10.0 10.0
Unfunded Legacy Cost Support - -
Block Grant advance 7.9 4.7 4.7 4.7 4.7 4.8 (10.5) (10.5) (10.5) -
Associated In-kind Fringe 6.7 4.6 4.6 4.6 4.6 4.7 (9.9) (9.9) (10.0) -
Adjusted Budget 20.6 1.7 (1.9) (1.8) 0.9 (0.0) (1.7) (3.6) (8.1) (26.7) (28.1) (34.7) (83.1)
Forecast

Office of Vice President for Research
Research Activity Update
September 21, 2020

NEW SPONSORED PROJECT AWARDS*
FY2016-2020
* New Awards include the total project value for all years for new projects and competitive renewals.** FY20 New Award data is preliminary.
Sum of Total Committed AwardColumn Labels Count of Total Committed AwardColumn Labels
Row Labels FY16 FY17 FY18 FY19 FY20** Row Labels FY16 FY17 FY18 FY19 FY20
School of Medicine 80,610,301 45,825,965 88,471,956 93,566,381 93,639,059 School of Medicine 135 122 191 162 168
<$1M 21,451,963 16,750,823 25,109,363 23,575,673 27,410,444 <$1M 112 108 164 134 140
<$5M 40,257,609 29,075,142 44,737,691 51,157,672 52,793,265 <$5M 20 14 25 26 26
>$5M 18,900,729 18,624,902 18,833,036 13,435,351 >$5M 3 2 2 2
School of Dental Medicine 5,044,781 8,637,355 4,587,371 8,434,142 9,774,995 School of Dental Medicine 7 17 17 22 17
<$1M 679,567 2,002,818 4,587,371 4,040,092 2,918,722 <$1M 5 14 17 20 14
<$5M 4,365,214 6,634,537 4,394,050 6,856,273 <$5M 2 3 2 3
Other UConn Health 8,000 299,871 514,273 Other UConn Health 1 2 1
<$1M 8,000 299,871 514,273 <$1M 1 2 1
Grand Total 85,663,082 54,763,191 93,573,600 102,000,522 103,414,054 Grand Total 143 141 209 184 185

TECHNOLOGY COMMERCIALIZATION2016-2020
TECHNOLOGY
COMMERCIALIZATION FY16 FY17 FY18 FY19 FY20
Disclosures Received
School of Medicine 7 11 17 13 32
School of Dental Medicine 2 2 2 3 11
Total Disclosures 9 13 19 16 43
Patents Filed
School of Medicine 2 7 9 8 13
School of Dental Medicine 2 0 1 1 5
Total Patents Filed 4 7 10 9 18
Patents Granted
School of Medicine 7 3 6 2 5
School of Dental Medicine 0 0 1 1 1
Total Patents Granted 7 3 7 3 6
Licenses/Options Signed
School of Medicine 3 2 6 3 5
School of Dental Medicine 1 1 1 0 0
Total Licenses/Options 4 3 7 3 5
Companies Formed
School of Medicine NA 4 1 2 1
School of Dental Medicine NA 0 1 0 0
Total Licenses/Options 4 2 2 1

Dean, School of Medicine
Update
Bruce T. Liang, MD
Dean, School of Medicine
34

Medical School – Value to CT’s residents & Workforce Impact
Critical Source of the State’s Health Care Professionals – Educating the Next Generation
• 70% SOM graduates give back in service for the 4 years of medical education they receive.
• 35% of SOM-sponsored residents and fellows including non-SOM graduates serve CT as practitioners or as subspecialty fellows.
• 95% of the SOM students are Connecticut residents
• Best retention rate of resident physicians that stay in CT after training than any other states in U.S-see next slide for details
• SOM is among top-performing schools in the country with over 20% of the students as under-represented minorities for last six consecutive years.
• Per year, SOM and UConn Health receive approximately $100m extramural research funding and SOM-sponsored programs receives $122m federal funding for education of resident and specialty fellow physicians.
35

Residency Training/Graduate Medical Education
A Partner and Resource to Other Hospitals & the State• UConn Health has 798 residents (684 medical and 114 dental) who train and provide patient care
in local hospitals and dozens of community settings in more than 28 communities across the state
• UConn Residency Programs are critical to ensuring the future medical and dental workforce in our State, contribute to the quality of healthcare service in the participating hospitals, and bring in additional Medicare reimbursement revenues to Connecticut.
Hospitals FY 17
Graduate Medical Education &Indirect Medical Education
Reimbursement
CT Children’s $3.0 million
Hartford Hospital $50.1 million
Hospital of Central Connecticut $7.6 million
UConn John Dempsey Hospital $29.1 million
St. Francis Hospital $32.5 million
TOTAL $122.3 million
UConn residents provide care in: Hartford, Bridgeport, New Britain, Middletown, East Hartford, Manchester, Waterbury, Norwich, New Haven, Derby, Willimantic, Putnam, Torrington, Farmington, West Hartford, Meriden, Suffield, Cheshire, Bloomfield, Danbury, Enfield, Glastonbury, Hamden, Newtown, Plainville, Storrs, Uncasville and Newington
36

Notes:
GME = Graduate Medical Education
"All other states" includes physicians who completed GME in Canada.
Source: AMA Physician Masterfile (December 31, 2018)
© 2019 AAMC. May not be reproduced without permission.
Connecticut Physician Workforce Profile-we retain more resident physicians to stay and serve CT
than any other states in the U.S.2 State Population: 3,572,665 Total Female Physicians: 4,760
0 Population ≤ age 21 942,138 Total MD or DO Students: 1,385 71 Total Active Physicians: 12,579 Total Residents: 2,431
8 Primary Care Physicians: 3,777
For additional data, including maps and tables, please see the 2019 State Physician Workforce Data Report online at www.aamc.org/workforce
Number Percent
State Where GME Was Completed
for All Active Physicians in State
Connecticut 4,9
60
41%
New York 2,7
87
23%
Massachusetts 931 8%
Pennsylvania 607 5%
California 274 2%
New Jersey 223 2%
Maryland 204 2%
Ohio 187 2%
Illinois 161 1%
Rhode Island 152 1%
All other states 1,5
03
13%
Practice Location of Physicians
Who Completed GME in State
Connecticut 4,9
60
35%
New York 1,1
24
8%
California 1,0
97
8%
Massachusetts 819 6%
Florida 746 5%
Pennsylvania 452 3%
Texas 441 3%
New Jersey 396 3%
Maryland 309 2%
North Carolina 280 2%
All other states 3,7
23
26%

484,779 486,601 523,387 563,856 591,760 344,092 496,951 652,356 551,390142
144
146
148
150
152
154
156
158
160
162
0
10,000,000
20,000,000
30,000,000
40,000,000
50,000,000
60,000,000
70,000,000
80,000,000
90,000,000
100,000,000
FY2012 FY2013 FY2014 FY2015 FY2016 FY2017 FY2018 FY2019 FY2020
School of Medicine Research Analytics
SoM Awards

Main Bldg. Lab (L) Area Renovations - 3rd Floor
Scope: The project implements the lab renovation scheme developed under the Main Building Lab Area Master Plan. The design for the 3rd Floor Lab Renovations is similar to the Bioscience Connecticut Main Building Lab Renovations Project 2 which renovated floors 4 thru 7.
Schedule: Design: 80% complete, Construction: TBD - dependent upon funding
Budget: $9,715,000
Issues/Concerns: Funding for the construction of the project is dependent upon philanthropy and other sources.

Thank you for your attention
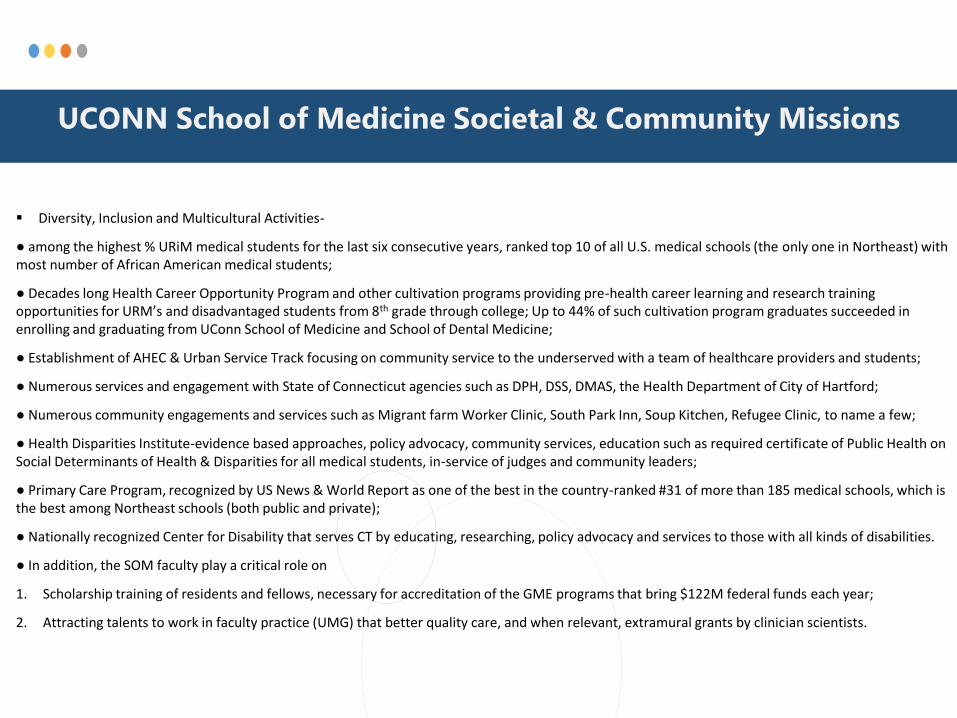
UCONN School of Medicine Societal & Community Missions
Diversity, Inclusion and Multicultural Activities-
● among the highest % URiM medical students for the last six consecutive years, ranked top 10 of all U.S. medical schools (the only one in Northeast) with most number of African American medical students;
● Decades long Health Career Opportunity Program and other cultivation programs providing pre-health career learning and research training opportunities for URM’s and disadvantaged students from 8th grade through college; Up to 44% of such cultivation program graduates succeeded in enrolling and graduating from UConn School of Medicine and School of Dental Medicine;
● Establishment of AHEC & Urban Service Track focusing on community service to the underserved with a team of healthcare providers and students;
● Numerous services and engagement with State of Connecticut agencies such as DPH, DSS, DMAS, the Health Department of City of Hartford;
● Numerous community engagements and services such as Migrant farm Worker Clinic, South Park Inn, Soup Kitchen, Refugee Clinic, to name a few;
● Health Disparities Institute-evidence based approaches, policy advocacy, community services, education such as required certificate of Public Health on Social Determinants of Health & Disparities for all medical students, in-service of judges and community leaders;
● Primary Care Program, recognized by US News & World Report as one of the best in the country-ranked #31 of more than 185 medical schools, which is the best among Northeast schools (both public and private);
● Nationally recognized Center for Disability that serves CT by educating, researching, policy advocacy and services to those with all kinds of disabilities.
● In addition, the SOM faculty play a critical role on
1. Scholarship training of residents and fellows, necessary for accreditation of the GME programs that bring $122M federal funds each year;
2. Attracting talents to work in faculty practice (UMG) that better quality care, and when relevant, extramural grants by clinician scientists.

Dean, School of Dental Medicine
Update
Steven M. Lepowsky, DDS, FAGD, FACD
Interim Dean, School of Dental Medicine
42

John Dempsey Hospital
UConn Medical Group
Update
43

UConn Medical Group Operational Updates & COVID-19
• COVID-19 - We continue to focus on our ramp up in a safe manner. Proper PPE, masks and shields are used when seeing patients, maintain social distancing 6 ft., and have a no visitor policy in the Ambulatory areas. An environment assessment has been completed in order to add an additional protection for when it is difficulty to socially distance in teaming areas.
• COVID-19 Port of Entry Screening Sites (approx. 19 sites) All entryways continue to be staffed and the necessary procedures have been implemented ensuring that employees and patients are asymptomatic before entering the facilities.
• COVID-19 Testing – We continue to maintain our Lot 3 Lower Campus testing drive through site. This site is open Monday through Saturday and test pre-operative and pre-procedure patients, patients and community that are symptomatic. (moved 9/18/2020 to Garage 1)
• JAXs laboratory Faculty & Staff• UConn Storrs Faculty & Staff (multiple
campuses)• UConn Basketball & Football Faculty &
Staff• Private School Testing for symptomatic
students (Miss Porters, Avon Old Farms, Cheshire Academy)
• Medical Students & Residents for rotations• DEEP Firefighters returning from California
• We also set up an Upper Campus walk through testing site for front facing clinical employee testing outside of the Emergency Room area.

UConn Medical Group Operational Updates & COVID-19
• COVID-19 Ramp-up – Many of the Ambulatory departments starting ramping up as of May 18, 2020. Providers will continue to use e-visits, scheduled telephone and video encounters. The goal is to have the clinics fully operational by the end of this year.
0
1,000
2,000
3,000
4,000
5,000
6,000
7,000
8,000
9,000
10,000
02
/02
/20
- 0
2/0
8/2
0
02
/09
/20
- 0
2/1
5/2
0
02
/16
/20
- 0
2/2
2/2
0
02
/23
/20
- 0
2/2
9/2
0
03
/01
/20
- 0
3/0
7/2
0
03
/08
/20
- 0
3/1
4/2
0
03
/15
/20
- 0
3/2
1/2
0
03
/22
/20
- 0
3/2
8/2
0
03
/29
/20
- 0
4/0
4/2
0
04
/05
/20
- 0
4/1
1/2
0
04
/12
/20
- 0
4/1
8/2
0
04
/19
/20
- 0
4/2
5/2
0
04
/26
/20
- 0
5/0
2/2
0
05
/03
/20
- 0
5/0
9/2
0
05
/10
/20
- 0
5/1
6/2
0
05
/17
/20
- 0
5/2
3/2
0
05
/24
/20
- 0
5/3
0/2
0
05
/31
/20
- 0
6/0
6/2
0
06
/07
/20
- 0
6/1
3/2
0
06
/14
/20
- 0
6/2
0/2
0
06
/21
/20
- 0
6/2
7/2
0
06
/28
/20
- 0
7/0
4/2
0
07
/05
/20
- 0
7/1
1/2
0
07
/12
/20
- 0
7/1
8/2
0
07
/19
/20
- 0
7/2
5/2
0
07
/26
/20
- 0
8/0
1/2
0
08
/02
/20
- 0
8/0
8/2
0
08
/09
/20
- 0
8/1
5/2
0
08
/16
/20
- 0
8/2
2/2
0
08
/23
/20
- 0
8/2
9/2
0
Consultation
Drugs
Laboratory
Medical Supplies
Miscellaneous
Procedure
Radiology
Visit
TeleMedicine

UConn Medical Group Operational Updates & COVID-19
• Cigna Care Designation (CCD) / Tier 1 Provider Status - Cigna’s physician quality/cost efficiency program in which 21 specialties in 74 markets across the country.
• Echocardiography Accreditation – The Pat and Jim Calhoun Cardiology Center Echo Lab in Farmington has earned a three-year term accreditation from the Intersocietal Accreditation Commission (IAC).
• Glide Path Phase 1- As of June 2020 UCONN has successfully completed the Glide Path Phase 1 for the Internal Medicine group in South Road. This will increase the Medicaid E&M codes payments by 14%.
• LGBTQ HealthCare Equality Index 2020 –Awarded the “LGBTQ Healthcare Equality “Top Performer” designation in Healthcare Equality Index 2020.
• Encounters are behind prior year actual by 16%
• RVU's are 9% behind of prior year actual
• Encounters are slightly ahead by 3% of budget
• RVU's are slightly ahead by 3% of budget
176,840
171,018
195,091
102,112
99,375
121,276
- 50,000 100,000 150,000 200,000 250,000
FY 2021 ACTUAL
FY 2021 BUDGET
FY 2020 ACTUAL
UCONN Medical Group YTD August
Encounters RVU's

Board of DirectorsSeptember 21, 2020
47