board of water supply city and county of honolulu...board of water supply city and county of...
TRANSCRIPT
Board of Water Supply City and County of Honolulu Financial Statements and Supplementary Information
June 30, 2015 and 2014
Board of Water Supply City and County of Honolulu Index
Page(s)
Introduction June 30, 2015 and 2014 ........................................................................................................................... 1–5
Report of Independent Auditors
Managementʼs Discussion and Analysis (Unaudited) June 30, 2015 and 2014 ......................................................................................................................... 9–16
Financial Statements
Statements of Net Position June 30, 2015 and 2014 ....................................................................................................................... 17–18
Statements of Revenues, Expenses and Change in Net Position Years Ended June 30, 2015 and 2014 ....................................................................................................... 19
Statements of Cash Flows Years Ended June 30, 2015 and 2014 ................................................................................................. 20–21
Notes to Financial Statements June 30, 2015 and 2014 ....................................................................................................................... 22–47
Required Supplementary Information (Unaudited)
Schedule of Proportionate Share of the Net Pension Liability Last Ten Fiscal Years ................................................................................................................................. 48
Schedule of Contributions Last Ten Fiscal Years ................................................................................................................................. 49
Schedule of Funding Progress June 30, 2015 ............................................................................................................................................. 50
Supplementary Information
Schedule of Bonds Payable June 30, 2015 ....................................................................................................................................... 51–52
Schedules of Net Revenue Requirement Years Ended June 30, 2015 and 2014 ....................................................................................................... 53

Introduction

Board of Water Supply City and County of Honolulu Introduction June 30, 2015 and 2014
1
The Board of Water Supply of the City and County of Honolulu (the “BWS”) is pleased to present its Annual Financial Report for the fiscal year ended June 30, 2015. This introduction provides an overview of the mission, organization and operations of the BWS. The following management’s discussion and analysis is intended to provide the reader with an easily understandable analysis of the BWS’s financial performance and all aspects of its financial position. Financial statements presenting the financial position and results of operations of the BWS is in conformity with accounting principles generally accepted in the United States of America, accompanied by the independent auditors’ report.
HISTORY OF THE BOARD OF WATER SUPPLY The Honolulu Board of Water Supply was created in 1929 by the Territorial Legislature in response to public outcry for a truly effective water management system that was above politics. The 1929 Legislature passed Act 96 to create and define the powers and duties of the Honolulu Board of Water Supply. Although it remained as a department of the City and County of Honolulu (the “City”), the BWS was designed to be a semi-autonomous and self-supporting agency with the authority to charge for water usage to support its capital improvement and operating expenses and set long-term plans for Oahu’s water future.
POWERS, DUTIES AND FUNCTIONS The BWS manages Oahu’s municipal water resources and distribution system, providing residents with a safe, dependable and affordable drinking water supply.
The BWS is the largest municipal water utility in the State of Hawaii. In fiscal year 2015, the BWS delivered potable and non-potable water to approximately one million customers on Oahu. The BWS carefully and proactively manages and invests in its intricate system, consisting of 94 active potable water sources, 171 reservoirs, and nearly 2,100 miles of pipeline.
The BWS is a financially self-sufficient, semi-autonomous agency of the City and County of Honolulu. Its operations and projects are financed with revenues generated by water transmission and distribution fees. It receives no tax money from the City. The BWS also pursues federal and state grants to help subsidize the BWS’s projects.
The BWS is governed by a Board of Directors (“Board”), consisting of seven members. Five members are appointed by the Mayor and are confirmed by the Honolulu City Council. The remaining two serve in their capacities as the Director of the State Department of Transportation, and the Director and Chief Engineer of the City’s Department of Facility Maintenance. The Board appoints the BWS Manager and Chief Engineer to administer the agency.
The BWS consists of the following 11 divisions: Capital Projects Division, Communications Division, Customer Care Division, Field Operations Division, Finance Division, Information Technology Division, Land Division, Office of the Manager and Chief Engineer, Water Quality Division, Water Resources Division, and Water System Operations Division.
MISSION The BWS’s mission is to provide a safe, dependable and affordable water supply now and into the future, focusing in three strategic areas: resource, operational and financial sustainability.
Board of Water Supply City and County of Honolulu Introduction June 30, 2015 and 2014
2
ACCOMPLISHMENTS The BWS’s employees work diligently to provide safe, dependable and affordable water service to customers by concentrating their efforts to achieve the BWS’s strategic goals:
Resource Sustainability (Safe)
The BWS conducted 27,030 chemical tests and 9,475 microbiological tests on samples collected from its water sources, distribution systems, and treatment facilities to ensure all water served is safe to drink. Chemical tests performed this fiscal year include monitoring the BWS’s wells near the Navy Red Hill Bulk Fuel Facility in response to a fuel leak reported by the Navy in January 2014. Since that date, the BWS has been working with the U.S. Environmental Protection Agency and the State Department of Health, and conducting its own studies to assess the impact the leak may have on the groundwater aquifer.
In June 2015, the BWS completed its annual production and delivery of the Consumer Confidence Report (“CCR”), also known as the Water Quality Report, to all the BWS’s customers. The report provides information on the quality of the water delivered from the BWS’s system and was mailed to all customers on record and is also available at www.boardofwatersupply.com. The BWS also placed ads in Honolulu newspapers, including various ethnic language publications, to inform community members of the distribution.
The BWS celebrated the 25th anniversary of the Halawa Xeriscape Garden Open House and Unthirsty Plant Sale on August 2, 2014. The event was attended by more than 2,000 people who learned about water conservation. The event received a 2015 Koa Award from the Public Relations Society of America, Hawaii Chapter.
The BWS staff held 24 outdoor water conservation classes at the Halawa Xeriscape Garden. These classes focused on reducing water use through efficient landscaping.
The BWS sponsored its 37th annual Water Conservation Week Poster Contest and the 7th annual Water Conservation Week Poetry Contest, receiving more than 1,400 posters and 275 poems from more than 50 Oahu schools, focused on the theme “Water Matters ‒ Conserve It.” All winning entries will be featured in the 2016 Water Conservation Calendar scheduled for distribution in December 2015.
Potable water demand continues its downward trend approximately 9% from 1990 to 2015 due to advanced water conservation efforts, economic incentives from sewer and water rate increases, recycled water, public education, and leak detection and repair programs in the BWS’s water system.
The North Shore, Ewa and Central Oahu Watershed Management Plans (“WMP”) have been completed with the North Shore and Ewa WMP expected for adoption in fiscal year 2016. These are long-range water resource protection and water use and development plans for the City that are concurrent with and support the City’s Development and Sustainable Communities Plans for Oahu. The WMP guides the BWS’s long-range capital improvement program, ensuring that adequate natural and alternative water supplies are available to meet Oahu’s future water growth.

Board of Water Supply City and County of Honolulu Introduction June 30, 2015 and 2014
3
Recycled water is an important conservation strategy to reduce potable water consumption to extend the BWS’s high-quality water supplies. Recycled water use from the Honouliuli Water Recycling Facility provides an alternative water supply in Ewa for irrigation and industrial purposes. Recycled water production from the BWS’s Honouliuli Water Recycling Facility averaged approximately eight million gallons per day. The BWS is seeking State of Hawaii land to construct an elevated recycled water reservoir, which will increase recycled water use in Ewa.
Operational Sustainability (Dependable)
In February 2015, the BWS conducted a customer satisfaction survey with the assistance of Ward Research. The purpose of the survey was to establish baseline measures of customer satisfaction and other factors related to how the public perceives the BWS. Overall findings indicate that the majority of Oahu residents are strongly satisfied with the BWS and have a high level of trust in the BWS.
The BWS developed and piloted a New Hire Onboarding Checklist for supervisors to supplement the orientation process and nurture the success of new employees. Onboarding gives new employees a clear understanding of the BWS’s mission and their role on the BWS’s team.
The BWS is in its third year of a three-year comprehensive Water Master Plan to provide a 30-year capital improvement program for the capacity expansion, and repair and replacement of aging water infrastructure. The Water Master Plan applies new technology and best practices in planning and engineering tools in a system-wide condition assessment of all water system assets (pumps, pipelines, reservoirs and treatment plants) and will guide the update of the BWS’s financial plan to ensure sufficient funding for infrastructure needs, while keeping water rates affordable.
In response to Federal Executive Order 13636, the BWS has increased its focus on improving critical infrastructure security and resilience. The BWS has recruited an Information Systems Security Officer (“ISSO”) to lead this focus, and has initiated activity on establishing a cybersecurity program. Preliminary assessments by the ISSO have been completed, and an in-depth assessment and strategic risk review analysis by an expert cyber security firm is underway.
The BWS’s nationally recognized Geographic Information System (“GIS”) database and applications continue to be upgraded for best in class industry functionality and performance. This system gives users access to GIS layers and updated imagery, and integrates map service sharing with other City departments. Use of aerial imagery to leverage geospatial capabilities was piloted, resulting in activities planned for fiscal year 2016 to gather and incorporate more imageries, increasing the value of the GIS.
The BWS continues to upgrade its computerized maintenance management system. Testing of the new mobile solution to be used in the field and the overall upgrade is anticipated to be completed in mid-fiscal year 2016.
The BWS’s staff responded to 294 main breaks, or about 14 breaks per 100 miles of pipeline.
The BWS’s staff helped protect Oahu’s water resources and prevent damage to the BWS’s infrastructure by handling 7,708 One Call locate requests and providing in-field support for 889 water line leaks and breaks. The BWS’s leak detection team proactively looked for and identified leaks in the BWS’s system and the used the data collected to schedule planned repairs to the water system. The BWS’s staff proactively investigated 20,857 meters to ensure accurate and timely billing and assisted 3,718 customers with concerns about bills reflecting high water consumption.
Board of Water Supply City and County of Honolulu Introduction June 30, 2015 and 2014
4
The BWS’s staff assisted 152,116 customers: 142,693 (93.8%) by phone; 4,693 (3.1%) in-person; 2,764 (1.8%) via online forms; 1,692 (1.1%) through email; and 274 (0.2%) by mail and fax. The average speed of answer for phone calls was 90 seconds and electronic inquiries were responded to within one business day.
In preparation for the upcoming construction of the Nuuanu Reservoir No. 4 Dam Improvements, the BWS elected to conduct a public fishing day, in December 2014, to help remove any fish from the reservoir before it was dredged and the water level lowered. An overwhelming 1,375 people submitted applications to participate and 160 lucky applicants were given fishing slots.
Financial Sustainability (Affordable)
More than $15 million in construction contracts and more than $3.2 million in professional services contracts were awarded by the Capital Projects Division as of June 15, 2015. The major programs include the following:
Water Main Replacement Program ‒ Aging and corroded water mains are systematically identified and replaced throughout the municipal water system to improve system reliability, reduce main breaks, and to ensure sufficient system pressure during periods of peak demand. In conjunction with main replacement projects, existing fire hydrants are replaced and new hydrants are installed to improve fire protection and ensure that current standards are met. Over $9 million in water main construction projects were awarded by the Capital Projects Division. Once completed, these projects will improve the water systems in the Nuuanu, Waianae and Wilhelmina Rise areas. Design contracts were awarded for water main replacements in Kailua, Kamehameha Heights and Moiliili.
Water Facility Improvement Program ‒ Identification and improvements of deficiencies to the appearance and integrity of the BWS’s aging water facilities continues. These facilities include water reservoirs, wells and booster stations, and administrative offices belonging to the agency. During this fiscal year, new construction contracts were awarded to repair, renovate, repaint and/or reroof the Beretania Public Service Building, Microbiological Laboratory and Parking Lot, Kalihi Pump Station, Makaha 242 Reservoirs Nos. 1 & 2, Mauna Olu 530 Nonpotable Reservoir, Pearl City 865 Reservoir, Waialae Iki Booster No.1, Waiau 285 Reservoir, Waiau 550 Reservoir, Wailupe Line Booster, and Waimalu 217 Reservoir. New design contracts were awarded for facility improvements at Kalihi Corporation Yard and installation of security fencing at various locations.
Mechanical and Electrical Renovation Projects ‒ Renovation projects ensure the dependable service and operational efficiency of the BWS’s pump and booster stations. Construction contracts were awarded for the renovation of the mechanical and/or electrical systems at the Aina Koa Booster I, Hoaeae Wells, Kaamilo Wells, Kunia Wells III, Manoa Well II, Maunawili Booster, Pacific Heights Booster, and Waipio Heights Wells II. Design contracts were awarded for renovation work at Halawa Wells and Booster No. 2, Makiki 180 Reservoir, Mililani Wells II, Moanalua Wells, Pearl City Wells I, Pearl City Wells II, Punanani Wells, Waialae Iki 180 Reservoir, and Waialae Iki Well.
Board of Water Supply City and County of Honolulu Introduction June 30, 2015 and 2014
5
In November 2014, the BWS received a low-interest loan through the Drinking Water State Revolving Funds administered by the State Department of Health. The loan was used to refinance outstanding bonds and resulted in more than $6 million of interest savings. The BWS issued $144,985,000 in water system revenue bonds on December 9, 2014. The Series 2014A and Series 2014B bonds were sold at a value of 3.36%. Combined with the savings from the bond sale, the BWS realized savings of more than $19 million in interest or nearly $1 million per year for the next 23 years. These savings will be reinvested into the BWS’s water system infrastructure, which will result in better reliability and will help offset some of its future water service improvement projects. The bond ratings from Moody’s Investors Service and Fitch Ratings are Aa2 and AA+, respectively.
The BWS’s staff received mail-in payments via lockbox, which continued to be the most popular method of payment for the BWS’s customers, with 41% using the service, down 7% from last fiscal year. Automatic bill payments account for 30% of the BWS’s total bill collections, a 5% increase from last fiscal year. Credit card payments account for 11% of payments, a 2% increase over last fiscal year. Of these credit card payments, 8% were completed online, while 3% were processed by phone or over the counter. Walk-in customers and payments made at satellite city hall locations remain steady at 3% and 4%, respectively.
Report of Independent Auditors
To the Board of Directors Board of Water Supply City and County of Honolulu
Report on the Financial Statements
We have audited the accompanying financial statements of the Board of Water Supply (the “BWS”), a component unit of the City and County of Honolulu (the “City”), as of and for the years ended June 30, 2015 and 2014, and related notes to the financial statements, which collectively comprise the BWS’s basic financial statements as listed in the index.
Managementʼs Responsibility for the Financial Statements Management is responsible for the preparation and fair presentation of these financial statements in accordance with accounting principles generally accepted in the United States of America; this includes the design, implementation and maintenance of internal control relevant to the preparation and fair presentation of financial statements that are free from material misstatement, whether due to fraud or error.
Auditorsʼ Responsibility Our responsibility is to express an opinion on these financial statements based on our audits. We conducted our audits in accordance with auditing standards generally accepted in the United States of America and the standards applicable to financial audits contained in Government Auditing Standards, issued by the Comptroller General of the United States. Those standards require that we plan and perform the audit to obtain reasonable assurance about whether the financial statements are free from material misstatement.
An audit involves performing procedures to obtain audit evidence about the amounts and disclosures in the financial statements. The procedures selected depend on the auditors’ judgment, including the assessment of the risks of material misstatement of the financial statements, whether due to fraud or error. In making those risk assessments, the auditors consider internal control relevant to the entity’s preparation and fair presentation of the financial statements in order to design audit procedures that are appropriate in the circumstances, but not for the purpose of expressing an opinion on the effectiveness of the entityʼs internal control. Accordingly, we express no such opinion. An audit also includes evaluating the appropriateness of accounting policies used and the reasonableness of significant accounting estimates made by management, as well as evaluating the overall presentation of the financial statements.
We believe that the audit evidence we have obtained is sufficient and appropriate to provide a basis for our audit opinion.

Opinion In our opinion, the financial statements referred to above present fairly, in all material respects, the financial position of the BWS as of June 30, 2015 and 2014, and the changes in its financial position and its cash flows for the years then ended in accordance with accounting principles generally accepted in the United States of America.
Other Matters
Required Supplementary Information Accounting principles generally accepted in the United States of America require that the managementʼs discussion and analysis on pages 9 through 16 and schedules of proportionate share of the net pension liability, contributions, and funding progress on pages 48 through 50 be presented to supplement the basic financial statements. Such information, although not a part of the basic financial statements, is required by the Governmental Accounting Standards Board (“GASB”) who considers it to be an essential part of financial reporting for placing the basic financial statements in an appropriate operational, economic or historical context. We have applied certain limited procedures to the required supplementary information in accordance with auditing standards generally accepted in the United States of America, which consisted of inquiries of management about the methods of preparing the information and comparing the information for consistency with management’s responses to our inquiries, the basic financial statements, and other knowledge we obtained during our audit of the basic financial statements. We do not express an opinion or provide any assurance on the information because the limited procedures do not provide us with sufficient evidence to express an opinion or provide any assurance.
Other Information Our audit was conducted for the purpose of forming an opinion on the financial statements that collectively comprise the BWS’s basic financial statements. The introductory section and supplementary information are presented for purposes of additional analysis and are not a required part of the basic financial statements.
The schedules of bonds payable and net revenue requirement are the responsibility of management and were derived from and relate directly to the underlying accounting and other records used to prepare the basic financial statements. Such information has been subjected to the auditing procedures applied in the audit of the basic financial statements and certain additional procedures, including comparing and reconciling such information directly to the underlying accounting and other records used to prepare the basic financial statements or to the basic financial statements themselves, and other additional procedures in accordance with auditing standards generally accepted in the United States of America. In our opinion, the schedules of bonds payable and net revenue requirement are fairly stated, in all material respects, in relation to the basic financial statements as a whole.
The introductory section has not been subjected to the auditing procedures applied in the audit of the basic financial statements, and, accordingly, we do not express an opinion or provide any assurance on them.
Emphasis of Matter As discussed in Note 2, the financial statements of the BWS are intended to present the financial position, the changes in financial position, and cash flows of only that portion of the governmental activities, the business-type activities, each major fund, and the aggregate remaining fund information of the City that is attributable to the transactions of the BWS. They do not purport to, and do not, present fairly the financial position of the City as of June 30, 2015, the changes in its financial position, or its cash flows for the year then ended in accordance with accounting principles generally accepted in the United States of America. Our opinion is not modified with respect to this matter.
Change in Accounting Principle As described in Note 15 to the financial statements, in 2015 the BWS adopted GASB Statement Nos. 68, Accounting and Financial Reporting for Pensions ‒ an amendment of GASB Statement No. 27, and 71, Pension Transition for Contributions Made Subsequent to the Measurement Date ‒ an amendment of GASB Statement No. 68. Our opinion is not modified with respect to this matter.
Other Reporting Required by Government Auditing Standards
In accordance with Government Auditing Standards, we have also issued our report dated December 28, 2015 on our consideration of the BWS’s internal control over financial reporting and on our tests of its compliance with certain provisions of laws, regulations, contracts and grant agreements and other matters. The purpose of that report is to describe the scope of our testing of internal control over financial reporting and compliance and the results of that testing, and not to provide an opinion on internal control over financial reporting or on compliance. That report is an integral part of an audit performed in accordance with Government Auditing Standards in considering the BWSʼs internal control over financial reporting and compliance.
Honolulu, Hawaii December 28, 2015

Management’s Discussion and Analysis

Board of Water Supply City and County of Honolulu Managementʼs Discussion and Analysis June 30, 2015 and 2014 (Unaudited)
9
This section presents the managementʼs discussion and analysis of the BWSʼs financial condition and activities for the fiscal year ended June 30, 2015. This information should be read in conjunction with the financial statements.
Financial Highlights
Implementation of GASB Statements Nos. 68 and 71 During fiscal year 2015, the BWS implemented GASB Statement Nos. 68, Accounting and Financial Reporting for Pensions – an amendment of GASB Statement No. 27, and 71, Pension Transition for Contributions Made Subsequent to the Measurement Date ‒ an amendment of GASB Statement No. 68. The adoption of Statement Nos. 68 and 71 has resulted in a prior period adjustment of the BWS’s beginning net position as of July 1, 2014 to reflect the reporting of net pension liability in accordance with the provisions of Statement No. 68 and deferred outflows of resources related to pensions in accordance with Statement No. 71. Retroactive implementation of GASB Statement No. 68 was not deemed practical by management due to the cost and timing required to obtain and analyze the activity covering fiscal year 2014.
Net position as of July 1, 2014 decreased by $62.4 million to $1.0 billion, reflecting the retrospective effect of adoption.
Net pension liability of $73.1 million, deferred outflows of resources related to pensions of $16.8 million, and deferred inflows of resources related to pensions of $8.6 million were reported as of June 30, 2015. For the fiscal year ended June 30, 2015, the BWS recognized pension expense of $9.7 million. Refer to Note 12 for more information regarding the BWS’s pension.
The BWS implemented the fourth of five scheduled rate increases in July 2014 to meet the rising costs of delivering water to customers and to continue its infrastructure repair and replacement programs. Water rates increased by approximately 9.65%, which equates to more than $5 of monthly water charges for an average single-family residential customer effective July 1, 2014.
The BWS still maintains a relatively strong financial performance with a manageable capital program. Meanwhile, management continues to carefully evaluate the BWSʼs finances to ensure optimum performance. In addition to meeting all debt covenants, outstanding debt and cash reserves were kept at levels appropriate for maintaining favorable bond ratings. Key financial highlights are listed below:
Net position increased $42.3 million in fiscal year 2015 compared to the $20.5 million increase in fiscal year 2014.
Total assets were $1.5 billion, which exceeded liabilities by $1.0 billion at June 30, 2015 and 2014.
The BWSʼs unrestricted current assets at June 30, 2015 were 4.5 times its related current liabilities compared to 3.1 times at June 30, 2014.
The BWSʼs debt to equity ratio was 31.0% and 28.7% at June 30, 2015 and 2014, respectively, indicating the continuance of capacity to issue additional debt.

Board of Water Supply City and County of Honolulu Managementʼs Discussion and Analysis June 30, 2015 and 2014 (Unaudited)
10
Overview of Financial Report
The BWS is a semi-autonomous agency of the City. The financial statements are presented using the economic resources measurement focus and the accrual basis of accounting, whereby revenues and expenses are recognized in the period earned or incurred.
Managementʼs discussion and analysis (“MD&A”) represents managementʼs analysis and comments on the BWSʼs financial condition and performance. Summary financial data, key financial and operational indicators used in the BWSʼs annual report, budget, bond resolutions, and other management tools were used for this analysis.
The basic financial statements include statements of net position, statements of revenues, expenses and change in net position, statements of cash flows, and notes to the financial statements. The statements of net position present the resources and obligations of the BWS at June 30, 2015 and 2014. The statements of revenues, expenses and change in net position presents the changes in net position for the fiscal years then ended, and the resultant ending net position balances.
The statements of cash flows present changes in cash and cash equivalents (short-term investments with original maturities of three months or less from the date of acquisition), resulting from operating, investing, capital and related financing activities, and non-capital financing activities.
The notes to the financial statements provide required disclosures and other information necessary for the fair presentation of the financial statements. The notes detail information about the BWSʼs significant accounting policies, significant account balances, related party transactions, employee benefit plans, commitments, contingencies, and other significant events. Required supplementary information on post-employment benefits other than pensions and supplementary information for outstanding bonds and net revenue requirements are also included.
Board of Water Supply City and County of Honolulu Managementʼs Discussion and Analysis June 30, 2015 and 2014 (Unaudited)
11
Results of Operations
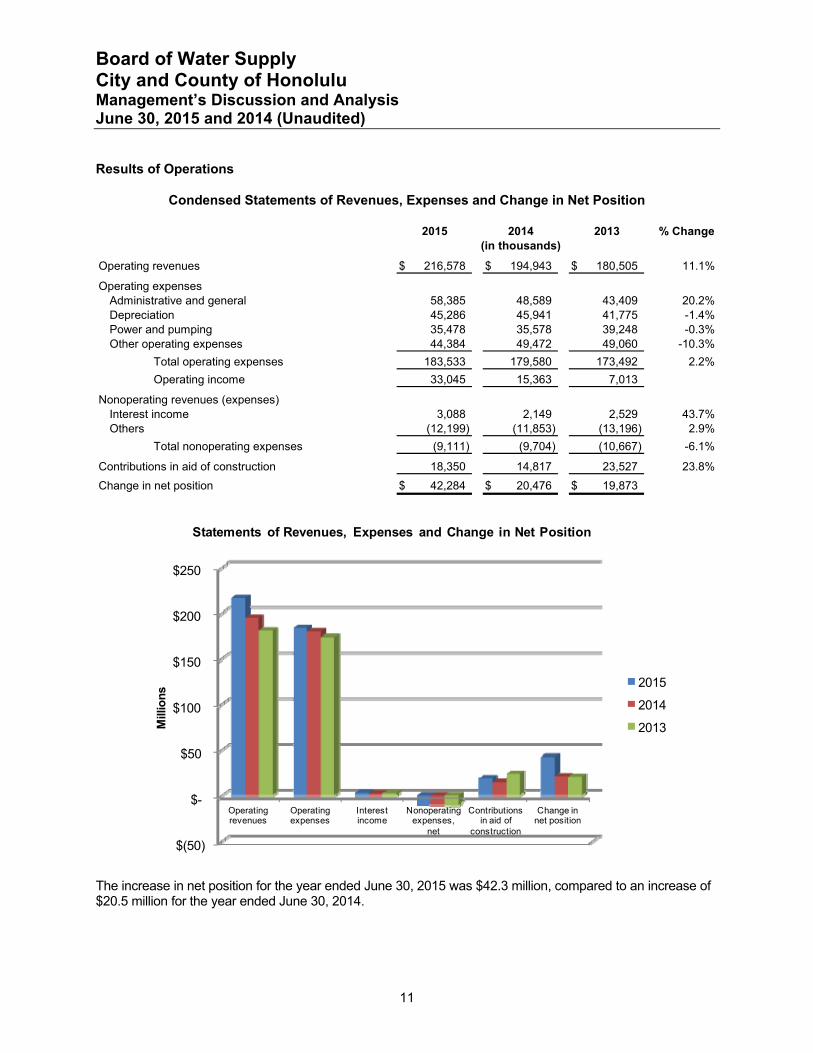
Condensed Statements of Revenues, Expenses and Change in Net Position
2015 2014 2013 % Change
Operating revenues 216,578$ 194,943$ 180,505$ 11.1%
Operating expensesAdministrative and general 58,385 48,589 43,409 20.2%Depreciation 45,286 45,941 41,775 -1.4%Power and pumping 35,478 35,578 39,248 -0.3%Other operating expenses 44,384 49,472 49,060 -10.3%
Total operating expenses 183,533 179,580 173,492 2.2%
Operating income 33,045 15,363 7,013
Nonoperating revenues (expenses)Interest income 3,088 2,149 2,529 43.7%Others (12,199) (11,853) (13,196) 2.9%
Total nonoperating expenses (9,111) (9,704) (10,667) -6.1%
Contributions in aid of construction 18,350 14,817 23,527 23.8%
Change in net position 42,284$ 20,476$ 19,873$
(in thousands)
$(50)
$-
$50
$100
$150
$200
$250
Operating revenues
Operating expenses
Interest income
Nonoperating expenses,
net
Contributions in aid of
construction
Change in net position
Mill
ion
s
Statements of Revenues, Expenses and Change in Net Position
2015
2014
2013
The increase in net position for the year ended June 30, 2015 was $42.3 million, compared to an increase of $20.5 million for the year ended June 30, 2014.
Board of Water Supply City and County of Honolulu Managementʼs Discussion and Analysis June 30, 2015 and 2014 (Unaudited)
12
Operating revenues for the year ended June 30, 2015 were $216.6 million, an increase of $21.6 million or 11.1% from the year ended June 30, 2014 revenues, due to water rate increases that were implemented on July 1, 2014. Operating revenues for the year ended June 30, 2014 were $194.9 million, an increase of $14.4 million or 8.0% from the year ended June 30, 2013 revenues, due to water rate increases that were implemented on July 1, 2013.
Total operating expenses increased by $4.0 million and $6.1 million in fiscal years 2015 and 2014, respectively. Factors contributing to this change are explained below:
Administrative and general expenses increased by $9.8 million in fiscal year 2015, mainly due to an increase in salaries, retirement health fund benefits, pension and supplies. In fiscal year 2014, administrative and general expenses increased by $5.2 million in fiscal year 2014, mainly due to an increase in salaries, retirement health fund benefits, and other contractual services.
Power and pumping expenses decreased slightly by $0.1 million in fiscal year 2015. Power and pumping expenses decreased $3.7 million during fiscal year 2014. This was primarily due to a decrease in electricity costs.
Other operating expenses decreased $5.1 million during fiscal year 2015, mainly due to a decrease in water treatment maintenance and customer accounting and collection. Other operating expenses increased slightly by $0.4 million during fiscal year 2014.
For the year ended June 30, 2015, non-operating expenses decreased slightly by $0.6 million. Nonoperating expenses decreased by $1.0 million for the year ended June 30, 2014, due primarily to an increase in fair value on investments.
Contributions in aid of construction result from water system facilities charges that are levied against all new developments and residential properties requiring water from the BWSʼs systems, except those developments that have paid for and installed a complete water system, including sources, transmission, and daily storage facilities. In addition, contributions of capital assets from governmental agencies, developers and customers are recorded as contributions in aid of construction at their cost. The BWS realized contributions in aid of construction of $18.4 million in fiscal year 2015 compared to $14.8 million in fiscal year 2014. The increase in contributions in aid of $3.5 million was due to an increase in projects completed by governmental funds of $2.6 million, a decrease in the Water Service Facilities Charge revenue (“WSFC”) of $0.3 million offset by an increase in private development contributions of $1.2 million. During the year ended June 30, 2015, the major developments completed were Ocean Pointe Area IVE and the Kapolei Parkway Urban Core 5, Kamaaha Avenue to Kamokila Boulevard.
Board of Water Supply City and County of Honolulu Managementʼs Discussion and Analysis June 30, 2015 and 2014 (Unaudited)
13
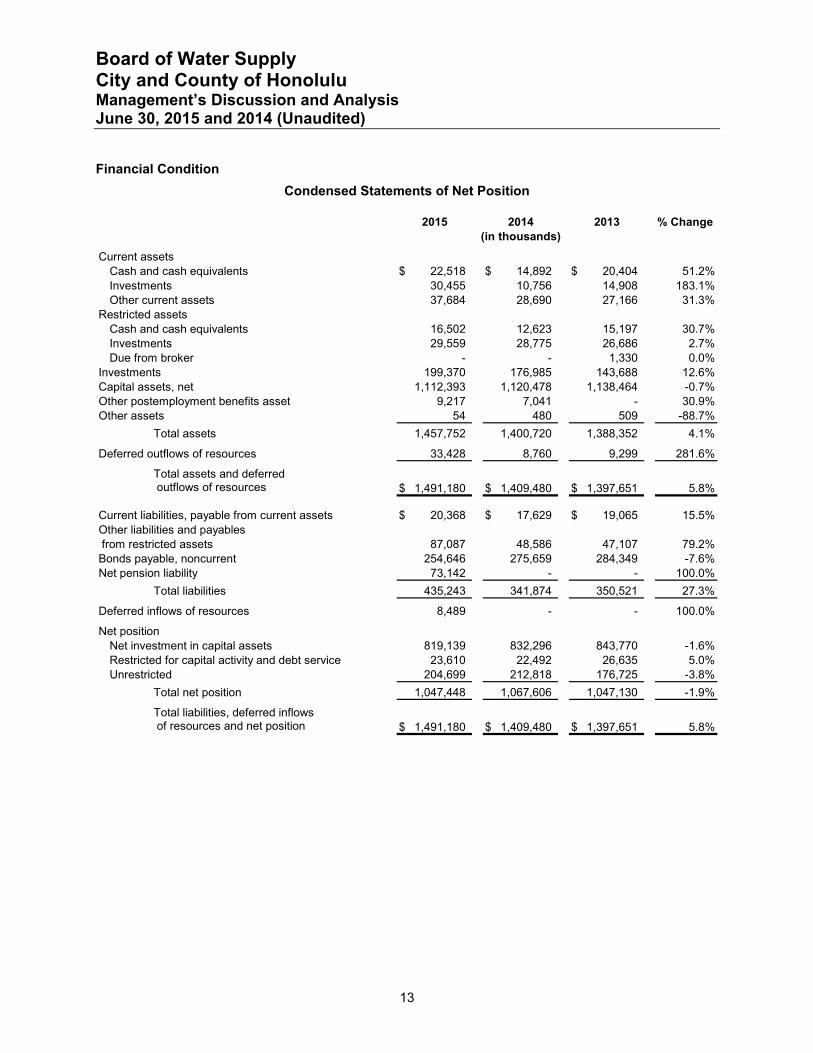
Financial Condition
Condensed Statements of Net Position
2015 2014 2013 % Change
Current assetsCash and cash equivalents 22,518$ 14,892$ 20,404$ 51.2%Investments 30,455 10,756 14,908 183.1%Other current assets 37,684 28,690 27,166 31.3%
Restricted assetsCash and cash equivalents 16,502 12,623 15,197 30.7%Investments 29,559 28,775 26,686 2.7%Due from broker - - 1,330 0.0%
Investments 199,370 176,985 143,688 12.6%Capital assets, net 1,112,393 1,120,478 1,138,464 -0.7%Other postemployment benefits asset 9,217 7,041 - 30.9%Other assets 54 480 509 -88.7%
Total assets 1,457,752 1,400,720 1,388,352 4.1%
Deferred outflows of resources 33,428 8,760 9,299 281.6%
Total assets and deferred outflows of resources
Current liabilities, payable from current assets 20,368$ 17,629$ 19,065$ 15.5%Other liabilities and payables from restricted assets 87,087 48,586 47,107 79.2%Bonds payable, noncurrent 254,646 275,659 284,349 -7.6%Net pension liability 73,142 - - 100.0%
Total liabilities 435,243 341,874 350,521 27.3%
Deferred inflows of resources 8,489 - - 100.0%
Net positionNet investment in capital assets 819,139 832,296 843,770 -1.6%Restricted for capital activity and debt service 23,610 22,492 26,635 5.0%Unrestricted 204,699 212,818 176,725 -3.8%
Total net position 1,047,448 1,067,606 1,047,130 -1.9%
Total liabilities, deferred inflows of resources and net position
(in thousands)
1,491,180$ 1,409,480$ 1,397,651$ 5.8%
1,491,180$ 1,409,480$ 1,397,651$ 5.8%

Board of Water Supply City and County of Honolulu Managementʼs Discussion and Analysis June 30, 2015 and 2014 (Unaudited)
14
$-
$50
$100
$150
$200
$250
$300
Current Restricted Noncurrent Total
Mill
ion
sCash and Investments
2015
2014
2013
The BWS’s unrestricted current assets were 4.5, 3.1 and 3.3 times its related current liabilities, payable from current assets, as of June 30, 2015, 2014 and 2013, respectively. The ratio increase at June 30, 2015 was due to an increase in cash, short-term investments, and customer receivables. The ratio decrease at June 30, 2014 was due to the purchase of long-term investments.
As of June 30, 2015 and 2014, capital assets, net decreased by $8.1 million and $18.0 million, respectively. The decreases in fiscal years 2015 and 2014 were due to construction work in progress charge-offs and depreciation charges exceeding acquisitions.
As of June 30, 2015, current liabilities payable from current assets increased by $2.7 million or 15.5%. This increase is primarily due to the timing of payments on the BWSʼs trade accounts payable.
Other liabilities and payables from restricted assets increased by $38.5 million during fiscal year 2015. The increase is primarily due to an increase in projects utilizing financing from the state revolving fund loan program.
The BWSʼs noncurrent bonds payable decreased by $21.0 million and $8.7 million as of June 30, 2015 and 2014, respectively. The decrease at June 30, 2015 was due to a partial refunding of revenue bond Series 2006A and 2006B. The decrease at June 30, 2014 represents the current bonds payable due within one year.
Board of Water Supply City and County of Honolulu Managementʼs Discussion and Analysis June 30, 2015 and 2014 (Unaudited)
15
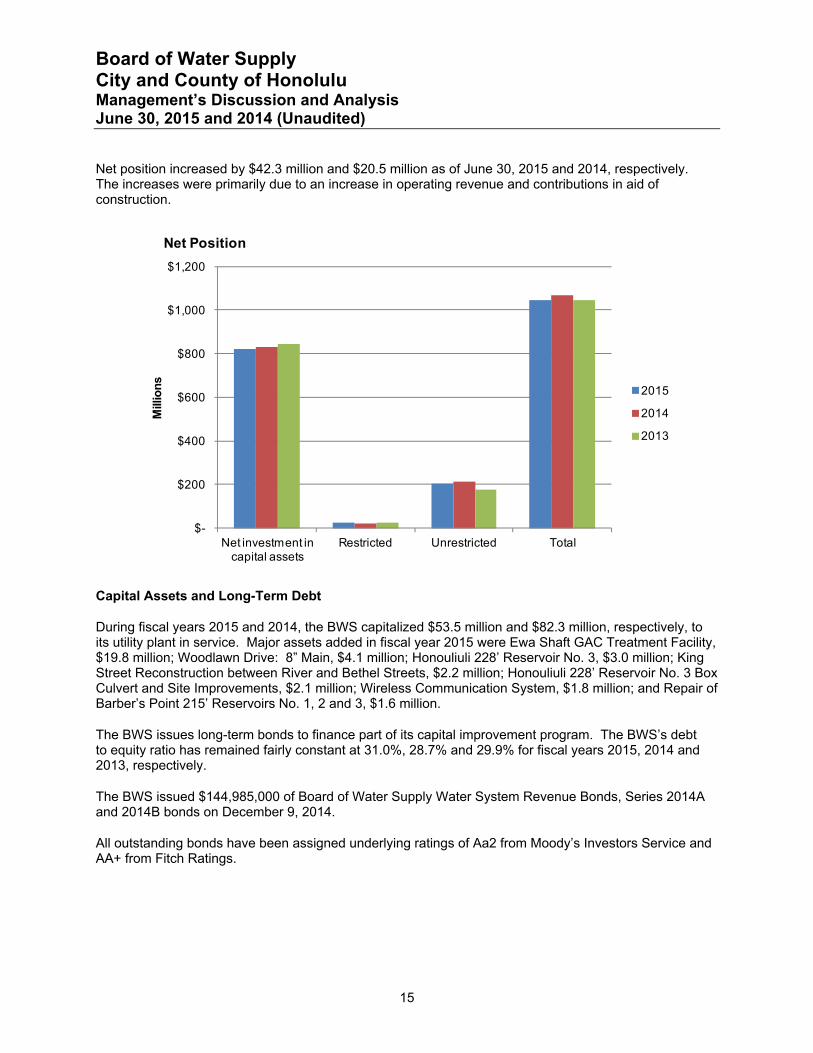
Net position increased by $42.3 million and $20.5 million as of June 30, 2015 and 2014, respectively. The increases were primarily due to an increase in operating revenue and contributions in aid of construction.
$-
$200
$400
$600
$800
$1,000
$1,200
Net investment in capital assets
Restricted Unrestricted Total
Mill
ion
s
Net Position
2015
2014
2013
Capital Assets and Long-Term Debt
During fiscal years 2015 and 2014, the BWS capitalized $53.5 million and $82.3 million, respectively, to its utility plant in service. Major assets added in fiscal year 2015 were Ewa Shaft GAC Treatment Facility, $19.8 million; Woodlawn Drive: 8” Main, $4.1 million; Honouliuli 228’ Reservoir No. 3, $3.0 million; King Street Reconstruction between River and Bethel Streets, $2.2 million; Honouliuli 228’ Reservoir No. 3 Box Culvert and Site Improvements, $2.1 million; Wireless Communication System, $1.8 million; and Repair of Barber’s Point 215’ Reservoirs No. 1, 2 and 3, $1.6 million.
The BWS issues long-term bonds to finance part of its capital improvement program. The BWSʼs debt to equity ratio has remained fairly constant at 31.0%, 28.7% and 29.9% for fiscal years 2015, 2014 and 2013, respectively.
The BWS issued $144,985,000 of Board of Water Supply Water System Revenue Bonds, Series 2014A and 2014B bonds on December 9, 2014.
All outstanding bonds have been assigned underlying ratings of Aa2 from Moodyʼs Investors Service and AA+ from Fitch Ratings.

Board of Water Supply City and County of Honolulu Managementʼs Discussion and Analysis June 30, 2015 and 2014 (Unaudited)
16
Rate Covenant
The BWS is required under its bond indenture, among other things, to fix, charge and collect such rates and other charges in each fiscal year to meet the net revenue requirement for such fiscal year. The net revenue requirement is the greater of 1) the sum of the aggregate debt service and all deposits required by bond resolution to be made, or 2) 1.20 times the aggregate debt service. The BWS met the net revenue requirements for the fiscal years ended June 30, 2015 and 2014.
Currently Known Facts, Decisions or Conditions
Effective July 1, 2015, the BWS increased its water rates by approximately 9.65%.
Request for Information
This financial report is designed to provide a general overview of the BWSʼs finances. Questions concerning any of the information provided in this report or requests for additional financial information should be addressed to the Board of Water Supply, City and County of Honolulu, 630 S. Beretania Street, Honolulu, Hawaii 96813.

Financial Statements
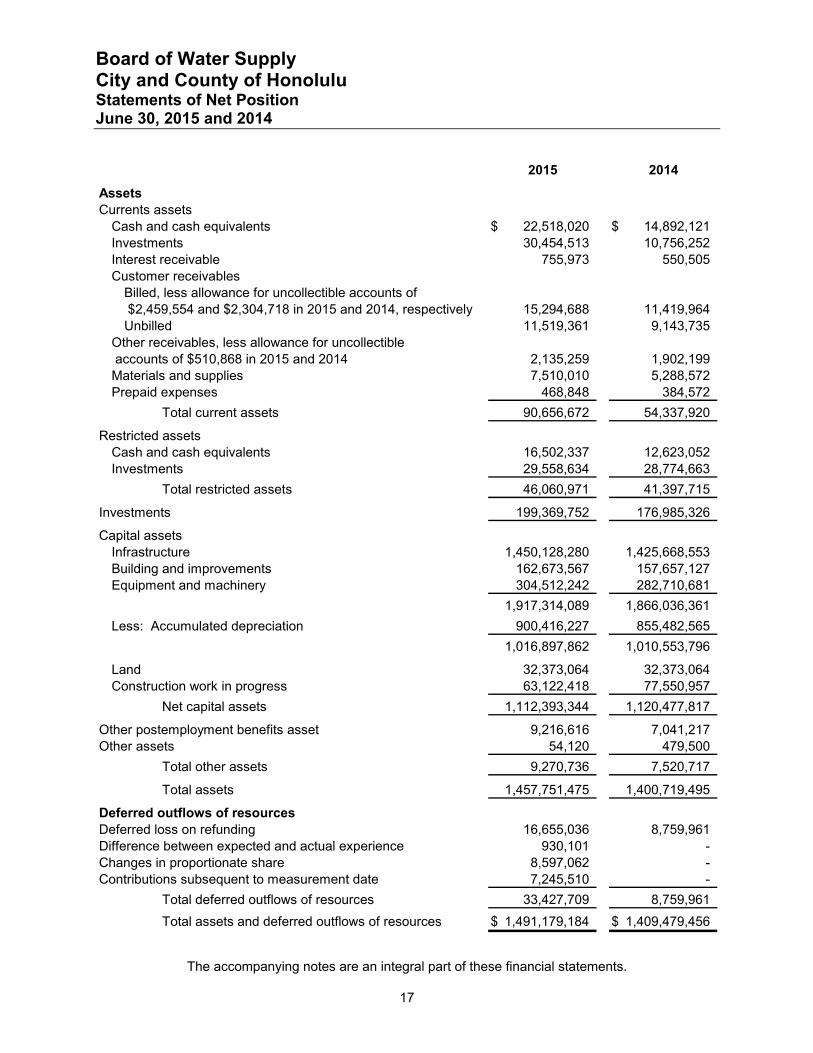
Board of Water Supply City and County of Honolulu Statements of Net Position June 30, 2015 and 2014
The accompanying notes are an integral part of these financial statements.
17
2015 2014
AssetsCurrents assets
Cash and cash equivalents 22,518,020$ 14,892,121$ Investments 30,454,513 10,756,252Interest receivable 755,973 550,505Customer receivables
Billed, less allowance for uncollectible accounts of $2,459,554 and $2,304,718 in 2015 and 2014, respectively 15,294,688 11,419,964Unbilled 11,519,361 9,143,735
Other receivables, less allowance for uncollectible accounts of $510,868 in 2015 and 2014 2,135,259 1,902,199Materials and supplies 7,510,010 5,288,572Prepaid expenses 468,848 384,572
Total current assets 90,656,672 54,337,920
Restricted assetsCash and cash equivalents 16,502,337 12,623,052Investments 29,558,634 28,774,663
Total restricted assets 46,060,971 41,397,715
Investments 199,369,752 176,985,326
Capital assetsInfrastructure 1,450,128,280 1,425,668,553Building and improvements 162,673,567 157,657,127Equipment and machinery 304,512,242 282,710,681
1,917,314,089 1,866,036,361
Less: Accumulated depreciation 900,416,227 855,482,565
1,016,897,862 1,010,553,796
Land 32,373,064 32,373,064Construction work in progress 63,122,418 77,550,957
Net capital assets 1,112,393,344 1,120,477,817
Other postemployment benefits asset 9,216,616 7,041,217Other assets 54,120 479,500
Total other assets 9,270,736 7,520,717
Total assets 1,457,751,475 1,400,719,495
Deferred outflows of resourcesDeferred loss on refunding 16,655,036 8,759,961Difference between expected and actual experience 930,101 -Changes in proportionate share 8,597,062 -Contributions subsequent to measurement date 7,245,510 -
Total deferred outflows of resources 33,427,709 8,759,961
Total assets and deferred outflows of resources 1,491,179,184$ 1,409,479,456$

Board of Water Supply City and County of Honolulu Statements of Net Position June 30, 2015 and 2014
The accompanying notes are an integral part of these financial statements.
18
2015 2014
LiabilitiesCurrent liabilities
Payable from current assetsAccounts payable 9,376,063$ 8,901,932$ Contracts payable, including retainages 4,948,876 5,187,199Accrued vacation, current 2,761,628 2,666,607Other 3,281,623 873,142
Total payable from current assets 20,368,190 17,628,880
Payable from restricted assetsContracts payable, including retainages 2,621,828 2,914,254Accrued interest payable 5,269,156 6,596,473Bonds payable, current 7,810,000 7,660,000Notes payable, current 3,748,230 1,735,067
Total payable from restricted assets 19,449,214 18,905,794
Total current liabilities 39,817,404 36,534,674
Other liabilitiesCustomer advances 1,693,846 929,732Accrued vacation, noncurrent 3,946,481 4,004,681Accrued workersʼ compensation 2,571,877 2,051,526Notes payable, noncurrent 58,264,967 21,283,365Accrued arbitrage rebate 65,888 65,888Other 1,094,266 1,344,987
Total other liabilities 67,637,325 29,680,179
Bonds payable, noncurrent 254,646,203 275,659,041Net pension liability 73,141,824 -
Total liabilities 435,242,756 341,873,894
Deferred inflows of resourcesDifference between projected and actual earnings on pension plan 8,488,509 -
Total deferred inflows of resources 8,488,509 -
Commitments and contingencies
Net PositionNet investment in capital assets 819,139,210 832,295,372Restricted for capital activity and debt service 23,609,757 22,491,921Unrestricted 204,698,952 212,818,269
Total net position 1,047,447,919 1,067,605,562
Total liabilities, deferred inflows of resources and net position 1,491,179,184$ 1,409,479,456$
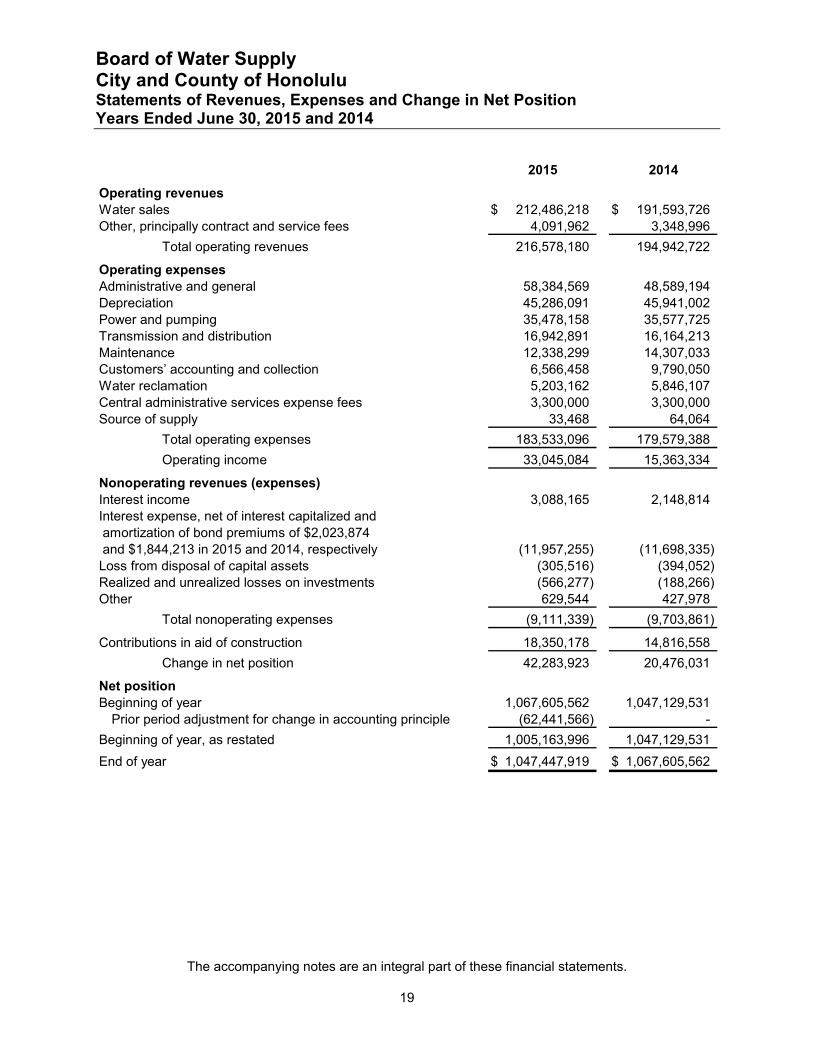
Board of Water Supply City and County of Honolulu Statements of Revenues, Expenses and Change in Net Position Years Ended June 30, 2015 and 2014
The accompanying notes are an integral part of these financial statements.
19
2015 2014
Operating revenues Water sales 212,486,218$ 191,593,726$ Other, principally contract and service fees 4,091,962 3,348,996
Total operating revenues 216,578,180 194,942,722
Operating expensesAdministrative and general 58,384,569 48,589,194Depreciation 45,286,091 45,941,002Power and pumping 35,478,158 35,577,725Transmission and distribution 16,942,891 16,164,213Maintenance 12,338,299 14,307,033Customersʼ accounting and collection 6,566,458 9,790,050Water reclamation 5,203,162 5,846,107Central administrative services expense fees 3,300,000 3,300,000Source of supply 33,468 64,064
Total operating expenses 183,533,096 179,579,388
Operating income 33,045,084 15,363,334
Nonoperating revenues (expenses)Interest income 3,088,165 2,148,814Interest expense, net of interest capitalized and amortization of bond premiums of $2,023,874 and $1,844,213 in 2015 and 2014, respectively (11,957,255) (11,698,335)Loss from disposal of capital assets (305,516) (394,052)Realized and unrealized losses on investments (566,277) (188,266)Other 629,544 427,978
Total nonoperating expenses (9,111,339) (9,703,861)
Contributions in aid of construction 18,350,178 14,816,558
Change in net position 42,283,923 20,476,031
Net positionBeginning of year 1,067,605,562 1,047,129,531
Prior period adjustment for change in accounting principle (62,441,566) -
Beginning of year, as restated 1,005,163,996 1,047,129,531
End of year 1,047,447,919$ 1,067,605,562$

Board of Water Supply City and County of Honolulu Statements of Cash Flows Years Ended June 30, 2015 and 2014
The accompanying notes are an integral part of these financial statements.
20
2015 2014
Cash flows from operating activitiesCash received from customers 212,362,274$ 187,886,180$ Cash payments to suppliers for goods and services (86,387,085) (95,925,067)Cash payments to employees for services (50,218,007) (44,333,099)Other income, net 629,544 427,978
Net cash provided by operating activities 76,386,726 48,055,992
Cash flows from capital and related financing activitiesAcquisition and construction of capital assets, net of contributions in aid of construction (30,600,185) (17,731,993)Customer payments for capital projects 10,422,675 7,320,479Principal paid on bonds (34,060,911) (7,335,000)Interest paid on bonds (8,980,725) (13,011,177)Proceeds from notes payable 41,648,722 3,428,392Interest paid on notes payable (106,923) (100,506)Principal paid on notes payable (2,653,957) (1,608,357)
Net cash used in capital and related financing activities (24,331,304) (29,038,162)
Cash flows from investing activitiesPurchase of investments (194,511,840) (162,896,293)Proceeds from maturities of investments 151,078,905 133,643,657Interest on investments 2,882,697 2,148,859
Net cash used in investing activities (40,550,238) (27,103,777)
Net increase (decrease) in cash and cash equivalents 11,505,184 (8,085,947)
Cash and cash equivalentsBeginning of year 27,515,173 35,601,120
End of year (including $16,502,337 and $12,623,052 in restricted assets in 2015 and 2014, respectively) 39,020,357$ 27,515,173$
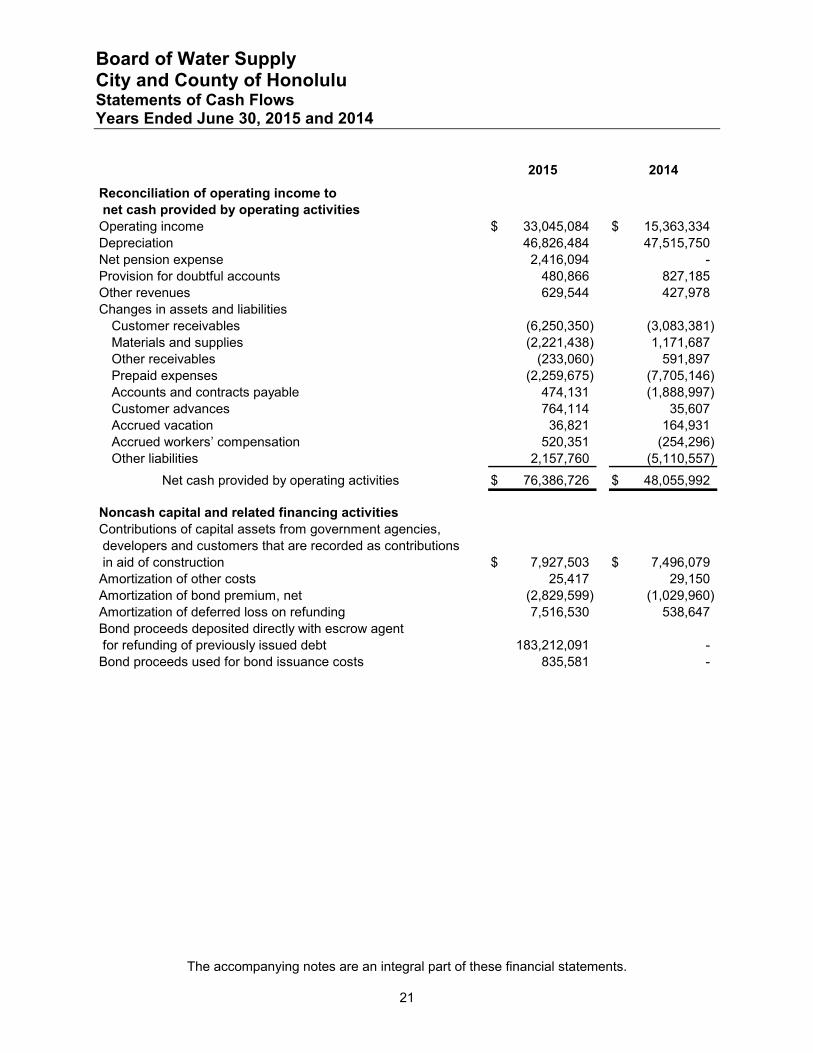
Board of Water Supply City and County of Honolulu Statements of Cash Flows Years Ended June 30, 2015 and 2014
The accompanying notes are an integral part of these financial statements.
21
2015 2014
Reconciliation of operating income to net cash provided by operating activitiesOperating income 33,045,084$ 15,363,334$ Depreciation 46,826,484 47,515,750Net pension expense 2,416,094 -Provision for doubtful accounts 480,866 827,185Other revenues 629,544 427,978Changes in assets and liabilities
Customer receivables (6,250,350) (3,083,381)Materials and supplies (2,221,438) 1,171,687Other receivables (233,060) 591,897Prepaid expenses (2,259,675) (7,705,146)Accounts and contracts payable 474,131 (1,888,997)Customer advances 764,114 35,607Accrued vacation 36,821 164,931Accrued workersʼ compensation 520,351 (254,296)Other liabilities 2,157,760 (5,110,557)
Net cash provided by operating activities 76,386,726$ 48,055,992$
Noncash capital and related financing activitiesContributions of capital assets from government agencies, developers and customers that are recorded as contributions in aid of construction 7,927,503$ 7,496,079$ Amortization of other costs 25,417 29,150Amortization of bond premium, net (2,829,599) (1,029,960)Amortization of deferred loss on refunding 7,516,530 538,647Bond proceeds deposited directly with escrow agent for refunding of previously issued debt 183,212,091 -Bond proceeds used for bond issuance costs 835,581 -
Board of Water Supply City and County of Honolulu Notes to Financial Statements June 30, 2015 and 2014
22
1. Operations
The Revised Charter of the City and County of Honolulu provides for the operation of the Board of Water Supply (the “BWS”) as a semi-autonomous body of the City and County of Honolulu government (the “City”). The BWS has full and complete authority to manage, control and operate the Cityʼs water system and related properties.
2. Summary of Significant Accounting Policies
Financial Statement Presentation, Measurement Focus and Basis of Accounting The BWS is a component unit of the City (the “primary government”). The accompanying financial statements present only the activities of the BWS and do not include other organizations, activities and functions of the City.
The accounting policies of the BWS conform to U.S. generally accepted accounting principles as applicable to enterprise activities of governmental units as promulgated by the Governmental Accounting Standards Board (“GASB”). The accompanying financial statements are presented using the economic resources measurement focus and the accrual basis of accounting. Revenues are recorded when earned and expenses are recorded at the time liabilities are incurred.
The BWS distinguishes operating revenues and expenses from nonoperating items. Operating revenues and expenses generally result from providing services in connection with the BWSʼs principal ongoing water operations. The principal operating revenues are from charges for water usage, while operating expenses include cost of services, administrative expenses, and depreciation on capital assets. All revenues and expenses not meeting this definition are reported as nonoperating revenues and expenses.
Use of Estimates The preparation of the financial statements in conformity with accounting principles generally accepted in the United States of America requires management to make estimates and assumptions that affect the reported amounts of assets and liabilities and disclosure of contingent assets and liabilities at the date of the financial statements and the reported amounts of revenues and expenses during the reporting period. Significant items subject to such estimates and assumptions include the carrying amount of capital assets, valuation allowances for receivables, accrued workers’ compensation, and postretirement benefits. Actual results could differ from those estimates.
Regulation and Water Rates Article VII of the Revised Charter of the City and County of Honolulu (“City Charter”) states that the BWSʼs seven-member Board of Directors has the authority to establish and adjust water rates and charges so that the revenues derived shall be sufficient to make the BWS self-supporting. The Board of Directors is required to follow certain procedures that include holding public hearings before implementing changes in the water rate schedules.
Cash and Cash Equivalents The BWS considers all cash on hand, demand deposits, and short-term investments including restricted assets with original maturities of three months or less from the date of acquisition to be cash and cash equivalents.
Board of Water Supply City and County of Honolulu Notes to Financial Statements June 30, 2015 and 2014
23
Investments Investments are stated at fair value, which are based on quoted market prices. The cost of securities sold is generally determined by the weighted average method.
Receivables Receivables are recorded at the invoiced amount and do not bear interest. The allowance for doubtful accounts is the BWSʼs best estimate of the amount of probable credit losses in the BWSʼs existing receivables. The BWS determines the allowance based on historical write-off experience. Account balances are charged off against the allowance after all means of collection have been exhausted and the potential for recovery is considered remote.
Materials and Supplies Materials and supplies are stated at the lower of weighted average cost or market. The weighted average cost method approximates the first-in, first-out method. The cost of materials and supplies are recorded as expenses when consumed rather than when purchased.
Restricted Assets Restricted assets are comprised of cash and cash equivalents and investments maintained in accordance with bond resolutions and other agreements for the purpose of funding certain debt service payments, construction, improvements, and renewal and replacements of the water system. When both restricted and unrestricted assets are available for use, it is the BWSʼs policy to use restricted assets first, then unrestricted assets as they are needed. Restricted assets comprise the following:
The debt service account accumulates transfers from the operating account throughout the fiscal year to make principal and interest payments on the outstanding water revenue bonds and other notes payable.
The renewal and replacement account provides funding for improvements, reconstruction, emergency or extraordinary repairs, and renewals or replacements of the water system.
The improvement account holds the proceeds of the series bond issuance pursuant to the series resolution or series certificates. These proceeds are only applied to costs specified in the applicable series resolution or series certificates.
The extramural account holds reimbursements received from any governmental agency or private entity, pursuant to negotiated agreements, contracts and/or grants.
Capital Assets Capital assets include those assets in excess of $5,000 for buildings, structures, infrastructure, and equipment and machinery with a useful life of more than one year. Capital assets are stated at cost and include contributions by governmental agencies, private subdividers and customers at their cost or estimated cost of new construction.
Major replacements, renewals and betterments are capitalized. Interest costs are capitalized during the construction period of major capital projects. Interest costs incurred in the years ended June 30, 2015 and 2014 totaled $13,981,000 and $13,543,000, respectively. Capitalized interest costs approximated $716,000 and $814,000 for the years ended June 30, 2015 and 2014, respectively. The BWS also capitalizes certain indirect costs to construction work based upon actual construction direct labor. Maintenance, repairs and replacements that do not improve or extend the lives of the assets are charged to expense.

Board of Water Supply City and County of Honolulu Notes to Financial Statements June 30, 2015 and 2014
24
Assets are depreciated over the individual assets’ estimated useful lives using the straight-line method. Depreciation on both purchased and contributed assets is charged against operations.
The estimated useful lives of capital assets are as follows:
Source of supply 20 to 100 yearsPumping plant 20 to 50 yearsWater treatment plant 20 to 30 yearsTransmission and distribution plant 13⅓ to 50 yearsGeneral plant 5 to 50 years
Gains or losses resulting from the sale, retirement or disposal of capital assets in service are charged or credited to operations.
Bond Issue Prepaid Insurance Costs, Original Issue Discount or Premium, and Deferred Loss on Refundings Bond issue costs are expensed when incurred, except for prepaid insurance costs related to bond issuance, which are amortized over the life of the respective issue on a straight-line basis. Original issue discount or premium and deferred loss on refunding are also amortized using the straight-line method over the terms of the respective issues. Original issue discount or premium are added to or offset against bonds payable in the statements of net position.
Accrued Vacation and Compensatory Pay Vacation is earned at the rate of one and three-quarters working days for each month of service. Vacation days may be accumulated to a maximum of ninety days as of the end of the calendar year and are convertible to pay upon termination.
The BWS accrues a liability for compensated absences and additional amounts for certain salary-related payments including payroll taxes and fringe benefits.
As of June 30, 2015 and 2014, accumulated sick leave aggregated approximately $18,310,000 and $18,240,000, respectively. Sick leave accumulates at the rate of one and three-quarters working days for each month of service without limit, but can be taken only in the event of illness and is not convertible to pay upon termination of employment. However, an employee who retires or leaves government service in good standing with 60 or more unused sick days is entitled to additional service credit in the State of Hawaii’s Employees’ Retirement System.
Water System Facilities Charge A water system facilities charge is levied against all new developments and residential properties requiring water from the BWSʼs systems, except those developments that have paid for and installed a complete water system, including source, transmission and daily storage facilities. The amounts collected are initially recorded as customer advances and are recognized as contributions in aid of construction when water service is made available to the customer. The use of these funds is designated for the construction of water facilities.
Board of Water Supply City and County of Honolulu Notes to Financial Statements June 30, 2015 and 2014
25
Net Position Net position comprises the various net earnings from operating and nonoperating revenues, expenses, and contributions in aid of construction. Net position is classified in the following three components: net investment in capital assets; restricted for capital activity and debt service; and unrestricted net position. Net investment in capital assets, consists of capital assets, net of accumulated depreciation and reduced by outstanding debt that is attributable to the acquisition, construction or improvement of those assets. Debt related to unspent proceeds or other restricted cash and investments at year-end is not included in the calculation of net investment in capital assets. Restricted for capital activity and debt service consists of net position for which constraints are placed thereon by external parties, such as lenders, grantors, contributors, laws, regulations and enabling legislation. Unrestricted consists of the remaining balance not included in the above categories.
Revenue Recognition The BWSʼs policy is to bill customers on a cyclical monthly basis for water usage. The accrual for unbilled water revenues and related receivables reflected in the accompanying financial statements is based on estimated usage from the latest meter reading date to the end of the fiscal period.
Contributions in Aid of Construction Contributions in aid of construction represent cash or capital assets received by the BWS to aid in the construction of infrastructure assets. Contributions in aid of construction are recognized when they are accepted by the BWS and when all applicable eligibility requirements have been met.
Pension Expense During fiscal year 2015, BWS implemented GASB Statement Nos. 68, Accounting and Financial Reporting for Pensions ‒ an amendment of GASB Statement No. 27, and 71, Pension Transition for Contributions Made Subsequent to the Measurement Date ‒ an amendment of GASB Statement No. 68, as described in Note 15. For purposes of measuring the net pension liability, deferred outflows of resources and deferred inflows of resources related to pensions, and pension expense, as of and for the year ended June 30, 2015, information about the fiduciary net position of the Employees’ Retirement System of the State of Hawaii (“ERS”) and additions to/deductions from the ERS’s fiduciary net position have been determined on the same basis as they are reported by the ERS. For this purpose, benefit payments (including refunds of employee contributions) are recognized when due and payable in accordance with benefit terms. Investments are reported at their fair value.
Retroactive implementation of GASB Statement No. 68 was not deemed practical due to the cost and timing required to obtain and analyze the activity covering fiscal year 2014. As such, the BWS’s fiscal year 2014 financial statements are presented in accordance with GASB Statement No. 27. The BWSʼs contributions to the ERS are based upon actuarial computations and include current service costs and amortization of prior service costs. The BWSʼs policy is to fund pension costs accrued.
Deferred Compensation Plan All full-time employees are eligible to participate in the City and County of Honolulu’s Public Employees’ Deferred Compensation Plan (the “Plan”), adopted pursuant to Internal Revenue Code Section 457. The Plan permits eligible employees to defer a portion of their salary until future years. The deferred compensation amounts are not available to employees until termination, retirement, death or unforeseeable emergency.

Board of Water Supply City and County of Honolulu Notes to Financial Statements June 30, 2015 and 2014
26
A trust fund was established to protect plan assets from claims of general creditors and from diversion to any uses other than paying benefits to participants and beneficiaries. Accordingly, the BWS has excluded the Plan’s assets and liabilities from the financial statements because the BWS and the City do not have significant administrative involvement in the Plan or perform the investment function for the Plan.
Risk Management The BWS is exposed to various risks of loss from: (1) torts, (2) theft of, damage to, and destruction of assets, (3) employee injuries and illnesses, (4) natural disasters, and (5) employee health, dental and accident benefits. Commercial insurance coverage is purchased for claims arising from such matters.
The ranges of insurance limits and deductibles are as follows:
LimitsPolicy (Millions) Deductibles
Property 60$ 50,000$ Public Entity Liability 15 750,000Excess Workersʼ Compensation 25 600,000Employment Practices 5 75,000Storage Tank Liability 2 10,000Pollution Legal Liability 5 250,000Crime 5 25,000
New Accounting Pronouncements The GASB issued Statement No. 68, which became effective for reporting periods beginning after June 15, 2014. The Statement revises and establishes new financial reporting requirements for most governments that provide their employees with pension benefits. Management has adopted the new standard as presented in the BWS’s financial statements as of and for the year ended June 30, 2015.
The GASB issued Statement No. 71, which became effective for reporting periods beginning after June 15, 2014. The Statement amends and addresses an issue regarding application of the transition provisions of Statement No. 68. Management has adopted the new standard as presented in the BWS’s financial statements.
The GASB issued Statement No. 72, Fair Value Measurement and Application. The Statement will enhance comparability of financial statements among governments by requiring measurement of certain assets and liabilities at fair value using a consistent and more detailed definition of fair value and accepted valuation techniques. The Statement will also enhance fair value application guidance and disclosure. The requirements of this Statement are effective for reporting periods beginning after June 15, 2015. Management has not yet determined the effect this Statement will have on the BWSʼs financial statements.
The GASB issued Statement No. 73, Accounting and Financial Reporting for Pensions and Related Assets that are not within the Scope of GASB Statement 68, and Amendments to Certain Provisions of GASB Statements 67 and 68. The Statement establishes accounting and financial reporting requirements by employers and governmental nonemployer contributing entities for pensions that are not within the scope of Statement No. 68. The requirements of this Statement are effective for reporting periods beginning after June 15, 2015, except those provisions that
Board of Water Supply City and County of Honolulu Notes to Financial Statements June 30, 2015 and 2014
27
address employers and governmental nonemployer contributing entities for pensions that are not within the scope of Statement No. 68, which are effective for fiscal years beginning after June 15, 2016. Earlier adoption is encouraged. Management has not yet determined the effect this Statement will have on the BWSʼs financial statements.
The GASB issued Statement No. 74, Financial Reporting for Postemployment Benefit Plans Other than Pension Plans. The Statement replaces GASB Statement Nos. 43, Financial Reporting for Postemployment Benefit Plans Other Than Pension Plans, and 57, OPEB Measurements by Agent Employers and Agent Multiple-Employer Plans. The Statement addresses the financial reports of defined benefit other post-employment benefit plans that are administered through trusts that meet specified criteria. The requirements of this Statement are effective for reporting periods beginning after June 15, 2016. Management has not yet determined the effect this Statement will have on the BWSʼs financial statements.
The GASB issued Statement No. 75, Accounting and Financial Reporting for Postemployment Benefits Other Than Pensions. The Statement replaces GASB Statement Nos. 45, Accounting and Financial Reporting by Employers for Postemployment Benefits Other Than Pensions, and 57, OPEB Measurements by Agent Employers and Agent Multiple-Employer Plans. The Statement will require governments to report a liability on the face of the financial statements for the other post-employment benefits that they provide. The requirements of this Statement are effective for reporting periods beginning after June 15, 2017. Management has not yet determined the effect this Statement will have on the BWSʼs financial statements.
The GASB issued Statement No. 76, The Hierarchy of Generally Accepted Accounting Principles for State and Local Governments. The Statement reduces the generally accepted accounting principles (“GAAP”) to two categories of authoritative GAAP. The first category of authoritative GAAP consists of GASB Statements of Governmental Accounting Standards. The second category includes GASB Implementation Guides, GASB Technical Bulletins, and guidance from the American Institute of Certified Public Accountants that is cleared by the GASB. The requirements of this Statement are effective for reporting periods beginning after June 15, 2015. Management has not yet determined the effect this Statement will have on the BWSʼs financial statements.
The GASB issued Statement No. 77, Tax Abatement Disclosures. The Statement establishes financial reporting standards for tax abatement agreements entered into by state and local governments. The requirements of this Statement are effective for reporting periods beginning after December 15, 2015. Management has determined that this Statement will not have an effect on BWSʼs financial statements.
The GASB issued Statement No. 78, Pensions Provided through Certain Multiple-Employer Defined Benefit Pension Plans. The Statement amends the scope and applicability of Statement No. 68 to exclude certain pensions provided to employees of state or local governmental employers through a cost-sharing multiple-employer defined benefit pension. The requirements of this Statement are effective for reporting periods beginning after December 15, 2015. Management has not yet determined the effect this Statement will have on the BWSʼs financial statements.
The GASB issued Statement No. 79, Certain External Investment Pools and Pool Participants. The Statement addresses how certain state and local government external investment pools ‒ and participants in those pools ‒ may measure and report their investments. The requirements of this Statement are effective for reporting periods beginning after June 15, 2015, except for certain
Board of Water Supply City and County of Honolulu Notes to Financial Statements June 30, 2015 and 2014
28
provisions, which are effective for reporting periods beginning after December 15, 2015. This Statement is not expected to have a material effect on the BWS’s financial statements.
3. Cash and Investments
Cash deposited with the City is maintained in separate accounts by the Department of Budget and Fiscal Services of the City. The Hawaii Revised Statutes (“HRS”) provide for the City’s Director of Finance to deposit the cash with any national or state bank or federally insured financial institution authorized to do business in the State of Hawaii, provided that all deposits are fully insured or collateralized. The City’s demand deposits are fully insured or collateralized with securities held by the City or its agents in the City’s name. The HRS authorizes the BWS to invest, with certain restrictions, in obligations of the State of Hawaii or the United States, in federally insured savings accounts, time certificates of deposit, and bank repurchase agreements with federally insured financial institutions authorized to do business in the State of Hawaii.
The BWSʼs portfolio is managed by various investment managers. These investments consist of U.S. government and government-sponsored enterprises securities. Investments and securities issued by U.S. government-sponsored enterprises are recorded at fair value based on quoted market prices.
Interest Rate Risk Interest rate risk is the risk that changes in interest rates will adversely affect the fair value of an investment. Generally, the longer the term of an investment, the greater the sensitivity of its fair value to changes in market interest rates. As a means of limiting its exposure to fair value losses, the BWS invests operating funds primarily in shorter-term securities, money market mutual funds, or similar investment pools.
Credit Risk Generally, credit risk is the risk that an issuer of an investment will not fulfill its obligation to the holder of the investment. This is measured by the assignment of a rating by a nationally recognized statistical rating organization. U.S. government securities or obligations explicitly guaranteed by the U.S. government are not considered to have credit risk exposure. Because the BWS invests primarily in obligations of the U.S. government or U.S. government-sponsored enterprises, it is not exposed to significant credit risk.
Custodial Credit Risk Custodial credit risk for investments is the risk that, in the event of a failure of the counterparty to a transaction, the BWS will not be able to recover the value of investments or collateral securities that are in the possession of an outside party. All investments are registered in the name of the BWS and are held in the possession of a broker-dealer firm. At June 30, 2015, approximately $4,839,000 in cash and cash equivalents and all investments were held by a broker-dealer firm. Cash, cash equivalents and investments held by the broker-dealer firm are insured up to $500,000, of which up to $250,000 may be uninvested cash, by the Securities Investor Protection Corporation. Excess coverage purchased from a private insurer by the broker-dealer firm is designed to provide additional protection up to an aggregate loss limit of $1 billion for all customer claims.
Board of Water Supply City and County of Honolulu Notes to Financial Statements June 30, 2015 and 2014
29
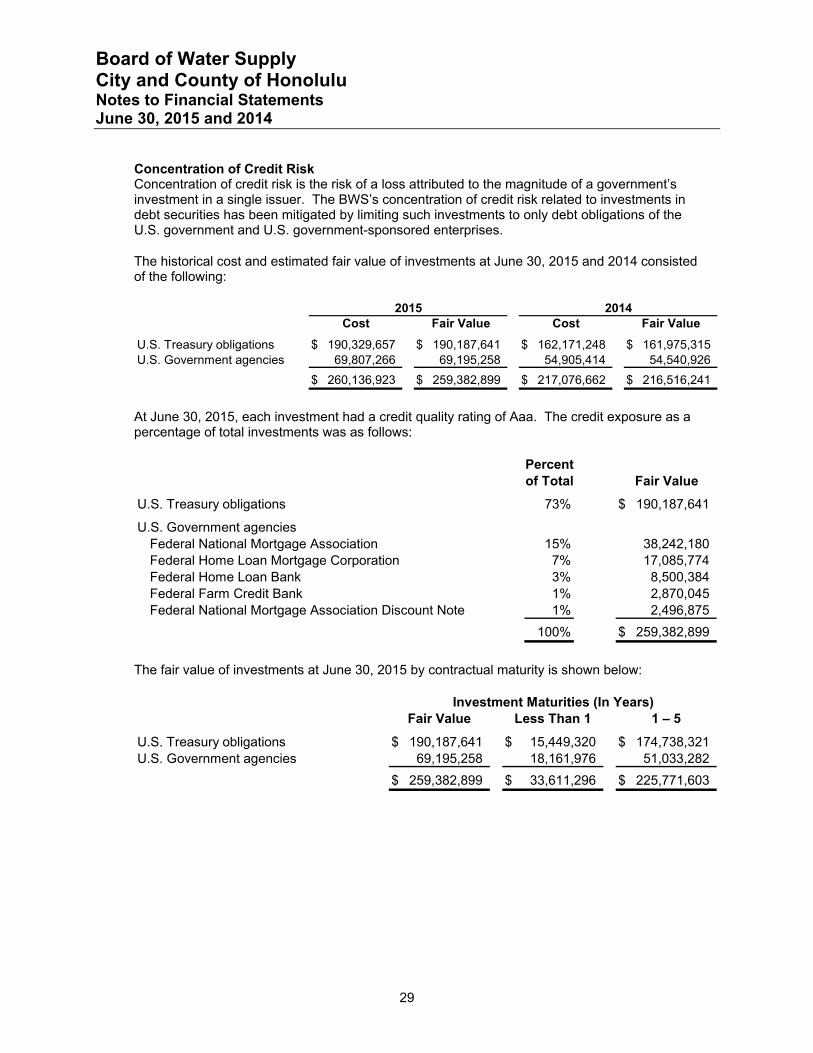
Concentration of Credit Risk Concentration of credit risk is the risk of a loss attributed to the magnitude of a government’s investment in a single issuer. The BWSʼs concentration of credit risk related to investments in debt securities has been mitigated by limiting such investments to only debt obligations of the U.S. government and U.S. government-sponsored enterprises.
The historical cost and estimated fair value of investments at June 30, 2015 and 2014 consisted of the following:
Cost Fair Value Cost Fair Value
U.S. Treasury obligations 190,329,657$ 190,187,641$ 162,171,248$ 161,975,315$ U.S. Government agencies 69,807,266 69,195,258 54,905,414 54,540,926
260,136,923$ 259,382,899$ 217,076,662$ 216,516,241$
2015 2014
At June 30, 2015, each investment had a credit quality rating of Aaa. The credit exposure as a percentage of total investments was as follows:
Percentof Total Fair Value
U.S. Treasury obligations 73% 190,187,641$
U.S. Government agenciesFederal National Mortgage Association 15% 38,242,180Federal Home Loan Mortgage Corporation 7% 17,085,774Federal Home Loan Bank 3% 8,500,384Federal Farm Credit Bank 1% 2,870,045Federal National Mortgage Association Discount Note 1% 2,496,875
100% 259,382,899$
The fair value of investments at June 30, 2015 by contractual maturity is shown below:
Fair Value Less Than 1 1 ‒ 5
U.S. Treasury obligations 190,187,641$ 15,449,320$ 174,738,321$ U.S. Government agencies 69,195,258 18,161,976 51,033,282
259,382,899$ 33,611,296$ 225,771,603$
Investment Maturities (In Years)
Board of Water Supply City and County of Honolulu Notes to Financial Statements June 30, 2015 and 2014
30
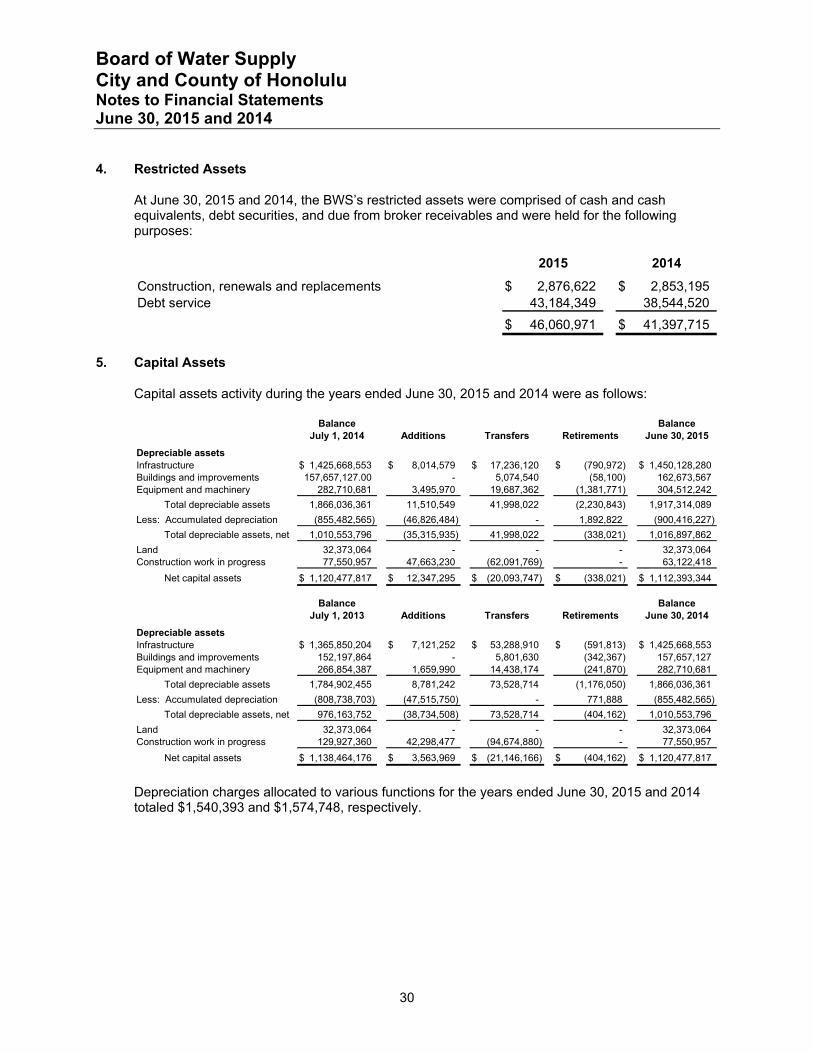
4. Restricted Assets
At June 30, 2015 and 2014, the BWSʼs restricted assets were comprised of cash and cash equivalents, debt securities, and due from broker receivables and were held for the following purposes:
2015 2014
Construction, renewals and replacements 2,876,622$ 2,853,195$ Debt service 43,184,349 38,544,520
46,060,971$ 41,397,715$
5. Capital Assets
Capital assets activity during the years ended June 30, 2015 and 2014 were as follows:
Balance BalanceJuly 1, 2014 Additions Transfers Retirements June 30, 2015
Depreciable assetsInfrastructure 1,425,668,553$ 8,014,579$ 17,236,120$ (790,972)$ 1,450,128,280$ Buildings and improvements 157,657,127.00 - 5,074,540 (58,100) 162,673,567Equipment and machinery 282,710,681 3,495,970 19,687,362 (1,381,771) 304,512,242
Total depreciable assets 1,866,036,361 11,510,549 41,998,022 (2,230,843) 1,917,314,089
Less: Accumulated depreciation (855,482,565) (46,826,484) - 1,892,822 (900,416,227)
Total depreciable assets, net 1,010,553,796 (35,315,935) 41,998,022 (338,021) 1,016,897,862
Land 32,373,064 - - - 32,373,064Construction work in progress 77,550,957 47,663,230 (62,091,769) - 63,122,418
Net capital assets 1,120,477,817$ 12,347,295$ (20,093,747)$ (338,021)$ 1,112,393,344$
Balance BalanceJuly 1, 2013 Additions Transfers Retirements June 30, 2014
Depreciable assetsInfrastructure 1,365,850,204$ 7,121,252$ 53,288,910$ (591,813)$ 1,425,668,553$ Buildings and improvements 152,197,864 - 5,801,630 (342,367) 157,657,127Equipment and machinery 266,854,387 1,659,990 14,438,174 (241,870) 282,710,681
Total depreciable assets 1,784,902,455 8,781,242 73,528,714 (1,176,050) 1,866,036,361
Less: Accumulated depreciation (808,738,703) (47,515,750) - 771,888 (855,482,565)
Total depreciable assets, net 976,163,752 (38,734,508) 73,528,714 (404,162) 1,010,553,796
Land 32,373,064 - - - 32,373,064Construction work in progress 129,927,360 42,298,477 (94,674,880) - 77,550,957
Net capital assets 1,138,464,176$ 3,563,969$ (21,146,166)$ (404,162)$ 1,120,477,817$
Depreciation charges allocated to various functions for the years ended June 30, 2015 and 2014 totaled $1,540,393 and $1,574,748, respectively.
Board of Water Supply City and County of Honolulu Notes to Financial Statements June 30, 2015 and 2014
31
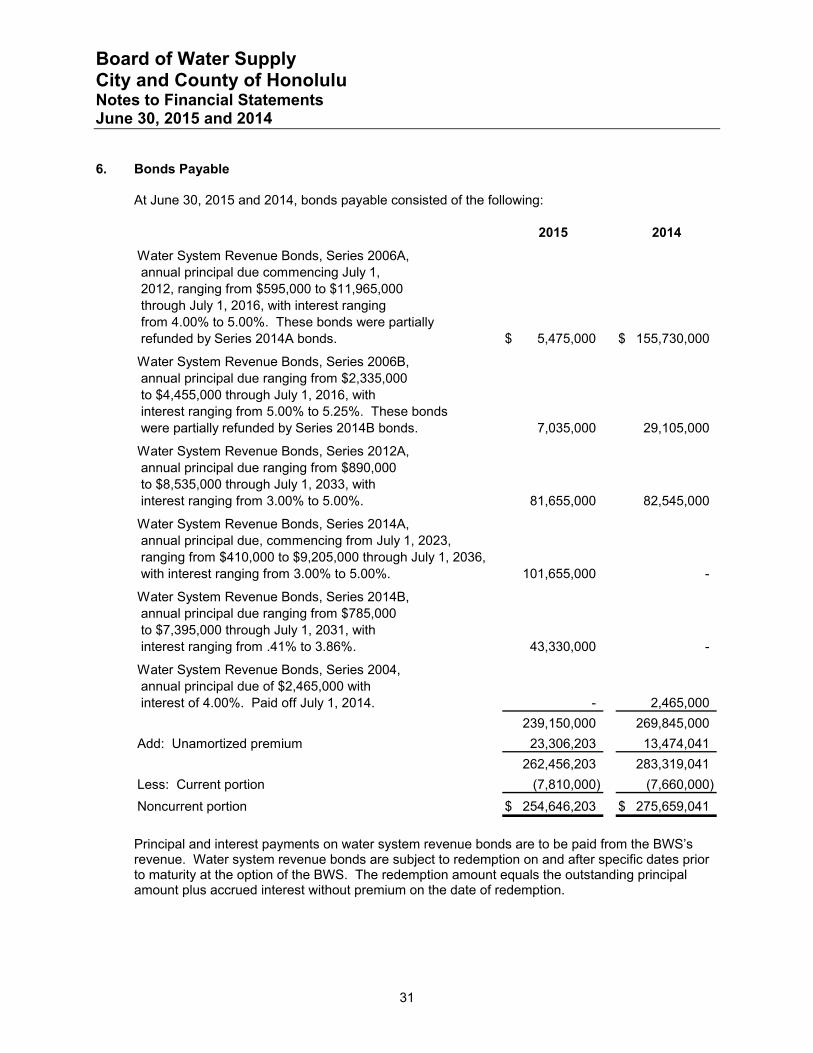
6. Bonds Payable
At June 30, 2015 and 2014, bonds payable consisted of the following:
2015 2014
Water System Revenue Bonds, Series 2006A, annual principal due commencing July 1, 2012, ranging from $595,000 to $11,965,000 through July 1, 2016, with interest ranging from 4.00% to 5.00%. These bonds were partially refunded by Series 2014A bonds. 5,475,000$ 155,730,000$
Water System Revenue Bonds, Series 2006B, annual principal due ranging from $2,335,000 to $4,455,000 through July 1, 2016, with interest ranging from 5.00% to 5.25%. These bonds were partially refunded by Series 2014B bonds. 7,035,000 29,105,000
Water System Revenue Bonds, Series 2012A, annual principal due ranging from $890,000 to $8,535,000 through July 1, 2033, with interest ranging from 3.00% to 5.00%. 81,655,000 82,545,000
Water System Revenue Bonds, Series 2014A, annual principal due, commencing from July 1, 2023, ranging from $410,000 to $9,205,000 through July 1, 2036, with interest ranging from 3.00% to 5.00%. 101,655,000 -
Water System Revenue Bonds, Series 2014B, annual principal due ranging from $785,000 to $7,395,000 through July 1, 2031, with interest ranging from .41% to 3.86%. 43,330,000 -
Water System Revenue Bonds, Series 2004, annual principal due of $2,465,000 with interest of 4.00%. Paid off July 1, 2014. - 2,465,000
239,150,000 269,845,000
Add: Unamortized premium 23,306,203 13,474,041
262,456,203 283,319,041
Less: Current portion (7,810,000) (7,660,000)
Noncurrent portion 254,646,203$ 275,659,041$
Principal and interest payments on water system revenue bonds are to be paid from the BWS’s revenue. Water system revenue bonds are subject to redemption on and after specific dates prior to maturity at the option of the BWS. The redemption amount equals the outstanding principal amount plus accrued interest without premium on the date of redemption.

Board of Water Supply City and County of Honolulu Notes to Financial Statements June 30, 2015 and 2014
32
Bonds payable activity during 2015 and 2014, were as follows:
Balance Balance Due WithinJuly 1, 2014 Additions Reductions June 30, 2015 One Year
Water System Revenue BondsSeries 2004 2,465,000$ -$ (2,465,000)$ -$ -$ Series 2006A 155,730,000 - (150,255,000) 5,475,000 2,680,000.00 Series 2006B 29,105,000 - (22,070,000) 7,035,000 3,430,000 Series 2012A 82,545,000 - (890,000) 81,655,000 915,000 Series 2014A - 101,655,000 - 101,655,000 - Series 2014B - 43,330,000 - 43,330,000 785,000
269,845,000$ 144,985,000$ (175,680,000)$ 239,150,000$ 7,810,000$
Balance Balance Due WithinJuly 1, 2013 Additions Reductions June 30, 2014 One Year
Water System Revenue BondsSeries 2004 4,830,000$ -$ (2,365,000)$ 2,465,000$ 2,465,000$ Series 2006A 156,745,000 - (1,015,000) 155,730,000 1,050,000 Series 2006B 32,200,000 - (3,095,000) 29,105,000 3,255,000 Series 2012A 83,405,000 - (860,000) 82,545,000 890,000
277,180,000$ -$ (7,335,000)$ 269,845,000$ 7,660,000$
At June 30, 2015, future bond principal and interest payments are as follows:
Principal Interest Total
Year Ending June 30,2016 7,810,000$ 9,914,000$ 17,724,000$ 2017 8,135,000 9,589,000 17,724,0002018 8,365,000 9,358,000 17,723,0002019 8,550,000 9,175,000 17,725,0002020 8,820,000 8,902,000 17,722,0002021‒2025 50,690,000 38,893,000 89,583,0002026‒2030 65,000,000 25,484,000 90,484,0002031‒2035 63,820,000 9,816,000 73,636,0002036‒2037 17,960,000 727,000 18,687,000
Total 239,150,000$ 121,858,000$ 361,008,000$
In February 2001, the BWS created an irrevocable trust with an escrow agent to retire $32,460,000 of the BWSʼs outstanding 1992 general obligation water bonds. The escrow agent will pay all future debt service payments on the 1992 Series bonds out of the irrevocable trust. Consequently, the 1992 Series bonds were considered to be defeased and the liability for the bonds was removed from the BWSʼs financial statements in 2001. At June 30, 2015 and 2014, the outstanding 1992 Series defeased bonds amounted to $3,135,000 and $6,095,000, respectively.
In July 2006, the BWS issued $213,805,000 in water system revenue bonds which consisted of $165,195,000 of Series 2006A and $48,610,000 of Series 2006B bonds. A portion of the proceeds of the issuance were used to refund, on a current basis, all of the BWSʼs outstanding Series 2002 bonds and to advance refund a portion of the outstanding 2001 Series and 2004 Series bonds. Consequently, a portion of the 2001 Series and 2004 Series bonds were considered to be defeased and were removed from the BWSʼs financial statements in 2007.
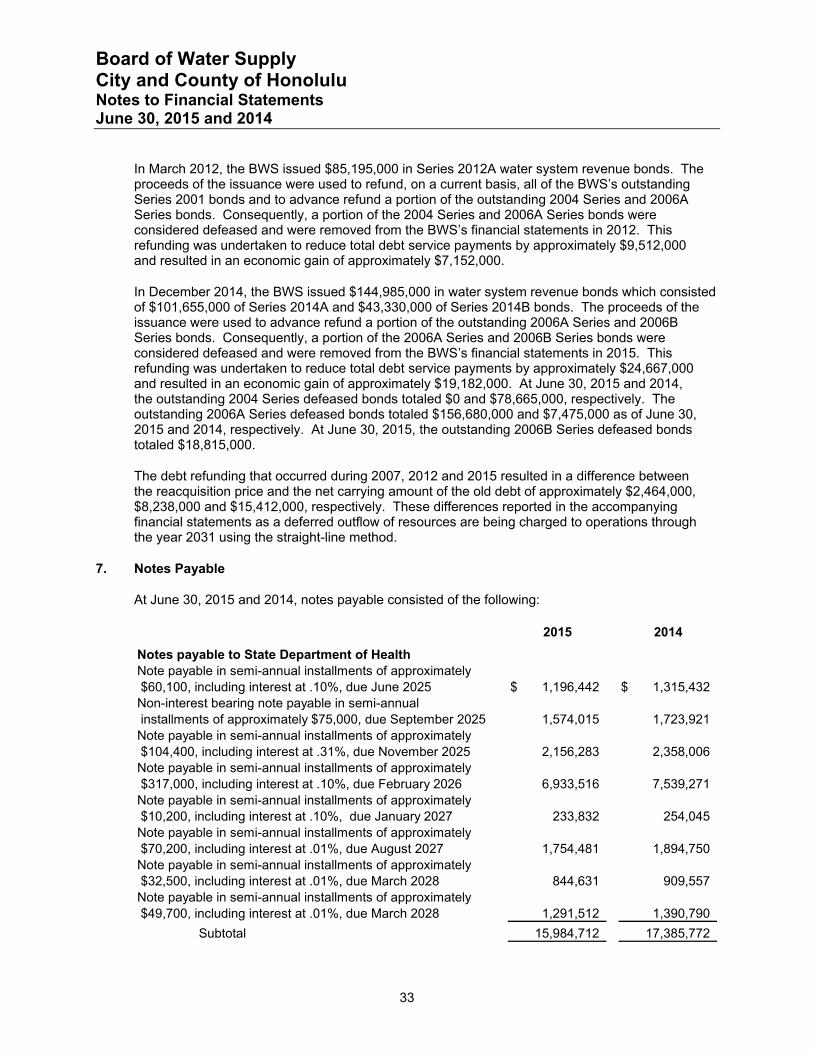
Board of Water Supply City and County of Honolulu Notes to Financial Statements June 30, 2015 and 2014
33
In March 2012, the BWS issued $85,195,000 in Series 2012A water system revenue bonds. The proceeds of the issuance were used to refund, on a current basis, all of the BWSʼs outstanding Series 2001 bonds and to advance refund a portion of the outstanding 2004 Series and 2006A Series bonds. Consequently, a portion of the 2004 Series and 2006A Series bonds were considered defeased and were removed from the BWSʼs financial statements in 2012. This refunding was undertaken to reduce total debt service payments by approximately $9,512,000 and resulted in an economic gain of approximately $7,152,000.
In December 2014, the BWS issued $144,985,000 in water system revenue bonds which consisted of $101,655,000 of Series 2014A and $43,330,000 of Series 2014B bonds. The proceeds of the issuance were used to advance refund a portion of the outstanding 2006A Series and 2006B Series bonds. Consequently, a portion of the 2006A Series and 2006B Series bonds were considered defeased and were removed from the BWSʼs financial statements in 2015. This refunding was undertaken to reduce total debt service payments by approximately $24,667,000 and resulted in an economic gain of approximately $19,182,000. At June 30, 2015 and 2014, the outstanding 2004 Series defeased bonds totaled $0 and $78,665,000, respectively. The outstanding 2006A Series defeased bonds totaled $156,680,000 and $7,475,000 as of June 30, 2015 and 2014, respectively. At June 30, 2015, the outstanding 2006B Series defeased bonds totaled $18,815,000.
The debt refunding that occurred during 2007, 2012 and 2015 resulted in a difference between the reacquisition price and the net carrying amount of the old debt of approximately $2,464,000, $8,238,000 and $15,412,000, respectively. These differences reported in the accompanying financial statements as a deferred outflow of resources are being charged to operations through the year 2031 using the straight-line method.
7. Notes Payable
At June 30, 2015 and 2014, notes payable consisted of the following:
2015 2014
Notes payable to State Department of HealthNote payable in semi-annual installments of approximately $60,100, including interest at .10%, due June 2025 1,196,442$ 1,315,432$ Non-interest bearing note payable in semi-annual installments of approximately $75,000, due September 2025 1,574,015 1,723,921Note payable in semi-annual installments of approximately $104,400, including interest at .31%, due November 2025 2,156,283 2,358,006Note payable in semi-annual installments of approximately $317,000, including interest at .10%, due February 2026 6,933,516 7,539,271Note payable in semi-annual installments of approximately $10,200, including interest at .10%, due January 2027 233,832 254,045Note payable in semi-annual installments of approximately $70,200, including interest at .01%, due August 2027 1,754,481 1,894,750Note payable in semi-annual installments of approximately $32,500, including interest at .01%, due March 2028 844,631 909,557Note payable in semi-annual installments of approximately $49,700, including interest at .01%, due March 2028 1,291,512 1,390,790
Subtotal 15,984,712 17,385,772
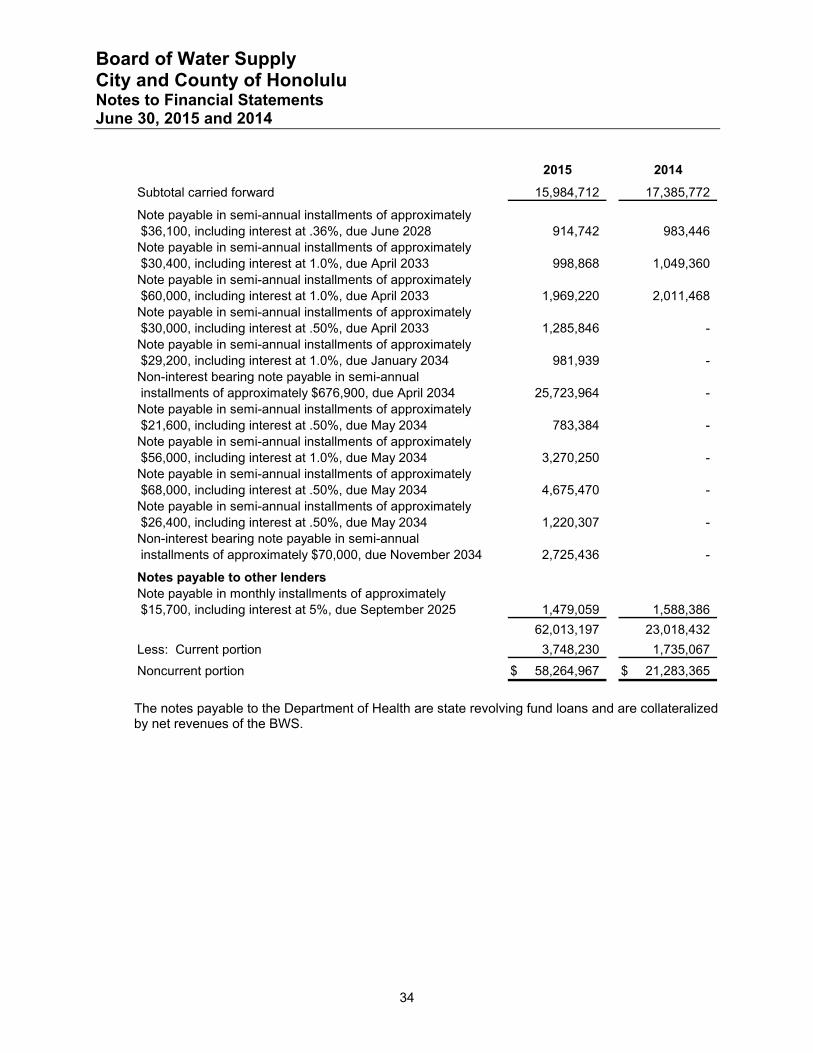
Board of Water Supply City and County of Honolulu Notes to Financial Statements June 30, 2015 and 2014
34
2015 2014
Subtotal carried forward 15,984,712 17,385,772
Note payable in semi-annual installments of approximately $36,100, including interest at .36%, due June 2028 914,742 983,446Note payable in semi-annual installments of approximately $30,400, including interest at 1.0%, due April 2033 998,868 1,049,360Note payable in semi-annual installments of approximately $60,000, including interest at 1.0%, due April 2033 1,969,220 2,011,468Note payable in semi-annual installments of approximately $30,000, including interest at .50%, due April 2033 1,285,846 -Note payable in semi-annual installments of approximately $29,200, including interest at 1.0%, due January 2034 981,939 -Non-interest bearing note payable in semi-annual installments of approximately $676,900, due April 2034 25,723,964 -Note payable in semi-annual installments of approximately $21,600, including interest at .50%, due May 2034 783,384 -Note payable in semi-annual installments of approximately $56,000, including interest at 1.0%, due May 2034 3,270,250 -Note payable in semi-annual installments of approximately $68,000, including interest at .50%, due May 2034 4,675,470 -Note payable in semi-annual installments of approximately $26,400, including interest at .50%, due May 2034 1,220,307 -Non-interest bearing note payable in semi-annual installments of approximately $70,000, due November 2034 2,725,436 -
Notes payable to other lendersNote payable in monthly installments of approximately $15,700, including interest at 5%, due September 2025 1,479,059 1,588,386
62,013,197 23,018,432
Less: Current portion 3,748,230 1,735,067
Noncurrent portion 58,264,967$ 21,283,365$
The notes payable to the Department of Health are state revolving fund loans and are collateralized by net revenues of the BWS.
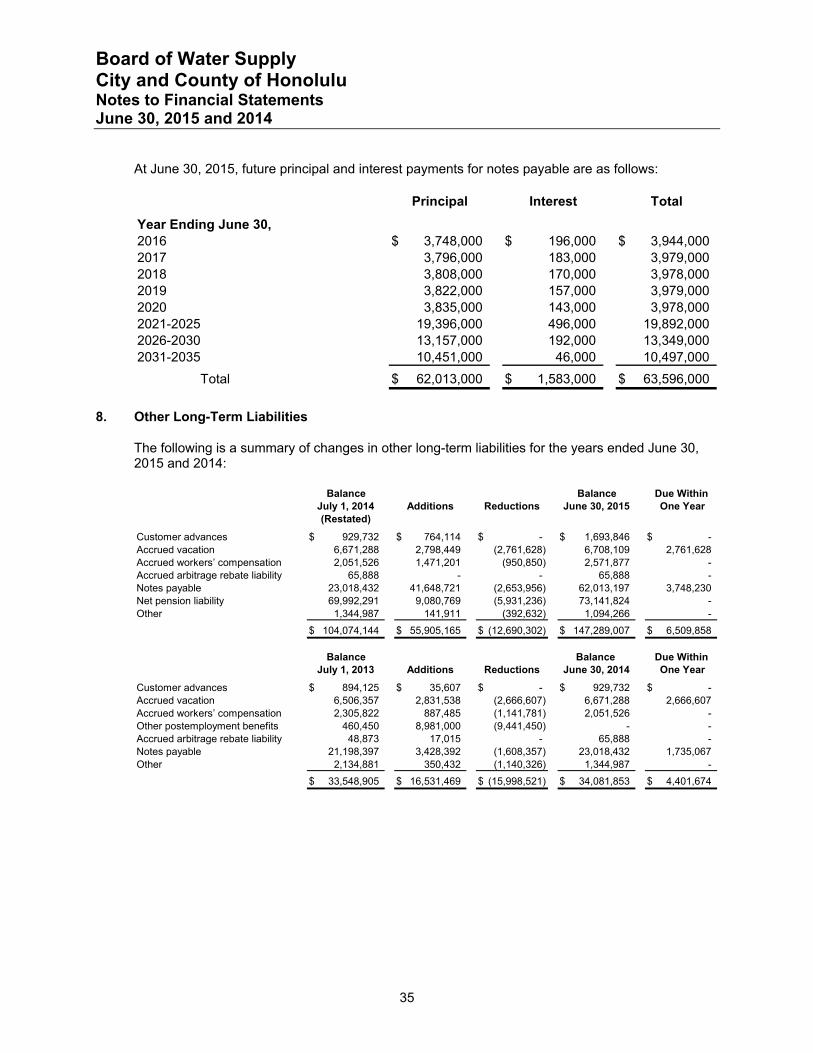
Board of Water Supply City and County of Honolulu Notes to Financial Statements June 30, 2015 and 2014
35
At June 30, 2015, future principal and interest payments for notes payable are as follows:
Principal Interest Total
Year Ending June 30,2016 3,748,000$ 196,000$ 3,944,000$ 2017 3,796,000 183,000 3,979,0002018 3,808,000 170,000 3,978,000
3,822,000 157,000 3,979,0003,835,000 143,000 3,978,000
2021-2025 19,396,000 496,000 19,892,0002026-2030 13,157,000 192,000 13,349,0002031-2035 10,451,000 46,000 10,497,000
Total 62,013,000$ 1,583,000$ 63,596,000$
20192020
8. Other Long-Term Liabilities
The following is a summary of changes in other long-term liabilities for the years ended June 30, 2015 and 2014:
Balance Balance Due WithinJuly 1, 2014 Additions Reductions June 30, 2015 One Year(Restated)
Customer advances 929,732$ 764,114$ -$ 1,693,846$ -$ Accrued vacation 6,671,288 2,798,449 (2,761,628) 6,708,109 2,761,628Accrued workersʼ compensation 2,051,526 1,471,201 (950,850) 2,571,877 -Accrued arbitrage rebate liability 65,888 - - 65,888 -Notes payable 23,018,432 41,648,721 (2,653,956) 62,013,197 3,748,230Net pension liability 69,992,291 9,080,769 (5,931,236) 73,141,824 -Other 1,344,987 141,911 (392,632) 1,094,266 -
104,074,144$ 55,905,165$ (12,690,302)$ 147,289,007$ 6,509,858$
Balance Balance Due WithinJuly 1, 2013 Additions Reductions June 30, 2014 One Year
Customer advances 894,125$ 35,607$ -$ 929,732$ -$ Accrued vacation 6,506,357 2,831,538 (2,666,607) 6,671,288 2,666,607Accrued workersʼ compensation 2,305,822 887,485 (1,141,781) 2,051,526 -Other postemployment benefits 460,450 8,981,000 (9,441,450) - -Accrued arbitrage rebate liability 48,873 17,015 - 65,888 -Notes payable 21,198,397 3,428,392 (1,608,357) 23,018,432 1,735,067Other 2,134,881 350,432 (1,140,326) 1,344,987 -
33,548,905$ 16,531,469$ (15,998,521)$ 34,081,853$ 4,401,674$
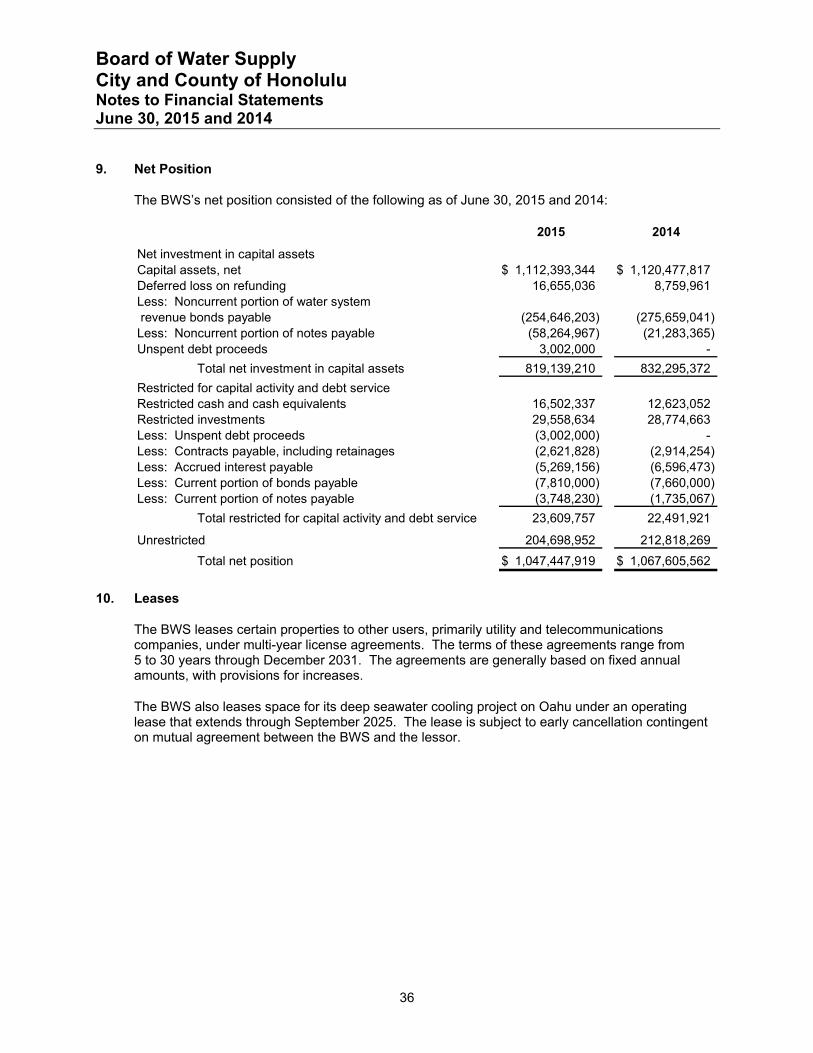
Board of Water Supply City and County of Honolulu Notes to Financial Statements June 30, 2015 and 2014
36
9. Net Position
The BWSʼs net position consisted of the following as of June 30, 2015 and 2014:
2015 2014
Net investment in capital assetsCapital assets, net 1,112,393,344$ 1,120,477,817$ Deferred loss on refunding 16,655,036 8,759,961Less: Noncurrent portion of water system revenue bonds payable (254,646,203) (275,659,041)Less: Noncurrent portion of notes payable (58,264,967) (21,283,365)Unspent debt proceeds 3,002,000 -
Total net investment in capital assets 819,139,210 832,295,372
Restricted for capital activity and debt serviceRestricted cash and cash equivalents 16,502,337 12,623,052Restricted investments 29,558,634 28,774,663Less: Unspent debt proceeds (3,002,000) -Less: Contracts payable, including retainages (2,621,828) (2,914,254)Less: Accrued interest payable (5,269,156) (6,596,473)Less: Current portion of bonds payable (7,810,000) (7,660,000)Less: Current portion of notes payable (3,748,230) (1,735,067)
Total restricted for capital activity and debt service 23,609,757 22,491,921
Unrestricted 204,698,952 212,818,269
Total net position 1,047,447,919$ 1,067,605,562$
10. Leases
The BWS leases certain properties to other users, primarily utility and telecommunications companies, under multi-year license agreements. The terms of these agreements range from 5 to 30 years through December 2031. The agreements are generally based on fixed annual amounts, with provisions for increases.
The BWS also leases space for its deep seawater cooling project on Oahu under an operating lease that extends through September 2025. The lease is subject to early cancellation contingent on mutual agreement between the BWS and the lessor.
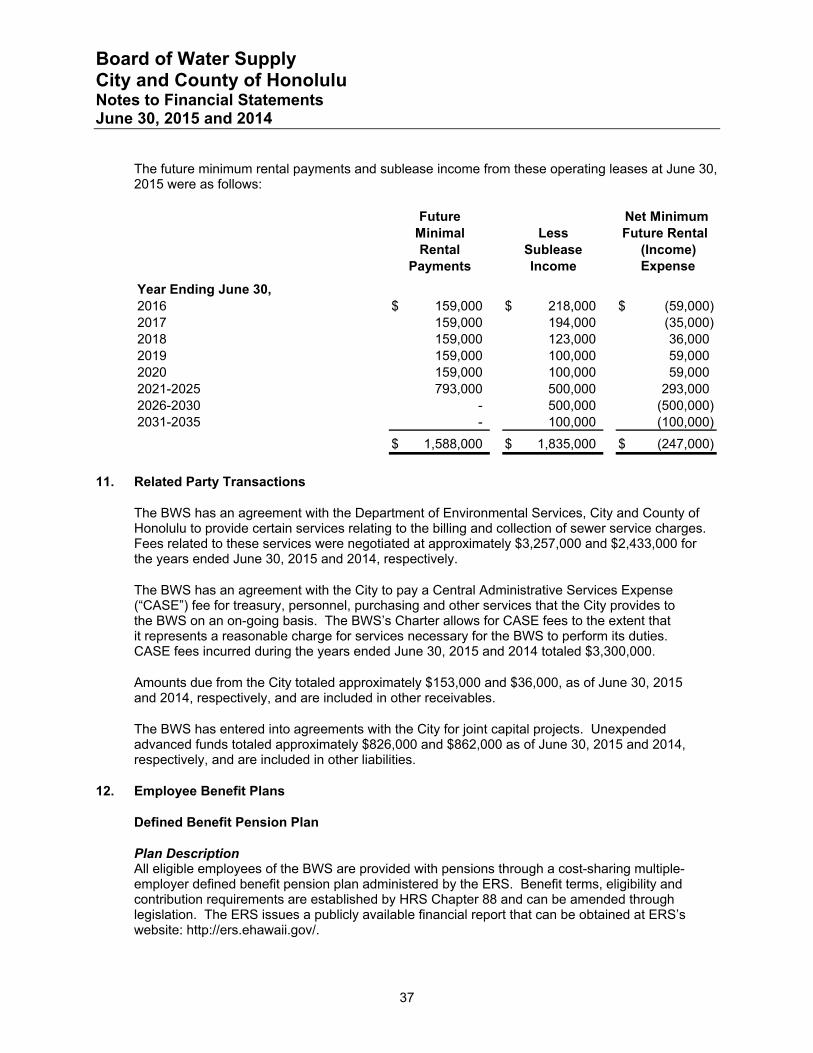
Board of Water Supply City and County of Honolulu Notes to Financial Statements June 30, 2015 and 2014
37
The future minimum rental payments and sublease income from these operating leases at June 30, 2015 were as follows:
Future Net MinimumMinimal Less Future Rental Rental Sublease (Income)
Payments Income Expense
Year Ending June 30,159,000$ 218,000$ (59,000)$ 159,000 194,000 (35,000)159,000 123,000 36,000159,000 100,000 59,000159,000 100,000 59,000
2021-2025 793,000 500,000 293,0002026-2030 - 500,000 (500,000)2031-2035 - 100,000 (100,000)
1,588,000$ 1,835,000$ (247,000)$
20162017201820192020
11. Related Party Transactions
The BWS has an agreement with the Department of Environmental Services, City and County of Honolulu to provide certain services relating to the billing and collection of sewer service charges. Fees related to these services were negotiated at approximately $3,257,000 and $2,433,000 for the years ended June 30, 2015 and 2014, respectively.
The BWS has an agreement with the City to pay a Central Administrative Services Expense (“CASE”) fee for treasury, personnel, purchasing and other services that the City provides to the BWS on an on-going basis. The BWSʼs Charter allows for CASE fees to the extent that it represents a reasonable charge for services necessary for the BWS to perform its duties. CASE fees incurred during the years ended June 30, 2015 and 2014 totaled $3,300,000.
Amounts due from the City totaled approximately $153,000 and $36,000, as of June 30, 2015 and 2014, respectively, and are included in other receivables.
The BWS has entered into agreements with the City for joint capital projects. Unexpended advanced funds totaled approximately $826,000 and $862,000 as of June 30, 2015 and 2014, respectively, and are included in other liabilities.
12. Employee Benefit Plans
Defined Benefit Pension Plan
Plan Description All eligible employees of the BWS are provided with pensions through a cost-sharing multiple-employer defined benefit pension plan administered by the ERS. Benefit terms, eligibility and contribution requirements are established by HRS Chapter 88 and can be amended through legislation. The ERS issues a publicly available financial report that can be obtained at ERS’s website: http://ers.ehawaii.gov/.
Board of Water Supply City and County of Honolulu Notes to Financial Statements June 30, 2015 and 2014
38
Benefits Provided The ERS provides retirement, disability and death benefits that are covered by the provisions of the noncontributory, contributory and hybrid retirement membership classes. The three classes provide a monthly retirement allowance equal to the benefit multiplier (generally 1.25% or 2%) multiplied by the average final compensation multiplied by years of credited service. The benefit multiplier decreased by 0.25% for new hybrid and contributory class members hired after June 30, 2012. Average final compensation is an average of the highest salaries during any three years of credited service, excluding any salary paid in lieu of vacation for employees hired January 1, 1971 or later and the average of the highest salaries during any five years of credited service including any salary paid in lieu of vacation for employees hired prior to January 1, 1971.
For members hired before July 1, 2012, the original retirement allowance is increased by 2.5% each July 1 following the calendar year of retirement. This cumulative benefit is not compounded and increases each year by 2.5% of the original retirement allowance without a ceiling (2.5% of the original retirement allowance the first year, 5.0% the second year, 7.5% the third year, etc.). For members hired after June 30, 2012, the post-retirement annuity increase was decreased to 1.5% per year.
Noncontributory Class
Retirement Benefits ‒ General employees’ retirement benefits are determined as 1.25% of average final compensation multiplied by the years of credited service. Employees with 10 years of credited service are eligible to retire at age 62. Employees with 30 years of credited service are eligible to retire at age 55.
Disability Benefits ‒ Members are eligible for service-related disability benefits regardless of length of service and receive a lifetime pension of 35% of their average final compensation. Ten years of credited service is required for ordinary disability. Ordinary disability benefits are determined in the same manner as retirement benefits but are payable immediately, without an actuarial reduction, and at a minimum of 12.5% of average final compensation.
Death Benefits ‒ For service-connected deaths, the surviving spouse/reciprocal beneficiary receives a monthly benefit of 30% of the average final compensation until remarriage or re-entry into a new reciprocal beneficiary relationship. Additional benefits are payable to surviving dependent children up to age 18. If there is no spouse/reciprocal beneficiary or dependent children, no benefit is payable.
Ten years of credited service is required for ordinary death benefits. For ordinary death benefits, the surviving spouse/reciprocal beneficiary (until remarriage/reentry into a new reciprocal beneficiary relationship) and dependent children (up to age 18) receive a benefit equal to a percentage of member’s accrued maximum allowance unreduced for age or, if the member was eligible for retirement at the time of death, the surviving spouse/reciprocal beneficiary receives 100% joint and survivor lifetime pension.
Board of Water Supply City and County of Honolulu Notes to Financial Statements June 30, 2015 and 2014
39
Contributory Class for Employees Hired prior to July 1, 2012
Retirement Benefits ‒ General employees’ retirement benefits are determined as 2% of average final compensation multiplied by the years of credited service. General employees with five years of credited service are eligible to retire at age 55.
Disability Benefits ‒ Members are eligible for service-related disability benefits regardless of length of service and receive a one-time payment of the member’s contributions and accrued interest plus a lifetime pension of 50% of their average final compensation. Ten years of credited service is required for ordinary disability. Ordinary disability benefits are determined as 1.75% of average final compensation multiplied by the years of credited service but are payable immediately, without an actuarial reduction, and at a minimum of 30% of average final compensation.
Death Benefits ‒ For service-connected deaths, the designated beneficiary receives a lump sum payment of the member’s contributions and accrued interest plus a monthly benefit of 50% of the average final compensation to the surviving spouse/reciprocal beneficiary until remarriage or re-entry into a new reciprocal beneficiary relationship. If there is no surviving spouse/reciprocal beneficiary, surviving children (up to age 18) or dependent parents are eligible for the monthly benefit. If there is no spouse/reciprocal beneficiary or dependent children/parents, the death benefit is payable to the designated beneficiary.
Ordinary death benefits are available to employees who were active at time of death with at least one year of service. Ordinary death benefits consist of a lump sum payment of the member’s contributions and accrued interest plus a percentage of the salary earned in the 12 months preceding death, or 50% Joint and Survivor lifetime pension if the member was not eligible for retirement at the time of death but was credited with at least 10 years of service and designated one beneficiary, or 100% Joint and Survivor lifetime pension if the member was eligible for retirement at the time of death and designated one beneficiary.
Hybrid Class for Employees Hired Prior to July 1, 2012
Retirement Benefits ‒ General employees’ retirement benefits are determined as 2% of average final compensation multiplied by the years of credited service. General employees with five years of credited service are eligible to retire at age 62. General employees with 30 years of credited service are eligible to retire at age 55.
Disability Benefits ‒ Members are eligible for service-related disability benefits regardless of length of service and receive a lifetime pension of 35% of their average final compensation plus refund of their contributions and accrued interest. Ten years of credited service is required for ordinary disability. Ordinary disability benefits are determined in the same manner as retirement benefits but are payable immediately, without an actuarial reduction, and at a minimum of 25% of average final compensation.
Death Benefits ‒ For service-connected deaths, the designated beneficiary receives a lump sum payment of the member’s contributions and accrued interest plus a monthly benefit of 50% of the average final compensation to the surviving spouse/reciprocal beneficiary until remarriage or re-entry into a new reciprocal beneficiary relationship. If there is no surviving spouse/reciprocal beneficiary, surviving children (up to age 18) or dependent parents are eligible for the monthly benefit. If there is no spouse/reciprocal beneficiary or dependent children/parents, the death benefit is payable to the designated beneficiary.
Board of Water Supply City and County of Honolulu Notes to Financial Statements June 30, 2015 and 2014
40
Ordinary death benefits are available to employees who were active at time of death with at least five years of service. Ordinary death benefits consist of a lump sum payment of the member’s contributions and accrued interest plus a percentage multiplied by 150%, or 50% Joint and Survivor lifetime pension if the member was not eligible for retirement at the time of death but was credited with at least 10 years of service and designated one beneficiary, or 100% Joint and Survivor lifetime pension if the member was eligible for retirement at the time of death and designated one beneficiary.
Hybrid Class for Employees Hired After June 30, 2012
Retirement Benefits ‒ General employees’ retirement benefits are determined as 1.75% of average final compensation multiplied by the years of credited service. General employees with 10 years of credited service are eligible to retire at age 65. Employees with 30 years of credited service are eligible to retire at age 60.
Disability and Death Benefits ‒ Provisions for disability and death benefits generally remain the same except for ordinary death benefits. Ordinary death benefits are available to employees who were active at time of death with at least 10 years of service. Ordinary death benefits consist of a lump sum payment of the member’s contributions and accrued interest plus a percentage multiplied by 120% or 50% Joint and Survivor lifetime pension if the member was not eligible for retirement at the time of death and designated one beneficiary, or 100% Joint and Survivor lifetime pension if the member was eligible for retirement at the time of death and designated one beneficiary.
Contributions Contributions are established by HRS Chapter 88 and may be amended through legislation. The employer rate is set by statute based on the recommendations of the ERS actuary resulting from an experience study conducted every five years. Prior to July 1, 2005, the funding method used to calculate the total employer contribution requirement was the Entry Age Normal Actuarial Cost Method. Under this method, employer contributions to the ERS were comprised of normal cost plus level annual payments required to liquidate the unfunded actuarial liability over the remaining period of 29 years from July 1, 2000. Effective July 1, 2008, employer contribution rates are a fixed percentage of compensation, generally 15.0% for most covered employees. The BWSʼs contributions to the ERS for the years ended June 30, 2015, 2014 and 2013, were approximately $5,484,000, $5,162,000 and $4,604,000, respectively, which represented approximately 16.4%, 16.0% and 15.5% of the BWSʼs covered payroll for the fiscal years ended June 30, 2015, 2014 and 2013, respectively.
The employer is required to make all contributions for noncontributory members. For contributory class employees hired prior to July 1, 2012, general employees are required to contribute 7.8% of their salary. Hybrid class members hired prior July 1, 2012 are required to contribute 6.0% of their salary. Hybrid class members hired after June 30, 2012 are required to contribute 8.0% of their salary.
Pension Liabilities, Pension Expense, Deferred Outflows of Resources, and Deferred Inflows of Resources Related to Pensions At June 30, 2015, BWS reported a liability of approximately $73,142,000 for its proportionate share of the net pension liability. The net pension liability was measured as of June 30, 2014, and the total pension liability used to calculate the net pension liability was determined by an actuarial valuation as of that date. The BWS’s proportion of the net pension liability was based on a projection of the BWS’s long-term share of contributions to the pension plan relative to the

Board of Water Supply City and County of Honolulu Notes to Financial Statements June 30, 2015 and 2014
41
projected contributions of all participating entities, actuarially determined. At June 30, 2014, BWS’s proportion was 0.91%, which was an increase of 0.13% from its proportion measured as of June 30, 2013.
There were no changes in benefit terms that affected the measurement of the total pension liability since the prior measurement date. There were no changes between the measurement date, June 30, 2014, and the reporting date, June 30, 2015, that are expected to have a significant effect on the proportionate share of the net pension liability.
For the year ended June 30, 2015, BWS recognized pension expense of approximately $9,662,000. At June 30, 2015, the BWS reported deferred outflows of resources and deferred inflows of resources related to pensions from the following sources:
Deferred Deferred Outflows of Inflows ofResources Resources
Difference between expected and actual experience 930,101$ -$ Changes in proportion and differences between employer contributions and proportionate share of contributions 8,597,062 -Net difference between projected and actual investment earnings on pension plan investments - 8,488,509Contributions subsequent to the measurement date 7,245,510 -
Total deferred inflows and outflows of resources 16,772,673$ 8,488,509$
The $7,246,000 of deferred outflows of resources related to pensions resulting from the BWS’s contributions subsequent to the measurement date will be recognized as a reduction of the net pension liability in the year ended June 30, 2016. Other amounts reported as deferred outflows of resources and deferred (inflows) of resources will be recognized in pension expense as follows:
Year Ending June 30,2016 (123,184)$ 2017 (123,184)2018 (123,184)2019 (123,184)2020 1,531,390
Total 1,038,654$
Actuarial Assumptions The total pension liability as of the June 30, 2014 actuarial valuation was determined using the following actuarial assumptions, applied to all periods included in the measurement.
Inflation 3.00%Payroll growth rate 3.50%Investment rate of return 7.75% per year, compounded annual including inflation
The same rates were applied to all periods. There were no changes to ad hoc postemployment benefits including COLA. Pre-retirement mortality rates are based on the RP-2000 tables.
Board of Water Supply City and County of Honolulu Notes to Financial Statements June 30, 2015 and 2014
42
The actuarial assumptions used in the June 30, 2014 valuation were based on the results of an actuarial experience study for the five-year period ended June 30, 2010. ERS updates their experience studies every five years.
The long-term expected rate of return on pension plan investments was determined using a “top down approach” of the Bespoke Client-Constrained Simulation-based Optimization Model (a statistical technique known as “re-sampling with replacement’ that directly keys in on specific plan-level risk factors as stipulated by the ERS Board) in which best-estimate ranges of expected future real rates of return (expected returns, net of pension plan investment expense and inflation) are developed for each major asset class. These ranges are combined to produce the long-term expected rate of return by weighting the expected future real rates of return by the target asset allocation percentage and by adding expected inflation. The target allocation and best estimates of arithmetic real rates of return for each major asset class are summarized in the following table:
Long-Term Target Expected Real
Allocation Rate of Return
Domestic equity 30.0% 8.50%International equity 26.0 9.00%Total fixed-income 20.0 3.10%Real estate 7.0 * 8.46%Private equity 7.0 * 11.45%Real return 5.0 * 6.10%Covered calls 5.0 7.65%
Total 100%
* The real estate, private equity and real return targets will be the percentage actually invested up to 7.0%, 7.0% and 5.0%, respectively, of the total fund. Changes in the real estate, private equity and real return targets will be offset by an equal percentage in the large cap domestic equity target.
Discount Rate The discount rate used to measure the total pension liability was 7.75%. The projection of cash flows used to determine the discount rate assumed that employee contributions will be made at the current contribution rate and that contributions from employers will be made at statutorily required rates, actuarially determined. Based on those assumptions, the Plan’s fiduciary net position was projected to be available to make all projected future benefit payments of current active and inactive employees. Therefore, the long-term expected rate of return on Plan investments was applied to all periods of projected benefit payments to determine the total pension liability. There has been no change to the discount rate since the prior measurement date.
Board of Water Supply City and County of Honolulu Notes to Financial Statements June 30, 2015 and 2014
43
Sensitivity of the BWS’s Proportionate Share of the Net Pension Liability to Changes in the Discount Rate The following presents the BWS’s proportionate share of the net pension liability calculated using the discount rate of 7.75%, as well as what the BWS’s proportionate share of the net pension liability would be if it were calculated using a discount rate that is 1-percentage point lower (6.75%) or 1-percentage point higher (8.75%) than the current rate:
1% Discount 1%Decrease Rate Increase(6.75%) (7.75%) (8.75%)
BWS’s proportionate share of the net pension liability 92,705,833$ 73,141,824$ 53,577,814$
Plan Fiduciary Net Position The pension plan’s fiduciary net position is determined on the same basis used by the pension plan. The ERS financial statements are prepared using the accrual basis of accounting under which expenses are recorded when the liability is incurred, and revenues are recorded in the accounting period in which they are earned and become measurable. Employer and member contributions are recognized in the period in which the contributions are due. Benefits and refunds are recognized when due and payable in accordance with the terms of the plan. Investment purchases and sales are recorded as of their trade date. Administrative expenses are financed exclusively with investment income.
There were no significant changes after the report measurement date. Detailed information about the pension plan’s fiduciary net position is available in the separately issued ERS financial report. ERS’s complete financial statements are available at http://www.ers.ehawaii.gov.
Payable to the Pension Plan At June 30, 2015, the amount payable to the ERS was approximately $2,407,000.
Post-Retirement Health Care and Life Insurance Benefits In addition to providing pension benefits, the State of Hawaii Employer-Union Health Benefits Trust Fund (“EUTF”), an agent multiple-employer plan provides certain health care (medical, prescription, vision and dental) and life insurance benefits for retired BWS employees. Act 88 established the EUTF during the 2001 State legislative session and is codified in HRS 87A. Contributions are based on negotiated collective bargaining agreements and are limited by State statute to the actual cost of benefit coverage.
For employees hired before July 1, 1996, the BWS pays 100% of the monthly health care premium for employees retiring with 10 or more years of credited service, and 50% of the monthly premium for employees retiring with fewer than ten years of credited service.
For employees hired after June 30, 1996 and retiring with 25 years or more of service, the BWS pays the entire health care premium. For employees retiring with at least 15 years but fewer than 25 years of service, the BWS pays 75% of the monthly Medicare or non-Medicare premium. For those retiring with at least 10 years but fewer than 15 years of service, the BWS pays 50% of the retired employees’ monthly Medicare or non-Medicare premium. For those retiring with fewer than 10 years of service, the BWS makes no contributions.

Board of Water Supply City and County of Honolulu Notes to Financial Statements June 30, 2015 and 2014
44
For employees hired after June 30, 2001 and retiring with over 25 years of service, the BWS pays 100% of the monthly premium based on the self plan. For those who retire with at least 15 years but fewer than 25 years of service, the BWS pays 75% of the retired employees’ monthly Medicare or non-Medicare premium based on the self plan. For those retiring with at least ten years but fewer than 15 years of service, the BWS pays 50% of the retired employeesʼ monthly Medicare or non-Medicare premium based on the self plan. For those retiring with fewer than 10 years of service, the BWS makes no contributions.
The BWS also reimburses 100% of Medicare premium costs for retirees and qualified dependents (through the State of Hawaii), who are at least 65 years of age and have at least 10 years of service.
The BWS is required to contribute the annual required contribution (“ARC”) of the employer, an amount actuarially determined for the other postemployment benefits (“OPEB”). The ARC represents a level of funding that, if paid on an ongoing basis, is projected to cover normal cost each year and amortize any unfunded actuarial liabilities or funding excess over a period not to exceed thirty years.
For the fiscal years ended June 30, 2015, 2014 and 2013, the components of the BWSʼs annual OPEB costs, the amounts contributed to the plan and the changes to the BWSʼs net OPEB asset (obligation) are summarized as follows:
2015 2014 2013
Annual required contribution 8,528,000$ 8,977,000$ 8,674,000$ Interest on net OPEB obligation 493,000 32,000 54,000Adjustment to annual required contribution (446,000) (28,000) (47,000)
Annual OPEB cost 8,575,000 8,981,000 8,681,000
Contributions made (10,750,399) (16,482,667) (8,232,550)
Change in net OPEB asset (obligation) 2,175,399 7,501,667 (448,450)
Net OPEB asset (obligation)Beginning of year 7,041,217 (460,450) (12,000)
End of year 9,216,616$ 7,041,217$ (460,450)$
Percentage of annual OPEB cost contributed 125% 184% 95%
The funded status of the plan as of the most recent valuation date is as follows:
Actuarial Actuarial Actuarial Actuarial PercentageValuation Value of Accrued AAL Funded Covered of Covered
Date Assets Liability (“AAL”) (“UAAL”) Ratio Payroll Payroll
July 1, 2013 25,638,000$ 122,886,000$ 97,248,000$ 21% 31,677,000$ 307%July 1, 2011 14,557,000$ 127,154,000$ 112,597,000$ 11% 29,900,000$ 377%
Actuarial valuations of an ongoing plan involve estimates of the value of reported amounts and assumptions about the probability of occurrence of events far into the future. Examples include assumptions about future employment, mortality, and the healthcare cost trend. Amounts determined regarding the funded status of the plan and the annual required contributions of the employer are subject to continual revision as actual results are compared with past expectations and new estimates are made about the future. The schedule of funding progress, presented as
Board of Water Supply City and County of Honolulu Notes to Financial Statements June 30, 2015 and 2014
45
required supplementary information following the notes to the financial statements, presents multiyear trend information that shows whether the actuarial value of plan assets is increasing or decreasing over time relative to the actuarial accrued liabilities for benefits.
Projections of benefits for financial reporting purposes are based on the substantive plan and include the types of benefits provided at the time of each valuation and the historical pattern of sharing of benefit costs between the employer and plan members to that point. The actuarial methods and assumptions used include techniques that are designed to reduce short-term volatility in actuarial accrued liabilities and the actuarial value of assets, consistent with the long-term perspective of the calculations.
In the July 1, 2013 actuarial valuation, the entry age normal actuarial cost method was used. The actuarial assumptions included a discount rate of 7.0%, projected salary increases of 3.5%, and an annual health cost trend rates of 9.0% and 7.5% for PPO and HMO, respectively, reduced by decrements to an ultimate rate of 5.0% after 10 years. The unfunded actuarial accrued liability is being amortized as a level percentage of projected payroll amounts over a thirty-year closed period ending June 30, 2037.
The EUTF issues a stand-alone financial report that includes financial statements and required supplementary information, which may be obtained at the following address: State of Hawaii Employer-Union Health Benefits Trust Fund, P.O. Box 2121, Honolulu, Hawaii 96805.
13. Commitments
Commitments, primarily for capital improvements, approximated $185,570,000 and $156,680,000 as of June 30, 2015 and 2014, respectively. Such amounts are to be funded by operating revenues, contributed capital, cash and investments on hand.
14. Contingencies
Workers’ Compensation Self-Insurance Liability The BWS is self-insured for workers’ compensation and disability claims up to $600,000 and in excess of $25,000,000. The BWS has obtained excess insurance coverage for claims that are not self-insured. All claims are reported to and managed by the City’s Workers’ Compensation Division (the “Division”). The BWS provides reserves for claims not covered by insurance that in the opinion of the Division will result in probable judgment against the BWS.
The liability for losses and loss adjustment expenses is comprised of case reserves and incurred but not reported loss reserves (“IBNR”). Case or outstanding loss reserves represent estimates of ultimate costs to settle reported claims. The estimated liability is presented at its net present value using a discount rate of 3%.
Determination of a reserve account for workers’ compensation is a significant estimate. It is reasonably possible that one or more future events could result in a material change in the estimated claims loss in the near term.
Board of Water Supply City and County of Honolulu Notes to Financial Statements June 30, 2015 and 2014
46
Arbitrage The BWS is required to annually calculate rebates to the U.S. Treasury on revenue bond issues. In accordance with the requirements of Section 148 of the Internal Revenue Code of 1986, as amended, rebates are calculated by bond series based on the amounts by which the cumulative amount of investment income exceeds the amount that would have been earned had funds been invested at the bond yield. As of June 30, 2015 and 2014, the arbitrage rebate and yield restriction liability totaled approximately $66,000.
Safe Drinking Water The BWS is subject to the requirements of the Safe Drinking Water Act (the “Act”), which is administered by the State Department of Health on behalf of the U.S. Environmental Protection Agency. Management believes that the BWS is in full compliance with the requirements of the Act and is not aware of any matters under the Act that may materially affect the BWSʼs customer service area.
Other Legal Matters The BWS is party to various legal proceedings arising in the normal course of business. The outcome of individual matters is not predictable. However, management believes that the ultimate resolution of all such matters, after considering insurance coverage, will not have material adverse effect on the BWSʼs financial position, results of operations, or liquidity.
15. Change in Accounting Principle
During fiscal year, 2015, BWS implemented GASB Statement Nos. 68, Accounting and Financial Reporting for Pensions – an amendment of GASB Statement No. 27, and 71, Pension Transition for Contributions Made Subsequent to the Measurement Date – an amendment of GASB Statement No. 68. Statement No. 68 establishes standards of accounting and financial reporting for defined benefit pensions and defined contribution pensions provided to the employees of state and local government employers through pension plans that are administered through trusts or equivalent arrangements in which:
Contributions from employers and non-employer contributing entities to the pension plan and earnings on those contributions are irrevocable.
Pension plan assets are dedicated to providing pensions to plan members in accordance with the benefit terns.
Pension plan assets are legally protected from the creditors of employer, nonemployee contributing entities, and the pension plan administrator. If the plan is a defined benefit pension plan, plan assets also are legally protected from creditors of the plan members.
Statement No. 68 replaces the requirements of Statement No. 27, Accounting for Pensions by State and Local Governmental Employers, as well as the requirements of Statement No. 50, Pension Disclosures, as they relate to pensions that are provided through pension plans administered as trusts or equivalent arrangements that meet certain criteria. The requirements of Statements Nos. 27 and 50 remain applicable for pensions that are not covered by the scope of this Statement.
Board of Water Supply City and County of Honolulu Notes to Financial Statements June 30, 2015 and 2014
47
Statement No. 71 is required to be implemented simultaneously with Statement No. 68 and amends the requirement related to certain pension contributions made to defined benefit pension plans prior to implementation of Statement No. 68 by employers and non-employer contributing entities.
As a result of implementing GASB Statement Nos. 68 and 71, beginning net position as of July 1, 2014 was reduced by approximately $62,442,000, to recognize BWS’s portion of the ERS pension plan net pension liability and deferred outflows of resources related to contributions subsequent to the measurement date.
Required Supplementary Information

Board of Water Supply City and County of Honolulu Schedule of Proportionate Share of the Net Pension Liability Last Ten Fiscal Years (Unaudited)
48
ProportionateShare of the Plan Fiduciary
Proportionate Net Pension Net Position asProportion of Share of the Liability as a a Percentage
the Net Pension Net Pension Covered Percentage of of the TotalLiability Liability Payroll Covered Payroll Pension Liability
Year Ended June 30,2015 0.91232473% 73,141,824$ 32,259,458$ 227% 63.92%2014 0.78362008% 69,992,291 29,765,600 235% 57.96%2006‒2013 not available.

Board of Water Supply City and County of Honolulu Schedule of Contributions Last Ten Fiscal Years (Unaudited)
49
Contributions inRelation to the
Statutorily Statutorily Contribution Contributions asRequired Required Excess Covered a Percentage of
Contribution Contributions (Deficiency) Payroll Covered Payroll
Year Ended June 30,
2014 5,161,513$ 5,931,238$ 769,725$ 32,259,458$ 18.4%2013 4,604,149 4,604,149 - 29,765,600 15.5%2005‒2012 not available.

Board of Water Supply City and County of Honolulu Schedule of Funding Progress June 30, 2015 (Unaudited)
50
Unfunded UAAL as aActuarial Percentage
Actuarial Accrued of AnnualActuarial Actuarial Accrued Liability Funded Annual CoveredValuation Value of Liability (“UAAL”) Ratio Covered Payroll
Date Assets (a) (“AAL”) (b) (b-a) (a/b) Payroll (c) ((b-a)/c)
July 1, 2013 25,638,000$ 122,886,000$ 97,248,000$ 21% 31,677,000$ 307%July 1, 2011 14,557,000 127,154,000 112,597,000 11% 29,900,000 377%July 1, 2009 5,244,000 143,333,000 138,089,000 4% 33,104,000 417%
Supplementary Information

Board of Water Supply City and County of Honolulu Schedule of Bonds Payable June 30, 2015
51
Maturing CallInterest Bond Serially Dates Outstanding
Description of Bonds Payable Rate Dated From (A) June 30, 2015
Water System Revenue Bonds Series 2006A (Non-AMT)Insured Serial Bonds 4.250% 7/7/2006 7/1/2015 (B) 2,680,000$ Insured Serial Bonds 4.250% 7/7/2006 7/1/2016 (B) 2,795,000
5,475,000
Water System Revenue Bonds Series 2006B (AMT)Insured Serial Bonds 5.000% 7/7/2006 7/1/2015 (B) 3,430,000Insured Serial Bonds 5.000% 7/7/2006 7/1/2016 (B) 3,605,000
7,035,000
Water System Revenue Bonds Series 2012A (Non-AMT)Insured Serial Bonds 3.000% 3/29/2012 7/1/2015 (B) 915,000Insured Serial Bonds 3.000% 3/29/2012 7/1/2016 (B) 940,000Insured Serial Bonds 3.000% 3/29/2012 7/1/2017 (B) 970,000Insured Serial Bonds 4.000% 3/29/2012 7/1/2018 (B) 3,960,000Insured Serial Bonds 5.000% 3/29/2012 7/1/2019 (B) 4,140,000Insured Serial Bonds 5.000% 3/29/2012 7/1/2020 (B) 2,320,000Insured Serial Bonds 5.000% 3/29/2012 7/1/2021 (B) 6,865,000Insured Serial Bonds 5.000% 3/29/2012 7/1/2022 (B) 8,535,000Insured Serial Bonds 5.000% 3/29/2012 7/1/2023 7/1/2022 3,605,000Insured Serial Bonds 5.000% 3/29/2012 7/1/2024 7/1/2022 3,790,000Insured Serial Bonds 5.000% 3/29/2012 7/1/2025 7/1/2022 3,980,000Insured Serial Bonds 5.000% 3/29/2012 7/1/2026 7/1/2022 4,185,000Insured Serial Bonds 4.500% 3/29/2012 7/1/2027 7/1/2022 4,390,000Insured Serial Bonds 4.500% 3/29/2012 7/1/2028 7/1/2022 4,595,000Insured Serial Bonds 4.500% 3/29/2012 7/1/2029 7/1/2022 4,805,000Insured Serial Bonds 4.500% 3/29/2012 7/1/2030 7/1/2022 5,025,000Insured Serial Bonds 5.000% 3/29/2012 7/1/2031 7/1/2022 5,270,000Insured Serial Bonds 5.000% 3/29/2012 7/1/2032 7/1/2022 5,540,000Insured Serial Bonds 5.000% 3/29/2012 7/1/2033 7/1/2022 5,825,000Bifurcated Serial Bonds 2.000% 3/29/2012 7/1/2020 (B) 2,000,000
81,655,000
(A) Call dates indicated are optional.(B) Noncallable.
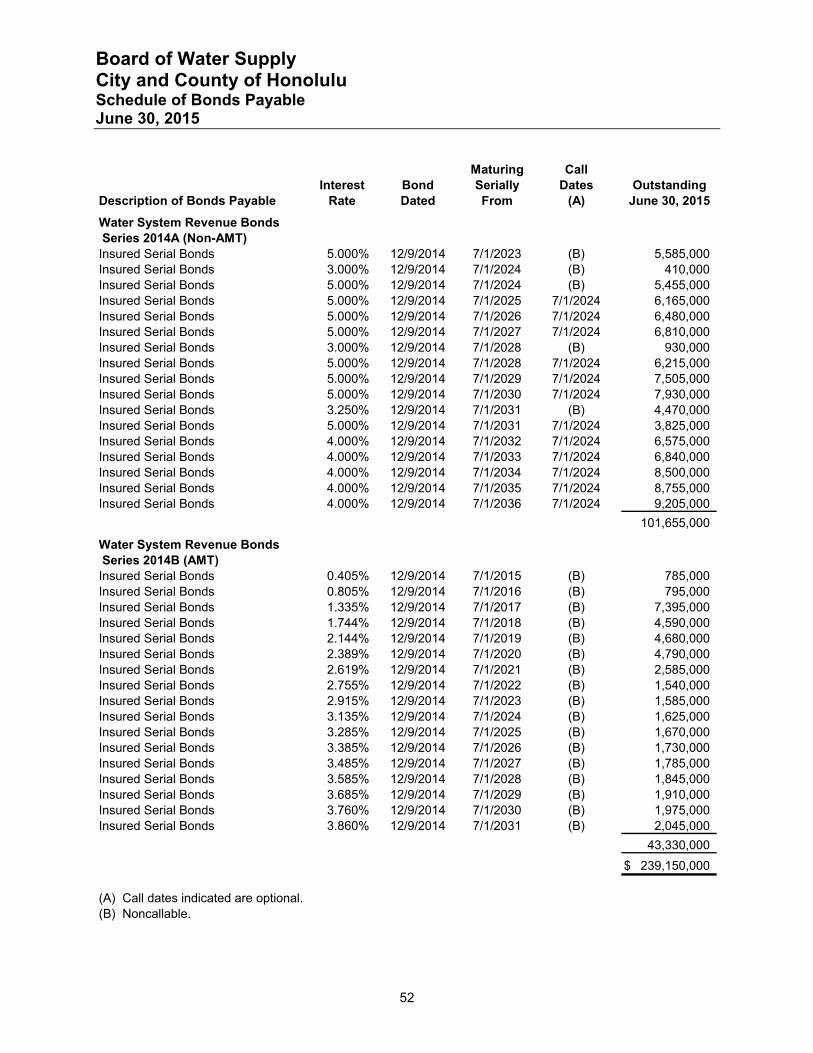
Board of Water Supply City and County of Honolulu Schedule of Bonds Payable June 30, 2015
52
Maturing CallInterest Bond Serially Dates Outstanding
Description of Bonds Payable Rate Dated From (A) June 30, 2015
Water System Revenue Bonds Series 2014A (Non-AMT)Insured Serial Bonds 5.000% 12/9/2014 7/1/2023 (B) 5,585,000Insured Serial Bonds 3.000% 12/9/2014 7/1/2024 (B) 410,000Insured Serial Bonds 5.000% 12/9/2014 7/1/2024 (B) 5,455,000Insured Serial Bonds 5.000% 12/9/2014 7/1/2025 7/1/2024 6,165,000Insured Serial Bonds 5.000% 12/9/2014 7/1/2026 7/1/2024 6,480,000Insured Serial Bonds 5.000% 12/9/2014 7/1/2027 7/1/2024 6,810,000Insured Serial Bonds 3.000% 12/9/2014 7/1/2028 (B) 930,000Insured Serial Bonds 5.000% 12/9/2014 7/1/2028 7/1/2024 6,215,000Insured Serial Bonds 5.000% 12/9/2014 7/1/2029 7/1/2024 7,505,000Insured Serial Bonds 5.000% 12/9/2014 7/1/2030 7/1/2024 7,930,000Insured Serial Bonds 3.250% 12/9/2014 7/1/2031 (B) 4,470,000Insured Serial Bonds 5.000% 12/9/2014 7/1/2031 7/1/2024 3,825,000Insured Serial Bonds 4.000% 12/9/2014 7/1/2032 7/1/2024 6,575,000Insured Serial Bonds 4.000% 12/9/2014 7/1/2033 7/1/2024 6,840,000Insured Serial Bonds 4.000% 12/9/2014 7/1/2034 7/1/2024 8,500,000Insured Serial Bonds 4.000% 12/9/2014 7/1/2035 7/1/2024 8,755,000Insured Serial Bonds 4.000% 12/9/2014 7/1/2036 7/1/2024 9,205,000
101,655,000
Water System Revenue Bonds Series 2014B (AMT)Insured Serial Bonds 0.405% 12/9/2014 7/1/2015 (B) 785,000Insured Serial Bonds 0.805% 12/9/2014 7/1/2016 (B) 795,000Insured Serial Bonds 1.335% 12/9/2014 7/1/2017 (B) 7,395,000Insured Serial Bonds 1.744% 12/9/2014 7/1/2018 (B) 4,590,000Insured Serial Bonds 2.144% 12/9/2014 7/1/2019 (B) 4,680,000Insured Serial Bonds 2.389% 12/9/2014 7/1/2020 (B) 4,790,000Insured Serial Bonds 2.619% 12/9/2014 7/1/2021 (B) 2,585,000Insured Serial Bonds 2.755% 12/9/2014 7/1/2022 (B) 1,540,000Insured Serial Bonds 2.915% 12/9/2014 7/1/2023 (B) 1,585,000Insured Serial Bonds 3.135% 12/9/2014 7/1/2024 (B) 1,625,000Insured Serial Bonds 3.285% 12/9/2014 7/1/2025 (B) 1,670,000Insured Serial Bonds 3.385% 12/9/2014 7/1/2026 (B) 1,730,000Insured Serial Bonds 3.485% 12/9/2014 7/1/2027 (B) 1,785,000Insured Serial Bonds 3.585% 12/9/2014 7/1/2028 (B) 1,845,000Insured Serial Bonds 3.685% 12/9/2014 7/1/2029 (B) 1,910,000Insured Serial Bonds 3.760% 12/9/2014 7/1/2030 (B) 1,975,000Insured Serial Bonds 3.860% 12/9/2014 7/1/2031 (B) 2,045,000
43,330,000
239,150,000$
(A) Call dates indicated are optional.(B) Noncallable.

Board of Water Supply City and County of Honolulu Schedules of Net Revenue Requirement Years Ended June 30, 2015 and 2014
53
2015 2014
RevenuesWater sales 212,486,218$ 191,593,726$ Interest 3,088,165 2,148,814 Other 4,721,506 3,776,974
Total revenues 220,295,889 197,519,514
DeductionsOperating expenses 183,533,096 179,579,388 Less: Depreciation expense (45,286,091) (45,941,002) Less: Allocated depreciation charges (1,540,393) (1,574,748)
Total deductions 136,706,612 132,063,638
Net revenues 83,589,277$ 65,455,876$
Net Revenue RequirementGreater of
1) Aggregate debt service 15,399,941$ 20,513,303$ Required deposits - -
15,399,941 20,513,303
2) Aggregate debt service 15,399,941 20,513,303 Minimum required debt service ratio x 1.20 x 1.20
Net revenue requirement 18,479,929$ 24,615,964$
Net revenue to aggregate debt service ratio 5.43 3.19