board viewer instruction manual - checksum board viewer instruction manual image information...
TRANSCRIPT
Board Viewer
INSTRUCTION MANUAL
CheckSum, Inc. P.O. Box 3279
Arlington, WA 98223 (360) 435-5510
Fax (360) 435-5535
Web Site: www.checksum.com
ii
P/N 4400-048
Revision 3/2003
Copyright 1990-2003, CheckSum, Inc.
All rights reserved
Printed in U.S.A.
Specifications and operational characteristics of the System are subject to change without notice. CheckSum, Inc. cannot take responsibility for any direct or consequential damages arising from use of this manual or the related product.
Windows is a trademark of Microsoft Corporation.
Visual MDA is a trademark of CheckSum, Inc.
iii
Table of Contents
Chapter 1: CheckSum Board Viewer Introduction 1-1 Image Information Overview 1-2 User Interface Overview 1-2 Main Screen 1-3
Chapter 2: Test Screen
Test Screen Overview 2-1 File Menu 2-2 Viewing Components in the Test Screen 2-3 Selecting a Component 2-5 Zooming 2-6 Scrolling 2-8 Selecting an Image 2-9 Clear Highlighting 2-10 Using the Area Map to Zoom and Scroll 2-11 Setup Menu 2-12 System Configuration 2-15 Setup Color Options 2-17 Controlling the Component List, Keypad, and Area Map Window Areas 2-18 Fitting Board Viewer and Visual MDA Windows on your Monitor 2-21 Features not Available in the Test Screen 2-21
Chapter 3: Failure Analysis
Opening a Test Program 3-3 Viewing Components in Failure Analysis 3-3 Searching for a Component 3-4 Reading Test Results File 3-5 Printing 3-7 Unloading Images 3-8
Chapter 4: Creating and Editing the Board View
Edit Screen 4-1 Editing Image Information 4-2 Opening a Test Program 4-3 Adding an Image 4-3 Editing Component and Testpoint List 4-5 Assigning and Modifying Component Annotation and Test Point Annotation 4-7 Annotation Special Topics 4-15 Saving Image Information with the Test Program 4-16 Importing and Exporting an Annotated Image 4-17 Add/Modify and Delete Link to Existing Image Information File 4-20 PCB Panelization Wizard 4-22 Generating Probe Map Image 4-24

iv
Names Cross Check 4-26
Chapter 5: Glossary
Glossary 5-1 Image Information Description 5-5
v
Limited Warranty
CheckSum, Inc. products, exclusive of fixturing products, are covered by a one-year limited parts and labor warranty for defects in materials and workmanship from time of original product shipment. Fixturing products (Model TR-3/TR-5/TR-7/TR-9/GS-850 and Analyst series) include a 90-day limited warranty. This warranty extends only to the original purchaser and excludes products or parts that have been subject to misuse, neglect, accident, or abnormal conditions of operations.
CheckSum, Inc. reserves the right to replace the product in lieu of repair. If the failure has been caused, as determined by CheckSum, by misuse, neglect, accident, or abnormal conditions of operation, repairs will be invoiced at a nominal cost. In such case, an estimate will be submitted before the work is started, if requested.
NOTE
THE FOREGOING WARRANTY IS IN LIEU OF ALL OTHER WARRANTIES, EXPRESS OR IMPLIED, INCLUDING BUT NOT LIMITED TO ANY IMPLIED WARRANTY OF MERCHANTABILITY, FITNESS, OR ADEQUACY FOR ANY PARTICULAR PURPOSE OR USE. CHECKSUM, INC. SHALL NOT BE LIABLE FOR ANY SPECIAL, INCIDENTAL, OR CONSEQUENTIAL DAMAGES, WHETHER IN CONTRACT, TORT, OR OTHERWISE.
In the event of a failure of a product during the warranty period:
Contact CheckSum for a returned material authorization number (RMA).
Pack the product in its original packing material or suitable equivalent and return it postage-paid to CheckSum, Inc. Mark the package clearly with the RMA number.
CheckSum will repair the product and return it postage-paid. Repairs are typically completed within two working days of receipt.
In the event that expedited repair is necessary, call CheckSum for information. In many cases a replacement module can be provided immediately.

vi
Chapter 1 CheckSum Board Viewer
Introduction
CheckSum Board Viewer is a 32-bit Windows application that can display an image of a PCB, board outline, schematic, probe map, user-defined and setup images. By defining the location of components on the PCB, board outline, schematic and test points on the probe map, you can show Passed/Failed/Adjustment components during the testing process or based on test results from a file (an SPC log file or a test report file).
Typical uses:
• During board test, a test station operator needs to adjust a specific component. Board Viewer can aid the test station operator by highlighting the component on the UUT (Unit Under Test).
• During board test, a user-defined image can be displayed for visual instructions. See the PICT test type in Visual MDA help for additional details.
• During board test, the Board Viewer can aid the test station operator to pinpoint problems by highlighting the failed components on the UUT.
• Using the test results file, the Board Viewer can aid the repair process by highlighting bad components on a UUT.
Following are the steps needed to use the Board Viewer to highlight components on a UUT being tested:
1. For each type of view, you need a graphic image file (e.g., photograph of the board, board outline, schematic) and an existing Visual MDA test program.
2. Using the Board Viewer editor, interactively define the location of the components in each of the graphic images.
3. Using the Board Viewer, assign the default settings such as PCB (photograph of the UUT) as the default image, highlight failed components, display highlighting at end of the test, and control of the windows used by Visual MDA and Board Viewer.
4. Save this information (steps 2 and 3) with the test program.
CheckSum Board Viewer Instruction Manual Image Information Overview
1-2
5. Optionally, you can use the Visual MDA Editor to enter PICT test steps in the test program to change the Board Viewer behavior (e.g., image displayed or highlighting) during program execution. See PICT test type in Visual MDA Help for details.
6. Run the test program with CheckSum Visual MDA and watch the Board Viewer show the Passed/Failed components!
Image Information Overview
The Board Viewer maintains all the information needed to display and highlight components in the Image Information. It contains the default settings and a set of annotated images.
Each annotated image contains a graphic image and component/test-point location and appearance of the highlight.
The Image Information is saved with the test program via embedding or linking (see Saving Image Information with the Test Program on page 4-16 for details).
For more details, please see the Glossary – Image Information Description on page 5-5.
User Interface Overview
The Board Viewer has four screens, the Main Screen, Edit Screen, the Test Screen, and Failure Analysis.
The Main Screen is the first screen you will see when you run the Board Viewer. From the Main Screen you can access the Edit Screen or the Failure Analysis. You need to run Visual MDA to access the Test Screen.
• Use the Edit Screen to edit and save the Image Information with a test program.
• Use the Test Screen to highlight Passed/Failed/Adjustment components during board test and to display user defined images. Visual MDA automatically controls the Board Viewer in this screen.
• Use Failure Analysis to view where components are located on a board and to analyze errors detected from earlier tests by reading in a test results file. The Board Viewer is not used in conjunction with Visual MDA in this screen and the Edit Screen.
In the following sections, we will discuss the Test Screen and Failure Analysis first, so that you can see the Board Viewer in action without having to understand the details on how to produce the Image Information. Then we will discuss the Edit Screen to guide you to produce the Image Information.
Instruction Manual CheckSum Board Viewer Main Screen
1-3
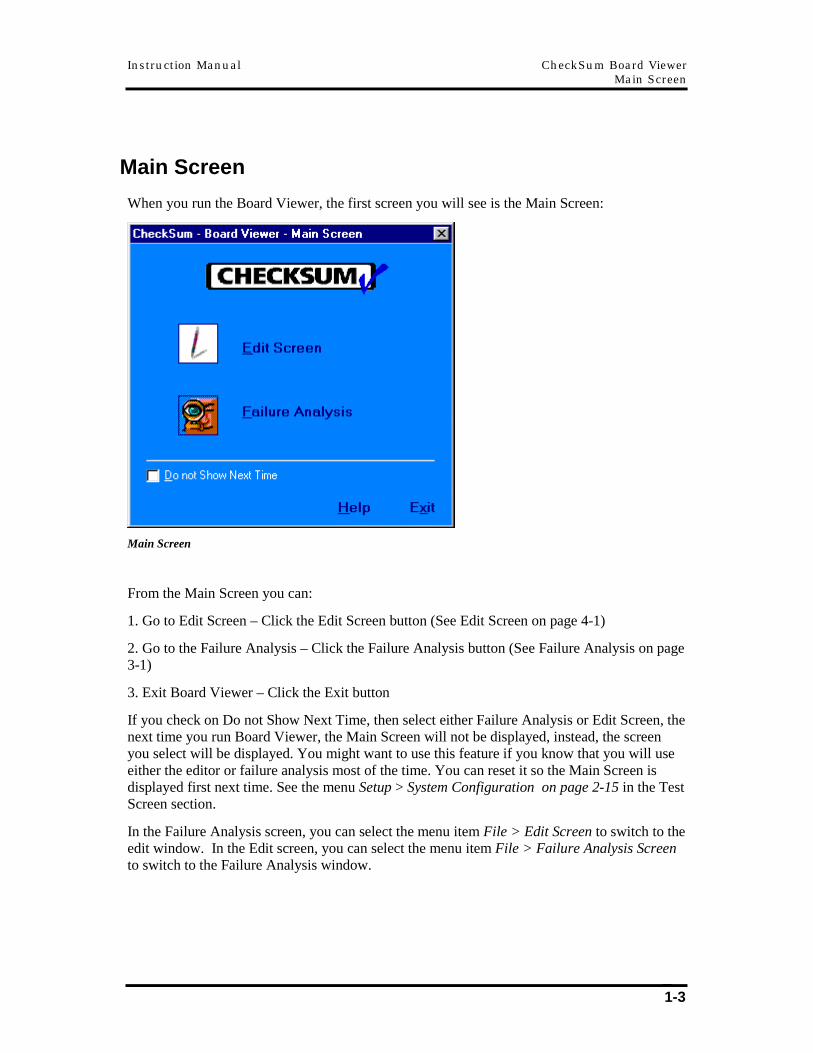
Main Screen
When you run the Board Viewer, the first screen you will see is the Main Screen:
Main Screen
From the Main Screen you can:
1. Go to Edit Screen – Click the Edit Screen button (See Edit Screen on page 4-1)
2. Go to the Failure Analysis – Click the Failure Analysis button (See Failure Analysis on page 3-1)
3. Exit Board Viewer – Click the Exit button
If you check on Do not Show Next Time, then select either Failure Analysis or Edit Screen, the next time you run Board Viewer, the Main Screen will not be displayed, instead, the screen you select will be displayed. You might want to use this feature if you know that you will use either the editor or failure analysis most of the time. You can reset it so the Main Screen is displayed first next time. See the menu Setup > System Configuration on page 2-15 in the Test Screen section.
In the Failure Analysis screen, you can select the menu item File > Edit Screen to switch to the edit window. In the Edit screen, you can select the menu item File > Failure Analysis Screen to switch to the Failure Analysis window.

CheckSum Board Viewer Instruction Manual Main Screen
1-4
Chapter 2 Test Screen
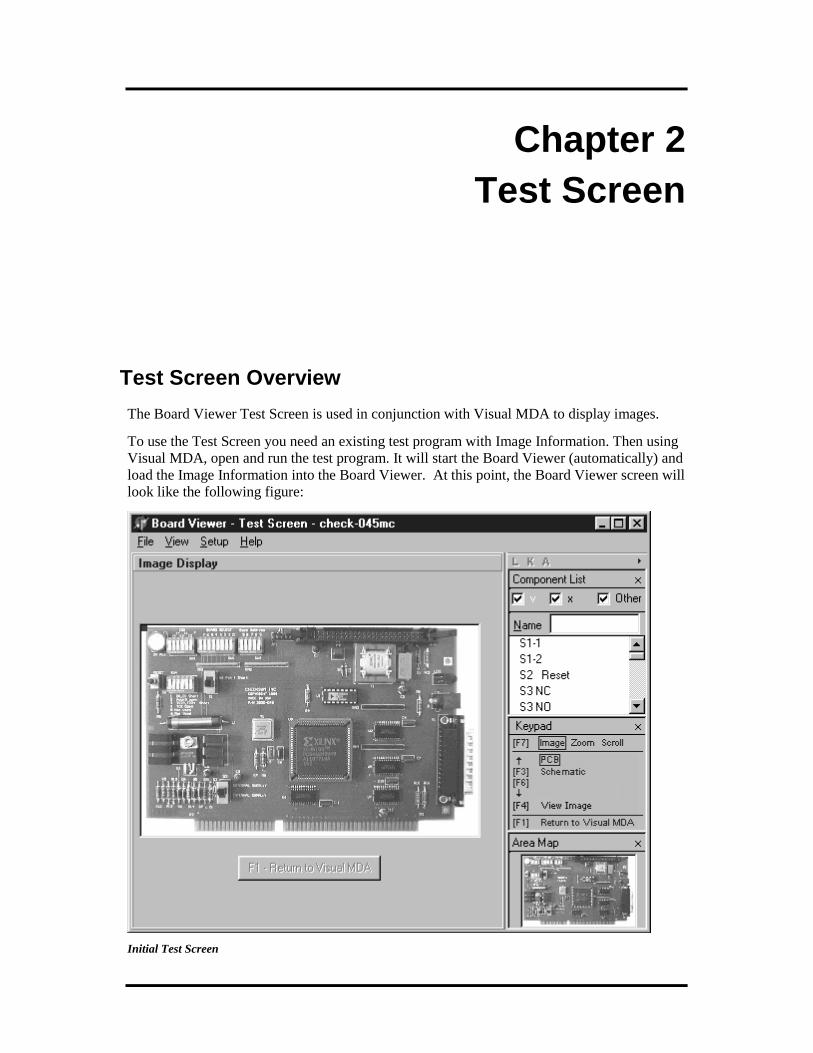
Test Screen Overview
The Board Viewer Test Screen is used in conjunction with Visual MDA to display images.
To use the Test Screen you need an existing test program with Image Information. Then using Visual MDA, open and run the test program. It will start the Board Viewer (automatically) and load the Image Information into the Board Viewer. At this point, the Board Viewer screen will look like the following figure:
Initial Test Screen
Test Screen Instruction Manual File Menu
2-2
The Board Viewer Application, Test Screen identifier and the Test Program filename are shown at the very top of the window. The Image Display window area shows the Default Image.
As Visual MDA runs the test program and finds Passed/Failed/Adjustment components, it tells the Board Viewer about these components as specified in the Test Settings section on page 2-12 of the Setup menu.
The Board Viewer highlights Passed and/or Failed components either during or following test program execution.
For information on the advanced features of test program control of the Test Screen see the PICT test type in Visual MDA Help.
When Visual MDA is not executing the test program (e.g., between test runs, during adjustment of a component), you can use the menus and window areas in the Board Viewer to manipulate the view (e.g., zoom, scroll, select components).
The following topics describe the Test Screen menus and window areas:
File Menu below Viewing Components on page 2-3 Selecting a Component on page 2-5 Zooming on page 2-6 Scrolling on page 2-8 Selecting an Image on page 2-9 Clear Highlighting on page 2-10 Using the Area Map to Zoom and Scroll on page 2-11 Setup Menu on page 2-12 Test Settings on page 2-12 System Configuration on page 2-15 Color Options on page 2-17 Controlling the Component List, Keypad, and Area Map Window Areas on page 2-18 Fitting Window Size with Visual MDA on page 2-21 Features not available in the Test Screen on page 2-21
File Menu
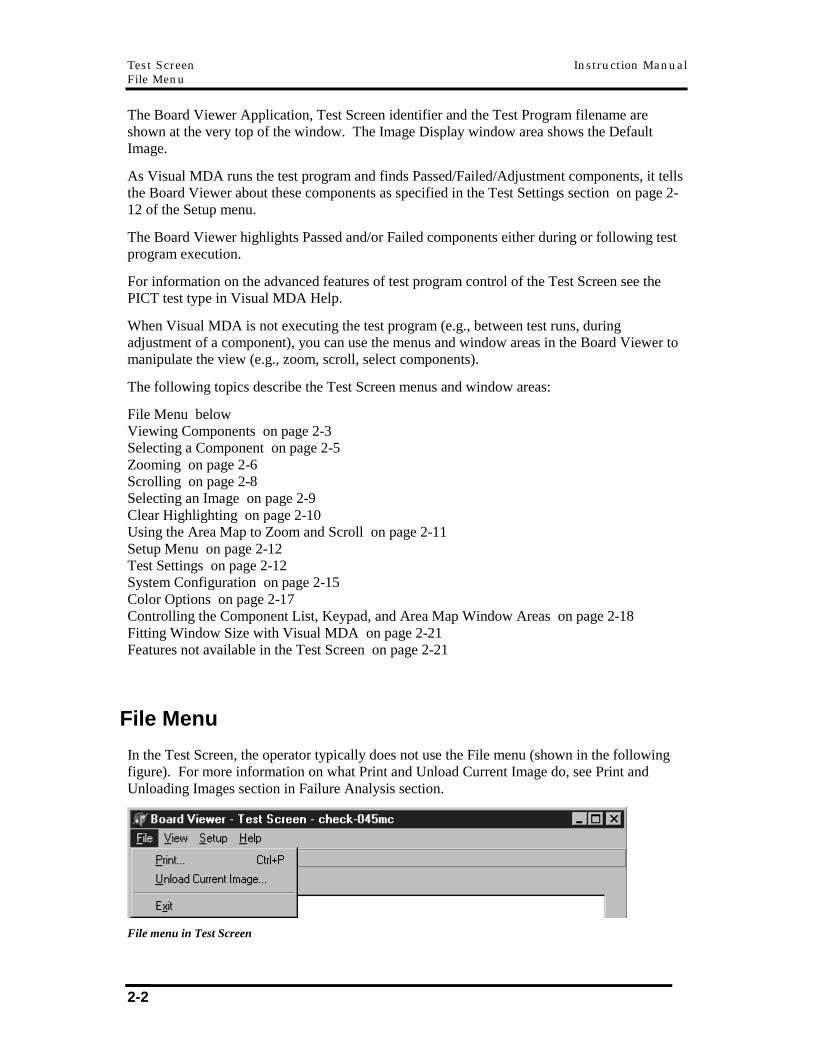
In the Test Screen, the operator typically does not use the File menu (shown in the following figure). For more information on what Print and Unload Current Image do, see Print and Unloading Images section in Failure Analysis section.
File menu in Test Screen
Instruction Manual Test Screen Viewing Components in the Test Screen
2-3
Selecting Exit from the File Menu will terminate the Board Viewer.
A confirmation dialog will be presented if you attempt to terminate the Board Viewer in the Test Screen.
Confirmation before exiting Board Viewer in Test Screen
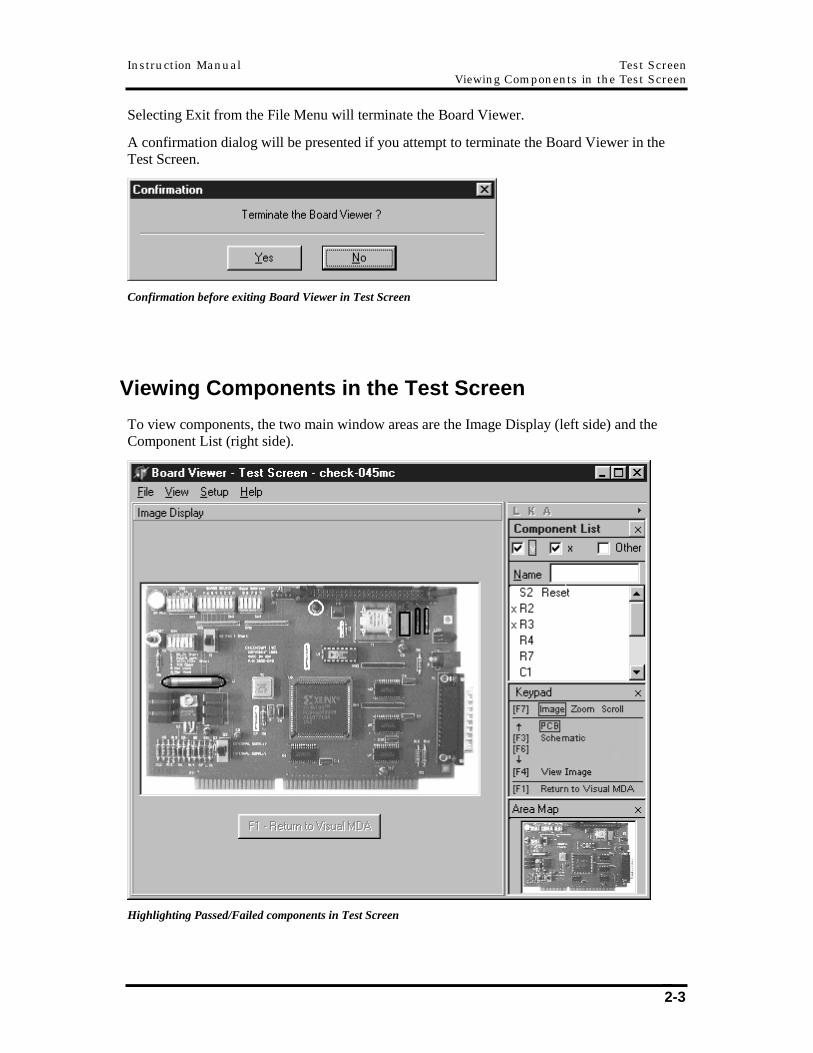
Viewing Components in the Test Screen
To view components, the two main window areas are the Image Display (left side) and the Component List (right side).
Highlighting Passed/Failed components in Test Screen
Test Screen Instruction Manual Viewing Components in the Test Screen
2-4
Image Display: Shows the picture of the current image
Component List: Shows the names of the highlighted components
The Image Display shows the current image and also highlights Passed/Failed/Adjustment components that are shown in the Component List and are on the current Image.
The component name is displayed as a red color (default color) if it is a failed component, a green color if it is a passed component, and yellow if it is an adjustment component. The Setup > Color Options selection allows you to change these colors.
While multiple components may be highlighted simultaneously as passed or failed, only one component can be highlighted as the adjustment component at a time.
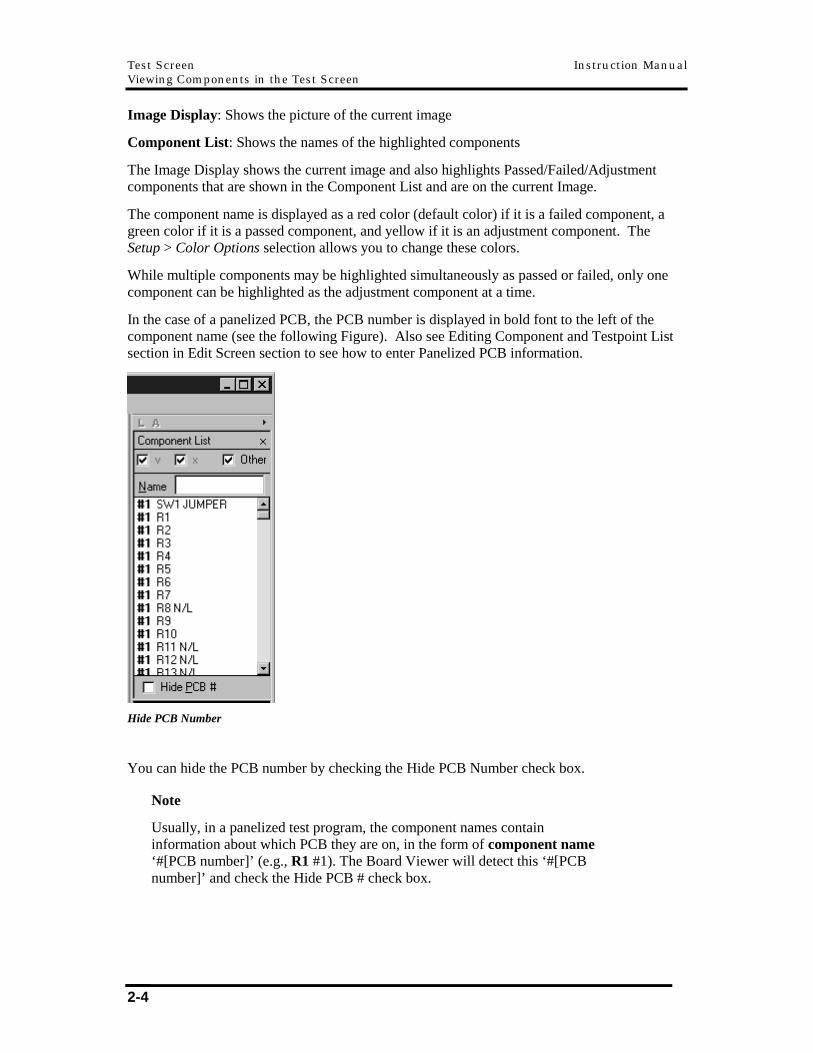
In the case of a panelized PCB, the PCB number is displayed in bold font to the left of the component name (see the following Figure). Also see Editing Component and Testpoint List section in Edit Screen section to see how to enter Panelized PCB information.
Hide PCB Number
You can hide the PCB number by checking the Hide PCB Number check box.
Note
Usually, in a panelized test program, the component names contain information about which PCB they are on, in the form of component name ‘#[PCB number]’ (e.g., R1 #1). The Board Viewer will detect this ‘#[PCB number]’ and check the Hide PCB # check box.
Instruction Manual Test Screen Selecting a Component
2-5
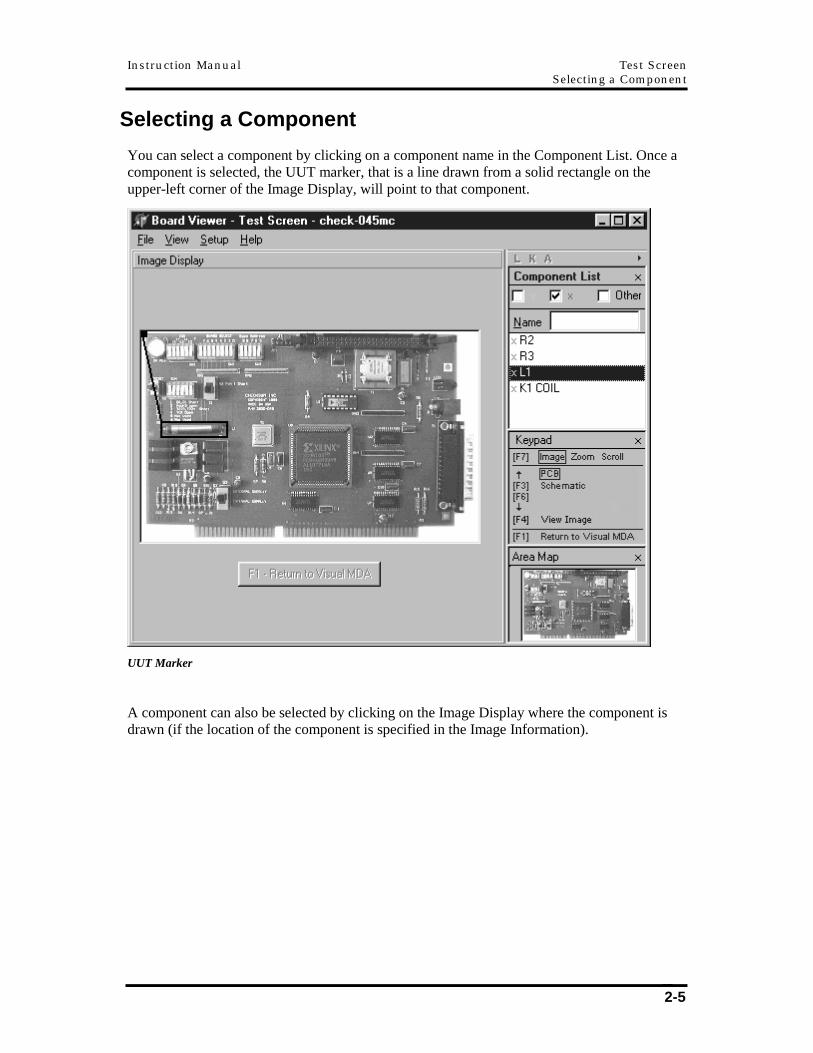
Selecting a Component
You can select a component by clicking on a component name in the Component List. Once a component is selected, the UUT marker, that is a line drawn from a solid rectangle on the upper-left corner of the Image Display, will point to that component.
UUT Marker
A component can also be selected by clicking on the Image Display where the component is drawn (if the location of the component is specified in the Image Information).
Test Screen Instruction Manual Zooming
2-6
Zooming
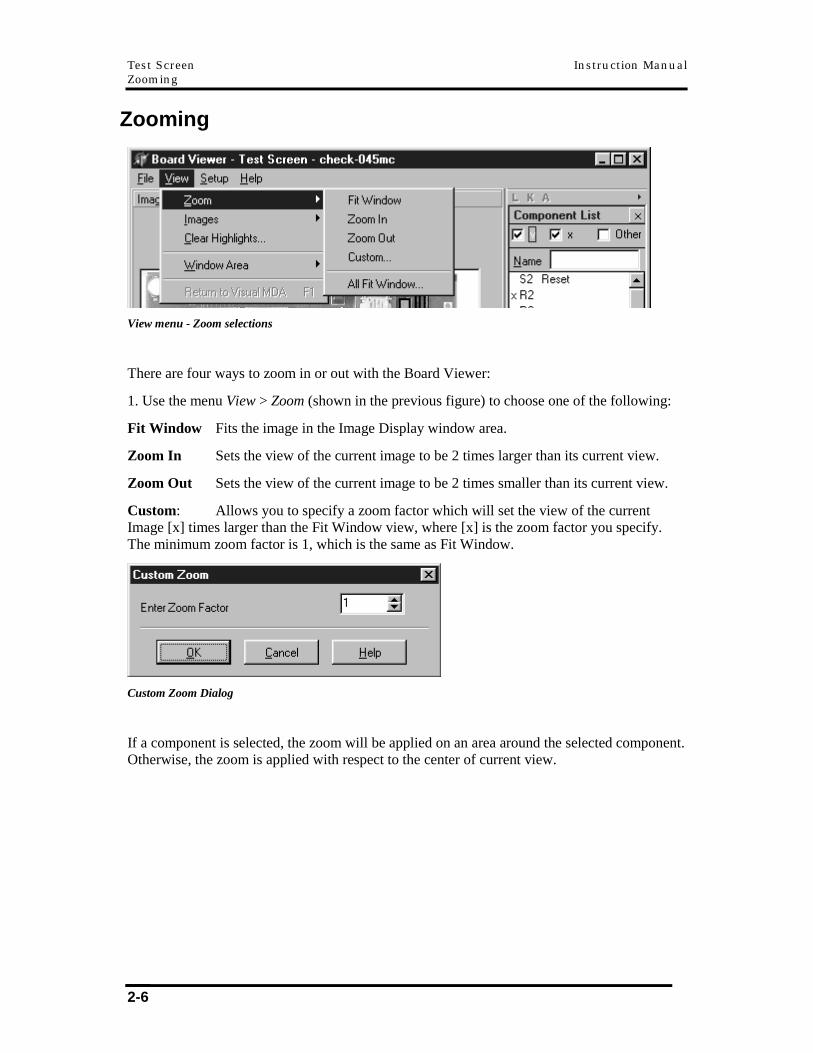
View menu - Zoom selections
There are four ways to zoom in or out with the Board Viewer:
1. Use the menu View > Zoom (shown in the previous figure) to choose one of the following:
Fit Window Fits the image in the Image Display window area.
Zoom In Sets the view of the current image to be 2 times larger than its current view.
Zoom Out Sets the view of the current image to be 2 times smaller than its current view.
Custom: Allows you to specify a zoom factor which will set the view of the current Image [x] times larger than the Fit Window view, where [x] is the zoom factor you specify. The minimum zoom factor is 1, which is the same as Fit Window.
Custom Zoom Dialog
If a component is selected, the zoom will be applied on an area around the selected component. Otherwise, the zoom is applied with respect to the center of current view.
Instruction Manual Test Screen Zooming
2-7
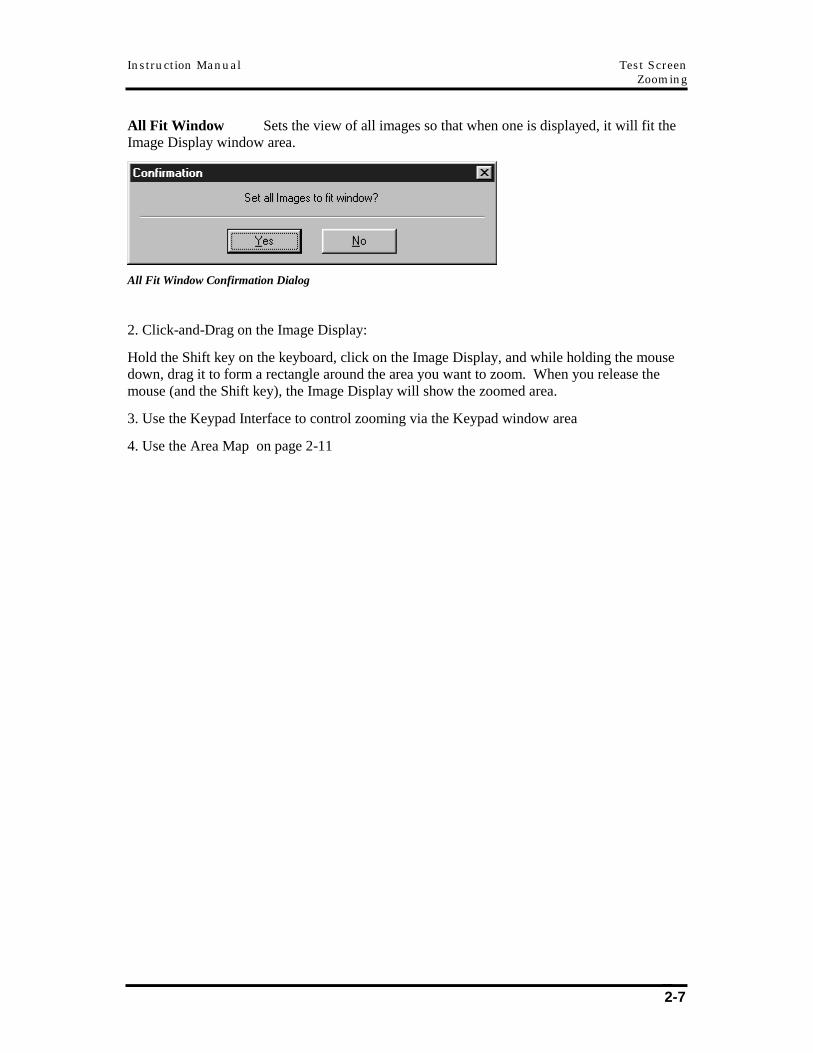
All Fit Window Sets the view of all images so that when one is displayed, it will fit the Image Display window area.
All Fit Window Confirmation Dialog
2. Click-and-Drag on the Image Display:
Hold the Shift key on the keyboard, click on the Image Display, and while holding the mouse down, drag it to form a rectangle around the area you want to zoom. When you release the mouse (and the Shift key), the Image Display will show the zoomed area.
3. Use the Keypad Interface to control zooming via the Keypad window area
4. Use the Area Map on page 2-11
Test Screen Instruction Manual Scrolling
2-8
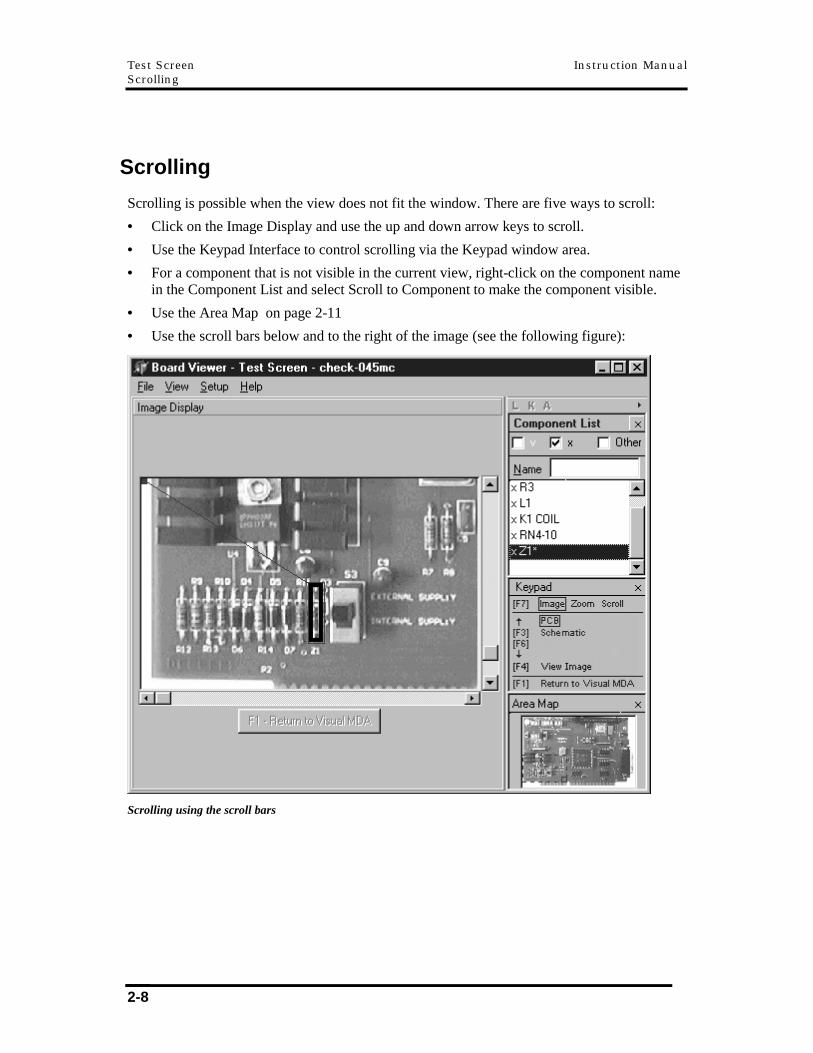
Scrolling
Scrolling is possible when the view does not fit the window. There are five ways to scroll:
• Click on the Image Display and use the up and down arrow keys to scroll.
• Use the Keypad Interface to control scrolling via the Keypad window area.
• For a component that is not visible in the current view, right-click on the component name in the Component List and select Scroll to Component to make the component visible.
• Use the Area Map on page 2-11
• Use the scroll bars below and to the right of the image (see the following figure):
Scrolling using the scroll bars
Instruction Manual Test Screen Selecting an Image
2-9
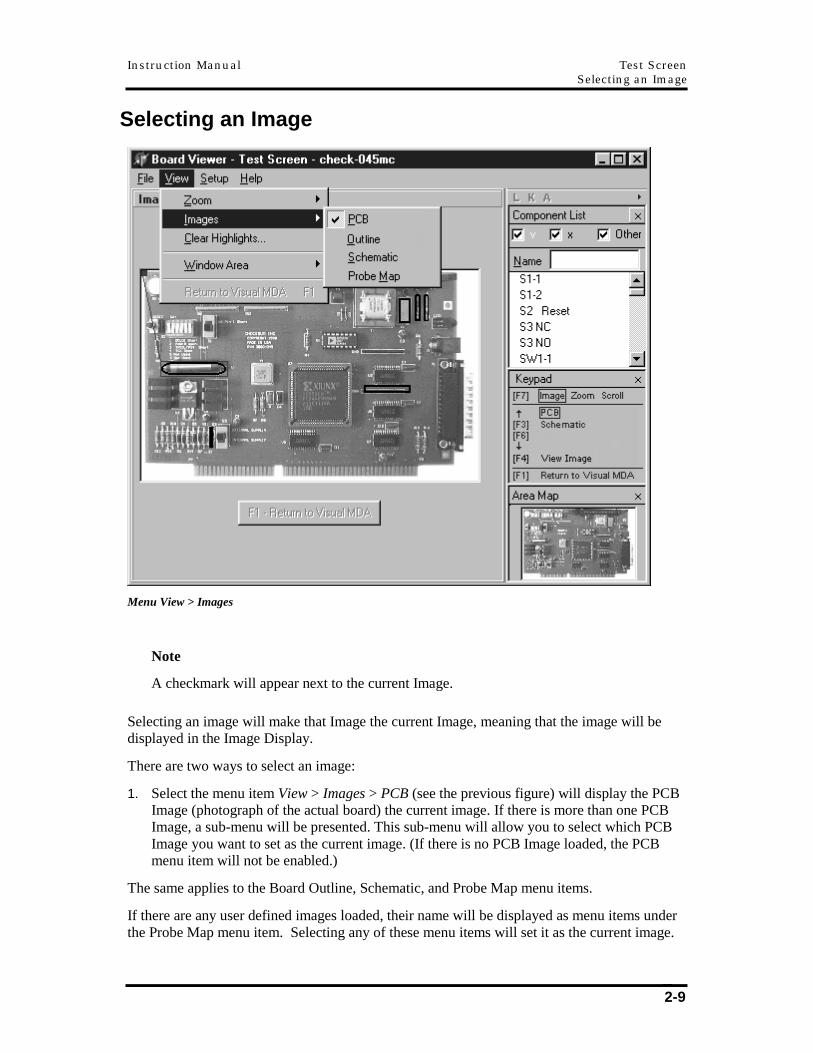
Selecting an Image
Menu View > Images
Note
A checkmark will appear next to the current Image.
Selecting an image will make that Image the current Image, meaning that the image will be displayed in the Image Display.
There are two ways to select an image:
1. Select the menu item View > Images > PCB (see the previous figure) will display the PCB Image (photograph of the actual board) the current image. If there is more than one PCB Image, a sub-menu will be presented. This sub-menu will allow you to select which PCB Image you want to set as the current image. (If there is no PCB Image loaded, the PCB menu item will not be enabled.)
The same applies to the Board Outline, Schematic, and Probe Map menu items.
If there are any user defined images loaded, their name will be displayed as menu items under the Probe Map menu item. Selecting any of these menu items will set it as the current image.
Test Screen Instruction Manual Clear Highlighting
2-10
2. Use the Keypad Interface to control image selection via the Keypad window area.
Clear Highlighting
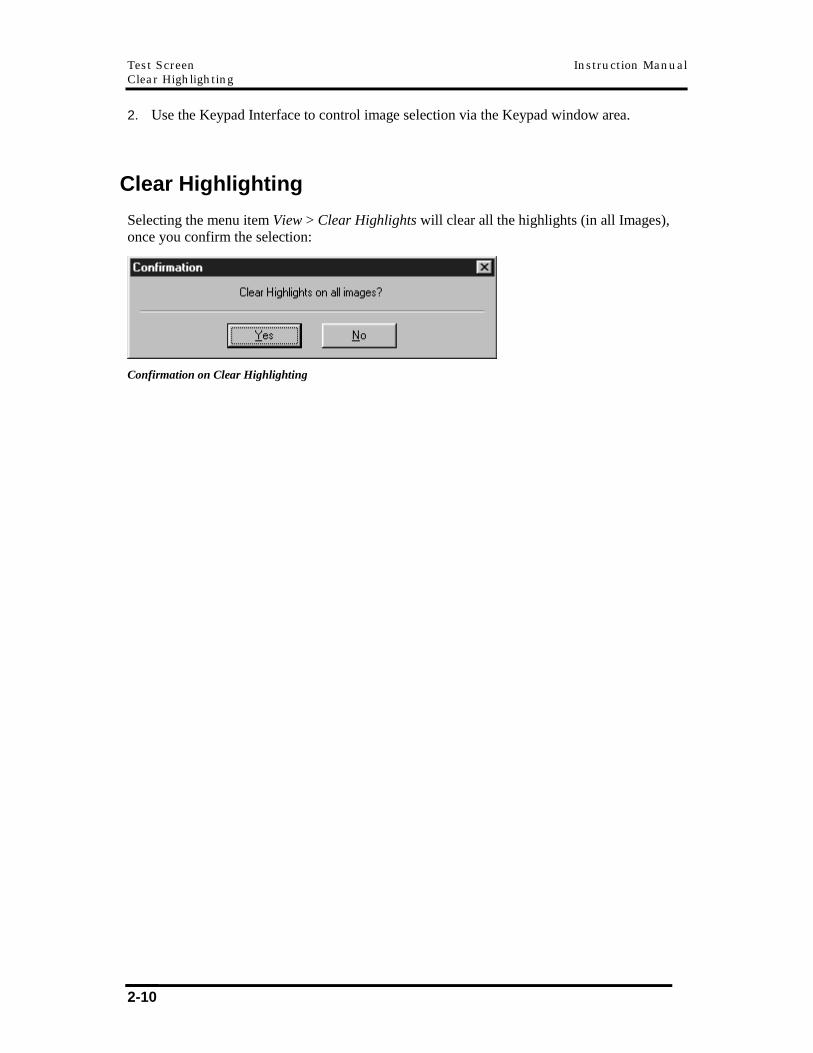
Selecting the menu item View > Clear Highlights will clear all the highlights (in all Images), once you confirm the selection:
Confirmation on Clear Highlighting
Instruction Manual Test Screen Using the Area Map to Zoom and Scroll
2-11
Using the Area Map to Zoom and Scroll
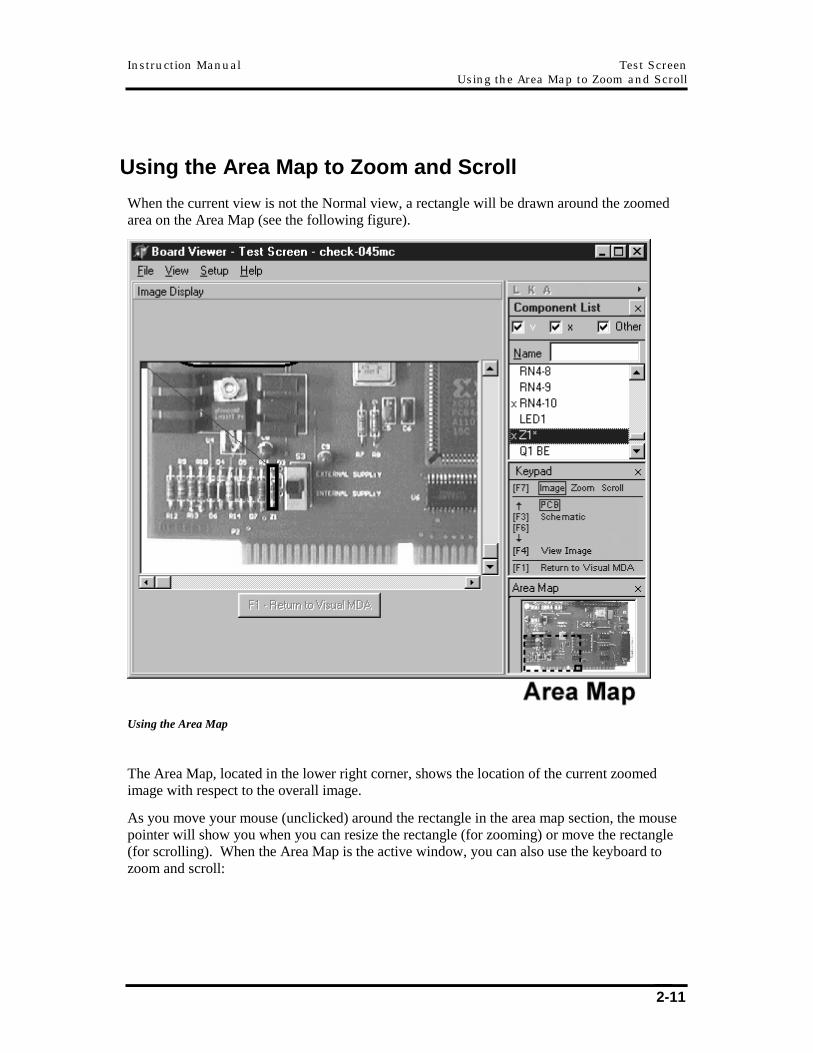
When the current view is not the Normal view, a rectangle will be drawn around the zoomed area on the Area Map (see the following figure).
Using the Area Map
The Area Map, located in the lower right corner, shows the location of the current zoomed image with respect to the overall image.
As you move your mouse (unclicked) around the rectangle in the area map section, the mouse pointer will show you when you can resize the rectangle (for zooming) or move the rectangle (for scrolling). When the Area Map is the active window, you can also use the keyboard to zoom and scroll:
Test Screen Instruction Manual Setup Menu
2-12
Zoom
• Click at the lower-right corner of the rectangle and while holding the mouse down, drag it to resize the rectangle. When you release the mouse, the Image Display will show the new zoomed area.
• Hold the CTRL key down and use the Up/Down arrow keys to resize the rectangle. The Image Display will then show the new zoomed area.
Scroll
• Click within the area map rectangle and drag it around (the Image Display will be show the area within the rectangle as you do this). Release the mouse when you have found the area you want to see.
• Use the Up/Down/Left/Right arrow keys to scroll.
• Click on a point outside the rectangle, the rectangle will move to that point.
Setup Menu
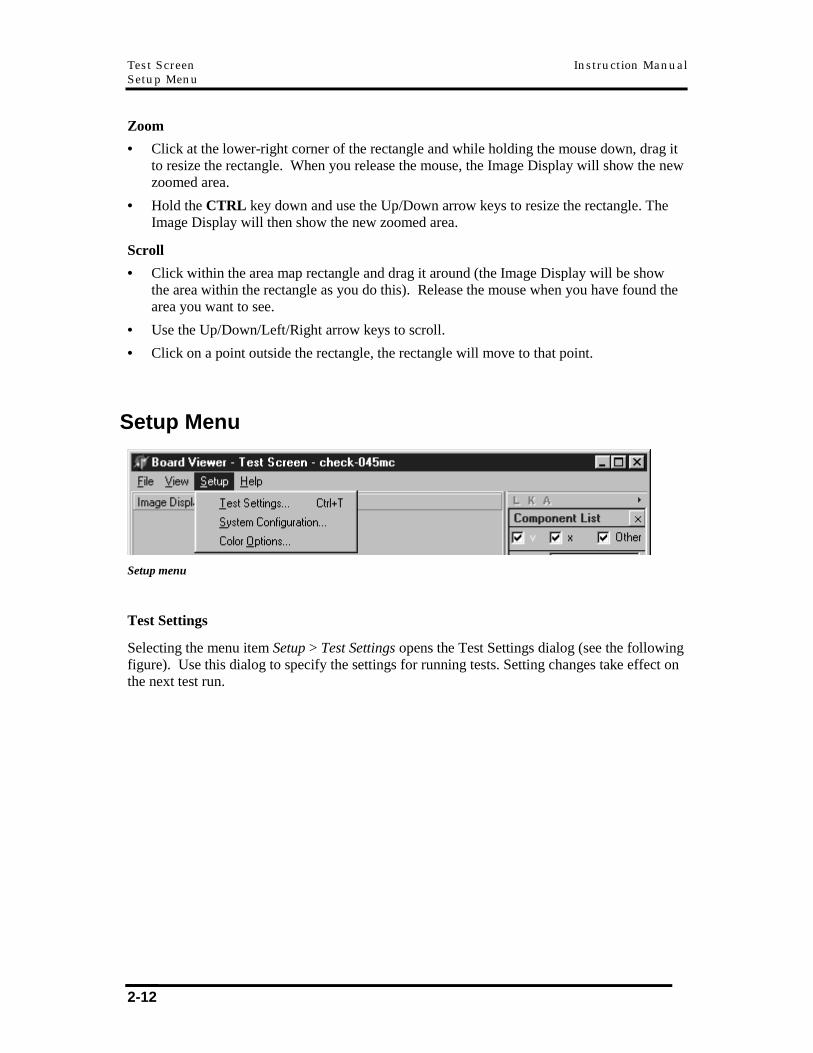
Setup menu
Test Settings
Selecting the menu item Setup > Test Settings opens the Test Settings dialog (see the following figure). Use this dialog to specify the settings for running tests. Setting changes take effect on the next test run.
Instruction Manual Test Screen Setup Menu
2-13
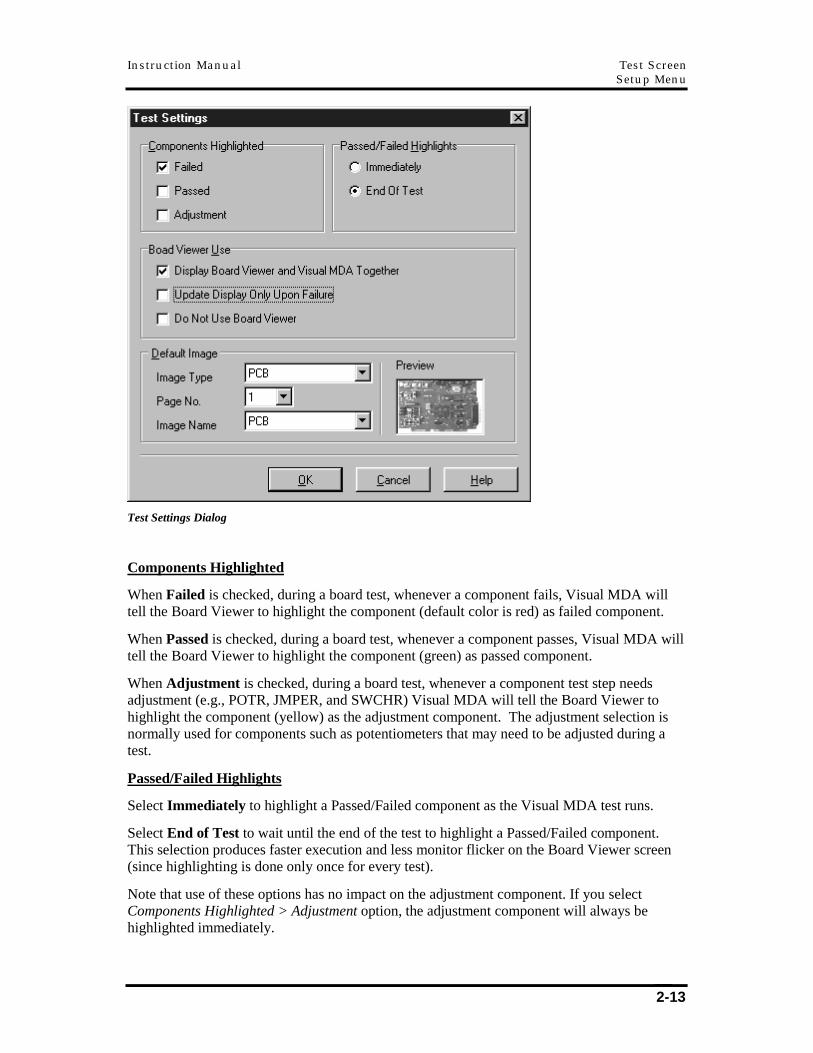
Test Settings Dialog
Components Highlighted
When Failed is checked, during a board test, whenever a component fails, Visual MDA will tell the Board Viewer to highlight the component (default color is red) as failed component.
When Passed is checked, during a board test, whenever a component passes, Visual MDA will tell the Board Viewer to highlight the component (green) as passed component.
When Adjustment is checked, during a board test, whenever a component test step needs adjustment (e.g., POTR, JMPER, and SWCHR) Visual MDA will tell the Board Viewer to highlight the component (yellow) as the adjustment component. The adjustment selection is normally used for components such as potentiometers that may need to be adjusted during a test.
Passed/Failed Highlights
Select Immediately to highlight a Passed/Failed component as the Visual MDA test runs.
Select End of Test to wait until the end of the test to highlight a Passed/Failed component. This selection produces faster execution and less monitor flicker on the Board Viewer screen (since highlighting is done only once for every test).
Note that use of these options has no impact on the adjustment component. If you select Components Highlighted > Adjustment option, the adjustment component will always be highlighted immediately.
Test Screen Instruction Manual Setup Menu
2-14
Also note that in the following two cases, if the highlighted component is not on the current image (when there are more than one image of the same type), the Board Viewer will change the current image so that the highlighted component is displayed:
Case 1. Highlight Passed/Failed component when the Immediately option is selected Case 2. Highlight Adjustment component
Board Viewer Use
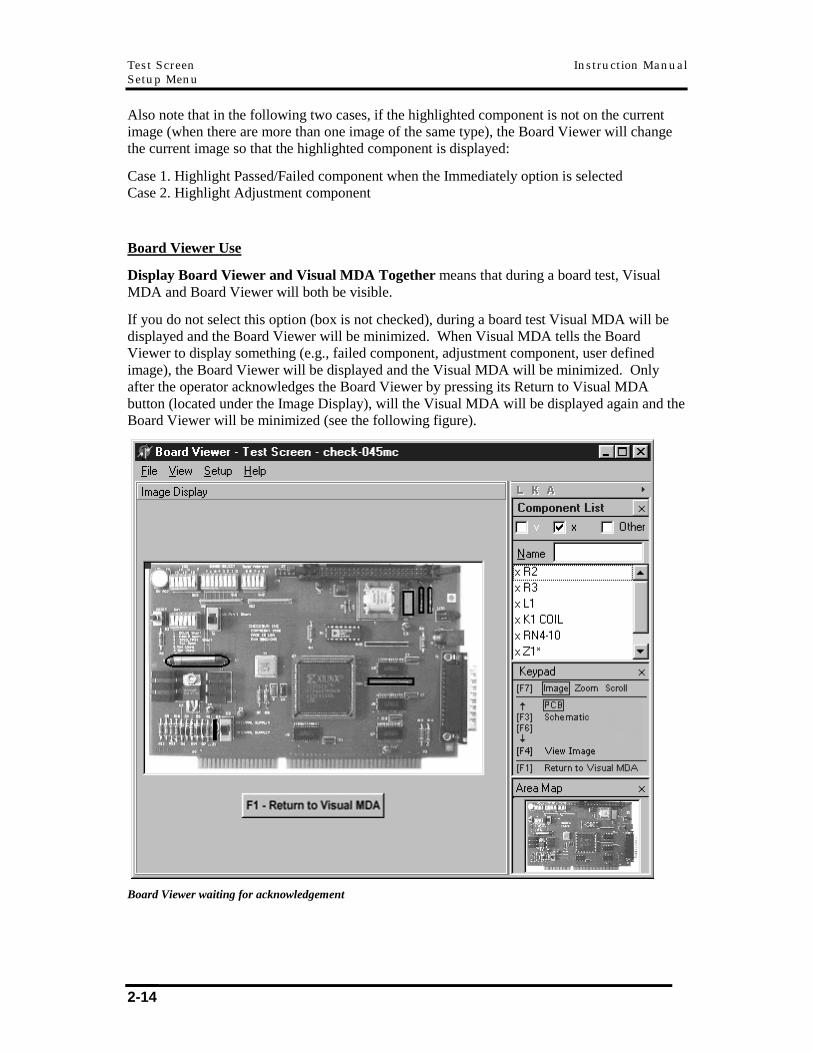
Display Board Viewer and Visual MDA Together means that during a board test, Visual MDA and Board Viewer will both be visible.
If you do not select this option (box is not checked), during a board test Visual MDA will be displayed and the Board Viewer will be minimized. When Visual MDA tells the Board Viewer to display something (e.g., failed component, adjustment component, user defined image), the Board Viewer will be displayed and the Visual MDA will be minimized. Only after the operator acknowledges the Board Viewer by pressing its Return to Visual MDA button (located under the Image Display), will the Visual MDA will be displayed again and the Board Viewer will be minimized (see the following figure).
Board Viewer waiting for acknowledgement
Instruction Manual Test Screen System Configuration
2-15
Note that besides using the Return to Visual MDA button, you can also use the Return to Visual MDA menu item under the View menu or the F1 key of the keypad (see System Configuration below).
If you check Update Display only Upon Board Failure, the component highlight will be displayed only if the board test failed.
When Do not use Board Viewer is selected, Visual MDA will not start the Board Viewer program.
Default Image
The options below allow you to specify which Image you want to be visible initially when the test program is loaded:
Image Name allows you to specify the name of the image Image Type allows you to specify the type of the image
If there is more than one image for a type, the Page No. allows you to specify the page number with respect to its image type.
The Preview area shows a thumbnail picture of the image.
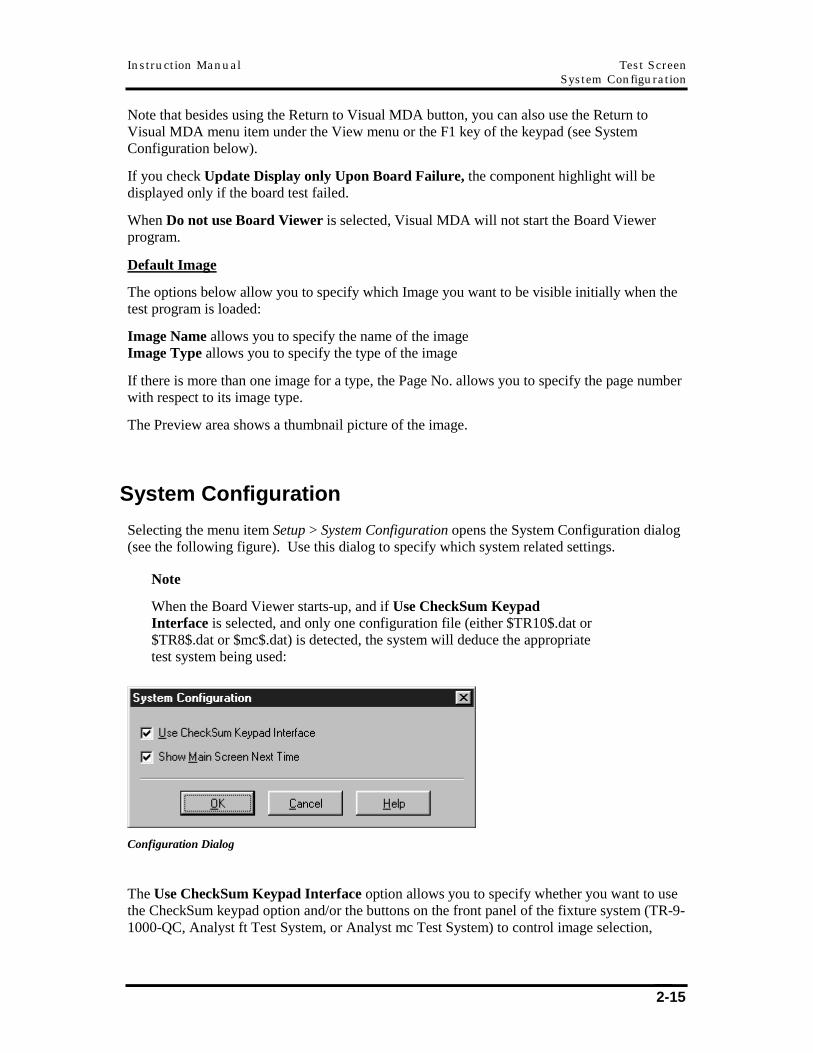
System Configuration
Selecting the menu item Setup > System Configuration opens the System Configuration dialog (see the following figure). Use this dialog to specify which system related settings.
Note
When the Board Viewer starts-up, and if Use CheckSum Keypad Interface is selected, and only one configuration file (either $TR10$.dat or $TR8$.dat or $mc$.dat) is detected, the system will deduce the appropriate test system being used:
Configuration Dialog
The Use CheckSum Keypad Interface option allows you to specify whether you want to use the CheckSum keypad option and/or the buttons on the front panel of the fixture system (TR-9-1000-QC, Analyst ft Test System, or Analyst mc Test System) to control image selection,
Test Screen Instruction Manual System Configuration
2-16
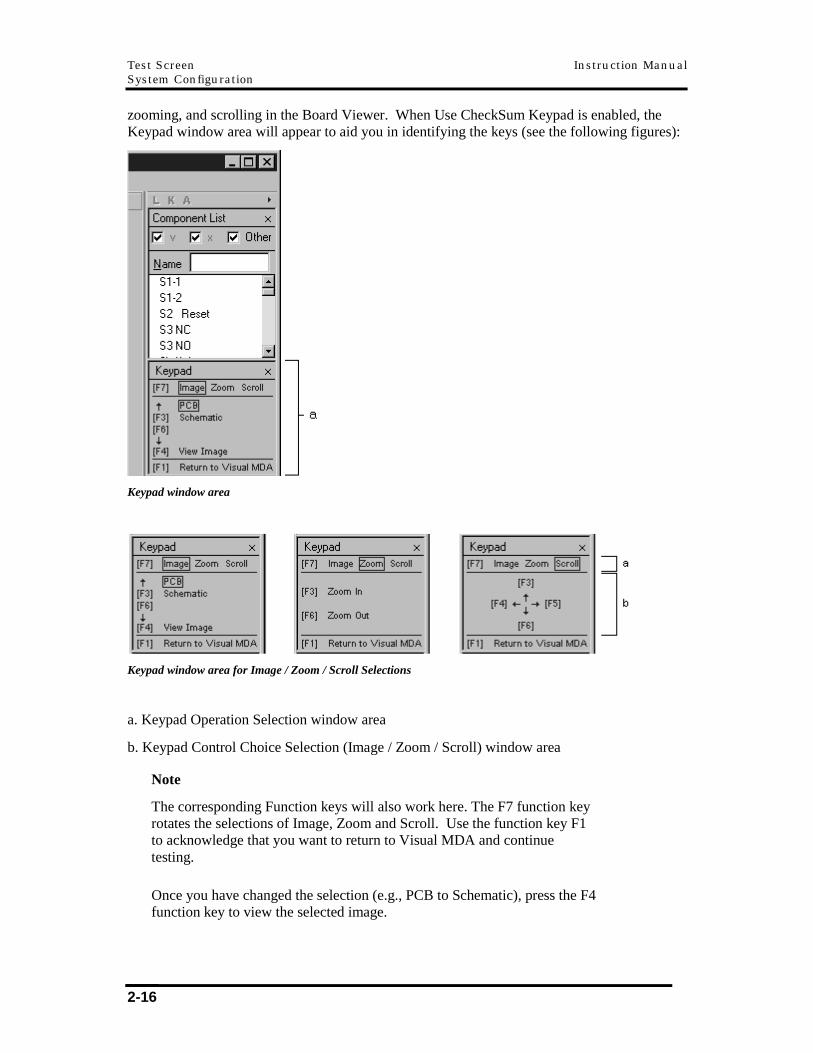
zooming, and scrolling in the Board Viewer. When Use CheckSum Keypad is enabled, the Keypad window area will appear to aid you in identifying the keys (see the following figures):
Keypad window area
Keypad window area for Image / Zoom / Scroll Selections
a. Keypad Operation Selection window area
b. Keypad Control Choice Selection (Image / Zoom / Scroll) window area
Note
The corresponding Function keys will also work here. The F7 function key rotates the selections of Image, Zoom and Scroll. Use the function key F1 to acknowledge that you want to return to Visual MDA and continue testing.
Once you have changed the selection (e.g., PCB to Schematic), press the F4 function key to view the selected image.
Instruction Manual Test Screen Setup Color Options
2-17
Setup Color Options
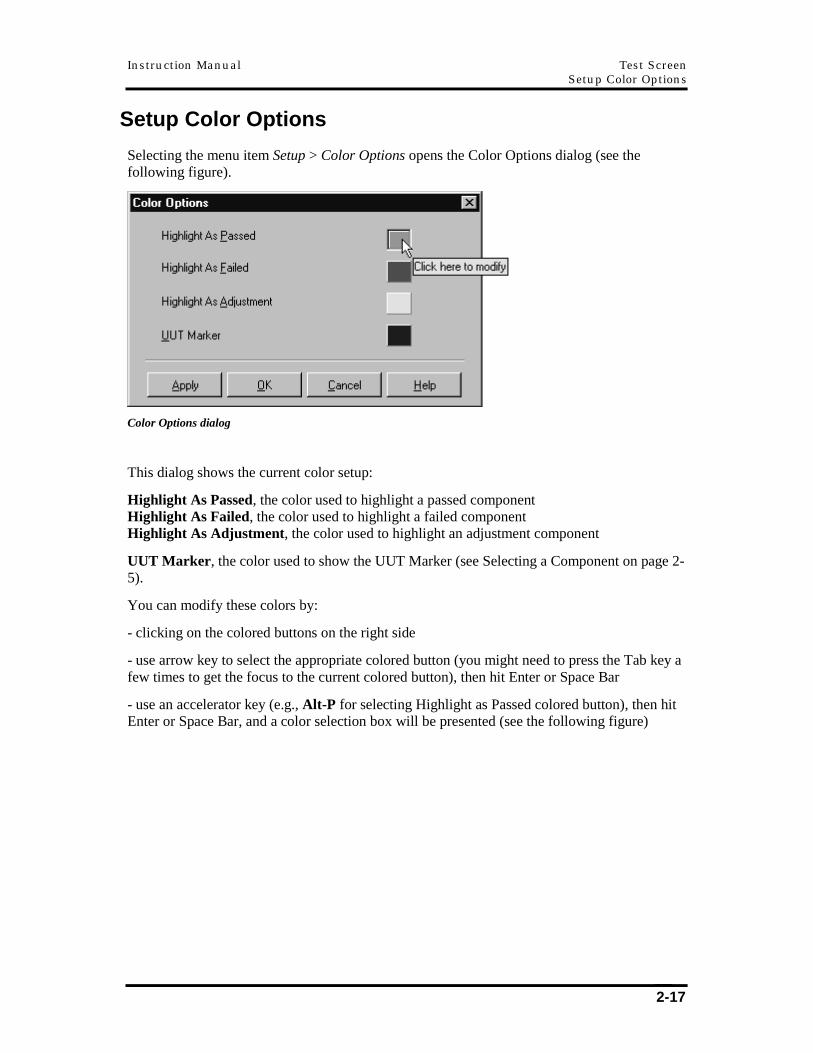
Selecting the menu item Setup > Color Options opens the Color Options dialog (see the following figure).
Color Options dialog
This dialog shows the current color setup:
Highlight As Passed, the color used to highlight a passed component Highlight As Failed, the color used to highlight a failed component Highlight As Adjustment, the color used to highlight an adjustment component
UUT Marker, the color used to show the UUT Marker (see Selecting a Component on page 2-5).
You can modify these colors by:
- clicking on the colored buttons on the right side
- use arrow key to select the appropriate colored button (you might need to press the Tab key a few times to get the focus to the current colored button), then hit Enter or Space Bar
- use an accelerator key (e.g., Alt-P for selecting Highlight as Passed colored button), then hit Enter or Space Bar, and a color selection box will be presented (see the following figure)
Test Screen Instruction Manual Controlling the Component List, Keypad, and Area Map Window Areas
2-18
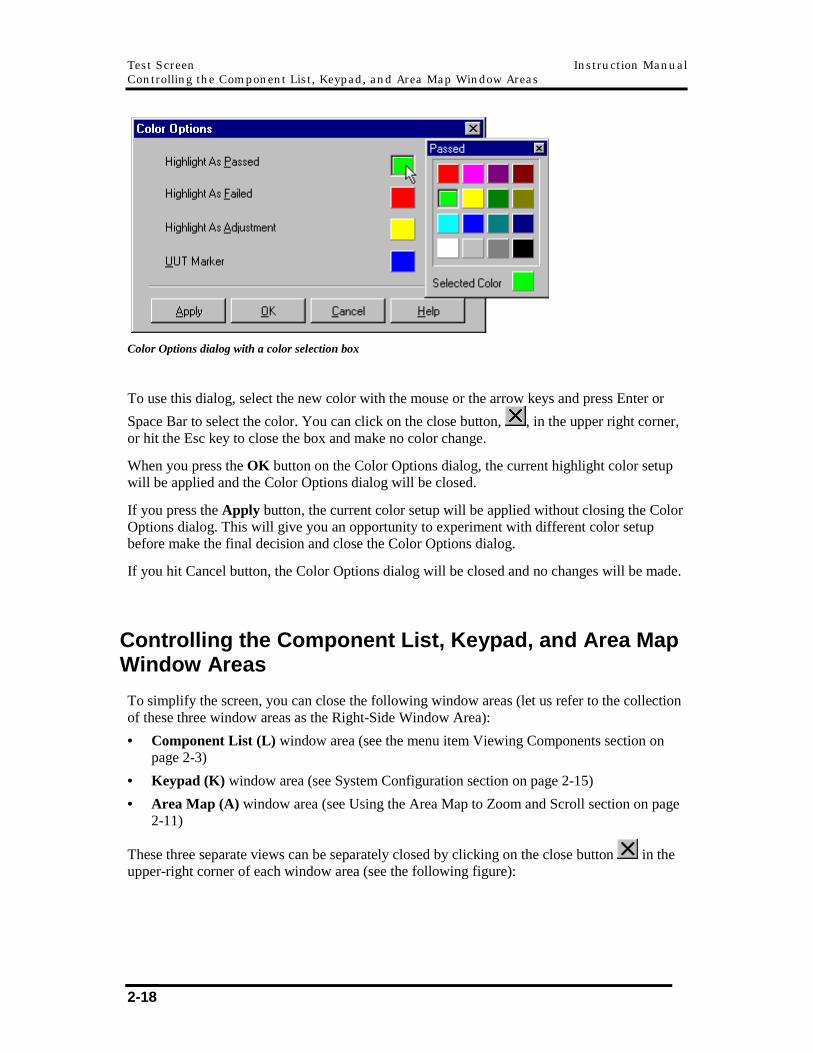
Color Options dialog with a color selection box
To use this dialog, select the new color with the mouse or the arrow keys and press Enter or
Space Bar to select the color. You can click on the close button, , in the upper right corner, or hit the Esc key to close the box and make no color change.
When you press the OK button on the Color Options dialog, the current highlight color setup will be applied and the Color Options dialog will be closed.
If you press the Apply button, the current color setup will be applied without closing the Color Options dialog. This will give you an opportunity to experiment with different color setup before make the final decision and close the Color Options dialog.
If you hit Cancel button, the Color Options dialog will be closed and no changes will be made.
Controlling the Component List, Keypad, and Area Map Window Areas
To simplify the screen, you can close the following window areas (let us refer to the collection of these three window areas as the Right-Side Window Area):
• Component List (L) window area (see the menu item Viewing Components section on page 2-3)
• Keypad (K) window area (see System Configuration section on page 2-15)
• Area Map (A) window area (see Using the Area Map to Zoom and Scroll section on page 2-11)
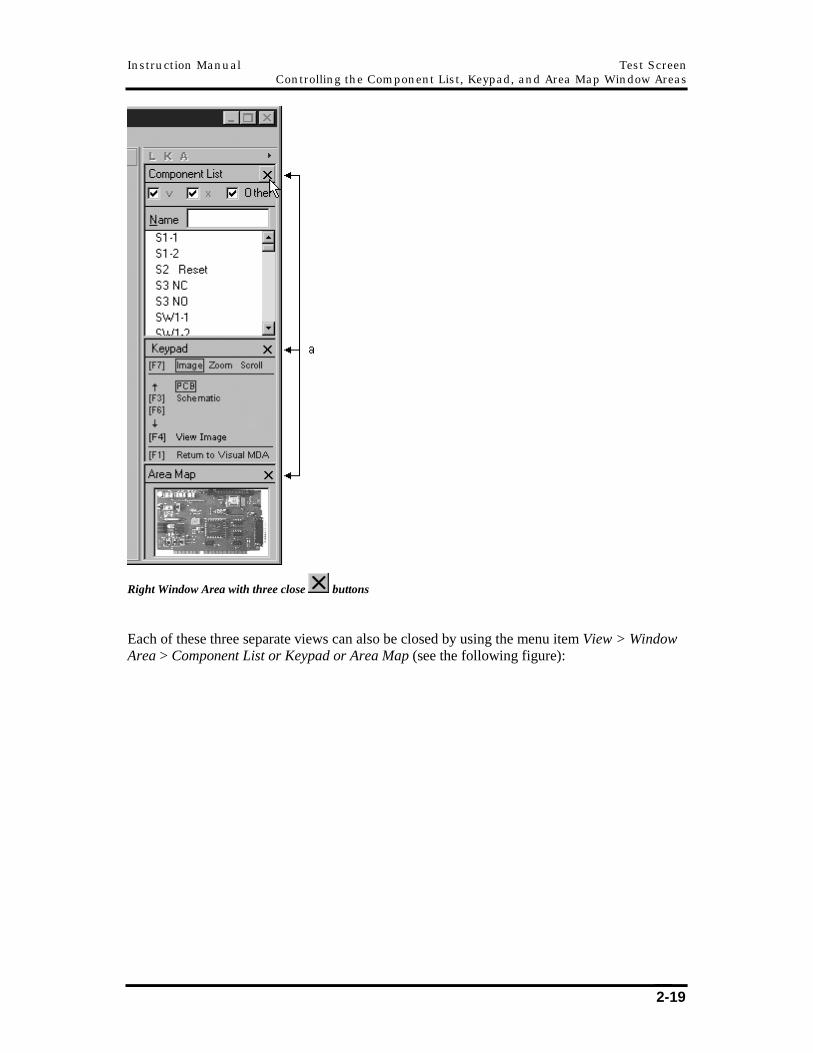
These three separate views can be separately closed by clicking on the close button in the upper-right corner of each window area (see the following figure):
Instruction Manual Test Screen Controlling the Component List, Keypad, and Area Map Window Areas
2-19
Right Window Area with three close buttons
Each of these three separate views can also be closed by using the menu item View > Window Area > Component List or Keypad or Area Map (see the following figure):
Test Screen Instruction Manual Controlling the Component List, Keypad, and Area Map Window Areas
2-20
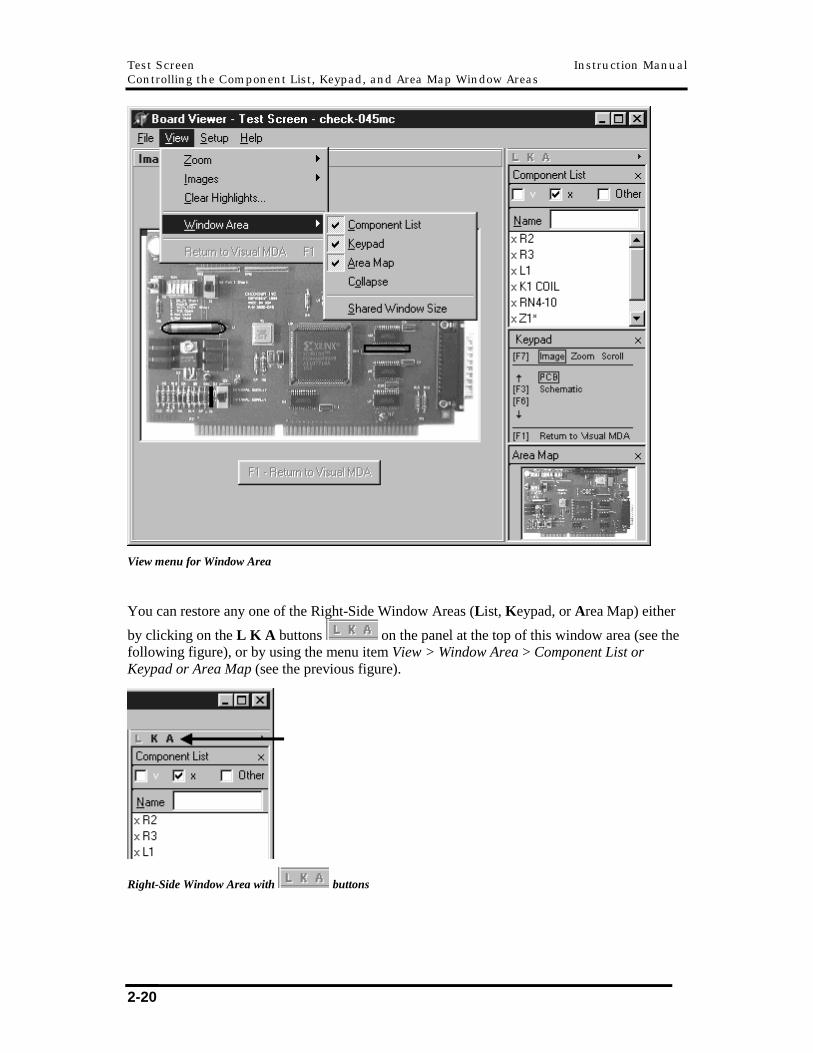
View menu for Window Area
You can restore any one of the Right-Side Window Areas (List, Keypad, or Area Map) either
by clicking on the L K A buttons on the panel at the top of this window area (see the following figure), or by using the menu item View > Window Area > Component List or Keypad or Area Map (see the previous figure).
Right-Side Window Area with buttons
Instruction Manual Test Screen Fitting Board Viewer and Visual MDA Windows on your Monitor
2-21
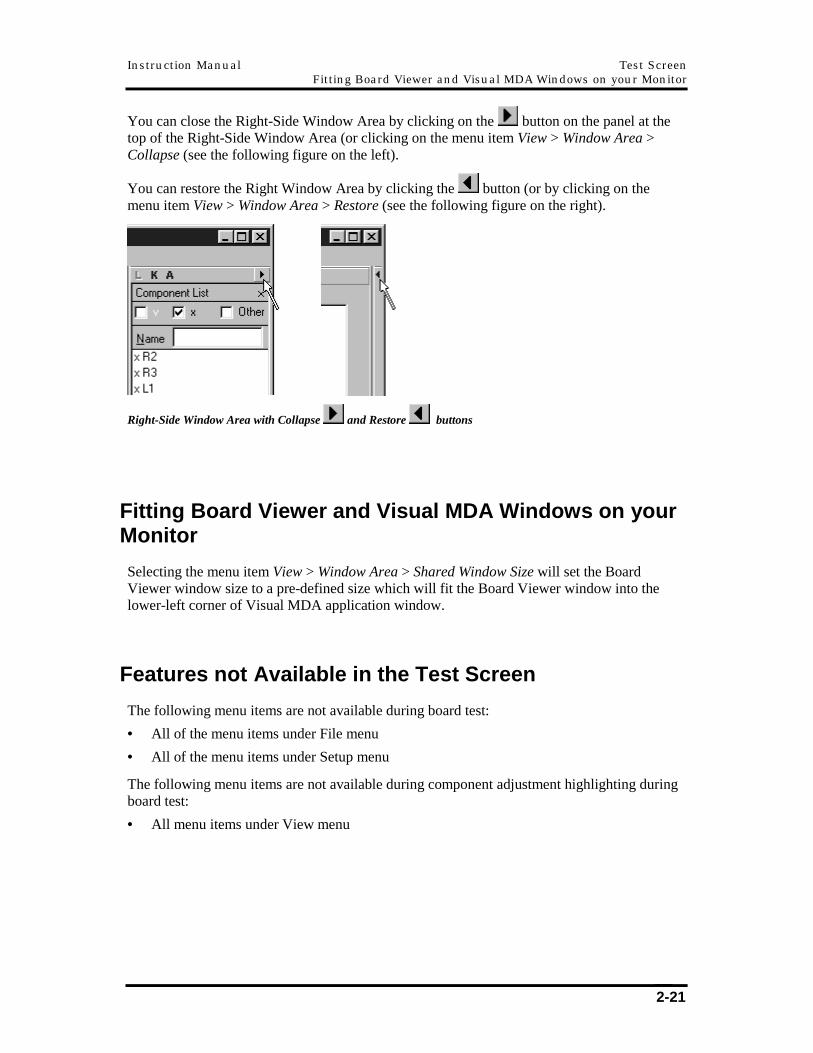
You can close the Right-Side Window Area by clicking on the button on the panel at the top of the Right-Side Window Area (or clicking on the menu item View > Window Area > Collapse (see the following figure on the left).
You can restore the Right Window Area by clicking the button (or by clicking on the menu item View > Window Area > Restore (see the following figure on the right).
Right-Side Window Area with Collapse and Restore buttons
Fitting Board Viewer and Visual MDA Windows on your Monitor
Selecting the menu item View > Window Area > Shared Window Size will set the Board Viewer window size to a pre-defined size which will fit the Board Viewer window into the lower-left corner of Visual MDA application window.
Features not Available in the Test Screen
The following menu items are not available during board test:
• All of the menu items under File menu
• All of the menu items under Setup menu
The following menu items are not available during component adjustment highlighting during board test:
• All menu items under View menu

Test Screen Instruction Manual Features not Available in the Test Screen
2-22
Note
The Board Viewer will disable all menu items under the View menu when it is instructed to highlight a component as an adjustment component. It will re-enable those menu items when: 1. The user presses the Return to Visual MDA button (when Display Board Viewer and Visual MDA Together is turned off) – also de-highlights the adjustment component or, 2. The Board Viewer is instructed to de-highlight the component that used to be highlighted as an adjustment component.
Chapter 3 Failure Analysis
Overview
To use Failure Analysis, run the Board Viewer from outside Visual MDA. This simply can be done by double clicking the Board Viewer icon on the Windows Desktop. In Failure Analysis you can:
• Open a test program (that has Image Information in it) and view components by highlighting it.
• Read in a test results file (e.g., SPC log file, test report file) and view the passed and/or failed components from a test run (based both on information in the file about and test program used in the test run).
In addition, you can print out the image with highlights.
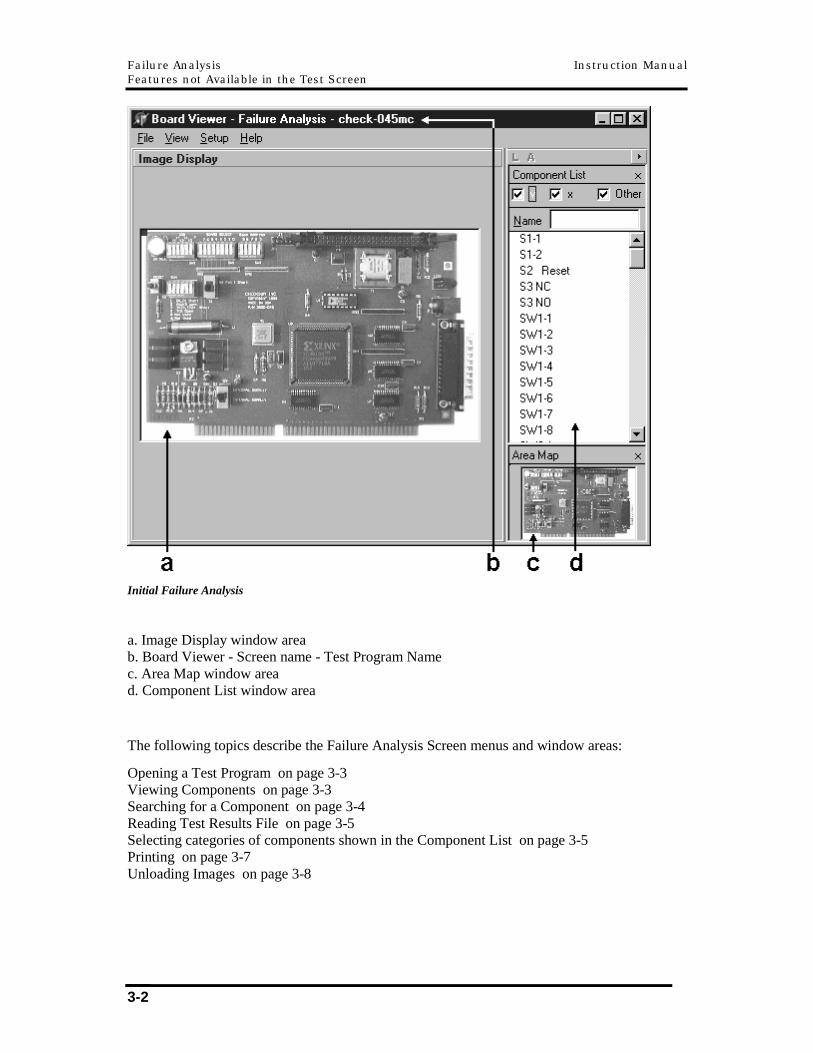
When you start the Board Viewer in Failure Analysis, the screen will look like the following (see the following figure):
Failure Analysis Instruction Manual Features not Available in the Test Screen
3-2
Initial Failure Analysis
a. Image Display window area b. Board Viewer - Screen name - Test Program Name c. Area Map window area d. Component List window area
The following topics describe the Failure Analysis Screen menus and window areas:
Opening a Test Program on page 3-3 Viewing Components on page 3-3 Searching for a Component on page 3-4 Reading Test Results File on page 3-5 Selecting categories of components shown in the Component List on page 3-5 Printing on page 3-7 Unloading Images on page 3-8
Model TR-8 Instruction Manual Failure Analysis Opening a Test Program
3-3
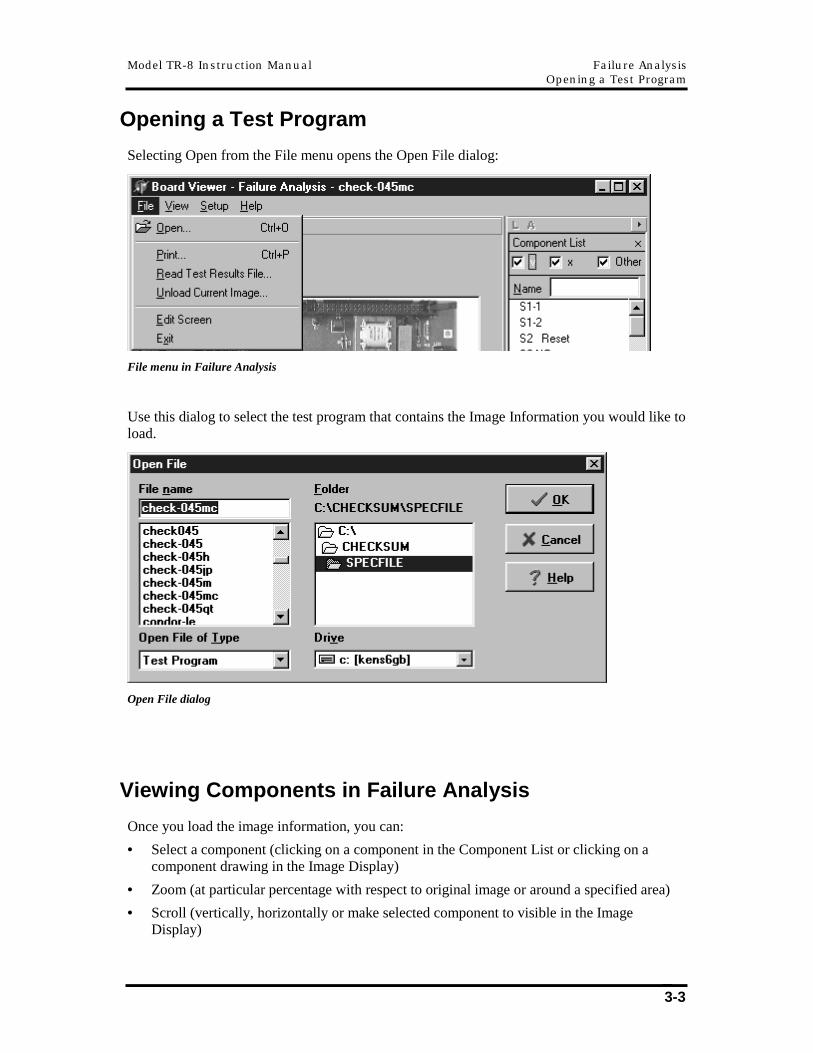
Opening a Test Program
Selecting Open from the File menu opens the Open File dialog:
File menu in Failure Analysis
Use this dialog to select the test program that contains the Image Information you would like to load.
Open File dialog
Viewing Components in Failure Analysis
Once you load the image information, you can:
• Select a component (clicking on a component in the Component List or clicking on a component drawing in the Image Display)
• Zoom (at particular percentage with respect to original image or around a specified area)
• Scroll (vertically, horizontally or make selected component to visible in the Image Display)
Failure Analysis Instruction Manual Searching for a Component
3-4
• Select an image to be displayed in the Image Display
• Reset images (remove component highlights and reset to Normal view)
• Use the Area Map to Zoom and Scroll
For details see the Viewing Components in the Test Screen on page 2-3 section.
Searching for a Component
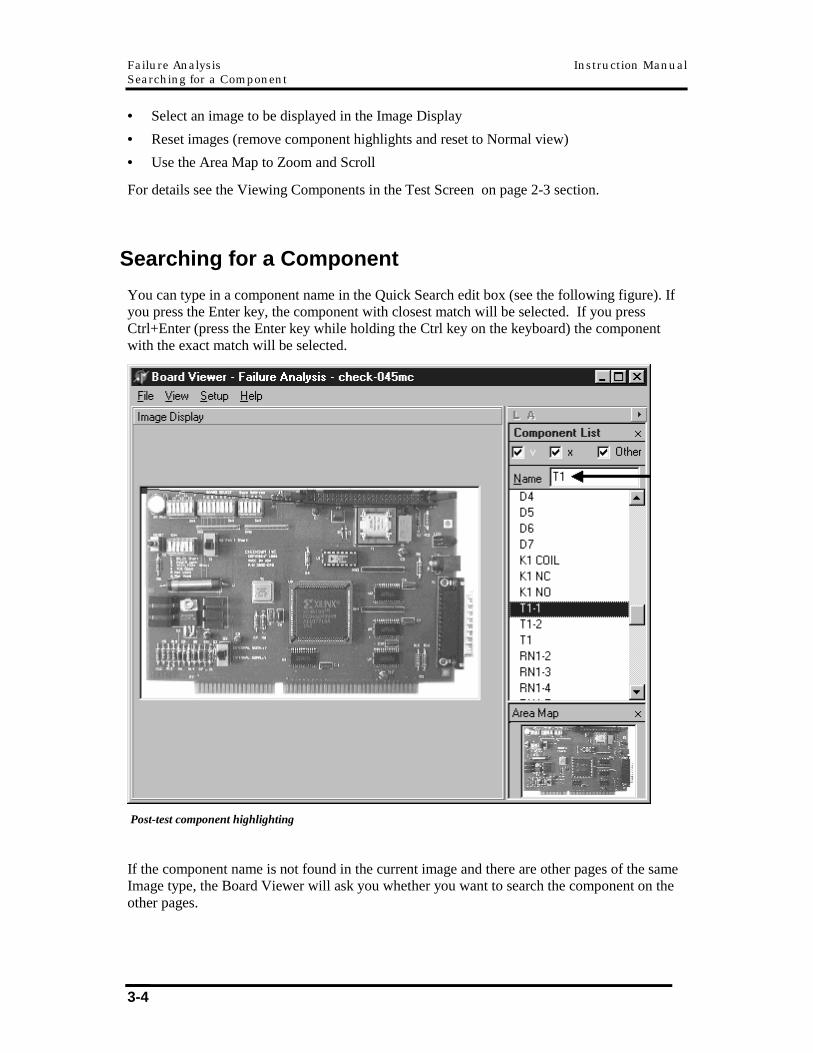
You can type in a component name in the Quick Search edit box (see the following figure). If you press the Enter key, the component with closest match will be selected. If you press Ctrl+Enter (press the Enter key while holding the Ctrl key on the keyboard) the component with the exact match will be selected.
Post-test component highlighting
If the component name is not found in the current image and there are other pages of the same Image type, the Board Viewer will ask you whether you want to search the component on the other pages.
Model TR-8 Instruction Manual Failure Analysis Reading Test Results File
3-5
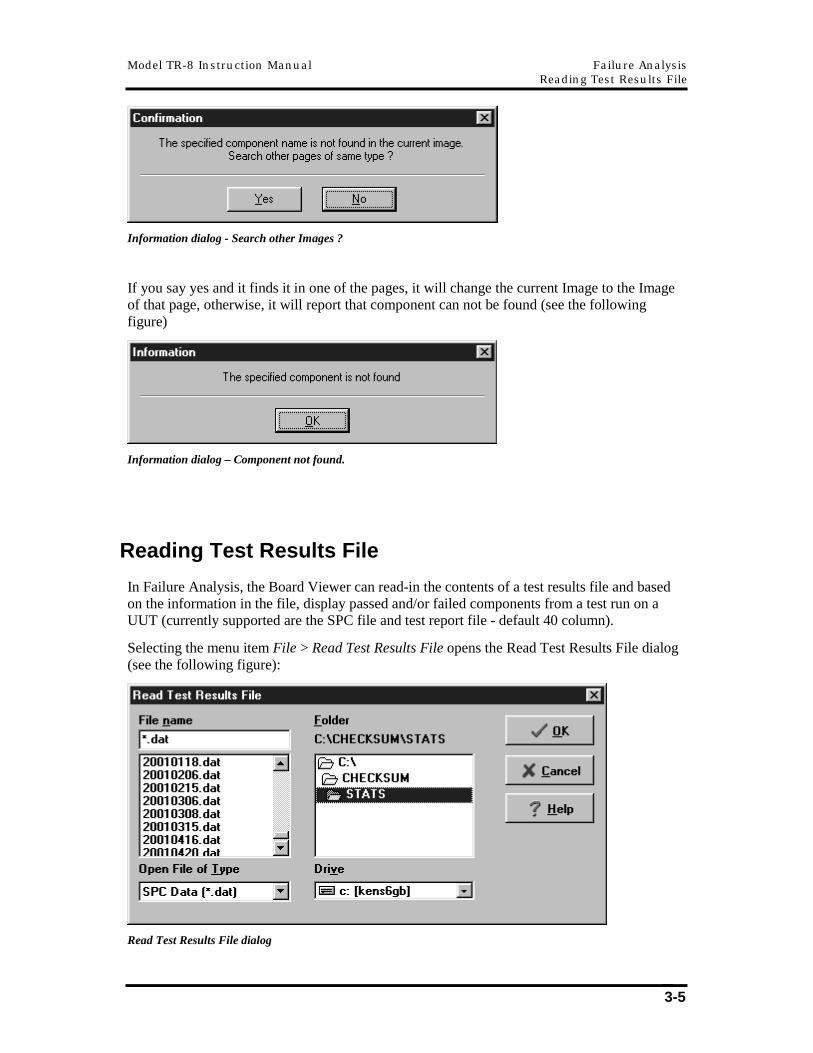
Information dialog - Search other Images ?
If you say yes and it finds it in one of the pages, it will change the current Image to the Image of that page, otherwise, it will report that component can not be found (see the following figure)
Information dialog – Component not found.
Reading Test Results File
In Failure Analysis, the Board Viewer can read-in the contents of a test results file and based on the information in the file, display passed and/or failed components from a test run on a UUT (currently supported are the SPC file and test report file - default 40 column).
Selecting the menu item File > Read Test Results File opens the Read Test Results File dialog (see the following figure):
Read Test Results File dialog
Failure Analysis Instruction Manual Reading Test Results File
3-6
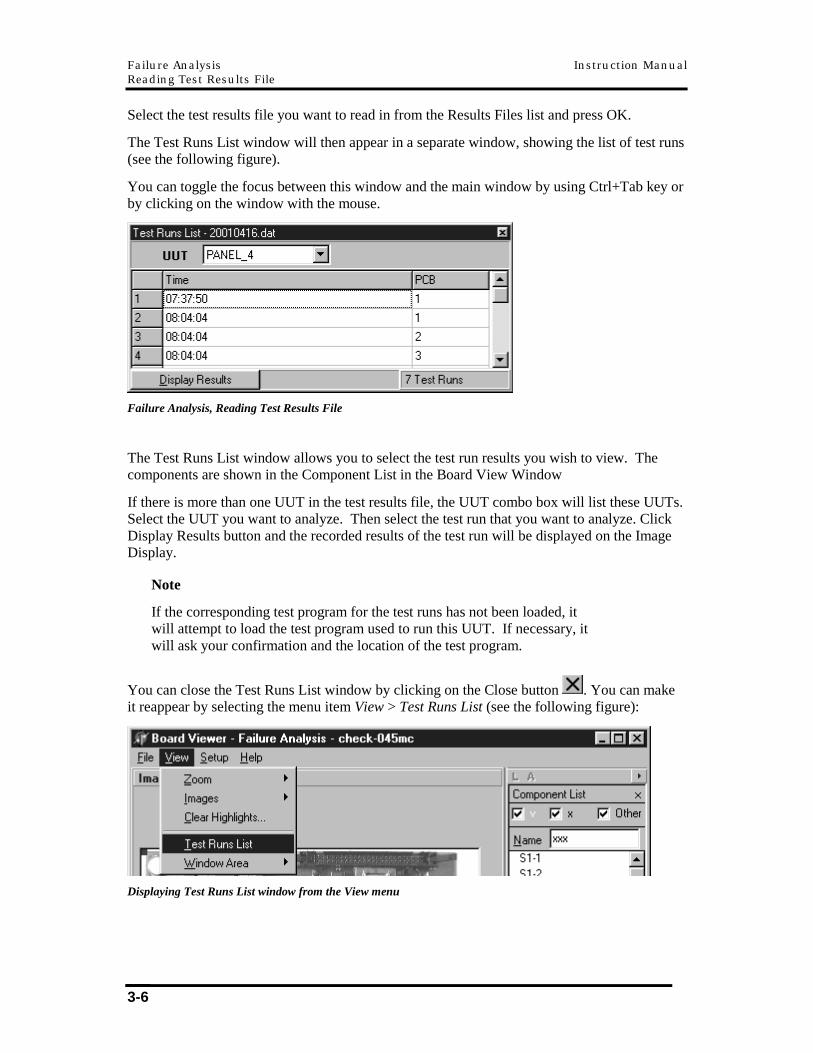
Select the test results file you want to read in from the Results Files list and press OK.
The Test Runs List window will then appear in a separate window, showing the list of test runs (see the following figure).
You can toggle the focus between this window and the main window by using Ctrl+Tab key or by clicking on the window with the mouse.
Failure Analysis, Reading Test Results File
The Test Runs List window allows you to select the test run results you wish to view. The components are shown in the Component List in the Board View Window
If there is more than one UUT in the test results file, the UUT combo box will list these UUTs. Select the UUT you want to analyze. Then select the test run that you want to analyze. Click Display Results button and the recorded results of the test run will be displayed on the Image Display.
Note
If the corresponding test program for the test runs has not been loaded, it will attempt to load the test program used to run this UUT. If necessary, it will ask your confirmation and the location of the test program.
You can close the Test Runs List window by clicking on the Close button . You can make it reappear by selecting the menu item View > Test Runs List (see the following figure):
Displaying Test Runs List window from the View menu
Model TR-8 Instruction Manual Failure Analysis Printing
3-7
Selecting categories of components shown in the Component List
In the upper part of Component List window area, there are three check-boxes that correspond to three categories of components shown in the Component List:
Passed When checked, the Component List shows all the passed components that are recorded in the test results file.
Failed When checked, the Component List shows all the failed components that are recorded in the test results file.
Other When checked, the Component List shows components that are not recorded as Passed/Failed in the test results file.
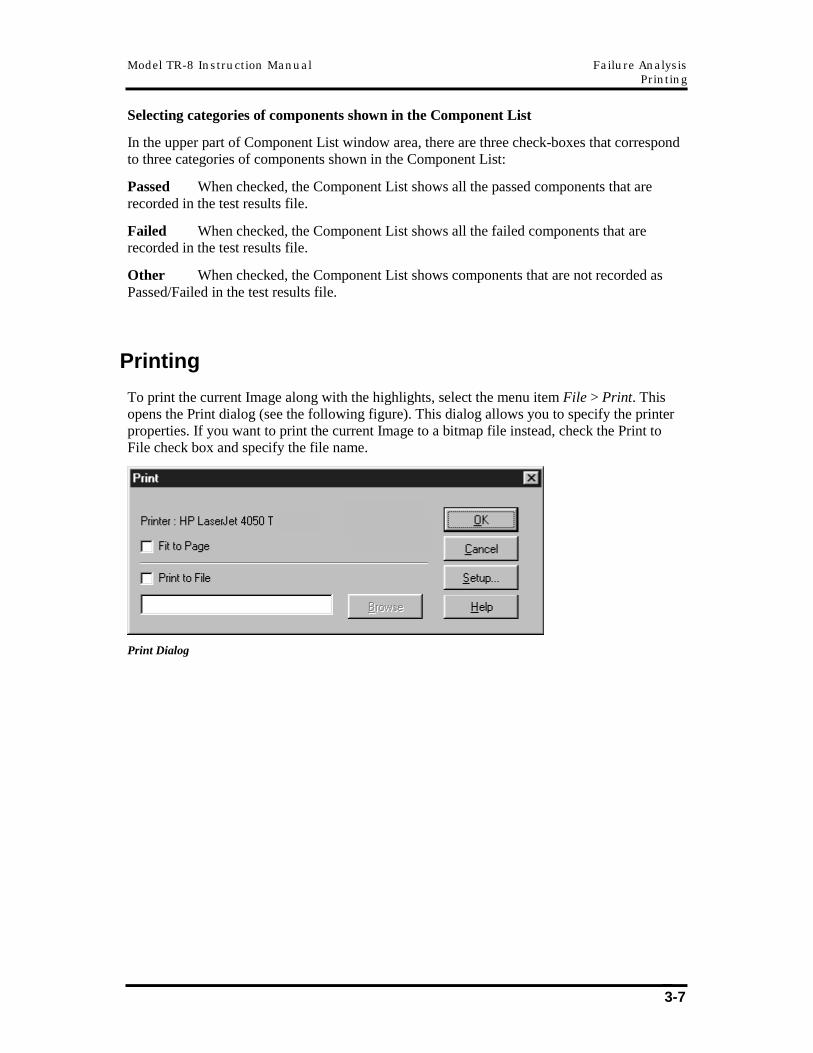
Printing
To print the current Image along with the highlights, select the menu item File > Print. This opens the Print dialog (see the following figure). This dialog allows you to specify the printer properties. If you want to print the current Image to a bitmap file instead, check the Print to File check box and specify the file name.
Print Dialog
Failure Analysis Instruction Manual Unloading Images
3-8
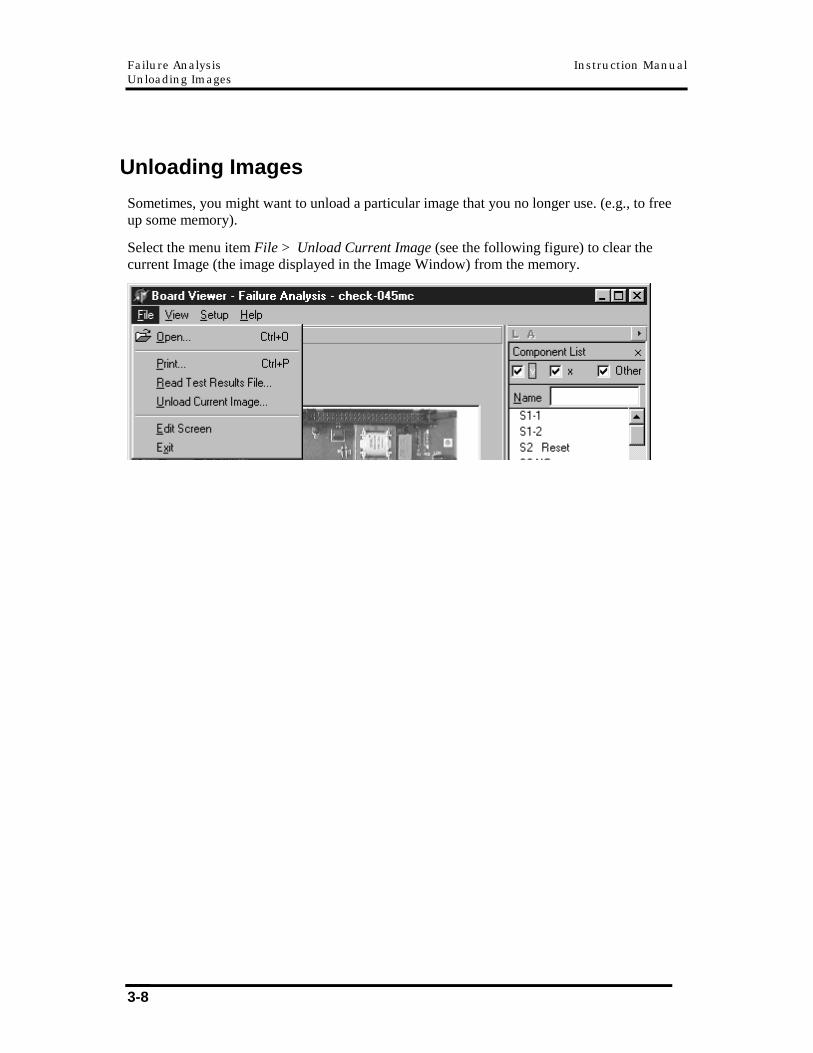
Unloading Images
Sometimes, you might want to unload a particular image that you no longer use. (e.g., to free up some memory).
Select the menu item File > Unload Current Image (see the following figure) to clear the current Image (the image displayed in the Image Window) from the memory.
Chapter 4 Creating and Editing the Board
View
Edit Screen
Overview
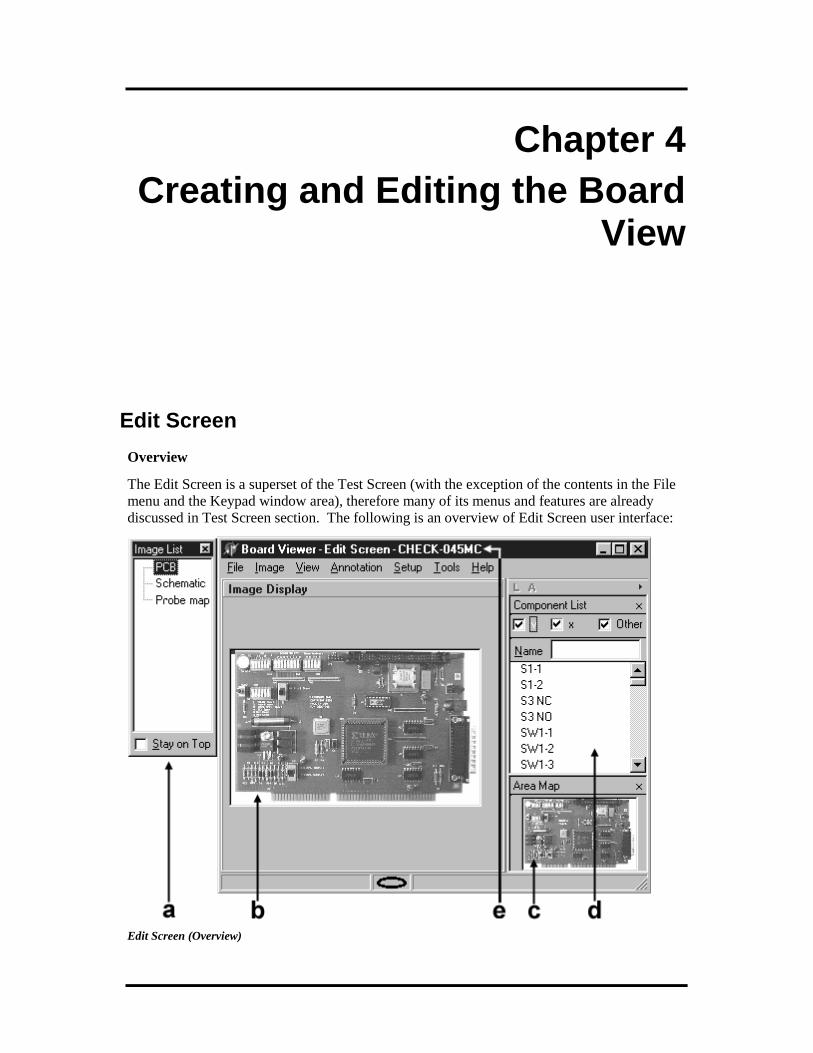
The Edit Screen is a superset of the Test Screen (with the exception of the contents in the File menu and the Keypad window area), therefore many of its menus and features are already discussed in Test Screen section. The following is an overview of Edit Screen user interface:
Edit Screen (Overview)
Creating and Editing the Board View Instruction Manual Editing Image Information
4-2
a. Image List shows the list of existing Images b. Image Display c. Area Map d. Component List e. Shows Board Viewer - Edit Screen - Test Program name
The following topics describe the Edit Screen menus and window areas:
Opening a Test Program on page 4-3 Adding an Image on page 4-3 Editing Component List and Testpoint List on page 4-5 Assigning and Modifying Component and Testpoint Annotation on page 4-7 Annotation Special Topics on page 4-15 Saving the Image Information with the Test Program on page 4-16 Importing/Exporting an Annotated Image on page 4-17 Add/Modify and Delete Link to Existing Image Information File on page 4-20 PCB Panelization on page 4-22 Generating Probe Map Image on page 4-24 Names Cross Check on page 4-26
For details about the Image List, see the Assigning and Modifying Component and Testpoint Annotation section on page 4-7.
Editing Image Information
The following are the typical steps used to edit the Image Information. Each of these steps is described in detail in the following sections:
1. Open a test program (default directory is C:\CheckSum\SPECFILE).
2. Add Image(s) to the Image Information. For each image specify the graphic image file, the name of the Image, the image type (PCB, schematic, etc) and the page number.
3. Edit the Component List or Testpoint List. By default, when you open the test program that has no Image Information saved with it, the Board Viewer will take the titles and the testpoint names in the test program and insert them in the Component List and Testpoint List, respectively. You can add components and testpoints that are not yet in the list. You can also delete the components or testpoints that you do not want to use from the list.
4. Assign and modify Component Annotation or Testpoint Annotation. You can easily point-click-and-drag to assign the location of a component or a testpoint and then setup how the highlight should appear (shape, thickness, and optionally text). The location and highlight appearance of a component or testpoint is referred to as the "annotation".
5. Setup Test Settings to control how the Image Information is used when the Board Viewer is run via Visual MDA.
6. Save the Image Information with the Test Program via embedding or linking.
Instruction Manual Creating and Editing the Board View Opening a Test Program
4-3
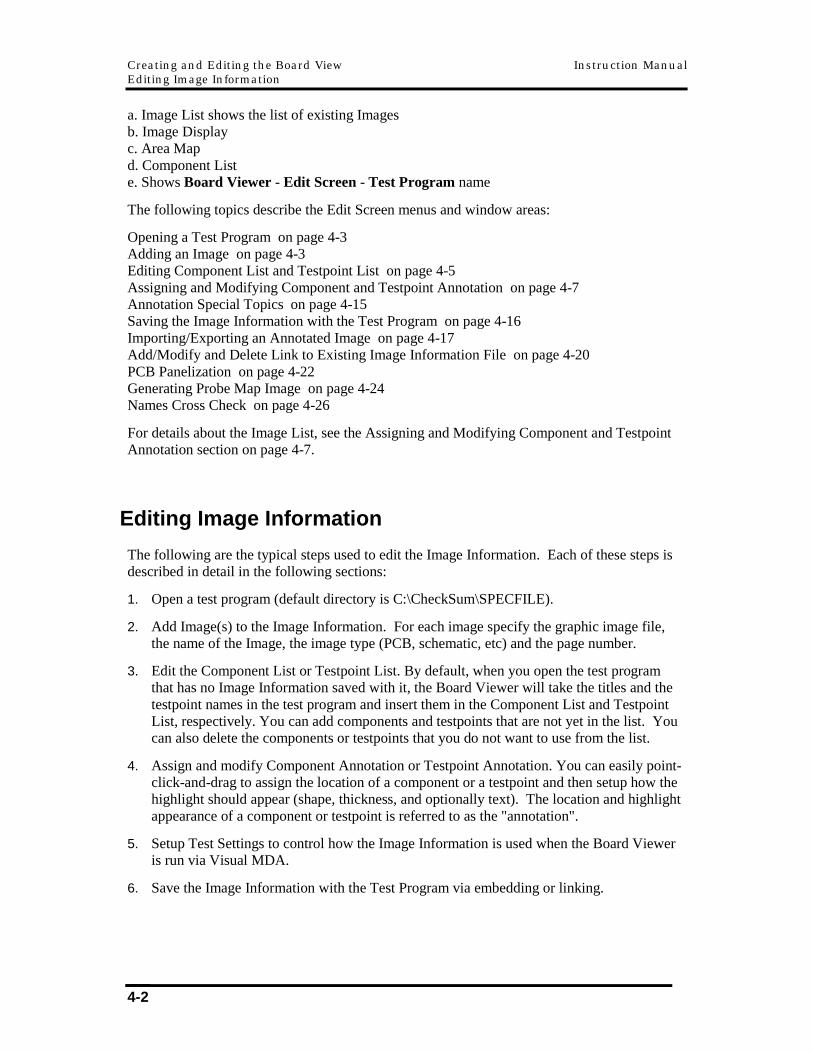
Opening a Test Program
Selecting the menu item File > Open opens the Open File dialog (see the following figures). Use this dialog to select the test program that will contain or already contains the Image Information you want to edit.
Edit - File Menu and Open File dialog
Adding an Image
Selecting the menu item Image > Add (see the following figure) opens the Add Image dialog. Use this dialog to add an image to the Image Information.
Creating and Editing the Board View Instruction Manual Adding an Image
4-4
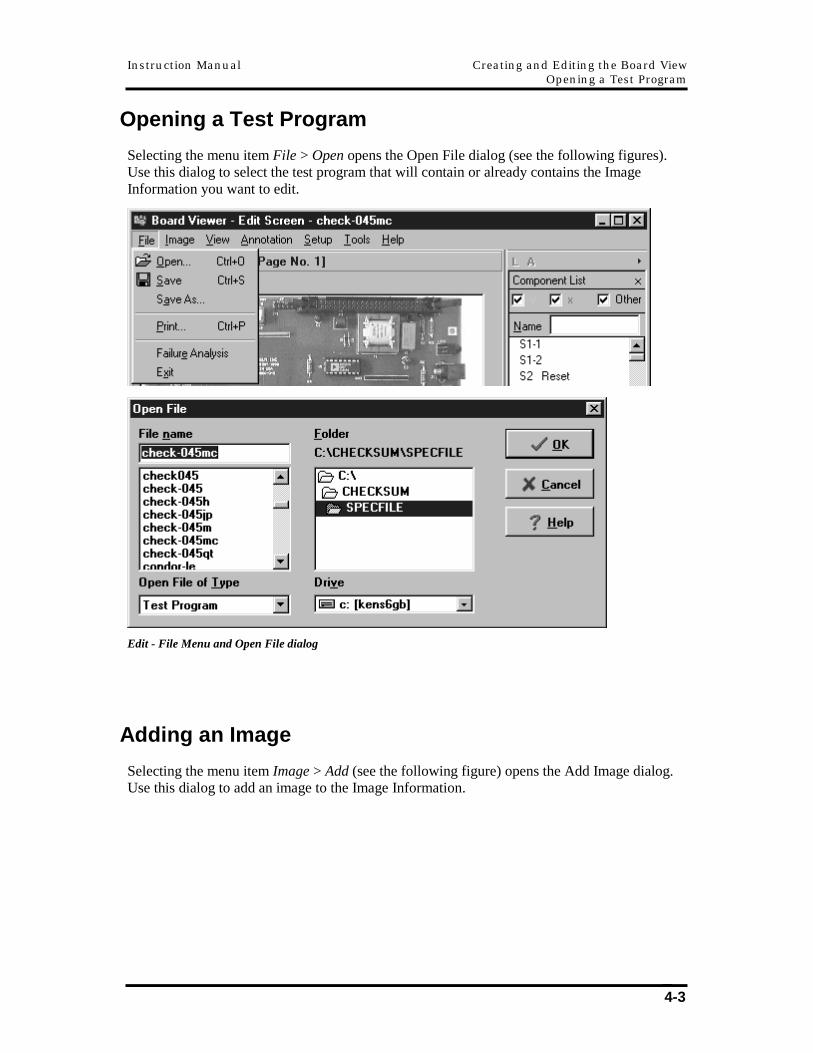
Edit - Image Menu and Add dialog
The Image Type defines the type of this image, the possible types are:
• PCB (photograph of the actual board)
• Outline (board outline)
• Schematic
• Probe Map
• User Defined
• Setup
The Component List is associated with a PCB, Board Outline, and Schematic. A Testpoint List is associated with a Probe Map.
If there is more than one Image of this type, the Board Viewer will assign a page number for this image. It is shown in the Page No. edit box. You can modify this value. During a test, Visual MDA uses the Image Type and Page Number to identify the image.
The Image Name is used to identify the image:
• In the Image List window area, if there is more than one image of this type, you will see the Image Name under this Image type.
Instruction Manual Creating and Editing the Board View Editing Component and Testpoint List
4-5
• Under the menu item View > [Image Type] (where [Image Type] can be PCB, Outline, Schematic, Probe Map, User Defined, or Setup), if there is more than one Image of this type, you will see the Image Name.
• It is advised that you do not use the following image names: PCB, Outline, Schematic, Probe Map, User Defined, or Setup (you will be alerted if you do).
Click the Browse button to select the Graphic Image file.
Note: Supported Image File formats: BMP, JPEG, PNG, PCX, TIFF (Uncompressed and PackBits compression), WMF.
DXF and HPGL file formats can be converted into the above file formats using third party tools.
Selecting Delete from the Image menu will delete the current Image.
Selecting Modify from the Image menu opens the Modify Image dialog, which looks and operates the same as Add Image dialog.
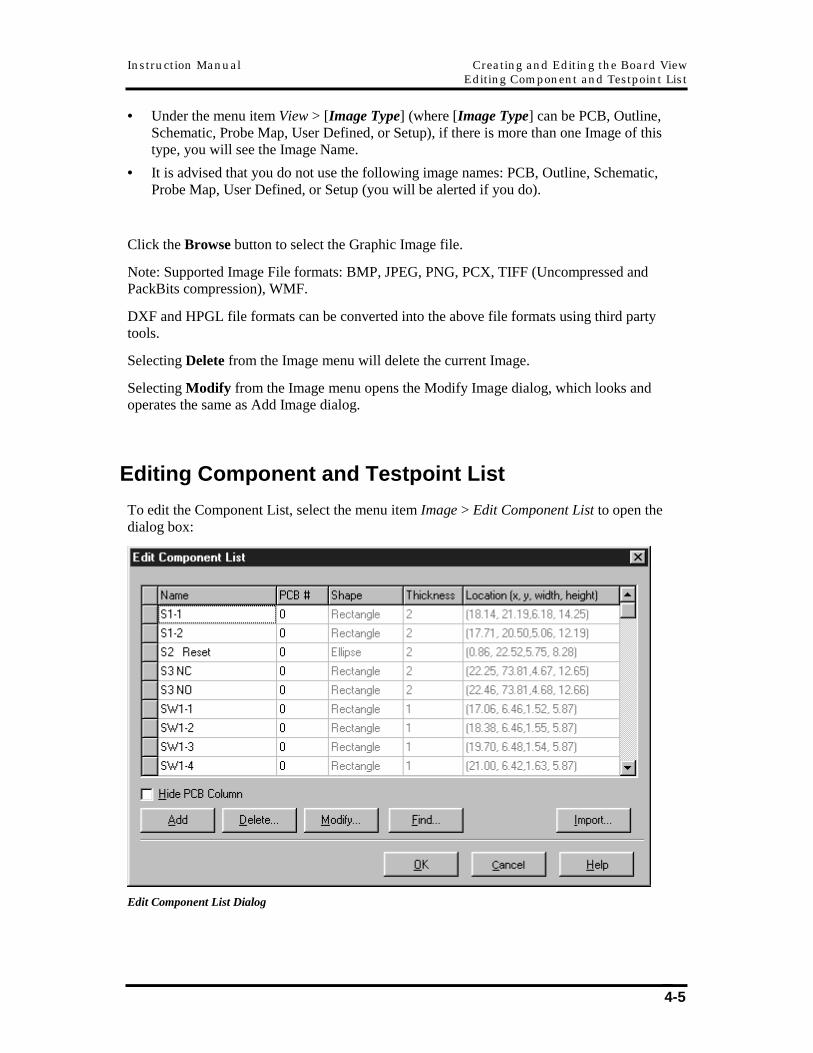
Editing Component and Testpoint List
To edit the Component List, select the menu item Image > Edit Component List to open the dialog box:
Edit Component List Dialog
Creating and Editing the Board View Instruction Manual Editing Component and Testpoint List
4-6
By default, when you add a new Image of type PCB, Board Outline, and Schematic, the Board Viewer will use the titles (of the pre-defined list of test types) in the test program component test steps and insert them in the Component List as the Component Name. The Edit Component List dialog shows these Component Names.
Note
The pre-defined list of test types contains test types that perform component measurement.
This dialog also shows the annotation (location plus highlight appearance) used to highlight components.
Add button: Add components to the list
Delete button: Deletes components from the list
Modify button: Modify currently selected component name and annotation
Find button: Search entry based on the component name
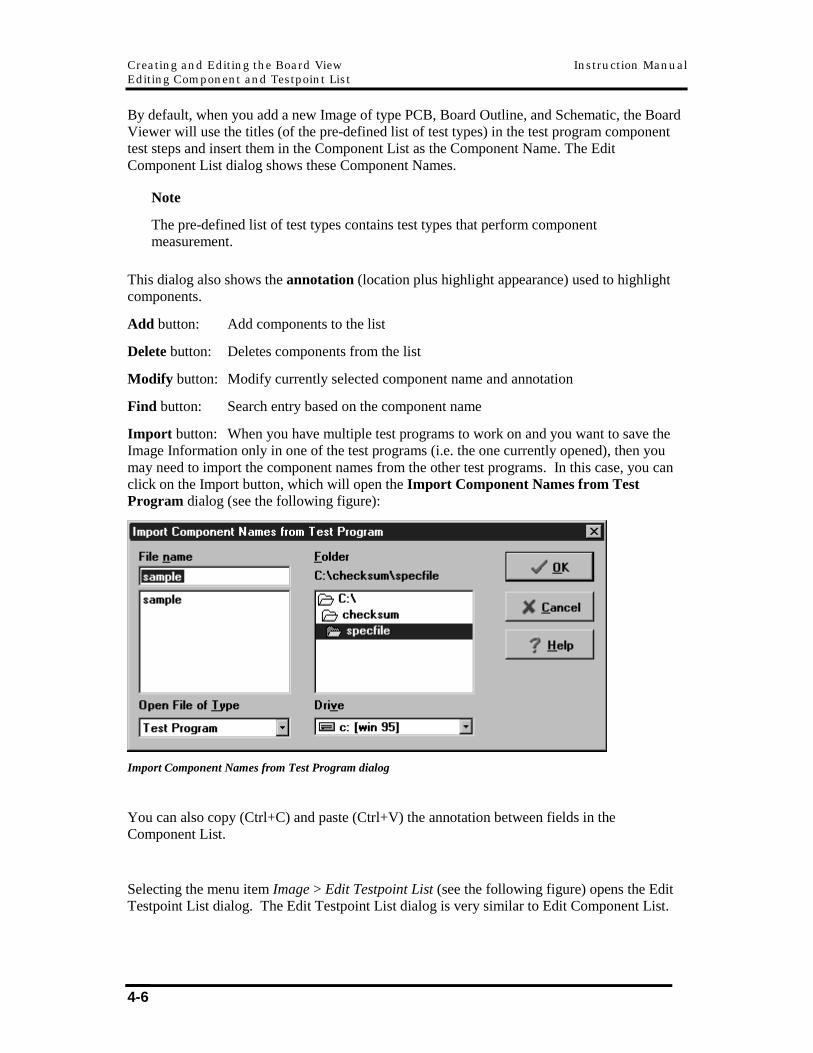
Import button: When you have multiple test programs to work on and you want to save the Image Information only in one of the test programs (i.e. the one currently opened), then you may need to import the component names from the other test programs. In this case, you can click on the Import button, which will open the Import Component Names from Test Program dialog (see the following figure):
Import Component Names from Test Program dialog
You can also copy (Ctrl+C) and paste (Ctrl+V) the annotation between fields in the Component List.
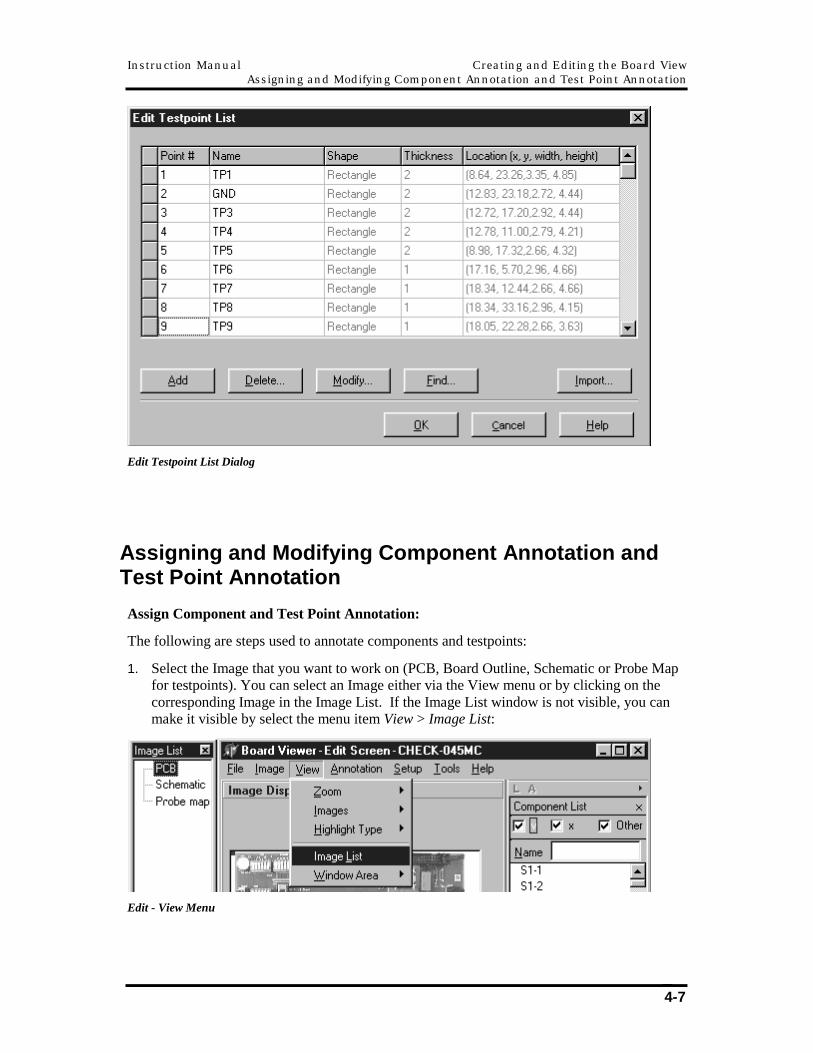
Selecting the menu item Image > Edit Testpoint List (see the following figure) opens the Edit Testpoint List dialog. The Edit Testpoint List dialog is very similar to Edit Component List.
Instruction Manual Creating and Editing the Board View Assigning and Modifying Component Annotation and Test Point Annotation
4-7
Edit Testpoint List Dialog
Assigning and Modifying Component Annotation and Test Point Annotation
Assign Component and Test Point Annotation:
The following are steps used to annotate components and testpoints:
1. Select the Image that you want to work on (PCB, Board Outline, Schematic or Probe Map for testpoints). You can select an Image either via the View menu or by clicking on the corresponding Image in the Image List. If the Image List window is not visible, you can make it visible by select the menu item View > Image List:
Edit - View Menu
Creating and Editing the Board View Instruction Manual Assigning and Modifying Component Annotation and Test Point Annotation
4-8
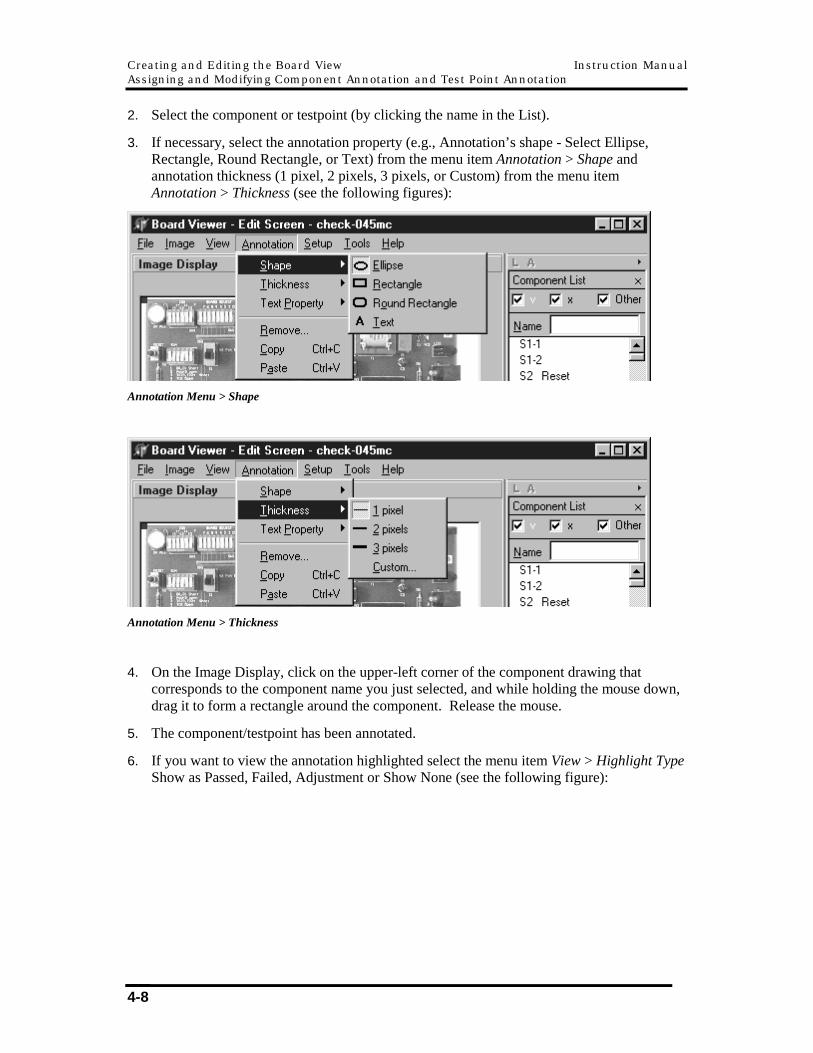
2. Select the component or testpoint (by clicking the name in the List).
3. If necessary, select the annotation property (e.g., Annotation’s shape - Select Ellipse, Rectangle, Round Rectangle, or Text) from the menu item Annotation > Shape and annotation thickness (1 pixel, 2 pixels, 3 pixels, or Custom) from the menu item Annotation > Thickness (see the following figures):
Annotation Menu > Shape
Annotation Menu > Thickness
4. On the Image Display, click on the upper-left corner of the component drawing that corresponds to the component name you just selected, and while holding the mouse down, drag it to form a rectangle around the component. Release the mouse.
5. The component/testpoint has been annotated.
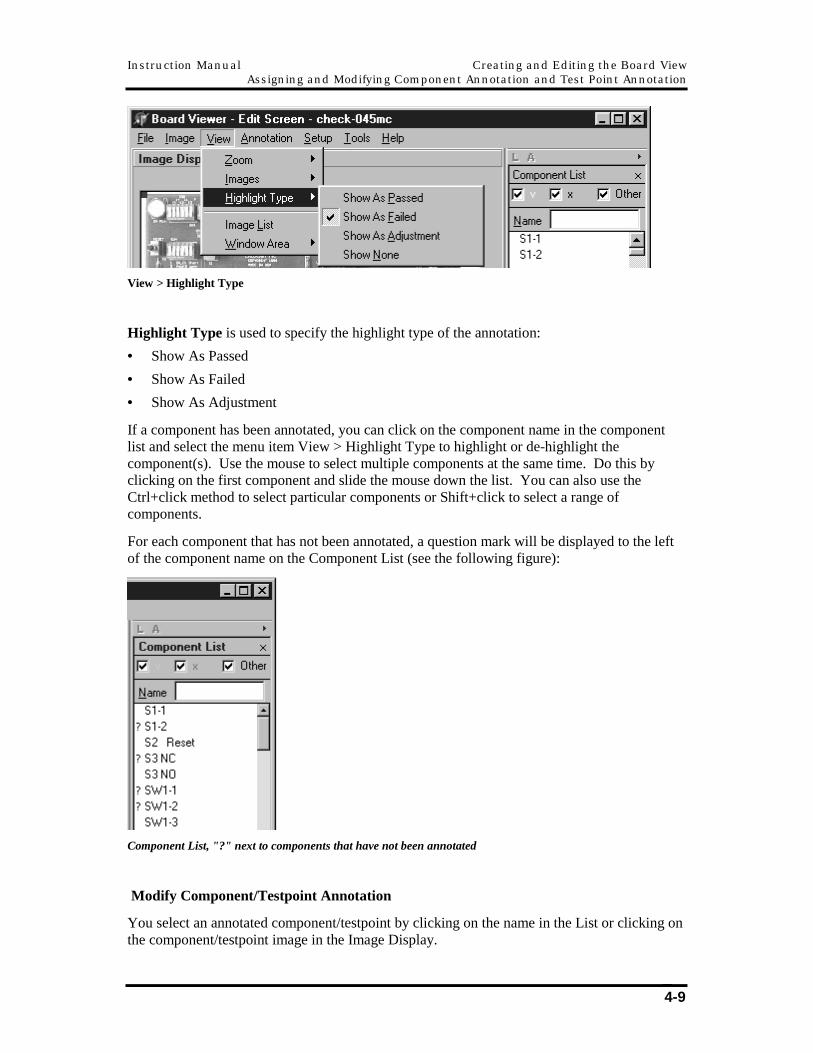
6. If you want to view the annotation highlighted select the menu item View > Highlight Type Show as Passed, Failed, Adjustment or Show None (see the following figure):
Instruction Manual Creating and Editing the Board View Assigning and Modifying Component Annotation and Test Point Annotation
4-9
View > Highlight Type
Highlight Type is used to specify the highlight type of the annotation:
• Show As Passed
• Show As Failed
• Show As Adjustment
If a component has been annotated, you can click on the component name in the component list and select the menu item View > Highlight Type to highlight or de-highlight the component(s). Use the mouse to select multiple components at the same time. Do this by clicking on the first component and slide the mouse down the list. You can also use the Ctrl+click method to select particular components or Shift+click to select a range of components.
For each component that has not been annotated, a question mark will be displayed to the left of the component name on the Component List (see the following figure):
Component List, "?" next to components that have not been annotated
Modify Component/Testpoint Annotation
You select an annotated component/testpoint by clicking on the name in the List or clicking on the component/testpoint image in the Image Display.
Creating and Editing the Board View Instruction Manual Assigning and Modifying Component Annotation and Test Point Annotation
4-10
Once a component/testpoint is selected you can modify the annotation:
• Resize the annotation: Click on the lower-right corner of the rectangle around the selected component, while holding the mouse, drag it to form the new size.
• Move the annotation: Click within the rectangle around the selected component, while holding the mouse, drag it to the new position.
• Change the annotation property (e.g., shape, thickness, font, etc – see the Annotation Menu below).
• Remove the annotation: Select the menu item Annotation > Remove Note: A warning will be displayed before removing the annotation. In the case of multi-select components (see the following paragraph), the warning will be displayed only once.
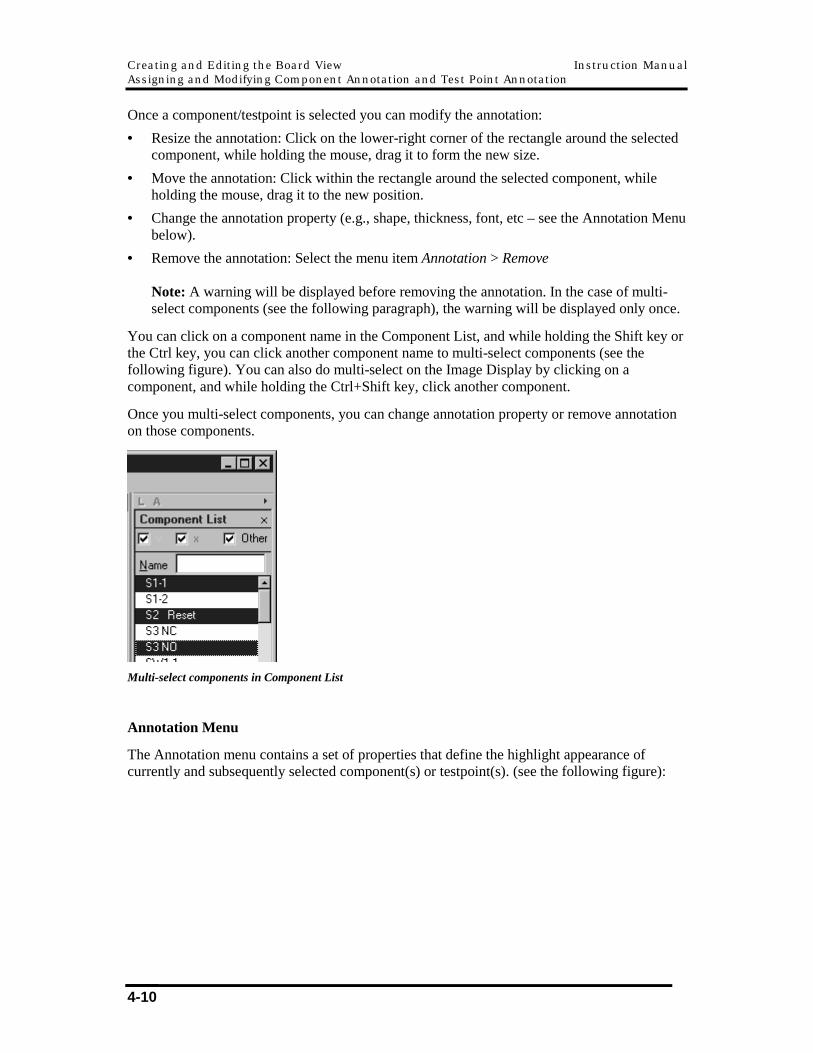
You can click on a component name in the Component List, and while holding the Shift key or the Ctrl key, you can click another component name to multi-select components (see the following figure). You can also do multi-select on the Image Display by clicking on a component, and while holding the Ctrl+Shift key, click another component.
Once you multi-select components, you can change annotation property or remove annotation on those components.
Multi-select components in Component List
Annotation Menu
The Annotation menu contains a set of properties that define the highlight appearance of currently and subsequently selected component(s) or testpoint(s). (see the following figure):
Instruction Manual Creating and Editing the Board View Assigning and Modifying Component Annotation and Test Point Annotation
4-11
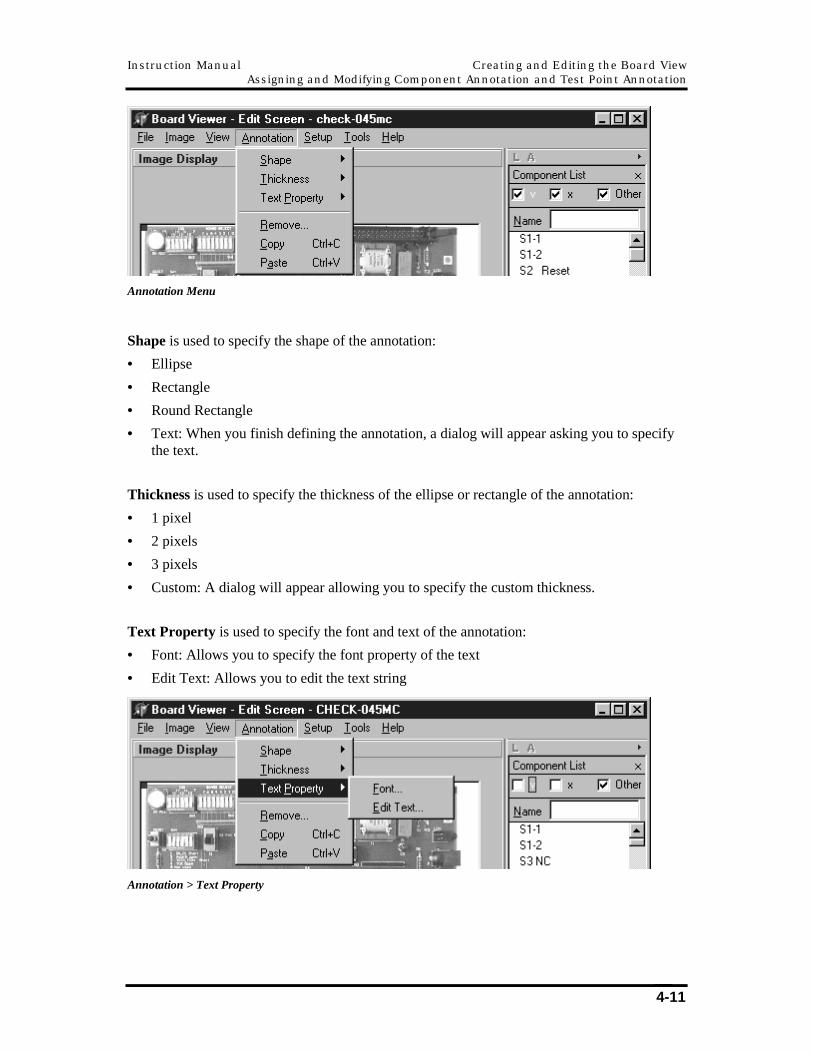
Annotation Menu
Shape is used to specify the shape of the annotation:
• Ellipse
• Rectangle
• Round Rectangle
• Text: When you finish defining the annotation, a dialog will appear asking you to specify the text.
Thickness is used to specify the thickness of the ellipse or rectangle of the annotation:
• 1 pixel
• 2 pixels
• 3 pixels
• Custom: A dialog will appear allowing you to specify the custom thickness.
Text Property is used to specify the font and text of the annotation:
• Font: Allows you to specify the font property of the text
• Edit Text: Allows you to edit the text string
Annotation > Text Property
Creating and Editing the Board View Instruction Manual Assigning and Modifying Component Annotation and Test Point Annotation
4-12
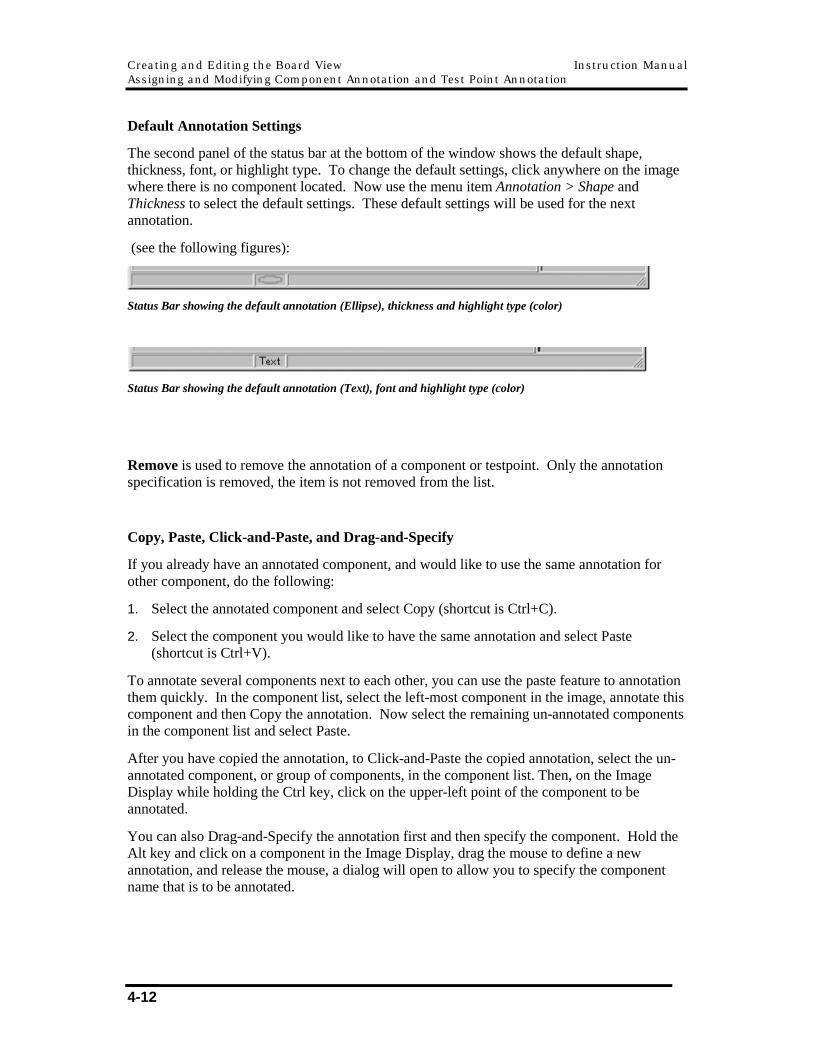
Default Annotation Settings
The second panel of the status bar at the bottom of the window shows the default shape, thickness, font, or highlight type. To change the default settings, click anywhere on the image where there is no component located. Now use the menu item Annotation > Shape and Thickness to select the default settings. These default settings will be used for the next annotation.
(see the following figures):
Status Bar showing the default annotation (Ellipse), thickness and highlight type (color)
Status Bar showing the default annotation (Text), font and highlight type (color)
Remove is used to remove the annotation of a component or testpoint. Only the annotation specification is removed, the item is not removed from the list.
Copy, Paste, Click-and-Paste, and Drag-and-Specify
If you already have an annotated component, and would like to use the same annotation for other component, do the following:
1. Select the annotated component and select Copy (shortcut is Ctrl+C).
2. Select the component you would like to have the same annotation and select Paste (shortcut is Ctrl+V).
To annotate several components next to each other, you can use the paste feature to annotation them quickly. In the component list, select the left-most component in the image, annotate this component and then Copy the annotation. Now select the remaining un-annotated components in the component list and select Paste.
After you have copied the annotation, to Click-and-Paste the copied annotation, select the un-annotated component, or group of components, in the component list. Then, on the Image Display while holding the Ctrl key, click on the upper-left point of the component to be annotated.
You can also Drag-and-Specify the annotation first and then specify the component. Hold the Alt key and click on a component in the Image Display, drag the mouse to define a new annotation, and release the mouse, a dialog will open to allow you to specify the component name that is to be annotated.
Instruction Manual Creating and Editing the Board View Assigning and Modifying Component Annotation and Test Point Annotation
4-13
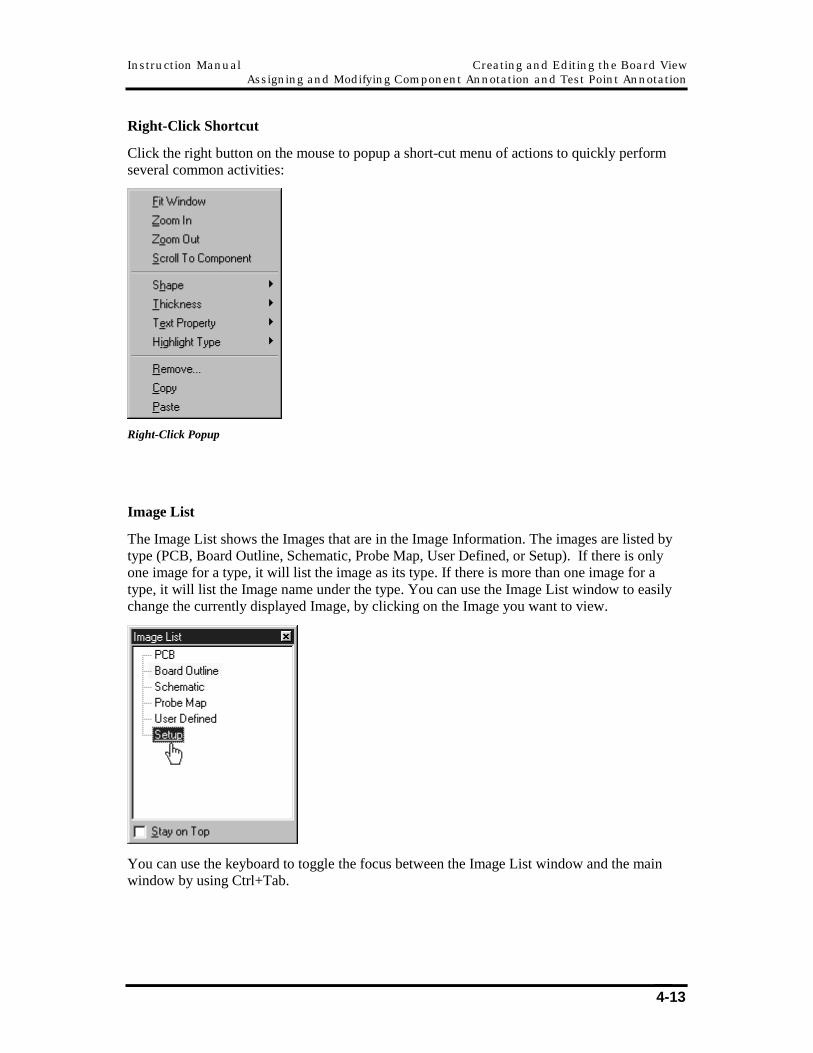
Right-Click Shortcut
Click the right button on the mouse to popup a short-cut menu of actions to quickly perform several common activities:
Right-Click Popup
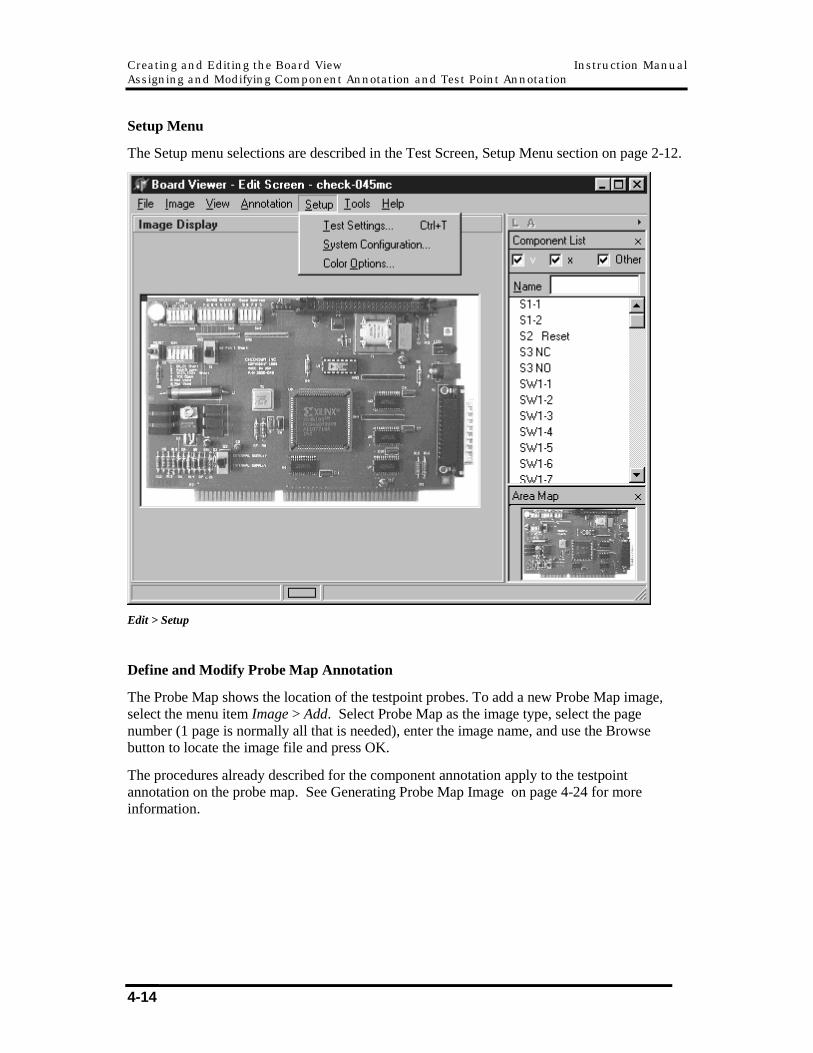
Image List
The Image List shows the Images that are in the Image Information. The images are listed by type (PCB, Board Outline, Schematic, Probe Map, User Defined, or Setup). If there is only one image for a type, it will list the image as its type. If there is more than one image for a type, it will list the Image name under the type. You can use the Image List window to easily change the currently displayed Image, by clicking on the Image you want to view.
You can use the keyboard to toggle the focus between the Image List window and the main window by using Ctrl+Tab.
Creating and Editing the Board View Instruction Manual Assigning and Modifying Component Annotation and Test Point Annotation
4-14
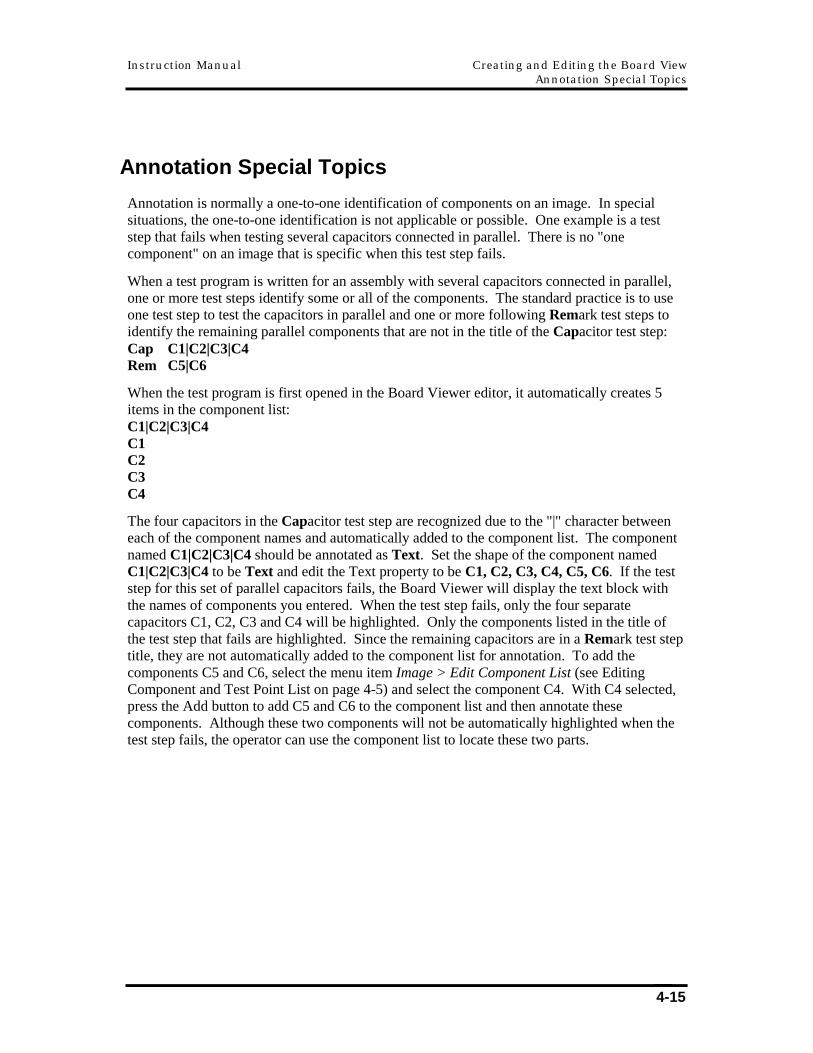
Setup Menu
The Setup menu selections are described in the Test Screen, Setup Menu section on page 2-12.
Edit > Setup
Define and Modify Probe Map Annotation
The Probe Map shows the location of the testpoint probes. To add a new Probe Map image, select the menu item Image > Add. Select Probe Map as the image type, select the page number (1 page is normally all that is needed), enter the image name, and use the Browse button to locate the image file and press OK.
The procedures already described for the component annotation apply to the testpoint annotation on the probe map. See Generating Probe Map Image on page 4-24 for more information.
Instruction Manual Creating and Editing the Board View Annotation Special Topics
4-15
Annotation Special Topics
Annotation is normally a one-to-one identification of components on an image. In special situations, the one-to-one identification is not applicable or possible. One example is a test step that fails when testing several capacitors connected in parallel. There is no "one component" on an image that is specific when this test step fails.
When a test program is written for an assembly with several capacitors connected in parallel, one or more test steps identify some or all of the components. The standard practice is to use one test step to test the capacitors in parallel and one or more following Remark test steps to identify the remaining parallel components that are not in the title of the Capacitor test step: Cap C1|C2|C3|C4 Rem C5|C6
When the test program is first opened in the Board Viewer editor, it automatically creates 5 items in the component list: C1|C2|C3|C4 C1 C2 C3 C4
The four capacitors in the Capacitor test step are recognized due to the "|" character between each of the component names and automatically added to the component list. The component named C1|C2|C3|C4 should be annotated as Text. Set the shape of the component named C1|C2|C3|C4 to be Text and edit the Text property to be C1, C2, C3, C4, C5, C6. If the test step for this set of parallel capacitors fails, the Board Viewer will display the text block with the names of components you entered. When the test step fails, only the four separate capacitors C1, C2, C3 and C4 will be highlighted. Only the components listed in the title of the test step that fails are highlighted. Since the remaining capacitors are in a Remark test step title, they are not automatically added to the component list for annotation. To add the components C5 and C6, select the menu item Image > Edit Component List (see Editing Component and Test Point List on page 4-5) and select the component C4. With C4 selected, press the Add button to add C5 and C6 to the component list and then annotate these components. Although these two components will not be automatically highlighted when the test step fails, the operator can use the component list to locate these two parts.
Creating and Editing the Board View Instruction Manual Saving Image Information with the Test Program
4-16
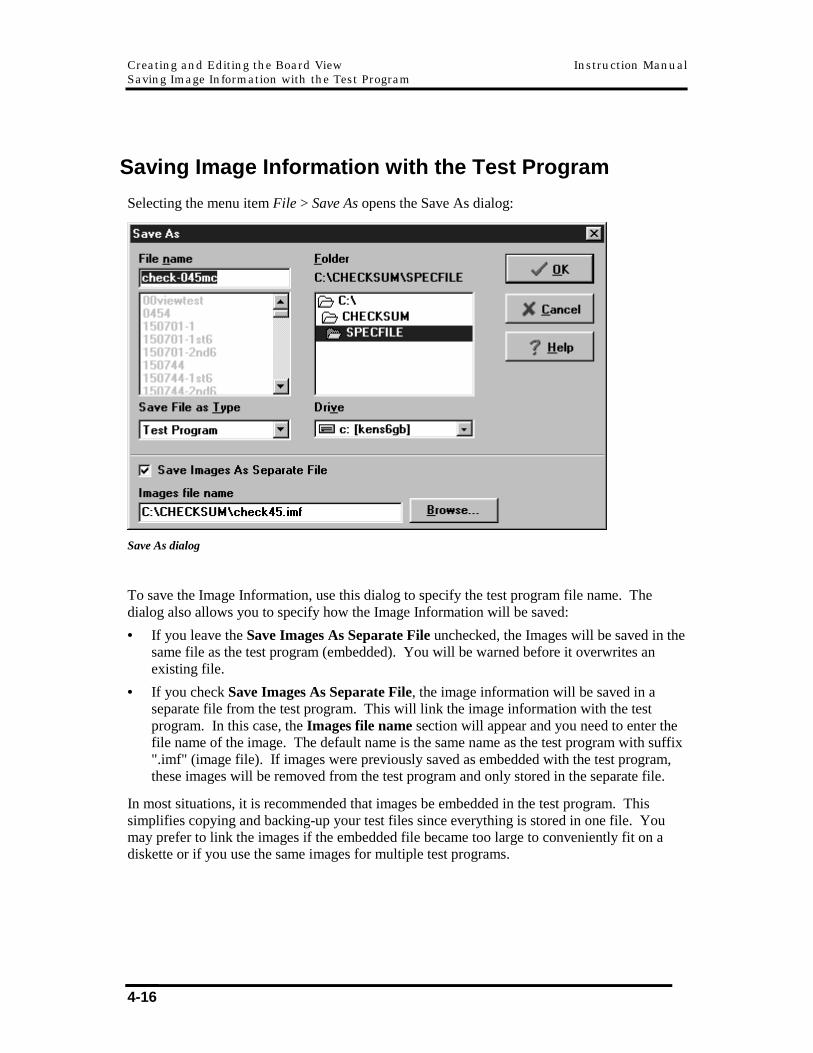
Saving Image Information with the Test Program
Selecting the menu item File > Save As opens the Save As dialog:
Save As dialog
To save the Image Information, use this dialog to specify the test program file name. The dialog also allows you to specify how the Image Information will be saved:
• If you leave the Save Images As Separate File unchecked, the Images will be saved in the same file as the test program (embedded). You will be warned before it overwrites an existing file.
• If you check Save Images As Separate File, the image information will be saved in a separate file from the test program. This will link the image information with the test program. In this case, the Images file name section will appear and you need to enter the file name of the image. The default name is the same name as the test program with suffix ".imf" (image file). If images were previously saved as embedded with the test program, these images will be removed from the test program and only stored in the separate file.
In most situations, it is recommended that images be embedded in the test program. This simplifies copying and backing-up your test files since everything is stored in one file. You may prefer to link the images if the embedded file became too large to conveniently fit on a diskette or if you use the same images for multiple test programs.
Instruction Manual Creating and Editing the Board View Importing and Exporting an Annotated Image
4-17
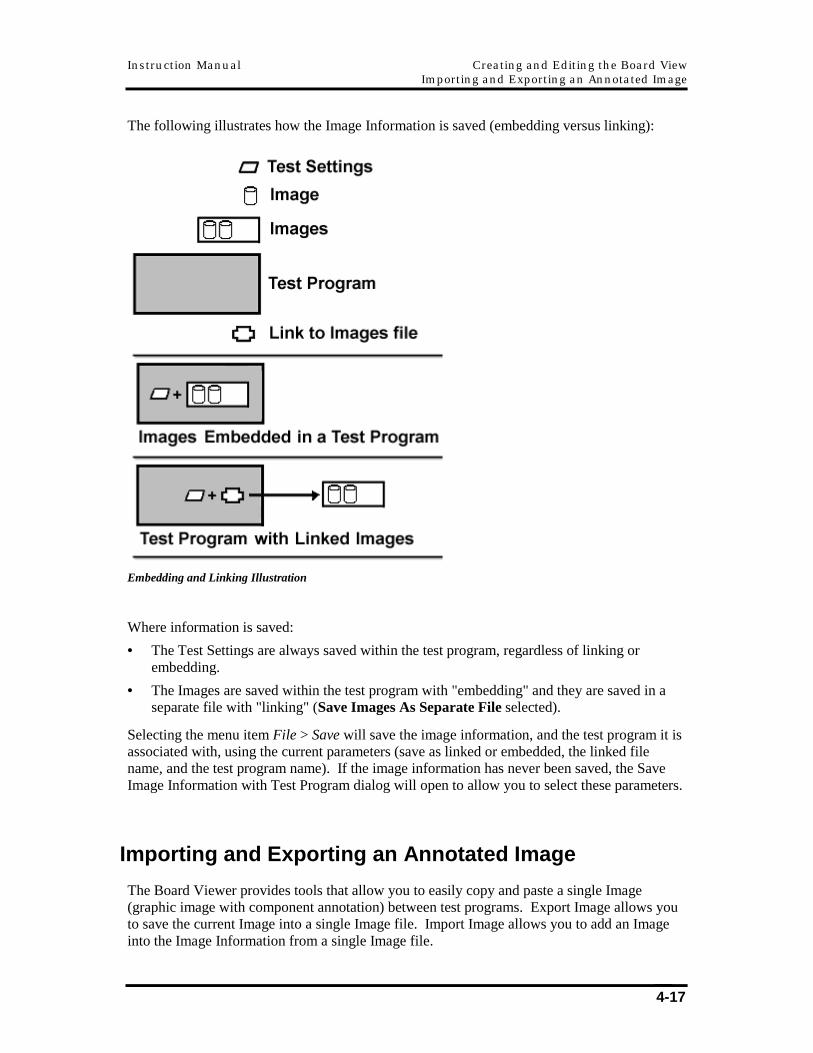
The following illustrates how the Image Information is saved (embedding versus linking):
Embedding and Linking Illustration
Where information is saved:
• The Test Settings are always saved within the test program, regardless of linking or embedding.
• The Images are saved within the test program with "embedding" and they are saved in a separate file with "linking" (Save Images As Separate File selected).
Selecting the menu item File > Save will save the image information, and the test program it is associated with, using the current parameters (save as linked or embedded, the linked file name, and the test program name). If the image information has never been saved, the Save Image Information with Test Program dialog will open to allow you to select these parameters.
Importing and Exporting an Annotated Image
The Board Viewer provides tools that allow you to easily copy and paste a single Image (graphic image with component annotation) between test programs. Export Image allows you to save the current Image into a single Image file. Import Image allows you to add an Image into the Image Information from a single Image file.
Creating and Editing the Board View Instruction Manual Importing and Exporting an Annotated Image
4-18
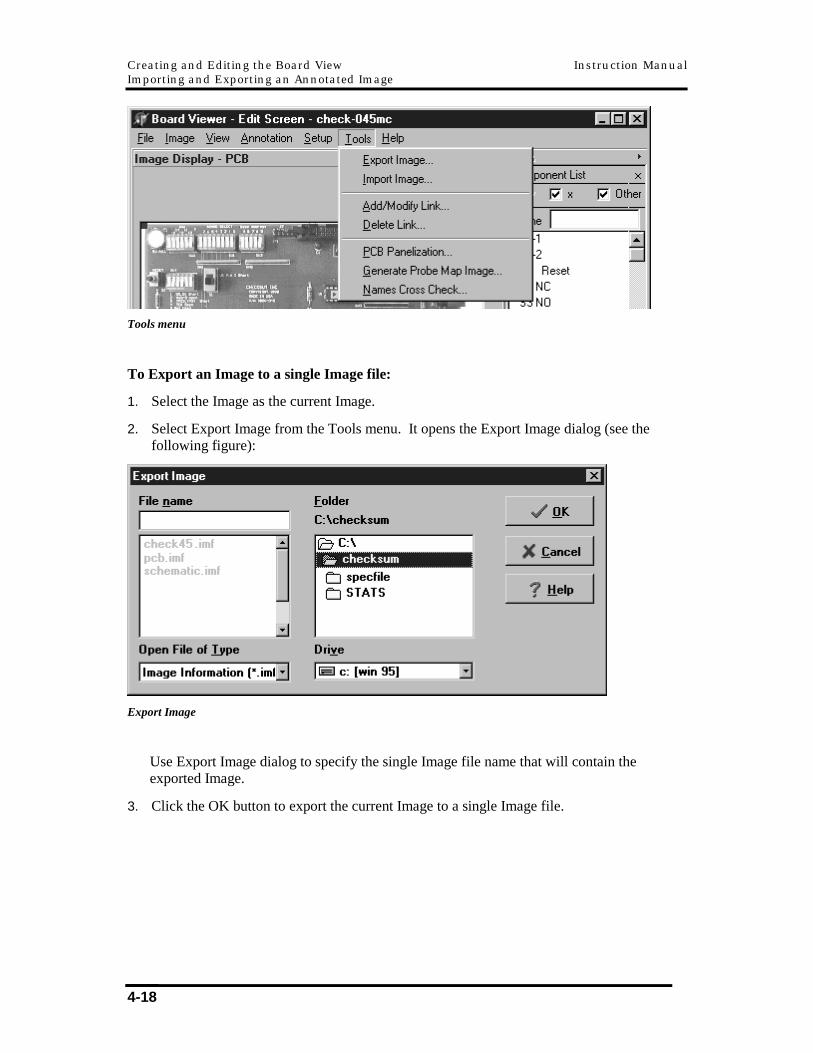
Tools menu
To Export an Image to a single Image file:
1. Select the Image as the current Image.
2. Select Export Image from the Tools menu. It opens the Export Image dialog (see the following figure):
Export Image
Use Export Image dialog to specify the single Image file name that will contain the exported Image.
3. Click the OK button to export the current Image to a single Image file.
Instruction Manual Creating and Editing the Board View Importing and Exporting an Annotated Image
4-19
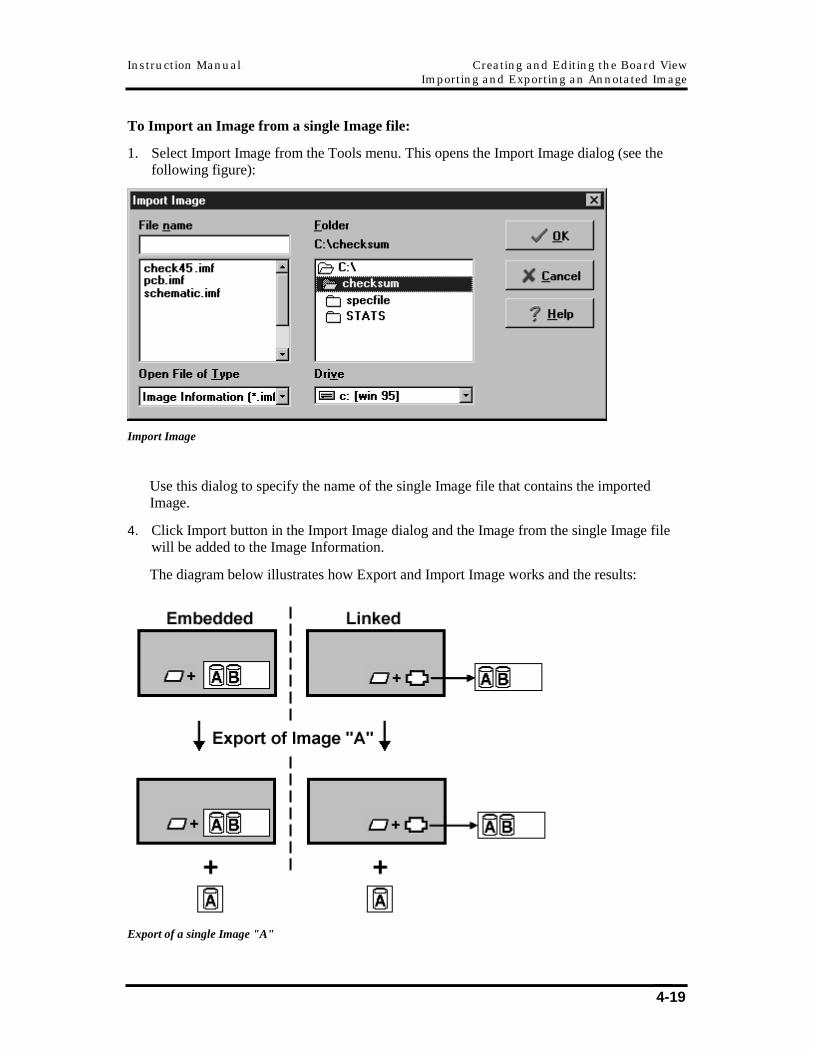
To Import an Image from a single Image file:
1. Select Import Image from the Tools menu. This opens the Import Image dialog (see the following figure):
Import Image
Use this dialog to specify the name of the single Image file that contains the imported Image.
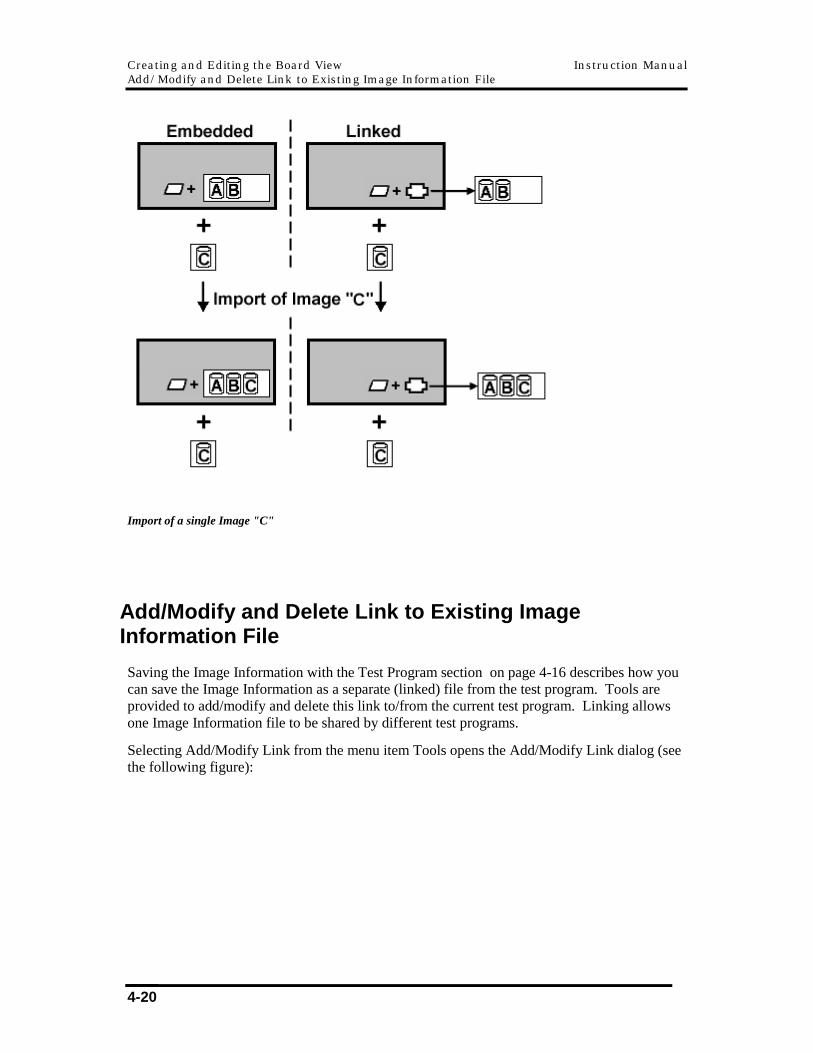
4. Click Import button in the Import Image dialog and the Image from the single Image file will be added to the Image Information.
The diagram below illustrates how Export and Import Image works and the results:
Export of a single Image "A"
Creating and Editing the Board View Instruction Manual Add/Modify and Delete Link to Existing Image Information File
4-20
Import of a single Image "C"
Add/Modify and Delete Link to Existing Image Information File
Saving the Image Information with the Test Program section on page 4-16 describes how you can save the Image Information as a separate (linked) file from the test program. Tools are provided to add/modify and delete this link to/from the current test program. Linking allows one Image Information file to be shared by different test programs.
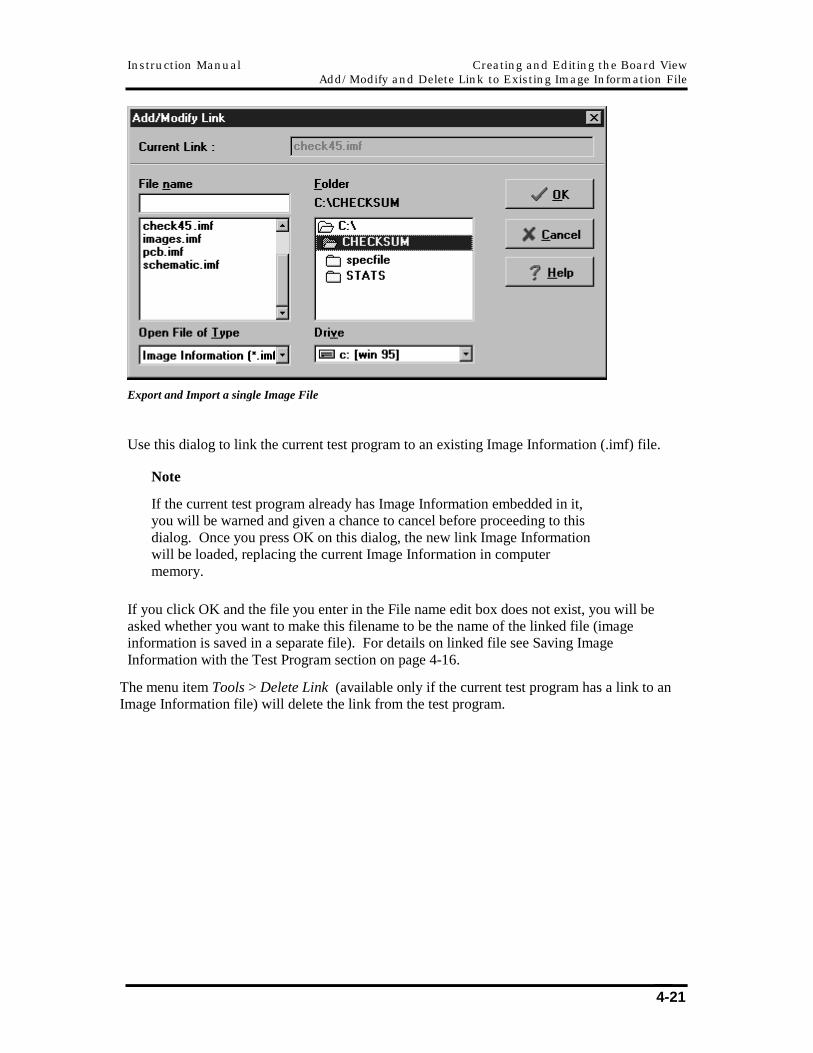
Selecting Add/Modify Link from the menu item Tools opens the Add/Modify Link dialog (see the following figure):
Instruction Manual Creating and Editing the Board View Add/Modify and Delete Link to Existing Image Information File
4-21
Export and Import a single Image File
Use this dialog to link the current test program to an existing Image Information (.imf) file.
Note
If the current test program already has Image Information embedded in it, you will be warned and given a chance to cancel before proceeding to this dialog. Once you press OK on this dialog, the new link Image Information will be loaded, replacing the current Image Information in computer memory.
If you click OK and the file you enter in the File name edit box does not exist, you will be asked whether you want to make this filename to be the name of the linked file (image information is saved in a separate file). For details on linked file see Saving Image Information with the Test Program section on page 4-16.
The menu item Tools > Delete Link (available only if the current test program has a link to an Image Information file) will delete the link from the test program.
Creating and Editing the Board View Instruction Manual PCB Panelization Wizard
4-22
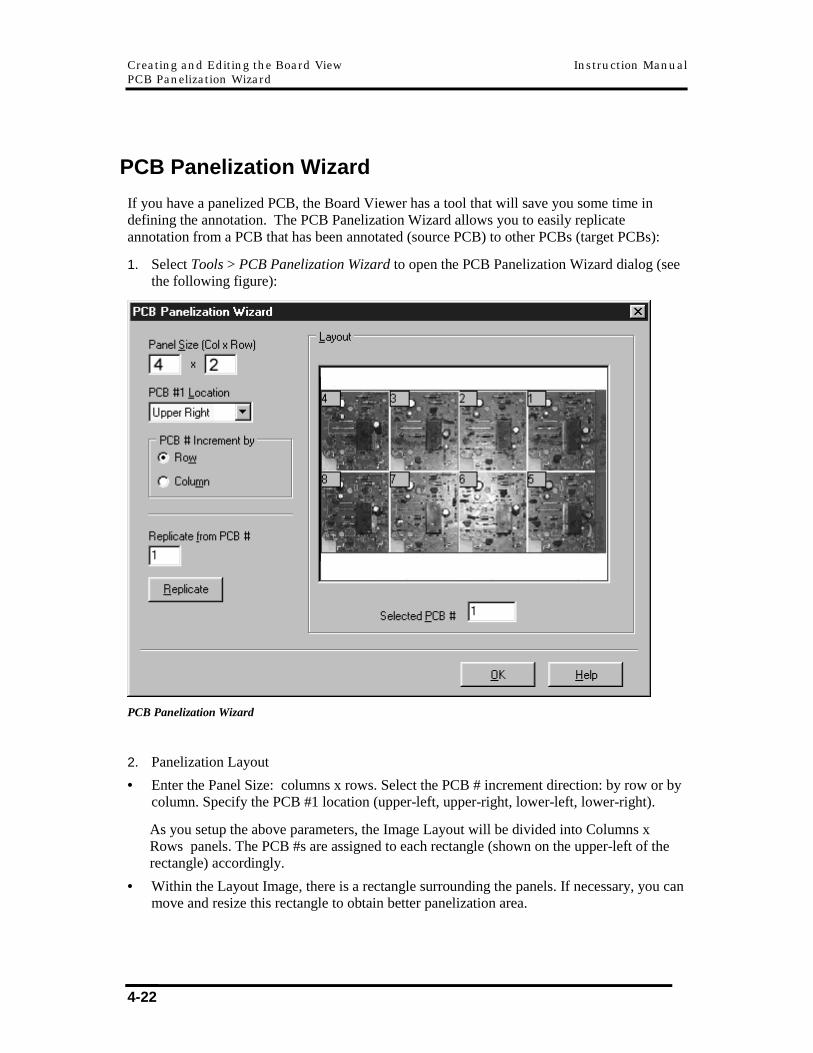
PCB Panelization Wizard
If you have a panelized PCB, the Board Viewer has a tool that will save you some time in defining the annotation. The PCB Panelization Wizard allows you to easily replicate annotation from a PCB that has been annotated (source PCB) to other PCBs (target PCBs):
1. Select Tools > PCB Panelization Wizard to open the PCB Panelization Wizard dialog (see the following figure):
PCB Panelization Wizard
2. Panelization Layout
• Enter the Panel Size: columns x rows. Select the PCB # increment direction: by row or by column. Specify the PCB #1 location (upper-left, upper-right, lower-left, lower-right).
As you setup the above parameters, the Image Layout will be divided into Columns x Rows panels. The PCB #s are assigned to each rectangle (shown on the upper-left of the rectangle) accordingly.
• Within the Layout Image, there is a rectangle surrounding the panels. If necessary, you can move and resize this rectangle to obtain better panelization area.
Instruction Manual Creating and Editing the Board View PCB Panelization Wizard
4-23
• Modify the PCB # if necessary by clicking on the PCB # in the Layout Image and enter the new PCB # on the Selected PCB # edit box. The new PCB # has to be between 1 and (number of Columns times the number of Rows).
• Enter the PCB # that has been annotated in the Replicate from PCB # edit box.
3. Click Replicate to replicate the annotation in the source PCB to the other PCBs. Press the OK button to close the PCB Panelization Wizard dialog.
Note
Before proceeding with Replication, the following is checked:
If there are PCBs other than the Replicate from PCB # that already have been annotated, the user is asked to override the existing annotation.
If the Replicate from PCB # has no annotation in it, then Replication will be aborted.
Sometimes, due to the nature of the image, some annotations may not fit quite right on the target PCBs. You can use the multi-select component feature described in Modify Component Annotation section on page 4-7 to move a group of annotation simultaneously to correct these offsets in one step.
Creating and Editing the Board View Instruction Manual Generating Probe Map Image
4-24
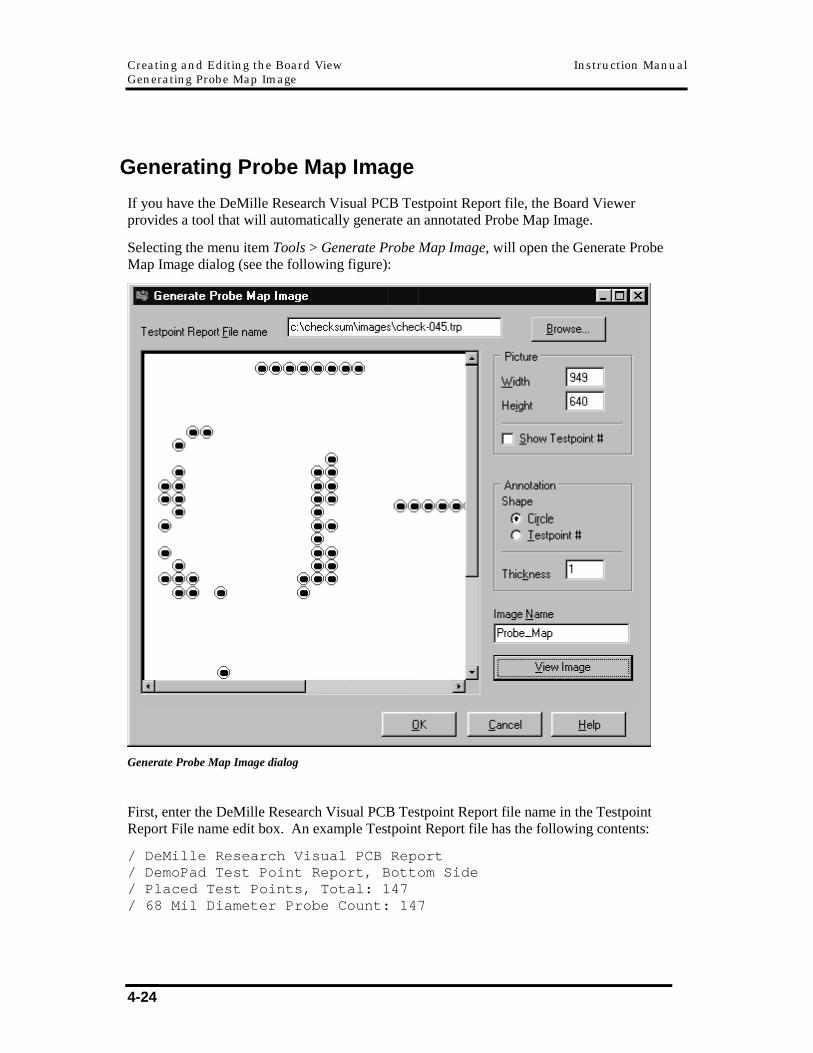
Generating Probe Map Image
If you have the DeMille Research Visual PCB Testpoint Report file, the Board Viewer provides a tool that will automatically generate an annotated Probe Map Image.
Selecting the menu item Tools > Generate Probe Map Image, will open the Generate Probe Map Image dialog (see the following figure):
Generate Probe Map Image dialog
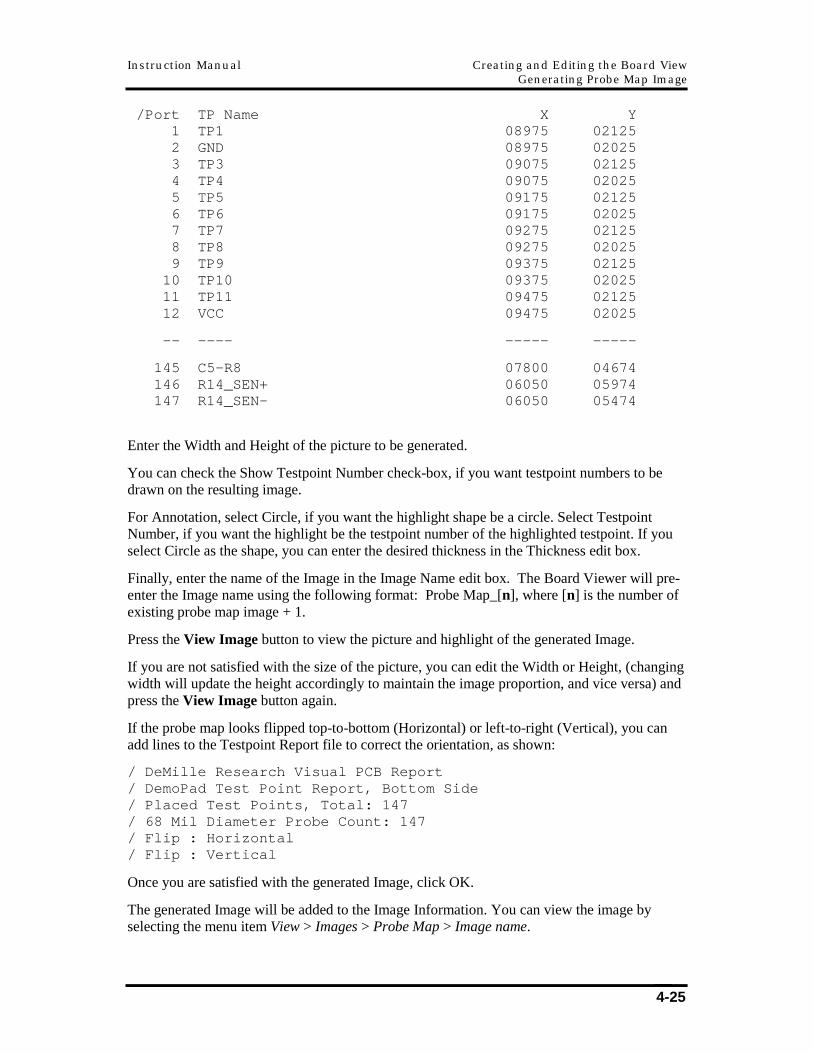
First, enter the DeMille Research Visual PCB Testpoint Report file name in the Testpoint Report File name edit box. An example Testpoint Report file has the following contents:
/ DeMille Research Visual PCB Report / DemoPad Test Point Report, Bottom Side / Placed Test Points, Total: 147 / 68 Mil Diameter Probe Count: 147
Instruction Manual Creating and Editing the Board View Generating Probe Map Image
4-25
/Port TP Name X Y 1 TP1 08975 02125 2 GND 08975 02025 3 TP3 09075 02125 4 TP4 09075 02025 5 TP5 09175 02125 6 TP6 09175 02025 7 TP7 09275 02125 8 TP8 09275 02025 9 TP9 09375 02125 10 TP10 09375 02025 11 TP11 09475 02125 12 VCC 09475 02025
-- ---- ----- -----
145 C5-R8 07800 04674 146 R14_SEN+ 06050 05974 147 R14_SEN- 06050 05474
Enter the Width and Height of the picture to be generated.
You can check the Show Testpoint Number check-box, if you want testpoint numbers to be drawn on the resulting image.
For Annotation, select Circle, if you want the highlight shape be a circle. Select Testpoint Number, if you want the highlight be the testpoint number of the highlighted testpoint. If you select Circle as the shape, you can enter the desired thickness in the Thickness edit box.
Finally, enter the name of the Image in the Image Name edit box. The Board Viewer will pre-enter the Image name using the following format: Probe Map_[n], where [n] is the number of existing probe map image + 1.
Press the View Image button to view the picture and highlight of the generated Image.
If you are not satisfied with the size of the picture, you can edit the Width or Height, (changing width will update the height accordingly to maintain the image proportion, and vice versa) and press the View Image button again.
If the probe map looks flipped top-to-bottom (Horizontal) or left-to-right (Vertical), you can add lines to the Testpoint Report file to correct the orientation, as shown:
/ DeMille Research Visual PCB Report / DemoPad Test Point Report, Bottom Side / Placed Test Points, Total: 147 / 68 Mil Diameter Probe Count: 147 / Flip : Horizontal / Flip : Vertical
Once you are satisfied with the generated Image, click OK.
The generated Image will be added to the Image Information. You can view the image by selecting the menu item View > Images > Probe Map > Image name.
Creating and Editing the Board View Instruction Manual Names Cross Check
4-26
Names Cross Check
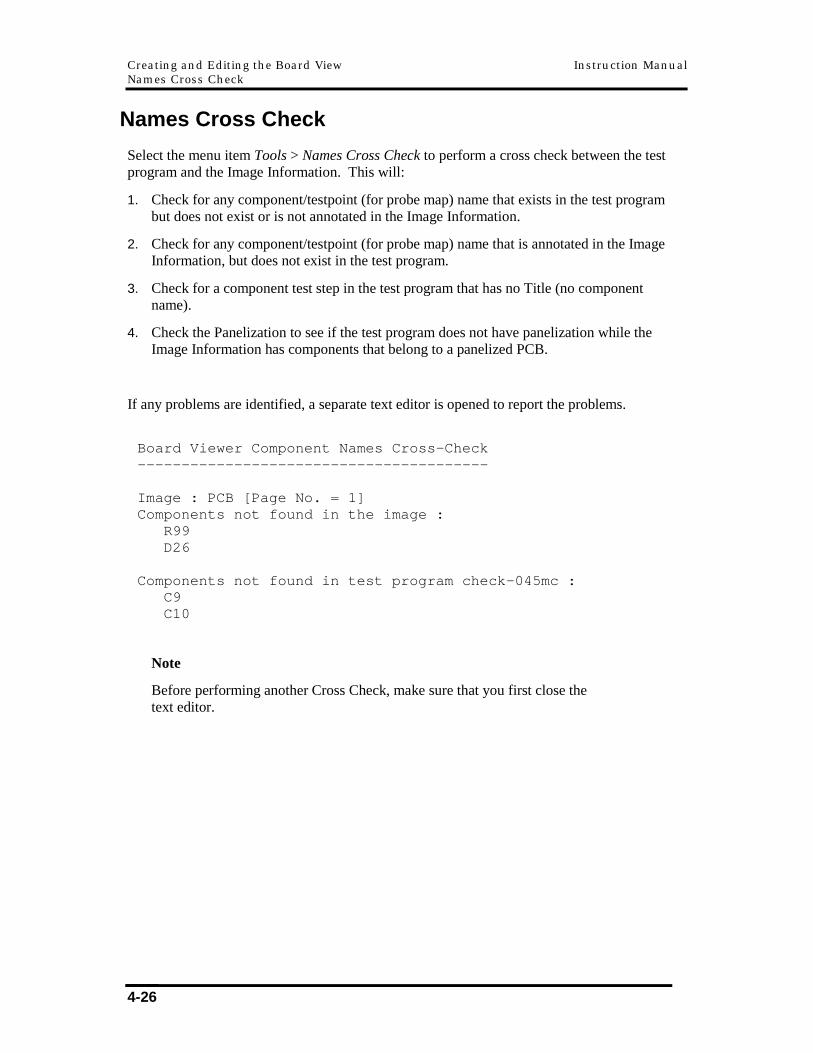
Select the menu item Tools > Names Cross Check to perform a cross check between the test program and the Image Information. This will:
1. Check for any component/testpoint (for probe map) name that exists in the test program but does not exist or is not annotated in the Image Information.
2. Check for any component/testpoint (for probe map) name that is annotated in the Image Information, but does not exist in the test program.
3. Check for a component test step in the test program that has no Title (no component name).
4. Check the Panelization to see if the test program does not have panelization while the Image Information has components that belong to a panelized PCB.
If any problems are identified, a separate text editor is opened to report the problems.
Board Viewer Component Names Cross-Check ---------------------------------------- Image : PCB [Page No. = 1] Components not found in the image : R99 D26 Components not found in test program check-045mc : C9 C10
Note
Before performing another Cross Check, make sure that you first close the text editor.
Chapter 5 Glossary
Glossary
Overview
The Glossary consists of two sections. The first section lists general terms that are used throughout this manual. The second section describes the Image Information in more detail.
General Terms
Adjustment Component A component that is to be highlighted for adjustment. The default highlight color is yellow see Setup Color Options on page 2-17 to select another color.
Annotated Image An Image that has annotated components or testpoints. See Introduction – Image Information Overview on page 1-2 and Edit Screen – Importing/Exporting annotated Image on page 4-17.
Annotation Interactively define the location and appearance of the highlight (including size, shape, thickness, and optionally text) for a component or testpoint. See the Edit Screen – Editing Component List and Testpoint List on page 4-5 and Edit Screen – Assigning and Modifying Component and Testpoint Annotation on page 4-7.
Area Map Window Area A window area displaying the overall Image and the zoomed area of the current Image. See Test Screen – Using Area Map to Zoom and Scroll on page 2-11; often abbreviated as Area Map.
Board Outline Typically, a simplified image of a board that shows a few, major features of the assembly such as the outside perimeter and connectors.
Board Viewer Use Part of Default Settings in Image Information. See Image Information Description on page 5-5 section at the end of this Glossary.
Glossary Model TR-8 Instruction Manual Glossary
5-2
Components Highlighted Part of Default Settings in Image Information. See Image Information Description section at the end of this Glossary.
Component List Part of Image in Image Information. See Image Information Description section at the end of this Glossary.
Component List Window Area A window area located at the upper right of the Board Viewer window application; shows a list of highlighted components and/or other components in the Image Information database. It is visible when the current Image is PCB, Board Outline, or Schematic; often abbreviated as Component List.
Current Image The Image that is displayed in the Image Display.
Default Annotation Shape and Thickness The Annotation settings for shape and thickness are set with menu selections. When a component is selected/highlighted, the menu items show the selected shape and thickness. When no component is selected/highlighted, the menu items show the default settings that will be used for the next annotation. The second panel of the status bar at the bottom of the window shows the default shape, thickness, font, or highlight type.
Default Image Part of Default Settings in Image Information. See Image Information Description section at the end of this Glossary.
Test Settings Part of Image Information. See Image Information Description section at the end of this Glossary.
Display Highlight Part of Default Settings in Image Information. See Image Information Description section at the end of this Glossary.
Edit Screen Use the Edit Screen to edit and save the Image Information with a test program. See the Edit Screen on page 4-1.
Embedding A way of saving the Image Information with the test program by putting the Image Information in the same file as the test program. See the Edit Screen – Saving Image Information with the Test Program on page 4-16.
Failed Component A component that is to be highlighted as failing. The default highlight color is red see Setup Color Options on page 2-17 to select another color.
Image Part of Image Information. See Image Information Description section on page 5-5 at the end of this Glossary.
Model TR-8 Instruction Manual Glossary Glossary
5-3
Image Display Window Area A window area displaying the current Image; often abbreviated as Image Display.
Image Information See Image Information Description section at the end of this Glossary.
Image List Window A separate window initially positioned at the left side of the Edit Screen that shows a list of Images in the Image Information. See the Edit Screen – Assigning and Modifying Component and Testpoint Annotation on page 4-7; often abbreviated as Image List.
Image Name Part of Image in Image Information. See Image Information Description section on page 5-5 at the end of this Glossary.
Image Type Part of Image in Image Information. See Image Information Description section at the end of this Glossary.
Keypad Window Area A window area located between Component List and Area Map; shows how to use the keypad (CheckSum Model TR-8-KEYPAD) or buttons on the front panel of the Test Fixture (TR-9-1000-QC, Analyst mc, or Analyst ft System) to control image selection, zooming, and scrolling in the Board Viewer. See Test Screen – Use Keypad in Test System Configuration on page 2-15.
Linking A method of saving the Image Information with the test program by putting the Image Information in a separate file than the test program, and save a link in the test program to that file. See the Edit Screen – Save Image Information with the Test Program on page 4-16.
Passed Component A component that is to be highlighted as passing. The default highlight color is green see Setup Color Options on page 2-17 to select another color.
Page No. Part of Image in Image Information. See Image Information Description section at the end of this Glossary.
PCB The Printed Circuit Board (PCB) can be any assembly. The image shows details of each component on the PCB.
Picture Part of Image in Image Information. The picture file format can be BMP, JPEG, PNG, PCX, TIFF (Uncompressed and PackBits compression), WMF. See Image Information Description section on page 5-5 at the end of this Glossary.
Probe Map The probe map is generally a top view of the pogo pins, also called spring probes, used on a test fixture.
Shape An option under the Annotation Menu, allow you to choose one of the following shape
Glossary Model TR-8 Instruction Manual Glossary
5-4
property of the component/test point annotation; circle, rectangle, round rectangle or text. See the Edit Screen – Assigning and Modifying Component and Testpoint Annotation on page 4-7.
SPC Log File A file generated by Visual MDA that contains statistical process control (SPC) information from a board test.
Test Program A CheckSum Visual MDA test program.
Test Report File A file generated by Visual MDA that reports failed or passed and failed components from a board test.
Test Results File A file that contains results of a board test that the Board Viewer can open and read to display the Passed/Failed component (currently supporting the SPC log file and test report file generated by Visual MDA). See Failure Analysis – Reading Test Results File on page 3-5.
Test Runs List Window Area A window area located at the bottom of the View Screen (during Post-test mode); shows list of test runs read-in from a test report file. See Failure Analysis – Reading Test Results File on page 3-5.
Testpoint List Window Area A window area located at the upper right of the Board Viewer window application (in place of the Component List); shows a list of highlighted testpoints and/or other testpoints in the Image Information database. It is visible when the current Image type is a Probe Map, often abbreviated as Testpoint List.
Testpoint List Part of Image in Image Information. See Image Information Description section on page 5-5 at the end of this Glossary.
Thickness An option under the Annotation Menu that allow you to define the thickness of the component/testpoint annotation. See the Edit Screen – Assigning and Modifying Component and Testpoint Annotation Information on page 4-7.
UUT Marker A line drawn from a solid rectangle on the upper-left corner of the Image Display that points to the selected component. See Test Screen – Viewing Components on page 2-3 and Selecting a Component on page 2-5.
Model TR-8 Instruction Manual Glossary Image Information Description
5-5
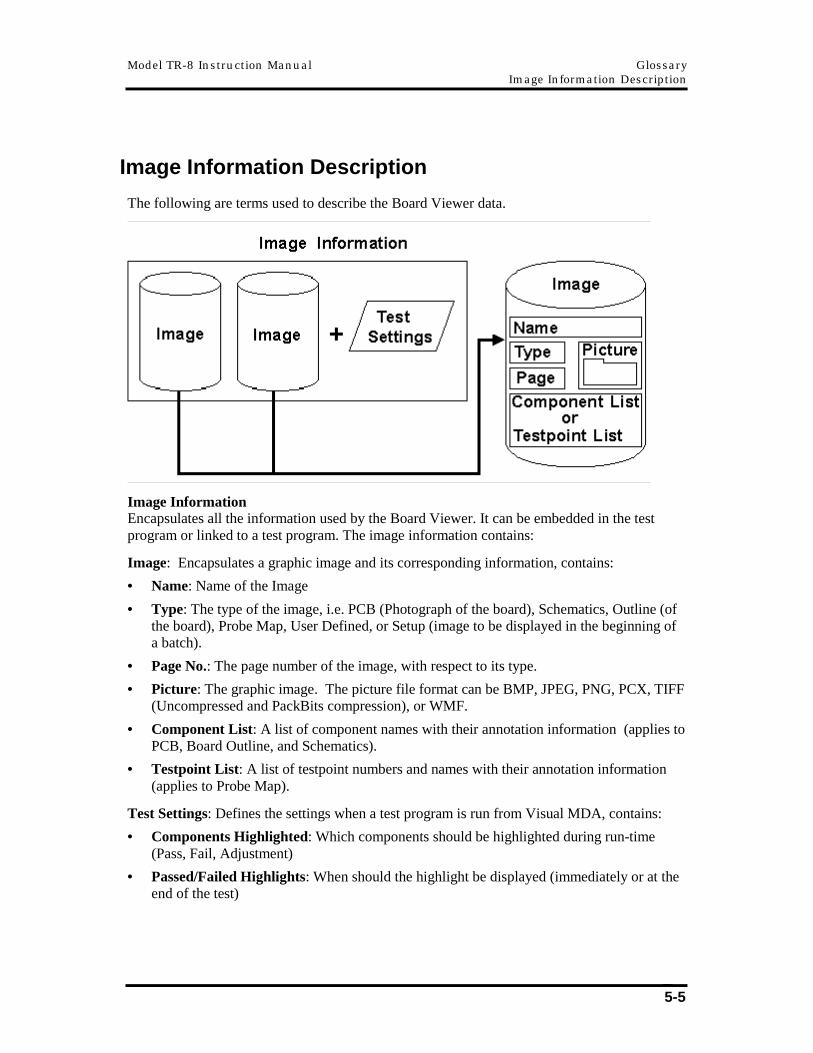
Image Information Description
The following are terms used to describe the Board Viewer data.
Image Information Encapsulates all the information used by the Board Viewer. It can be embedded in the test program or linked to a test program. The image information contains:
Image: Encapsulates a graphic image and its corresponding information, contains:
• Name: Name of the Image
• Type: The type of the image, i.e. PCB (Photograph of the board), Schematics, Outline (of the board), Probe Map, User Defined, or Setup (image to be displayed in the beginning of a batch).
• Page No.: The page number of the image, with respect to its type.
• Picture: The graphic image. The picture file format can be BMP, JPEG, PNG, PCX, TIFF (Uncompressed and PackBits compression), or WMF.
• Component List: A list of component names with their annotation information (applies to PCB, Board Outline, and Schematics).
• Testpoint List: A list of testpoint numbers and names with their annotation information (applies to Probe Map).
Test Settings: Defines the settings when a test program is run from Visual MDA, contains:
• Components Highlighted: Which components should be highlighted during run-time (Pass, Fail, Adjustment)
• Passed/Failed Highlights: When should the highlight be displayed (immediately or at the end of the test)

Glossary Model TR-8 Instruction Manual Image Information Description
5-6
• Board Viewer Use Settings: Display Board Viewer and Visual MDA together: (Yes/No) Update Display upon Board Failure (Yes/No) Do not use Board Viewer: (Yes/No) Default Image: Image that will show initially
Index
A
Add/Modify and Delete Link to Existing Image Information File..................................................4-20 Adding an Image ...........................................................................................................................4-3 Alt key to "Drag-and-Specify" ........................................................................................................4-7 Annotation Special Topics...........................................................................................................4-15 Assigning and Modifying Component Annotation and Testpoint Annotation ................................4-7
B
Board Outline ........................................................................................................................ 5-1, 5-2
C
Capacitors Tested in Parallel ......................................................................................................4-15 Clear Highlighting .....................................................................................................................2-10 Click-and-Paste ...........................................................................................................................4-12 Colors ..........................................................................................................................................2-17 Component List ............................................................................................4-5, 4-6, 4-9, 4-10, 4-12 Controlling the Component List ...................................................................................................2-18 Cross Checking ...........................................................................................................................4-26 Ctrl key to "Click-and-Paste" .........................................................................................................4-7
D
Default Annotation Settings................................................................................................. 4-12, 5-1 DeMille Research .............................................................................................................. 4-24, 4-25 Drag-and-Specify ........................................................................................................................4-12
E
Edit Screen............................................................................................................................ 4-1, 4-2 Editing Image Information .............................................................................................................4-2 Editing the Component List and Testpoint List .............................................................................4-5
F
Failure Analysis ..................................................................................................................... 3-1, 3-2 Features not Available in the Test Screen ..................................................................................2-21 File Format for Images ................................................................................................... 4-3, 5-1, 5-5 File Menu (Edit Screen).................................................................................................................4-3 File Menu (Test Screen)................................................................................................................2-2 Fitting Board Viewer and Visual MDA Windows on your Monitor ...............................................2-21
G
Generating Probe Map Image.....................................................................................................4-24 Glossary ..................................................................................................................5-1, 5-2, 5-3, 5-4 Glossary Image Information Description Details ...........................................................................5-5
I
Image Information Overview .........................................................................................................1-2 Image List ............................................................................................................................ 4-7, 4-13 Importing and Exporting an Annotated Image ............................................................................4-17 Introduction to the Board Viewer...................................................................................................1-1
K
Keypad .............................................................................................................................. 2-15, 2-16
L
Linking and Embedding Image Information.................................................................................4-16
M
Main Screen .................................................................................................................................1-3
N
Names Cross Check ...................................................................................................................4-26
O
Opening a Test Program...............................................................................................................4-3
P
Parallel Component Annotation ..................................................................................................4-15 PCB = Printed Circuit Board.................................................................................................. 1-1, 5-1 PCB Panelization Wizard .................................................................................................. 4-22, 4-23 Printing ..........................................................................................................................................3-7 Probe Map...................................................................................................................... 1-1, 5-3, 5-4 Probe Map Annotation.................................................................................................................4-14
R
Reading Test Results File...........................................................................................................3-6 Remove Annotation.....................................................................................................................4-10 Right-Click Shortcuts.....................................................................................................................4-7
S
Saving Image Information with the Test Program.......................................................................4-16 Scrolling.........................................................................................................................................2-8 Searching for a Component ..........................................................................................................3-4 Selecting a Component .................................................................................................................2-5 Selecting an Image........................................................................................................................2-9 Setup Color Options ....................................................................................................................2-17 Setup Menu (Test Screen) ..........................................................................................................2-12 SPC = Statistical Process Control......................................................................................... 1-1, 5-1 System Configuration ..................................................................................................................2-15
T
Testpoint List ......................................................................................................................... 4-6, 4-7 Tools Menu ...................................................................................................................... 4-18, 4-19 Type of Image ...............................................................................................................................5-5
U
Unloading Images .........................................................................................................................3-8 User Interface Overview................................................................................................................1-2 Using the Area Map to Zoom and Scroll .....................................................................................2-11 UUT = Unit-Under-Test .................................................................................................................1-1 UUT Marker .......................................................................................................................... 2-5, 5-4
V
Viewing Components ............................................................................................................ 2-3, 3-4

Z
Zooming.........................................................................................................................................2-7