boards of commissioners update - fresno...
TRANSCRIPT
www.fresnohousing.org 1331 Fulton Mall, Fresno, California 93721 (559) 443-8400 TTY (800) 735-2929
Boards of Commissioners Update March 2018
www.fresnohousing.org1331 Fulton Mall, Fresno, California 93721 (559) 443-8400 TTY (800) 735-2929
Boards of Commissioners Update – March 2018
Table of Contents
Topic: Page
Financial Report – January 2018 3
Quarterly Expenditures Report – October – December 2017 9
Overview of HUD Administrator Visit to Fresno 10
�
�
BOARD UPDATE O (559) 443-8400 F (559) 445-8981
1331 Fulton Mall Fresno, California 93721 T T Y (800) 735-2929
www.fresnohousing.org
Executive Summary
The purpose of this update is to present an overview of the financial operating
results for the Fresno Housing Authority as of January 31, 2018. Please see the
attached financial report for a summary of revenues and expenses by Agency
division.
The financial report attachment shows the consolidation of all Agency
programmatic budgets combined into six divisions. Projections have been
incorporated into the year‐to‐date budget to account for the timing of cash flows
and known variable expenses. These adjustments were based on historical trends
and the most current information available.
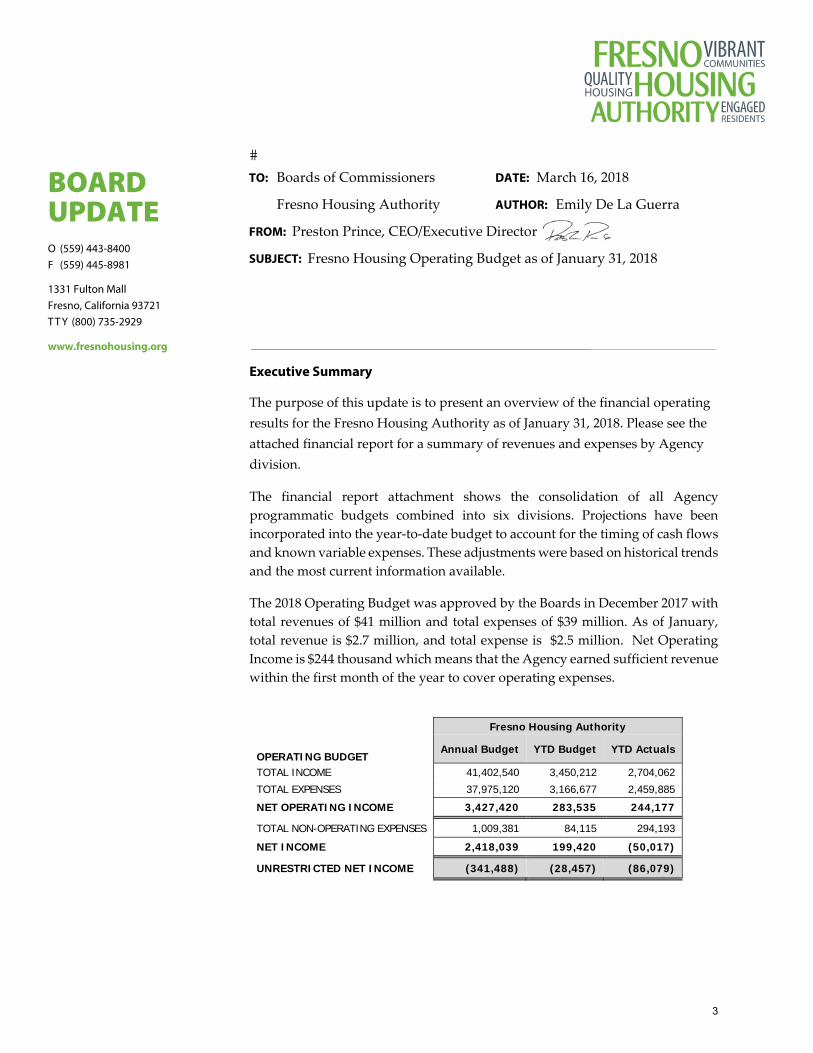
The 2018 Operating Budget was approved by the Boards in December 2017 with
total revenues of $41 million and total expenses of $39 million. As of January,
total revenue is $2.7 million, and total expense is $2.5 million. Net Operating
Income is $244 thousand which means that the Agency earned sufficient revenue
within the first month of the year to cover operating expenses.
Fresno Housing Authority
OPERATING BUDGET Annual Budget YTD Budget YTD Actuals
TOTAL INCOME 41,402,540 3,450,212 2,704,062 TOTAL EXPENSES 37,975,120 3,166,677 2,459,885 NET OPERATING INCOME 3,427,420 283,535 244,177
TOTAL NON-OPERATING EXPENSES 1,009,381 84,115 294,193 NET INCOME 2,418,039 199,420 (50,017)
UNRESTRICTED NET INCOME (341,488) (28,457) (86,079)
TO: Boards of Commissioners
Fresno Housing Authority
DATE: March 16, 2018
AUTHOR: Emily De La Guerra
FROM: Preston Prince, CEO/Executive Director
SUBJECT: Fresno Housing Operating Budget as of January 31, 2018
3

�
�
Agency Revenue
Overall, year‐to‐date revenue is $2.7 million, or 22%, less than the January budget due to the timing of
developer fee revenue in PC&D, the timing of HUD grant income in AHD, and lower operating subsidies
in HSM.
– Core: Other Income is higher than budgeted due to additional maintenance revenue received for
REAC inspections, call backs, and vacancy preparations.
– Core: Admin & Management Fee Income is less than budgeted due to expense reductions in IT
Services and Staff Development. Fees for these two services are allocated to the programs and the
revenue is booked in Core. If there are fewer expenses, there will be less revenue and the net effect
on the overall budget will be zero.
– P&CD: No Developer fees were received in January. The developer fees for two projects that were
budgeted will be received towards the end of the first quarter.
– P&CD: The Prevailing Wage Monitoring income was paid from Parc Grove North East, Sanger,
Memorial, & Fresno Edison II, in the amount of $25,000.
– AHD: Other Grant Income is more than budgeted due to greater revenue received from City &
County HCV for Tenant Payment Agreement (TPA) Fraud Recovery.
- 200,000 400,000 600,000 800,000 1,000,000 1,200,000
Core
Inst.
P&CD
AHD
HSM
UP
YTD Revenue: Budget to Actual
YTD Actuals YTD Budget
4
�
�
– HSM: Other Grant Income is 57% lower than budgeted due to a delay in the reimbursements
received from Parlier Migrant Center.
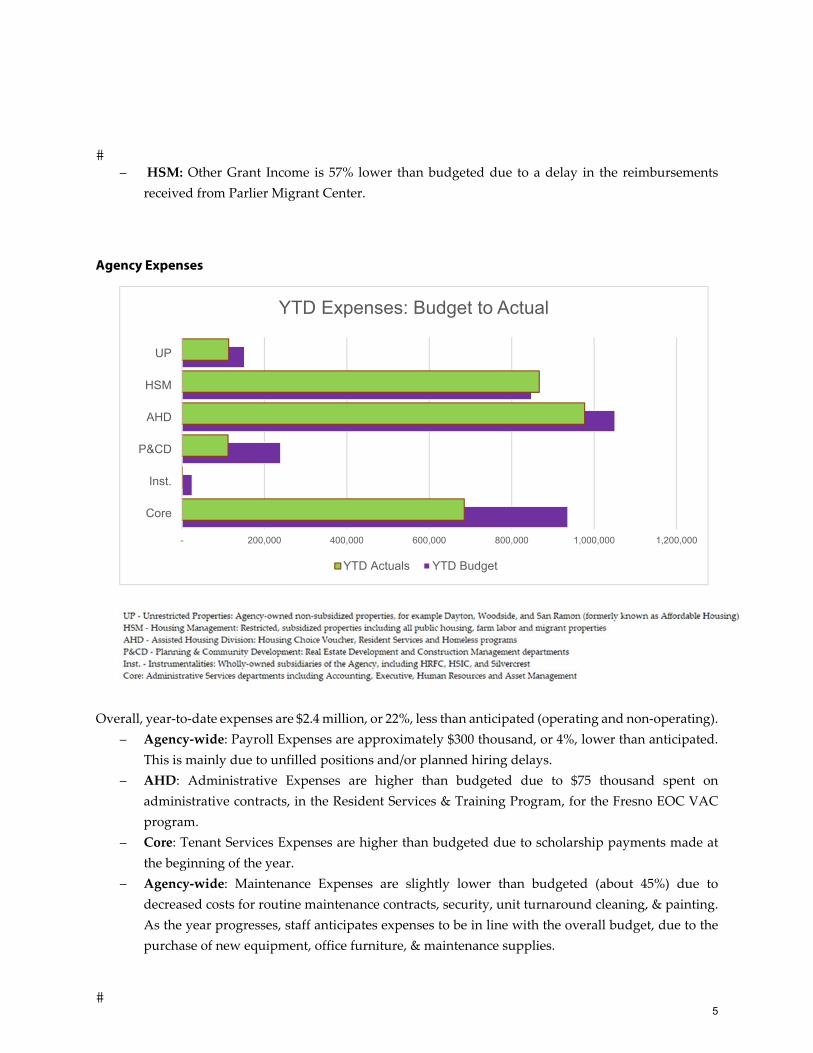
Agency Expenses
Overall, year‐to‐date expenses are $2.4 million, or 22%, less than anticipated (operating and non‐operating).
– Agency‐wide: Payroll Expenses are approximately $300 thousand, or 4%, lower than anticipated.
This is mainly due to unfilled positions and/or planned hiring delays.
– AHD: Administrative Expenses are higher than budgeted due to $75 thousand spent on
administrative contracts, in the Resident Services & Training Program, for the Fresno EOC VAC
program.
– Core: Tenant Services Expenses are higher than budgeted due to scholarship payments made at
the beginning of the year.
– Agency‐wide: Maintenance Expenses are slightly lower than budgeted (about 45%) due to
decreased costs for routine maintenance contracts, security, unit turnaround cleaning, & painting.
As the year progresses, staff anticipates expenses to be in line with the overall budget, due to the
purchase of new equipment, office furniture, & maintenance supplies.
- 200,000 400,000 600,000 800,000 1,000,000 1,200,000
Core
Inst.
P&CD
AHD
HSM
UP
YTD Expenses: Budget to Actual
YTD Actuals YTD Budget
5

�
�
– Agency‐wide: Administrative Expenses are nearly $200 thousand lower than budgeted across the
Agency. Core and P&CD show the largest reductions in this line item, as Professional & Consulting
Expenses have been less than anticipated for the first month of the year.
�
6

�
�
Agency Net Income
– Unrestricted net income is approximately $57 thousand lower than budgeted as of January. This
trend will right itself by the end of the quarter and is related to the flow of revenue and expenses
by month.
– Year‐to‐date Restricted Net Income is also lower than budgeted less revenue in Instrumentalities
and HSM. Staff expects that these revenues will be received by March.
(150,000) (100,000) (50,000) - 50,000 100,000 150,000 200,000 250,000
Restricted
Unrestricted
YTD Net Income: Budget to Actual
YTD Actuals YTD Budget
7

OPERATING BUDGET
Annual
BudgetYTD Budget YTD Actuals
Annual
BudgetYTD Budget YTD Actuals
Annual
BudgetYTD Budget YTD Actuals
Annual
BudgetYTD Budget YTD Actuals
Annual
BudgetYTD Budget YTD Actuals
Annual
BudgetYTD Budget YTD Actuals
Annual
BudgetYTD Budget YTD Actuals
YTD $
Variance
YTD %
Variance
% of Budget
Remaining
INCOME
NET TENANT INCOME - - - - - - - - - - - - 5,935,766 494,647 504,956 2,300,350 191,696 190,764 8,236,116 686,343 695,720 9,377 1% 92%
INTEREST INCOME 7,000 583 609 866,667 72,222 10,094 - - - - - 17 1 5 - - 1 873,684 72,807 10,709 (62,098) -85% 99%
OTHER INCOME 808,000 67,333 96,594 177,299 14,775 15 20,000 1,667 25,483 710,822 59,235 61,632 14,014 1,168 599 43,000 3,583 4 1,773,135 147,761 184,328 36,567 25% 90%
ADMIN & MANAGEMENT FEE INCOME 8,441,439 703,453 562,651 300,000 25,000 - - - - - - - - - - - - 8,741,439 728,453 562,651 (165,803) -23% 94%
DEVELOPER FEE INCOME - - - - - - 4,979,660 414,972 - - - - - - - - - - 4,979,660 414,972 - (414,972) -100% 100%
HUD GRANT INCOME - - - - - - - - - 9,491,065 790,922 744,955 4,916,293 409,691 352,856 - - - 14,407,358 1,200,613 1,097,811 (102,802) -9% 92%
OTHER GRANT INCOME - - - - - - - - - 1,354,390 112,866 116,145 1,000,338 83,362 35,162 36,420 3,035 1,535 2,391,148 199,262 152,843 (46,420) -23% 94%
TOTAL INCOME 9,256,439 771,370 659,854 1,343,966 111,997 10,109 4,999,660 416,638 25,483 11,556,277 963,023 922,733 11,866,428 988,869 893,578 2,379,770 198,314 192,305 41,402,540 3,450,212 2,704,062 (746,150) -22% 93%
EXPENSES
PAYROLL EXPENSES 7,135,977 594,665 460,748 - - - 1,285,953 107,163 91,456 6,891,221 574,268 452,206 3,026,970 252,248 196,043 330,528 27,544 9,681 18,670,648 1,555,887 1,210,134 (345,753) -22% 94%
ADMINISTRATIVE EXPENSES 3,445,759 287,147 175,203 237,825 19,819 491 1,583,998 132,000 19,590 4,741,805 395,150 454,086 2,170,765 180,897 143,189 213,403 17,784 14,339 12,393,555 1,032,796 806,897 (225,899) -22% 93%
TENANT SERVICES EXPENSES 50,000 4,167 18,625 - 2,083 - - - - 899,843 74,987 48,592 335,581 27,965 25,720 5,250 438 - 1,290,674 109,640 92,937 (16,702) -15% 93%
UTILITY EXPENSES 173,427 14,452 751 - - - - - - - 10,987 1,882,686 156,891 94,296 270,410 22,534 23,360 2,326,523 193,877 129,394 (64,483) -33% 94%
MAINTENANCE EXPENSES 404,862 33,739 20,469 25,000 2,083 - 3,000 250 468 44,354 3,696 - 1,922,431 160,203 101,948 351,490 29,291 47,460 2,751,137 229,261 170,345 (58,917) -26% 94%
TAXES & INSURANCE EXPENSES 23,720 1,977 8,973 8,900 742 488 1,000 83 146 7,900 658 869 460,962 38,414 21,406 40,101 3,342 18,295 542,583 45,215 50,177 4,962 11% 91%
TOTAL EXPENSES 11,233,745 936,145 684,769 271,725 24,727 979 2,873,951 239,496 111,660 12,585,122 1,048,760 966,740 9,799,395 816,616 582,603 1,211,182 100,932 113,134 37,975,120 3,166,677 2,459,885 (706,791) -22% 94%
NET OPERATING INCOME (1,977,306) (164,776) (24,915) 1,072,241 87,270 9,130 2,125,709 177,142 (86,177) (1,028,845) (85,737) (44,007) 2,067,033 172,253 310,976 1,168,588 97,382 79,170 3,427,420 283,535 244,177 (39,358) -14% 93%
NON-OPERATING EXPENSES
TOTAL NON-OPERATING EXPENSES - - - 500 42 - - - - 20,000 1,667 10,150 128,526 10,711 231,019 279,850 23,321 - 428,876 35,740 241,169 205,430 575% 44%
TOTAL FINANCING EXPENSES - - - - - - - - - - - 250,721 20,893 53,024 329,784 27,482 - 580,505 48,375 53,024 4,649 10% 91%
TOTAL ADJUSTMENTS & OPERATING TRANSFERS - - - - - - - - - - - - - - - - - - - - - - 0% 0%
TOTAL NON-OPERATING EXPENSES - - - 500 42 - - - - 20,000 1,667 10,150 379,247 31,604 284,043 609,634 50,803 - 1,009,381 84,115 294,193 210,078 250% 71%
NET INCOME (1,977,306) (164,776) (24,915) 1,071,741 87,228 9,130 2,125,709 177,142 (86,177) (1,048,845) (87,404) (54,157) 1,687,786 140,649 26,932 558,954 46,580 79,170 2,418,039 199,420 (50,017) (249,436) -125% 102%
UNRESTRICTED NET INCOME (1,977,306) (164,776) (24,915) 2,125,709 177,142 (86,177) (1,048,845) (87,404) (54,157) 558,954 46,580 79,170 (341,488) (28,457) (86,079) (57,622) -202% 75%
HAP REVENUE 75,268,040 6,272,337 6,306,028 75,268,040 6,272,337 6,306,028 33,691 0% 0%
HAP EXPENSES 79,161,550 6,596,796 6,277,359 79,161,550 6,596,796 6,277,359 (319,437) -5% 8%
NET HAP INCOME (3,893,510) (324,459) 28,669 (3,893,510) (324,459) 28,669 353,129 -109% -1%
Fresno Housing AuthorityCore Inst. P&CD AHD HSM UP
8

�
BOARD UPDATE O (559) 443-8400 F (559) 445-8981
1331 Fulton Mall Fresno, California 93721 T T Y (800) 735-2929
www.fresnohousing.org
Executive Summary
The purpose of this update is to provide the Boards of Commissioners with a
requested update regarding significant vendor expenditures for fourth quarter
2017. This information was previously provided to the Board in August 2017
and will be included in Board updates going forward on a quarterly basis.
Below is a list of vendors to whom the Agency paid over $50,000 during the
quarter. Not included on this list are expenses tied to real estate development as
these expenditures have been approved by the Boards in various actions. This
list includes payments made by the Housing Authority and affiliated limited
parternships.
TO: Boards of Commissioners
Fresno Housing Authority
DATE: March 15, 2018
AUTHOR: Emily De La Guerra
FROM: Preston Prince, CEO
SUBJECT: Expenditure Update‐ October 2017 through December 2017
�
9
�
BOARD UPDATE O (559) 443-8400 F (559) 445-8981
1331 Fulton Mall Fresno, California 93721 T T Y (800) 735-2929
www.fresnohousing.org
Overview
In mid‐January 2018, Fresno Housing was contacted and asked to host the newly
appointed HUD Region IX Administrator, Jimmy Stracner, with the purpose of
his visit being to discuss HUD’s FY2018‐2019 Agency Priority Goals and how the
work of Fresno aligns with those priorities.
HUD’s priorities include:
– Promote economic opportunity for HUD‐assisted residents – a key
strategy for ensuring residents have access and receive delivery of
supportive services includes the creation of the EnVision Center
Network. This is a local‐level effort for public and private partners to
join with HUD to create low‐cost, sustainable models for short and long‐
term educational and work outcomes that create pathways towards self‐
sufficiency.
– Transform assisted housing – key strategies include improving long‐
term affordable housing options by exploring more sustainable
platforms, and developing different rental housing program structures
and calculations to encourage work and stable family formation,
simplify administration, improve fiscal sustainability, and increase local
control and choice.
– Reduce the average length of homelessness – key strategies include
implementing cost effective strategies for systems like the Continuums
of Care, target VASH vouchers to those most vulnerable veterans, and
working within rural communities to coordinate services and increase
accessibility for persons experiencing homelessness
– Protect families from lead‐based paint and other health hazards – key
strategies being to build community awareness on this matter, and align
and enforce HUD‐assisted housing inspections and mitigate measures
in addressing these health concerns throughout our housing.
TO: Boards of Commissioners
Fresno Housing Authority
DATE: March 15, 2018
AUTHOR: Tiffany Mangum
FROM: Preston Prince, CEO
SUBJECT: Overview of the Fresno visit by HUD Regional Administrator,
Jimmy Stracner
10

Other areas discussed included:
– Disaster Recovery Programs where HUD will lead all housing recovery efforts in collaboration
with FEMA
– Federal Housing Administration reform where the Administration seeks to expand
homeownership programs and make regulatory changes to the housing finance system.
– Innovative Strategies for recruiting for the Section 3 program
The visit with RA Stracner included a meeting with the Agency Executive Leadership, Mayor Brand, our
Fresno‐Madera homeless stakeholders, and a combined meeting with the Small Business Administration’s
Regional Administrator, also in Fresno for a site visit. While the Housing Authority did facilitate the visit
with our new Administrator, the itinerary and priorites for this visit were established prior to his visit. Staff
is working to continue to be a resource to our HUD partners.
�
11