brennan et al 2013 tcga gbm update.pdf
DESCRIPTION
article on glioblastomaTRANSCRIPT
Resource
The Somatic Genomic Landscapeof GlioblastomaCameron W. Brennan,1,2,40,* Roel G.W. Verhaak,3,11,40 Aaron McKenna,4,40 Benito Campos,5,6 Houtan Noushmehr,7,8
Sofie R. Salama,9 Siyuan Zheng,3 Debyani Chakravarty,1 J. Zachary Sanborn,9 Samuel H. Berman,1
Rameen Beroukhim,4,5 Brady Bernard,10 Chang-Jiun Wu,11 Giannicola Genovese,11 Ilya Shmulevich,10
Jill Barnholtz-Sloan,12 Lihua Zou,4 Rahulsimham Vegesna,3 Sachet A. Shukla,5 Giovanni Ciriello,13 W.K. Yung,14
Wei Zhang,15 Carrie Sougnez,4 Tom Mikkelsen,16 Kenneth Aldape,15 Darell D. Bigner,17 Erwin G. Van Meir,18
Michael Prados,19 Andrew Sloan,20 Keith L. Black,21 Jennifer Eschbacher,22 Gaetano Finocchiaro,23 William Friedman,24
David W. Andrews,25 Abhijit Guha,26 Mary Iacocca,27 Brian P. O’Neill,28 Greg Foltz,29 Jerome Myers,30
Daniel J. Weisenberger,7 Robert Penny,31 Raju Kucherlapati,32 Charles M. Perou,33 D. Neil Hayes,33 Richard Gibbs,34
Marco Marra,35 Gordon B. Mills,36 Eric Lander,4 Paul Spellman,37 Richard Wilson,38 Chris Sander,13 John Weinstein,3
Matthew Meyerson,4,5 Stacey Gabriel,4 Peter W. Laird,7 David Haussler,9,39 Gad Getz,4 Lynda Chin,4,11,* and TCGAResearch Network1Human Oncology and Pathogenesis Program, Brain Tumor Center, Memorial Sloan-Kettering Cancer Center, New York, NY 10065, USA2Department of Neurosurgery, Memorial Sloan-Kettering Cancer Center, Department of Neurological Surgery, Weill Cornell Medical Center,
New York, NY 10065, USA3Department of Bioinformatics and Computational Biology, The University of Texas MD Anderson Cancer Center, Houston, TX 77030, USA4Cancer Program, The Broad Institute of Harvard and MIT, Cambridge, MA 02142, USA5Department of Medical Oncology, Dana-Farber Cancer Institute, Boston, MA 02115, USA6Division of Experimental Neurosurgery, Department of Neurosurgery, Heidelberg University Hospital, 69120 Heidelberg, Germany7University of SouthernCalifornia EpigenomeCenter, University of SouthernCalifornia, KeckSchool ofMedicine, LosAngeles, CA90033,USA8Department of Genetics, Center for Integrative System Biology, Faculty of Medicine at Ribeirao Preto, University of Sao Paulo,14049-900 Ribeirao Preto, Sao Paulo, Brazil9Department of Biomolecular Engineering and Center for Biomolecular Science and Engineering, University of California Santa Cruz,
Santa Cruz, CA 95064, USA10Institute for Systems Biology, Seattle, WA 98109, USA11Department of Genomic Medicine, The University of Texas MD Anderson Cancer Center, Houston, TX 77030, USA12Case Comprehensive Cancer Center, Case Western Reserve University School of Medicine, Cleveland, OH 44106, USA13Computational Biology Center, Memorial Sloan-Kettering Cancer Center, New York, NY 10065, USA14Department of Neuro-Oncology, The University of Texas MD Anderson Cancer Center, Houston, TX 77030, USA15Department of Pathology, The University of Texas MD Anderson Cancer Center, Houston, TX 77030, USA16Departments of Neurology and Neurosurgery, Henry Ford Hospital Detroit, MI 48202, USA17Department of Pathology, Duke University Medical Center, Durham, NC 27710, USA18Departments of Neurosurgery and Hematology andMedical Oncology,Winship Cancer Institute and School of Medicine, Emory University,
Atlanta, GA 30322, USA19Department of Neurosurgery, University of California, San Francisco, San Francisco, CA 94143, USA20Department of Neurosurgery, University Hospitals-Case Medical Center, Seidman Cancer Center, Cleveland, OH 44106, USA21Department of Neurosurgery, Cedars-Sinai Medical Center, Los Angeles, CA 90048, USA22Department of Pathology, St. Joseph’s Hospital and Medical Center, Phoenix, AZ 85013, USA23Istituto Neurologico Besta, Department of Neuro-Oncology, 20133 Milano, Italy24Department of Neurosurgery, University of Florida, Gainesville, FL 32610, USA25Department of Neurological Surgery, Thomas Jefferson University, Philadelphia, PA 19107, USA26Department of Neurosurgery, Toronto Western Hospital, Toronto, ON M5T 2S8, Canada27Department of Pathology, Christiana Care, Helen F. Graham Cancer Center, Newark, DE 19713, USA28Department of Neurology, Mayo Clinic and Mayo Clinic Cancer Center, Rochester, MN 55905, USA29Ivy Brain Tumor Center, Swedish Neuroscience Institute, Seattle, WA 98122, USA30Department of Pathology, Penrose-St. Francis Health Services, Colorado Springs, CO 80907, USA31International Genomics Consortium, Phoenix, AZ 85004, USA32Brigham and Women’s Hospital and Harvard Medical School, Boston, MA 02215, USA33Department of Genetics, University of North Carolina at Chapel Hill, Chapel Hill, NC 27599, USA34Human Genome Sequencing Center, Baylor College of Medicine, Houston, TX 77030, USA35Canada’s Michael Smith Genome Sciences Centre, BC Cancer Agency, Vancouver, BC V5Z 4S6, Canada36Department of Systems Biology, The University of Texas MD Anderson Cancer Center, Houston, TX 77030, USA37Oregon Health and Science University, Department of Molecular and Medical Genetics, Portland, OR 97239, USA38The Genome Institute, Washington University, St Louis, MO 63110, USA39Howard Hughes Medical Institute, University of California at Santa Cruz, Santa Cruz, CA 95064, USA40The authors contributed equally to this work
*Correspondence: [email protected] (C.W.B.), [email protected] (L.C.)
http://dx.doi.org/10.1016/j.cell.2013.09.034
462 Cell 155, 462–477, October 10, 2013 ª2013 Elsevier Inc.
SUMMARY tion sequencing technology (TCGA, 2011, 2012a, 2012b,
2012c). Here, we report the efforts of the TCGA GBM Analysis
We describe the landscape of somatic genomicalterations based on multidimensional and compre-hensive characterization of more than 500 glio-blastoma tumors (GBMs). We identify several novelmutated genes as well as complex rearrangementsof signature receptors, includingEGFR andPDGFRA.TERTpromotermutations are shown tocorrelatewithelevated mRNA expression, supporting a role in telo-merase reactivation. Correlative analyses confirmthat the survival advantage of the proneural subtypeis conferred by the G-CIMP phenotype, and MGMTDNA methylation may be a predictive biomarker fortreatment response only in classical subtype GBM.Integrative analysis of genomic and proteomic pro-files challenges the notion of therapeutic inhibitionof a pathway as an alternative to inhibition of thetarget itself. These data will facilitate the discoveryof therapeutic and diagnostic target candidates, thevalidation of research and clinical observations andthe generation of unanticipated hypotheses that canadvance our molecular understanding of this lethalcancer.
INTRODUCTION
Glioblastoma (GBM) was the first cancer type to be systemati-
cally studied by The Cancer Genome Atlas Research Network
(TCGA). The initial publication (TCGA, 2008) presented the re-
sults of genomic and transcriptomic analysis of 206 GBMs,
including mutation sequencing of 600 genes in 91 of the sam-
ples. The observations provided a proof-of-concept demonstra-
tion that systematic genomic analyses in a statistically powered
cohort can define core biological pathways, substantiate anec-
dotal observations, and generate unanticipated insights.
The initial publication reported biologically relevant alterations
in three core pathways, namely p53, Rb, and receptor tyrosine
kinase (RTK)/Ras/phosphoinositide 3-kinase (PI3K) signaling
(TCGA, 2008). Efforts to link the alterations found in these path-
ways to the distinct molecular and epigenetic subtypes of glio-
blastoma revealed that coordinated combinationswere enriched
in different molecular subtypes, which may affect clinical
outcome and the sensitivity of individual tumors to therapy
(Noushmehr et al., 2010; Verhaak et al., 2010).
Above and beyond these observations, it has become evident
that GBM growth is driven by a signaling network with functional
redundancy that permits adaptation in response to targeted mo-
lecular treatments. Thus, a comprehensive catalog of molecular
alterations in GBM, based on multidimensional high-resolution
data sets, will be a critical resource for future investigative efforts
to understand its pathogenesis mechanisms, inform tumor
biology and ultimately develop effective therapies against this
deadly cancer.
Toward those ends, TCGA has expanded the scope and depth
of molecular data on GBM, including adoption of next-genera-
Working Group (AWG) to further our understanding of GBM
pathobiology by constructing a detailed somatic landscape of
GBM through a series of comprehensive genomic, epigenomic,
transcriptomic, and proteomic analysis.
RESULTS
Samples and Clinical DataAs summarized in Table 1, the data set contains molecular and
clinical data for a total of 543 patients. Note that different subsets
of patients were assayed on each technology platform. Themost
significant additions to the GBM data set include sequencing of
GBM whole-genomes, coding exomes, transcriptomes, as well
as profiling of expanded DNAmethylomes and a targeted prote-
ome. In particular, 291 pairs of germline-tumor native DNAs (e.g.,
without whole-genome amplification) were characterized by
hybrid-capture whole-exome sequencing (WES) and of these,
42 pairs underwent deep coverage whole-genome sequencing
(WGS). The transcriptomes of 164 RNA samples were profiled
by RNA-sequencing (RNA-seq). Protein expression profiles
were generated from 214 patient samples using reverse
phase protein arrays (RPPA). The data package associated
with this report was frozen on July 15, 2013 and is avail-
able at the Data Portal (https://tcga-data.nci.nih.gov/docs/
publications/gbm_2013/).
TCGA sample collection spanned 17 contributing sites (Table
S1). Tier 1 clinical data elements (including age, pathology, and
survival) are available on 539 of 543 patients (99.6%) and tier 2
data including treatment information on 525 patients (96.7%)
(Figure S1, available online, see Data Portal). Clinical character-
istics of this patient cohort are similar to our previous report in
2008 (TCGA, 2008) with a median age of 59.6 years and a male
to female ratio of 1.6 (333:209). Median overall survival was
13.9 months with 2 year survival of 22.5% and 5 year survival
of 5.3%. Due to TCGA selection of primary GBM, IDH1mutation
is infrequent in the TCGA cohort compared to other published
series. Of the 423 patients with adequate sequencing coverage
(by either whole-exome next-generation sequencing or previ-
ously reported Sanger-based sequencing), 28 (6%) had the
IDH1-R132H mutation, whereas one individual had an R132G
and one had anR132Cmutation. No IDH2mutations were found.
The associated G-CIMP methylation pattern was present in all
cases of IDH1 mutation (R132H/G/C), whereas seven G-CIMP
cases lacked IDH1mutations. Overall, G-CIMP pattern was pre-
sent in 42 out of 532 cases (7.9%). Clinically relevantMGMTDNA
methylation status was estimated from CpG islands as previ-
ously described (Bady et al., 2012). Conventional positive prog-
nostic factors were confirmed by univariate analysis: age < 50
(OS 21.9 versus 12.3 months, p = 2.4 3 10�11), MGMT DNA
methylation (16.9 versus 12.7, p = 0.0018), IDH1 mutation (35.4
versus 13.3, p = 1.55 3 10�5) and G-CIMP DNA methylation
(38.3 versus 12.7, p = 8.3 3 10�9). Age, MGMT, and IDH1/
G-CIMP status were independently significant in multivariate
analysis (Table S1).
Patients in this TCGA cohort were diagnosed between 1989
and 2011, with 414 patients (76%) receiving their diagnosis in
Cell 155, 462–477, October 10, 2013 ª2013 Elsevier Inc. 463
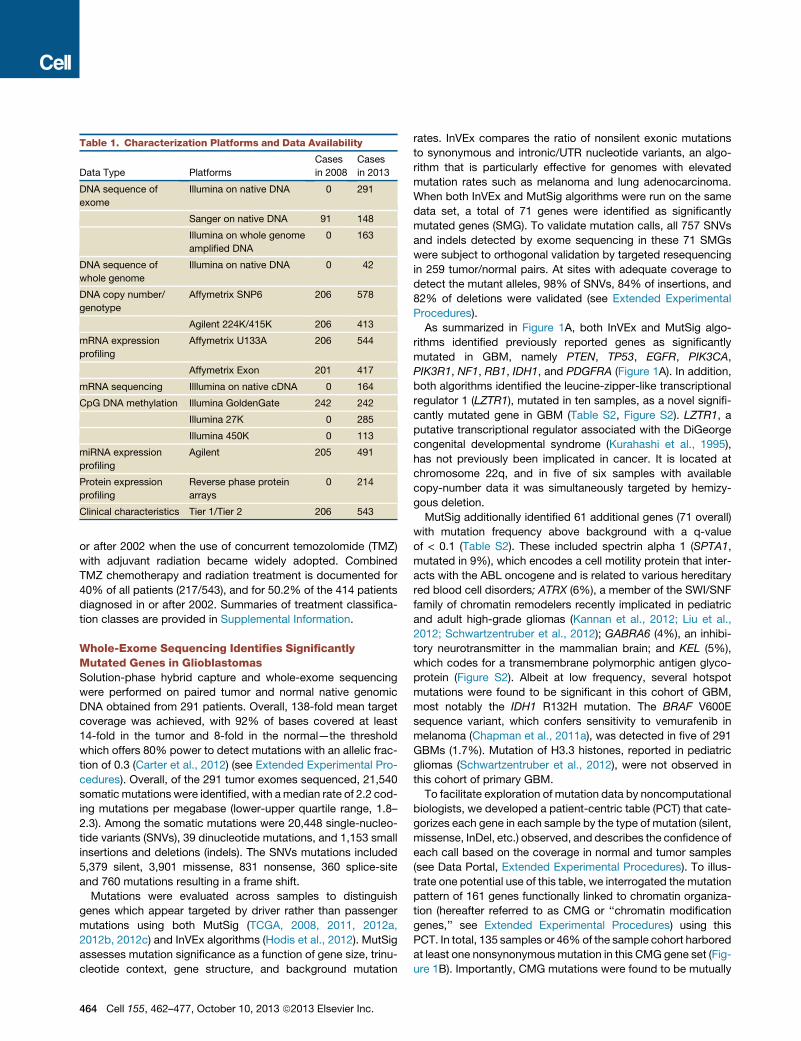
Table 1. Characterization Platforms and Data Availability
Data Type Platforms
Cases
in 2008
Cases
in 2013
DNA sequence of
exome
Illumina on native DNA 0 291
Sanger on native DNA 91 148
Illumina on whole genome
amplified DNA
0 163
DNA sequence of
whole genome
Illumina on native DNA 0 42
DNA copy number/
genotype
Affymetrix SNP6 206 578
Agilent 224K/415K 206 413
mRNA expression
profiling
Affymetrix U133A 206 544
Affymetrix Exon 201 417
mRNA sequencing Illlumina on native cDNA 0 164
CpG DNA methylation Illumina GoldenGate 242 242
Illumina 27K 0 285
Illumina 450K 0 113
miRNA expression
profiling
Agilent 205 491
Protein expression
profiling
Reverse phase protein
arrays
0 214
Clinical characteristics Tier 1/Tier 2 206 543
or after 2002 when the use of concurrent temozolomide (TMZ)
with adjuvant radiation became widely adopted. Combined
TMZ chemotherapy and radiation treatment is documented for
40% of all patients (217/543), and for 50.2% of the 414 patients
diagnosed in or after 2002. Summaries of treatment classifica-
tion classes are provided in Supplemental Information.
Whole-Exome Sequencing Identifies SignificantlyMutated Genes in GlioblastomasSolution-phase hybrid capture and whole-exome sequencing
were performed on paired tumor and normal native genomic
DNA obtained from 291 patients. Overall, 138-fold mean target
coverage was achieved, with 92% of bases covered at least
14-fold in the tumor and 8-fold in the normal—the threshold
which offers 80% power to detect mutations with an allelic frac-
tion of 0.3 (Carter et al., 2012) (see Extended Experimental Pro-
cedures). Overall, of the 291 tumor exomes sequenced, 21,540
somatic mutations were identified, with amedian rate of 2.2 cod-
ing mutations per megabase (lower-upper quartile range, 1.8–
2.3). Among the somatic mutations were 20,448 single-nucleo-
tide variants (SNVs), 39 dinucleotide mutations, and 1,153 small
insertions and deletions (indels). The SNVs mutations included
5,379 silent, 3,901 missense, 831 nonsense, 360 splice-site
and 760 mutations resulting in a frame shift.
Mutations were evaluated across samples to distinguish
genes which appear targeted by driver rather than passenger
mutations using both MutSig (TCGA, 2008, 2011, 2012a,
2012b, 2012c) and InVEx algorithms (Hodis et al., 2012). MutSig
assesses mutation significance as a function of gene size, trinu-
cleotide context, gene structure, and background mutation
464 Cell 155, 462–477, October 10, 2013 ª2013 Elsevier Inc.
rates. InVEx compares the ratio of nonsilent exonic mutations
to synonymous and intronic/UTR nucleotide variants, an algo-
rithm that is particularly effective for genomes with elevated
mutation rates such as melanoma and lung adenocarcinoma.
When both InVEx and MutSig algorithms were run on the same
data set, a total of 71 genes were identified as significantly
mutated genes (SMG). To validate mutation calls, all 757 SNVs
and indels detected by exome sequencing in these 71 SMGs
were subject to orthogonal validation by targeted resequencing
in 259 tumor/normal pairs. At sites with adequate coverage to
detect the mutant alleles, 98% of SNVs, 84% of insertions, and
82% of deletions were validated (see Extended Experimental
Procedures).
As summarized in Figure 1A, both InVEx and MutSig algo-
rithms identified previously reported genes as significantly
mutated in GBM, namely PTEN, TP53, EGFR, PIK3CA,
PIK3R1, NF1, RB1, IDH1, and PDGFRA (Figure 1A). In addition,
both algorithms identified the leucine-zipper-like transcriptional
regulator 1 (LZTR1), mutated in ten samples, as a novel signifi-
cantly mutated gene in GBM (Table S2, Figure S2). LZTR1, a
putative transcriptional regulator associated with the DiGeorge
congenital developmental syndrome (Kurahashi et al., 1995),
has not previously been implicated in cancer. It is located at
chromosome 22q, and in five of six samples with available
copy-number data it was simultaneously targeted by hemizy-
gous deletion.
MutSig additionally identified 61 additional genes (71 overall)
with mutation frequency above background with a q-value
of < 0.1 (Table S2). These included spectrin alpha 1 (SPTA1,
mutated in 9%), which encodes a cell motility protein that inter-
acts with the ABL oncogene and is related to various hereditary
red blood cell disorders; ATRX (6%), a member of the SWI/SNF
family of chromatin remodelers recently implicated in pediatric
and adult high-grade gliomas (Kannan et al., 2012; Liu et al.,
2012; Schwartzentruber et al., 2012); GABRA6 (4%), an inhibi-
tory neurotransmitter in the mammalian brain; and KEL (5%),
which codes for a transmembrane polymorphic antigen glyco-
protein (Figure S2). Albeit at low frequency, several hotspot
mutations were found to be significant in this cohort of GBM,
most notably the IDH1 R132H mutation. The BRAF V600E
sequence variant, which confers sensitivity to vemurafenib in
melanoma (Chapman et al., 2011a), was detected in five of 291
GBMs (1.7%). Mutation of H3.3 histones, reported in pediatric
gliomas (Schwartzentruber et al., 2012), were not observed in
this cohort of primary GBM.
To facilitate exploration of mutation data by noncomputational
biologists, we developed a patient-centric table (PCT) that cate-
gorizes each gene in each sample by the type of mutation (silent,
missense, InDel, etc.) observed, and describes the confidence of
each call based on the coverage in normal and tumor samples
(see Data Portal, Extended Experimental Procedures). To illus-
trate one potential use of this table, we interrogated the mutation
pattern of 161 genes functionally linked to chromatin organiza-
tion (hereafter referred to as CMG or ‘‘chromatin modification
genes,’’ see Extended Experimental Procedures) using this
PCT. In total, 135 samples or 46%of the sample cohort harbored
at least one nonsynonymousmutation in this CMG gene set (Fig-
ure 1B). Importantly, CMG mutations were found to be mutually
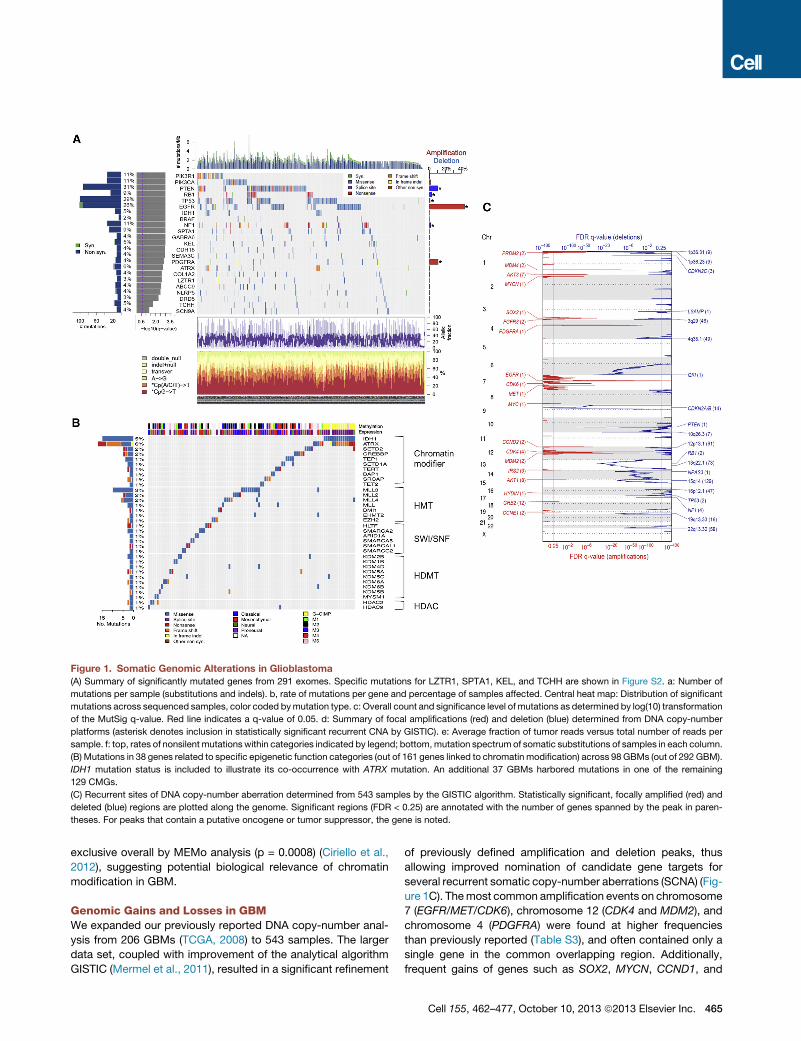
Figure 1. Somatic Genomic Alterations in Glioblastoma
(A) Summary of significantly mutated genes from 291 exomes. Specific mutations for LZTR1, SPTA1, KEL, and TCHH are shown in Figure S2. a: Number of
mutations per sample (substitutions and indels). b, rate of mutations per gene and percentage of samples affected. Central heat map: Distribution of significant
mutations across sequenced samples, color coded bymutation type. c: Overall count and significance level of mutations as determined by log(10) transformation
of the MutSig q-value. Red line indicates a q-value of 0.05. d: Summary of focal amplifications (red) and deletion (blue) determined from DNA copy-number
platforms (asterisk denotes inclusion in statistically significant recurrent CNA by GISTIC). e: Average fraction of tumor reads versus total number of reads per
sample. f: top, rates of nonsilent mutationswithin categories indicated by legend; bottom,mutation spectrum of somatic substitutions of samples in each column.
(B) Mutations in 38 genes related to specific epigenetic function categories (out of 161 genes linked to chromatin modification) across 98 GBMs (out of 292 GBM).
IDH1 mutation status is included to illustrate its co-occurrence with ATRX mutation. An additional 37 GBMs harbored mutations in one of the remaining
129 CMGs.
(C) Recurrent sites of DNA copy-number aberration determined from 543 samples by the GISTIC algorithm. Statistically significant, focally amplified (red) and
deleted (blue) regions are plotted along the genome. Significant regions (FDR < 0.25) are annotated with the number of genes spanned by the peak in paren-
theses. For peaks that contain a putative oncogene or tumor suppressor, the gene is noted.
exclusive overall by MEMo analysis (p = 0.0008) (Ciriello et al.,
2012), suggesting potential biological relevance of chromatin
modification in GBM.
Genomic Gains and Losses in GBMWe expanded our previously reported DNA copy-number anal-
ysis from 206 GBMs (TCGA, 2008) to 543 samples. The larger
data set, coupled with improvement of the analytical algorithm
GISTIC (Mermel et al., 2011), resulted in a significant refinement
of previously defined amplification and deletion peaks, thus
allowing improved nomination of candidate gene targets for
several recurrent somatic copy-number aberrations (SCNA) (Fig-
ure 1C). Themost common amplification events on chromosome
7 (EGFR/MET/CDK6), chromosome 12 (CDK4 and MDM2), and
chromosome 4 (PDGFRA) were found at higher frequencies
than previously reported (Table S3), and often contained only a
single gene in the common overlapping region. Additionally,
frequent gains of genes such as SOX2, MYCN, CCND1, and
Cell 155, 462–477, October 10, 2013 ª2013 Elsevier Inc. 465
CCNE2 were precisely established. Except for the highly recur-
rent homozygous deletions in CDKN2A/B, all statistically signif-
icant DNA losses were hemizygous. Losses were more frequent
than amplifications, as has been reported as a general pattern in
cancer (Beroukhim et al., 2010). We were able to pinpoint single
genes as deletion targets in some cases, most notably in recur-
rent deletion of 6q26. Although the 6q26 deletion has previously
been associatedwith other candidates such asPARK2, our anal-
ysis unequivocally defined QKI as the sole gene within the mini-
mal common region and the target of homozygous deletion in
nine cases. TheQKI gene was also mutated in five cases without
evidence of deletion (two frame-shift, two missense, and one
splice-site mutation). This is consistent with a recent publication
demonstrating thatQKI functions as a tumor suppressor in GBM
by acting as a p53-responsive regulator of mature miR-20a sta-
bility to regulate TGFbR2 expression and TGFb network
signaling (Chen et al., 2012). Other single gene deletion targets
include LRP1B, NPAS3, LSAMP, and SMYD3. Similar to the
mutation data, we have also algorithmically generated a pa-
tient-centric table summarizing DNA copy-number aberration
and DNA methylation status for each gene and miRNA for each
of the cases in the cohort (see Data Portal).
Recurrent Structural Rearrangements Defined byGenomic and Transcriptomic SequencingTo explore genomic and transcriptomal structural rearrange-
ments, we performed whole-genome paired-end sequencing
with deep coverage on 42 pairs of tumor and matched germline
DNA samples as well as RNA sequencing (RNA-seq) of 164
GBM transcriptomes (Table S4). We detected genomic rear-
rangements using BreakDancer and BamBam (Sanborn et al.,
2013) (see Extended Experimental Procedures), in addition to
expressed RNA fusions using PRADA (http://sourceforge.net/
projects/prada/). In total, we identified 238 high-confidence
candidate somatic rearrangements, including 49 interchromo-
somal, 125 intrachromosomal, and 64 intragenic structural
variants (Figures 2A and 2B; Table S4). The number of events
per sample ranged from 0 to 32 (median: 2), with one sample
containing a distinctively high number of rearrangements in
the context of local chromothripsis involving a 7.5 Mb region
on chromosome 1. No rearrangements were detected in eight
samples. Overall, the number of rearrangements generally
appeared lower than what has been previously reported for
prostate cancer (Sanborn et al., 2013), lung adenocarcinoma
(Imielinski et al., 2012), and melanoma (Berger et al., 2012).
Recurrent intragenic events were detected in seven genes:
EGFR (n = 12), CPM (n = 3), PRIM2 (n = 3), FAM65B (n = 2),
PPM1H (n = 2), RBM25 (n = 2), and HOMER2 (n = 2). Because
unbalanced structural rearrangements in DNA can be detected
as breakpoints in DNA copy-number profiles, we investigated
whether CNA breakpoints could indicate potential sites of
recurrent structural rearrangement using all 492 samples with
aCGH data (n = 492). Of note, 41 of 129 high-confidence
rearrangement events from whole-genome sequencing (WGS)
involved genes identified as significant targets of recurrent
intragenic copy-number breakpoints (iCNA) in the larger
cohort of GBM based on DNA copy-number profiles (Table
S4, Data Portal).
466 Cell 155, 462–477, October 10, 2013 ª2013 Elsevier Inc.
RNA seq analysis identified 48 interchromosomal and 180 in-
trachromosomal mRNA fusion transcripts in 106 of 164 samples
(Figure 2C; Table S4). Approximately 37%of thesewere in-frame
transcripts, 35% were out-of-frame, and the remaining 29%
were involved a 30 or 50 untranslated region (Figure S3A). A sub-
stantial portion (44%) of the intrachromosomal events resulted
from recombination of genomic loci located less than 1Mb apart.
A notable example is the recently reported oncogenic FGFR3-
TACC3 inversion (Singh et al., 2012), which was detected in
two cases. Interestingly, the FGFR3/TACC3 locus was focally
amplified in both samples, suggesting that CNA could serve as
a marker of FGFR3-TACC3 rearrangement. Overall, focal ampli-
fications involving FGFR3 or TACC3 were detected in 14 of 537
GBM copy-number profiles (2.6%).
Ten of the 42 GBMs with WGS analyses demonstrated rear-
rangements between EGFR and adjacent genes such as BRIP
(n =2) andVOPP1 (n = 2), or structural variants of genes surround-
ing the EGFR locus, such as LANCL2 and PLEXHA (n = 2) (Table
S4). Both types of 7p11 rearrangements were detected in six
samples. This pattern was confirmed in the RNA-seq data
where eighteen samples of 164 samples showed evidence of
transcribed fusion transcripts, such as EGFR-SEPT14 (n = 6),
SEC61G-EGFR (n = 4), LANCL2-SEPT14 (n = 1), and COBL-
SEPT14 (n = 1) (Table S4). These fusions tended to be part of a
focal gain, suggesting a complex rearrangement (Figure S3B).
Genomic rearrangements pertaining to chromosome arm 12q
were identified in 11 of 42 whole genomes and 12q-associated
fusion transcripts were found expressed in 25 of 164 transcrip-
tomes. A variety of different genomic and transcriptomic variants
were found on 12q though none were recurrent (Table S4). The
majority of 12q lesions occurred in tandem, i.e., as adjacent
events in the same GBM. As an illustration, a single sample
showed a pattern in which 15 nonadjacent segments (14 from
chromosome 12 and one fragment from chromosome 7) were
highly amplified (>40 copies) with eight 12q rearrangement
events, including the MDM2, CDK4, and EGFR oncogenes (Fig-
ure S3C). WGS analysis reconstructed two independent circular
paths that accounted for all of the amplified segments (Fig-
ure S3C). Each circle contained at least one oncogene, with
one circle (0152-DM-A) containing one copy of CDK4 and two
copies of MDM2 and the other circle (0152-DM-B) containing
one copy of EGFR. These reconstructed circles are most consis-
tent with extrachromosomal double minute chromosomes (Kut-
tler and Mai, 2007). Recently, the same data set was used to
identify enrichment of genomic breakpoints relating to chromo-
some 12q14-15, a locus harboring the MDM2 and CDK4 onco-
genes, associated with less favorable outcome (Zheng et al.,
2013), and the reconstruction of doubleminutes confirmed using
orthogonal methods (Sanborn et al., 2013).
EGFR Is Frequently Targeted by Multiple Alterations ofDNA and RNAAs anticipated, EGFR was among the most frequently mutated
genes and RNA-seq detected a diversity of altered transcripts
(Figure 3A). EGFR mutations were accompanied by regional
DNA amplification in the majority of cases, leading to a wide
range of mutation allelic frequencies. Comparing the allelic fre-
quencies of point mutations in DNA- and RNA-seq data revealed
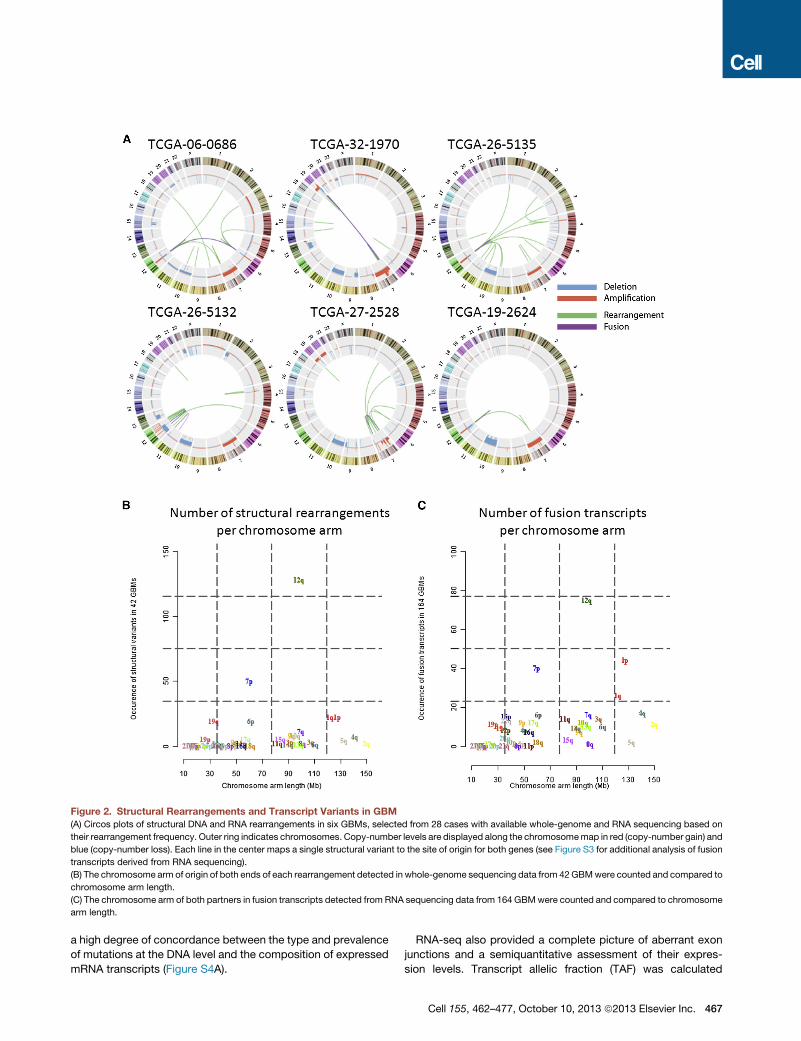
Figure 2. Structural Rearrangements and Transcript Variants in GBM
(A) Circos plots of structural DNA and RNA rearrangements in six GBMs, selected from 28 cases with available whole-genome and RNA sequencing based on
their rearrangement frequency. Outer ring indicates chromosomes. Copy-number levels are displayed along the chromosomemap in red (copy-number gain) and
blue (copy-number loss). Each line in the center maps a single structural variant to the site of origin for both genes (see Figure S3 for additional analysis of fusion
transcripts derived from RNA sequencing).
(B) The chromosome arm of origin of both ends of each rearrangement detected in whole-genome sequencing data from 42GBMwere counted and compared to
chromosome arm length.
(C) The chromosome arm of both partners in fusion transcripts detected from RNA sequencing data from 164 GBMwere counted and compared to chromosome
arm length.
a high degree of concordance between the type and prevalence
of mutations at the DNA level and the composition of expressed
mRNA transcripts (Figure S4A).
RNA-seq also provided a complete picture of aberrant exon
junctions and a semiquantitative assessment of their expres-
sion levels. Transcript allelic fraction (TAF) was calculated
Cell 155, 462–477, October 10, 2013 ª2013 Elsevier Inc. 467
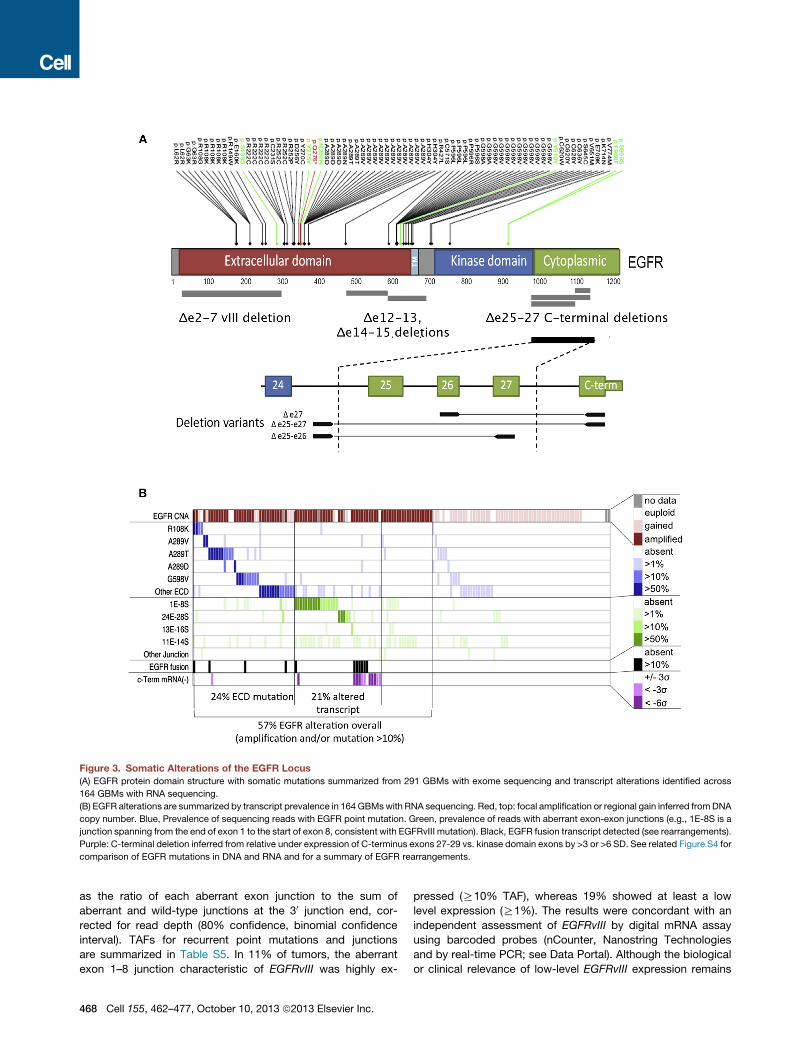
Figure 3. Somatic Alterations of the EGFR Locus
(A) EGFR protein domain structure with somatic mutations summarized from 291 GBMs with exome sequencing and transcript alterations identified across
164 GBMs with RNA sequencing.
(B) EGFR alterations are summarized by transcript prevalence in 164 GBMswith RNA sequencing. Red, top: focal amplification or regional gain inferred fromDNA
copy number. Blue, Prevalence of sequencing reads with EGFR point mutation. Green, prevalence of reads with aberrant exon-exon junctions (e.g., 1E-8S is a
junction spanning from the end of exon 1 to the start of exon 8, consistent with EGFRvIII mutation). Black, EGFR fusion transcript detected (see rearrangements).
Purple: C-terminal deletion inferred from relative under expression of C-terminus exons 27-29 vs. kinase domain exons by >3 or >6 SD. See related Figure S4 for
comparison of EGFR mutations in DNA and RNA and for a summary of EGFR rearrangements.
as the ratio of each aberrant exon junction to the sum of
aberrant and wild-type junctions at the 30 junction end, cor-
rected for read depth (80% confidence, binomial confidence
interval). TAFs for recurrent point mutations and junctions
are summarized in Table S5. In 11% of tumors, the aberrant
exon 1–8 junction characteristic of EGFRvIII was highly ex-
468 Cell 155, 462–477, October 10, 2013 ª2013 Elsevier Inc.
pressed (R10% TAF), whereas 19% showed at least a low
level expression (R1%). The results were concordant with an
independent assessment of EGFRvIII by digital mRNA assay
using barcoded probes (nCounter, Nanostring Technologies
and by real-time PCR; see Data Portal). Although the biological
or clinical relevance of low-level EGFRvIII expression remains
to be demonstrated, EGFRvIII expression in a minor population
of GBM cells has been shown to confer a more aggressive tu-
mor phenotype through paracrine mechanisms (Inda et al.,
2010).
A variety of other recurrent noncanonical EGFR transcript
forms were detected in the RNA-seq data (Figures 3A and
S4B). Three different C-terminal rearrangements targeting the
cytoplasmic domain of the EGFR were detected at R 10%
TAF in 3.7% of cases and atR 1% TAF in another 9%. Compar-
ison with WGS data confirmed the presence of C-terminal
deletions in nine cases where sequence data were available.
C-terminal deletion variants have previously been associated
with gliomagenesis in experimental rodent systems in vivo
(Cho et al., 2011). The prevalence of EGFR C-terminal deletion
reported here is likely an underestimate since complete loss of
the C terminus may yield aberrant terminal junctions not mappa-
ble by transcriptome sequencing. Relative underexpression of C
terminus exons 27–29 (<3 SD) was readily apparent in another
7.3% of cases without detectable aberrant junctions (Figure 3B).
We identified two relatively uncharacterized recurrent EGFR
variants, namely deletions of exons 12–13 (D12–13) in 28.7%
and exons 14–15 (D14–15) in 3%. EGFR D12–13 has been previ-
ously identified by RT-PCR analysis of glioma (Callaghan et al.,
1993). Both D12–13 and D14–15 appear to be expressed in
minor allelic fractions (<10%), raising the question of whether
they result from splicing aberration or genomic deletion. Among
tumors expressing D12–13mRNA, analysis of aberrant junctions
in WGS data (BamBam) failed to identify concordant DNA dele-
tion in 14/15 cases where data were available. One case showed
a concordant breakpoint as a minor component of a highly rear-
ranged locus. By comparison, EGFRvIII-expressing tumors had
concordant deletion spanning exons 2–7 in all seven cases
where WGS data were available (Table S5).
In total, 38.4%of cases harboredanEGFRgenomic rearrange-
ment or a point mutation expressed in at least 10% of transcripts
(Figure 3B; Table S5). Overall, 57% of GBM showed evidence of
mutation, rearrangement, alteredsplicing, and/or focal amplifica-
tion of EGFR. Whereas PDGFRA showed no recurrent gene
fusions, intragenic deletion of exons 8 and 9 (PDGFRA D8,9)
was highly expressed (R10% TAF) in 1 of the 164 samples with
RNA sequencing data. Low-level expression of PDGFRA D8,9
was far more prevalent in the RNA-seq data (n = 29 of 163) and
could represent a splice variant. This result is concordant with
previously reported estimates of D8,9 expression (Ozawa et al.,
2010). A novel PDGFRA variant with deletion of exons 2–7 was
found highly expressed in a single case (TCGA-28-5216).
The Landscape of Somatic Alterations in GlioblastomaThe addition of whole-exome and transcriptomal sequencing
data have extended the palette of somatic alterations affecting
major cancer pathways in GBM. Figure 4 presents a landscape
view of the canonical signal transduction and tumor suppressor
pathways in GBM based on whole-exome sequencing data of
291 patients. Unsupervised analysis of 251 GBMs with both
copy number and WES mutation data identified genes sets
(modules) in which somatic alterations were significantly
mutually exclusive (MEMo; Ciriello et al., 2012). This analysis
confirmed mutual exclusivity among alterations affecting the
p53 pathway (MDM2, MDM4, and TP53), the Rb pathway
(CDK4,CDK6,CCND2,CDKN2A/B, and RB1), and various com-
ponents influencing the PI3K pathway (PIK3CA, PIK3R1, PTEN,
EGFR, PDGFRA, and NF1) (Table S6).
As shown, at least one RTK was found altered in 67.3% of
GBM overall: EGFR (57.4%), PDGFRA (13.1%), MET (1.6%),
and FGFR2/3 (3.2%). Nearly half of the tumors with focal ampli-
fication and/or mutation of PDGFRA harbored concurrent EGFR
alterations (42.4%, 14/33), as did the majority of MET-altered
tumors (3/4), reflecting a pattern of intratumoral heterogeneity
that has been previously documented by in situ hybridization
(Snuderl et al., 2011; Szerlip et al., 2012).
PI3-kinase mutations were found in 25.1% of GBM (63/251),
with 18.3% affecting p110alpha and/or p85alpha subunits and
6.8% in other PI3K family genes. PI3K mutations were mutually
exclusive of PTEN mutations/deletions (p = 0.0047, Fisher’s
exact), with 59.4% of GBM showing one or the other (149/251).
Considering theRTKgenes, PI3-kinase genes, andPTEN, 89.6%
of GBM had at least one alteration in the PI3K pathway and
39% had two or more. The NF1 gene was deleted or mutated in
10%of cases, and never co-occurredwithBRAFmutations (2%).
Concordant with the previous TCGA GBM report, the p53
pathway was found to be dysregulated in 85.3% of tumors
(214/251), throughmutation/deletion of TP53 (27.9%), amplifica-
tion of MDM1/2/4 (15.1%), and/or deletion of CDKN2A (57.8%).
As expected, TP53 alterations were mutually exclusive with
amplification of MDM family genes (p = 0.0003) and CDKN2A
(p = 1.99 3 10�7). Concurrently, 78.9% of tumors had one
or more alteration affecting Rb function: 7.6% by direct RB1
mutation/deletion, 15.5% by amplification of CDK4/6, and the
remainder via CDKN2A deletion.
As reported for lower grade gliomas (Ichimura et al., 2009), 12
of the 13 GBMs with IDH1 hotspot mutations harbored concur-
rent TP53 mutations. Consistent with recent reports, mutations
in SWI/SNF complex gene ATRX often co-occurred in these
cases (Figure 4B). Mutations in IDH1 and ATRX appear to be
more prevalent in GBM samples without RTK alteration (p = 7.2
3 10�5 and 7.33 10�4, respectively), tumors genotypically more
consistent with secondary GBM (Ohgaki and Kleihues, 2007).
Telomerase reverse transcriptase (TERT) promoter mutations
were recently reported in glioma, mapping to positions 124
(C228T) and 146 bp (C250T) upstream of the TERT ATG start
site (Killela et al., 2013). Of the 42 cases with deep coverage
WGS data, 25 samples had adequate coverage (read count >
10) of the TERT promoter for mutational analysis. We detected
the C228T mutation in 15 of the 25 cases, whereas the C250T
variant was found in another six cases (Figure 4C). TERT pro-
moter mutations at these two hot spots were correlated with
upregulated TERT expression at the RNA level (Figure 4C). Inter-
estingly, the four GBMs with nonmutated TERT promoters all
harbored ATRX mutations and these were concurrent with
IDH1 and TP53 mutations as recently described (Liu et al.,
2012). Finally, in line with the role of ATRX in alternative length-
ening of telomeres (ALT) (Lovejoy et al., 2012), ATRX mutant
GBM tumors do not exhibit elevated TERT RNA expression
compared to tumors with TERT promoter mutations (Figure 4C).
Taken together, these data suggest that maintenance of
the telomere either through reactivation of telomerase by TERT
Cell 155, 462–477, October 10, 2013 ª2013 Elsevier Inc. 469
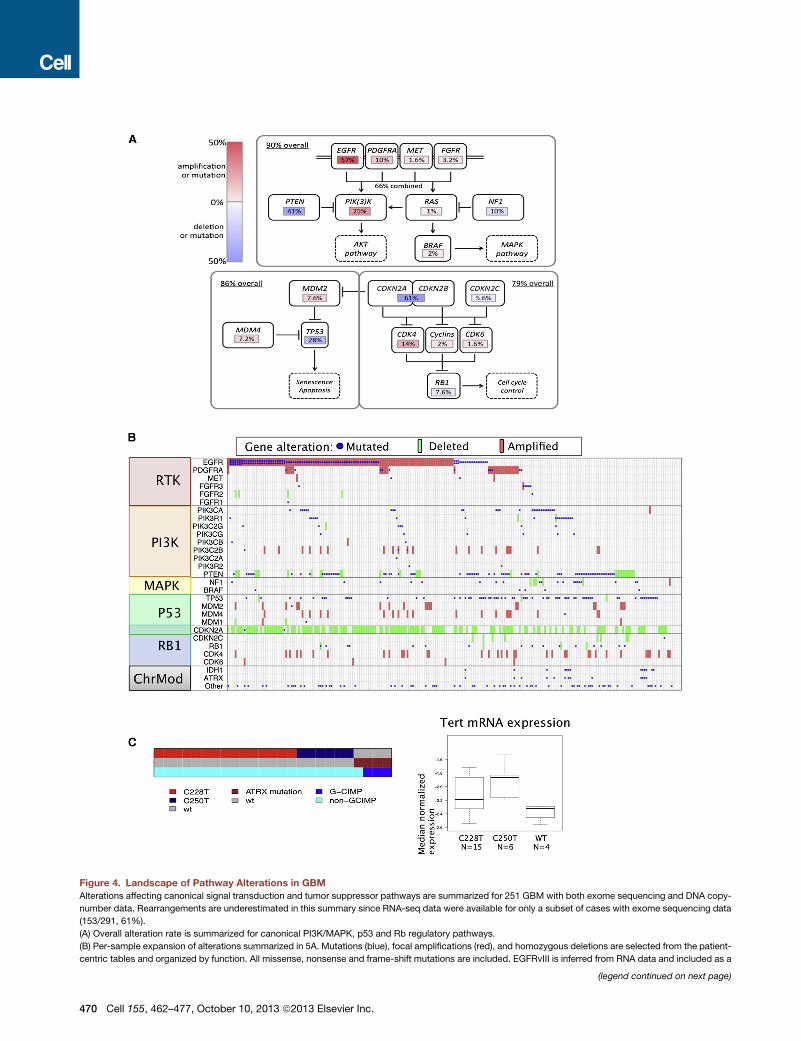
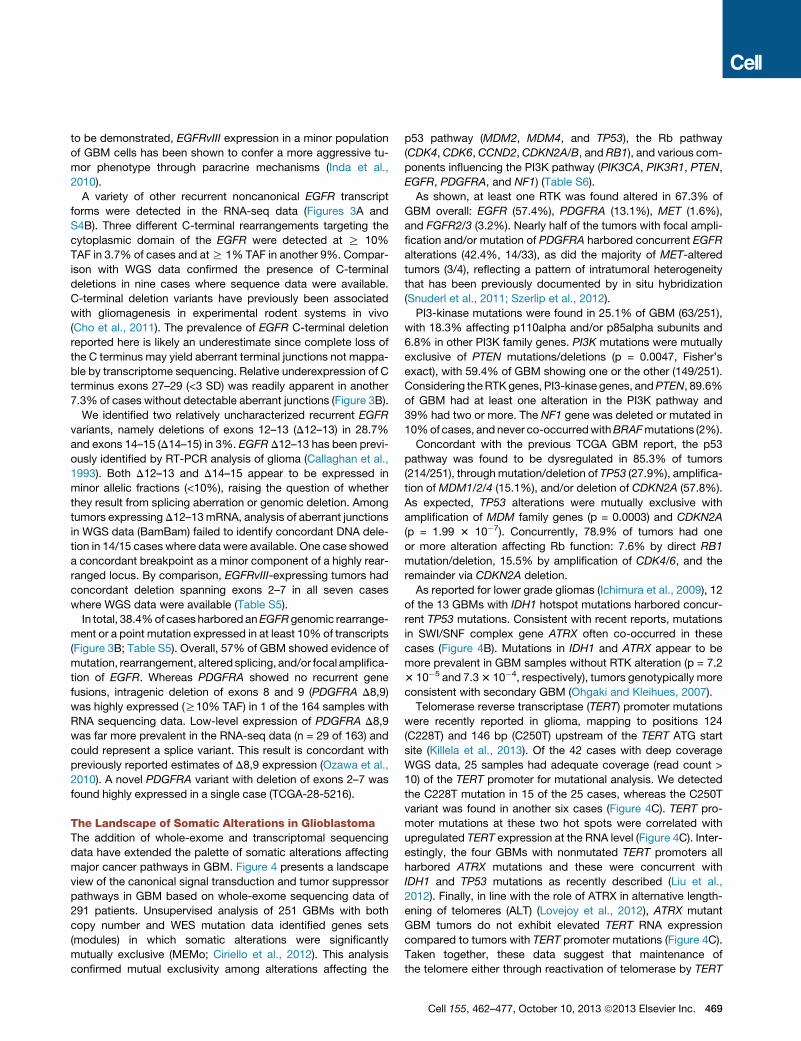
Figure 4. Landscape of Pathway Alterations in GBM
Alterations affecting canonical signal transduction and tumor suppressor pathways are summarized for 251 GBM with both exome sequencing and DNA copy-
number data. Rearrangements are underestimated in this summary since RNA-seq data were available for only a subset of cases with exome sequencing data
(153/291, 61%).
(A) Overall alteration rate is summarized for canonical PI3K/MAPK, p53 and Rb regulatory pathways.
(B) Per-sample expansion of alterations summarized in 5A. Mutations (blue), focal amplifications (red), and homozygous deletions are selected from the patient-
centric tables and organized by function. All missense, nonsense and frame-shift mutations are included. EGFRvIII is inferred from RNA data and included as a
(legend continued on next page)
470 Cell 155, 462–477, October 10, 2013 ª2013 Elsevier Inc.
promoter mutation-induced increased TERT expression or
ALT as a result of ATRX mutation is a requisite step in GBM
pathogenesis.
Although reported median survival for patients with GBM
ranges from 12–18 months, a subset of individuals will survive
for more than 3 years (Dolecek et al., 2012; Dunn et al., 2012).
We cross-referenced our data set to identify any factor(s) asso-
ciated with long-term survival (n = 39 or 7.7% of the cohort).
Although no specific genomic alteration was significantly over-
represented in this subset, amplifications of CDK4 and EGFR
and deletion of CDKN2A were observed at decreased fre-
quencies in these long survivors (see Data Portal). Age at
diagnosis was found to be a major determinant, with 79% of
long-term survivors being diagnosed at younger than 50 years
of age. Despite their relatively favorable prognosis, only one third
of patients with G-CIMP+ GBM survived beyond 3 years, sug-
gesting that other factors yet to be identified are contributing
to overall long-term survival of GBM patients.
Molecular Subclasses Defined by Global mRNAExpression and DNA MethylationWidespreaddifferences in gene expression have previously been
reported in GBM, grouping TCGA tumors into proneural, neural,
classical, and mesenchymal transcriptomic subtypes (Phillips
et al., 2006; Verhaak et al., 2010). Samples not included in previ-
ously published analysis (n = 342)were classified into one of clas-
ses using single-sample gene set enrichment analysis (Figure 5A
and Table S7) Similarly, we sought to assign each case in the
TCGAcohort to one of theDNAmethylation subclasses. The pro-
moter DNA methylation array platforms used by TCGA have
evolved with increasing resolution from the Illumina GoldenGate
(n = 238), Infinium HumanMethylation27 (HM27, n = 283) and
Infinium HumanMethylation450 (HM450, n = 76) platforms (Fig-
ure S5A). We reanalyzed a total of 396 GBM samples, comprised
of 305 new GBM samples profiled on the HM27 (n = 192) and
HM450 (n = 113) platforms in addition to 91 cases profiled on
HM27 that were included previously (Noushmehr et al., 2010).
Hierarchical consensus clustering of the DNA methylation pro-
files stratified these 396 GBM cases into six classes, including
G-CIMP (Figures 5B, S5B and S5C, and Table S7). Cluster M1
(35/58, 60%) is enriched for mesenchymal GBMs while cluster
M3 (18/31, 58%) is enriched for classical subtype (Figure 5B,
red and blue, respectively). As expected, the G-CIMP cluster is
enriched for proneural subtype tumors.
To be able to perform more robust exploration of the relation-
ship of G-CIMP phenotype to other genomic alterations, we
incorporated the previously reported G-CIMP status (Noush-
mehr et al., 2010) on 175 additional GBM cases profiled on the
GoldenGate platform. A total of 534 GBM cases were used in
the following integrative analyses. The age of GBM diagnosis
was statistically different (41 year versus 56 year; p value =
0.008) between proneural G-CIMP (n = 28) and proneural non-
mutation if R10% transcribed allelic frequency. Deletions are defined by log2 r
Procedures). Amplifications are defined by log2 ratio > 2 or > 1 and focal.
(C) Left: for a cohort of 25 GBMs for which whole-genome sequencing allowed ge
exclusive fashion. All four TERT promoter wild-type GBM harbored ATRX mutati
associated with elevated expression. Box plots: bar denotes median, central bo
G-CIMP (n = 22) subtypes, reinforcing the notion that the epige-
nomics of these transcriptomically similar patients mark distinct
etiologies and/or disease characteristics. We observed seven
G-CIMP(+) cases lacking IDH1 mutation. These were similar to
G-CIMP cases harboring IDH1 mutations with respect to their
median age at diagnosis (40 year versus 37 year, p value =
0.58) and overall survival (mean 913 days versus 1,248 days,
p value = 0.45). IDH2 mutation was not detected in these seven
G-CIMP+/IDH1 wild-type GBM, suggesting that alternative
pathway(s) responsible for the hypermethylator phenotype.
Next, to identify genomic alterations enriched in each of
the transcriptomic or epigenomic subtypes, we referenced the
patient-centric tables to count DNA mutation and copy-number
aberration events per subtype. This analysis confirmed previous
reports, demonstrating significant associations between
PDGFRA amplification and the non-G-CIMP+ proneural sub-
group, as well asNF1 inactivation and themesenchymal subtype
(Figure 5A). Additionally, the enhanced power of the larger data
set identified an enrichment of ATRX mutations and MYC
amplifications in the G-CIMP+ subtype, CDK4 and SOX2 ampli-
fications in proneural subtype, and broad amplifications of
chromosomes 19 and 20 in the classical subtype (Figure 5A).
In contrast to G-CIMP, cluster M6 was relatively hypomethy-
lated, with a predominance of nonmutated IDH1 cases belong-
ing to the proneural subtype (22/37, 59%) with concurrent
PDGFRA amplification (Figure 5B).
To explore a plausible connection between chromatin dereg-
ulation and DNA methylation, we counted mutations in the 161
CMGs (Figure 1B) per each methylation subclass. In addition
to the association of IDH1 and ATRX mutations and G-CIMP,
mutations of other CMGs were enriched across the M2, M4,
and M6 subclasses (38% of cases in these three subclasses
harbor at least one CMG mutation versus 18% among the other
classes, p = 0.0015). Furthermore, caseswithmissensemutation
or deletion of MLL genes (n = 18) or HDAC family genes (n = 4)
clustered in the M2 DNA methylation subtype (10/21). These
patterns of co-occurrence suggest a functional relationship be-
tween chromatin modification andDNAmethylation that remains
to be elucidated. Recently, Sturm et al. reported that adult and
pediatric GBM with alterations of IDH1, H3F3A, and receptor
tyrosine kinases (RTK)were associatedwith epigenetic subtypes
(Sturm et al., 2012). We compared the Sturm et al. methylation-
based classification with ours using the 74 TCGA cases that
were also classified by those authors. We found that four tumors
classified as ‘‘IDH’’ subtype in Sturm et al. were assigned to
G-CIMP subtype in our classification scheme (Figure S5D). The
‘‘mesenchymal’’ tumors were assigned to M1 and M2 (21/25),
‘‘RTK II ‘classic’’’ tumors were assigned to M3 and M4 (30/34)
and the ‘‘RTK I ‘PDGFRA’’’ tumors were assigned to M6. No
TCGA samples were clustered in the Sturm et al.’s ‘‘G34’’ or
‘‘K27’’ classes, and we found the corresponding histone muta-
tions to be absent across the TCGA sample set.
atios %1 or %0.5 and focally targeting the gene (see Extended Experimental
notyping, TERT promoter C228T and C250T mutations occurred in a mutually
on, and were enriched in G-CIMP group. Right: TERT promoter mutations are
x spans the middle quartiles and whiskers span the full range.
Cell 155, 462–477, October 10, 2013 ª2013 Elsevier Inc. 471
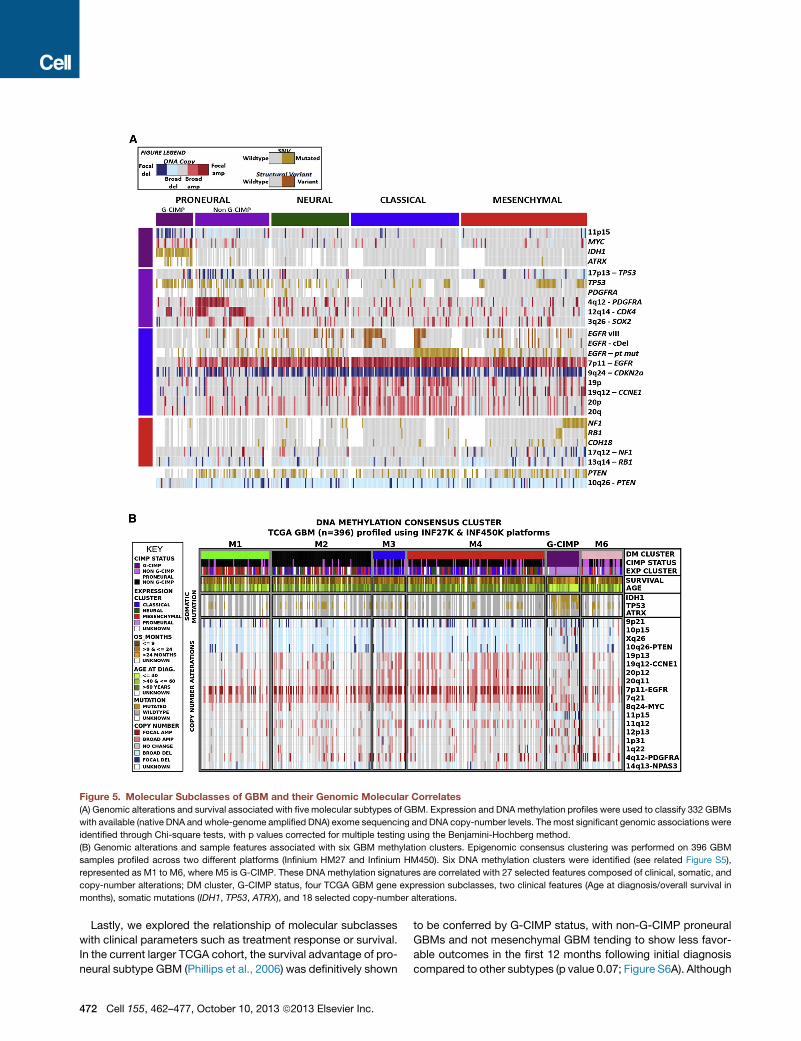
Figure 5. Molecular Subclasses of GBM and their Genomic Molecular Correlates
(A) Genomic alterations and survival associated with five molecular subtypes of GBM. Expression and DNAmethylation profiles were used to classify 332 GBMs
with available (native DNA and whole-genome amplified DNA) exome sequencing and DNA copy-number levels. Themost significant genomic associations were
identified through Chi-square tests, with p values corrected for multiple testing using the Benjamini-Hochberg method.
(B) Genomic alterations and sample features associated with six GBM methylation clusters. Epigenomic consensus clustering was performed on 396 GBM
samples profiled across two different platforms (Infinium HM27 and Infinium HM450). Six DNA methylation clusters were identified (see related Figure S5),
represented as M1 to M6, where M5 is G-CIMP. These DNA methylation signatures are correlated with 27 selected features composed of clinical, somatic, and
copy-number alterations; DM cluster, G-CIMP status, four TCGA GBM gene expression subclasses, two clinical features (Age at diagnosis/overall survival in
months), somatic mutations (IDH1, TP53, ATRX), and 18 selected copy-number alterations.
Lastly, we explored the relationship of molecular subclasses
with clinical parameters such as treatment response or survival.
In the current larger TCGA cohort, the survival advantage of pro-
neural subtype GBM (Phillips et al., 2006) was definitively shown
472 Cell 155, 462–477, October 10, 2013 ª2013 Elsevier Inc.
to be conferred by G-CIMP status, with non-G-CIMP proneural
GBMs and not mesenchymal GBM tending to show less favor-
able outcomes in the first 12 months following initial diagnosis
compared to other subtypes (p value 0.07; Figure S6A). Although
most of the samples clustered in theM6 group were classified as
proneural, this methylation subclass was not associated with
adverse survival overall (Figure S6B) (Noushmehr et al.,
2010).This observation reinforces the notion that target genes
affected by the G-CIMP phenotype likely contribute to the
improved prognosis for this subset of proneural GBM.
DNA methylation of the MGMT gene promoter is a known
marker for treatment response (Hegi et al., 2005). We found
that the MGMT locus was methylated in 48.5% of patients in
our cohort (174 of 359 assessed) and that G-CIMP cases
showed an increased likelihood of having MGMT DNA methyl-
ation (79%of G-CIMP versus 46% for non-G-CIMP; Figure S6C).
When correlated with outcome, MGMT status distinguished
responders from nonresponders among samples classified as
classical (n = 96; p = 0.01) but not among samples classified
as proneural (n = 66; p = 0.57), mesenchymal (n = 104; p =
0.62), and neural (n = 55; p = 0.12) (Figures S6D and S6E). In
summary, our data provide evidence forMGMTDNAmethylation
as a predictive biomarker in the GBM Classical subtype of GBM
but not other subtypes.
Regulatory Networks of miRNA and mRNA inGliomagenesisMicroRNAs (miRs) have been found to promote or suppress
oncogenesis through modulation of gene expression via mRNA
degradation or inhibition of translation (Bartel, 2004; Krol et al.,
2010). Recent studies have proposed additional mechanisms
of miR-mRNA regulation, including modulation of competing
endogenous RNA (ceRNA), which are mRNA with competitive
miR binding sites (Sumazin et al., 2011; Tay et al., 2011).
Leveraging the existence of matched mRNA and miR profiling
data on a large number of samples, we sought to define the
salient interactions between specific pairs of miRs and mRNAs
through both of these mechanisms.
We employed a relevance network-based approach to infer
miR:mRNA associations in GBMs with matched miR and mRNA
profiles (n = 482). Putative regulatory targets of individual miRs
were defined as those genes having strong negative correlation
with the miR (%0.3) and prediction support in three commonly
used databases (Miranda, Pictar, TargetScan). One hundred
and thirty-threemiR:mRNAassociationsdefined thefinal putative
miR regulatory network (see Data Portal). The most prevalent as-
sociations related to molecular subtypes. For instance, hsa-mir-
29a (part of the miR29 family, thought to play a role in the TP53
pathway (Park et al., 2009), was predicted to regulate 23 genes.
Seventeen of these 23 genes were expressed at distinctively
high levels in the non-G-CIMP+ proneural tumors only and not
in the G-CIMP+ tumors. Interestingly, three (BCL11A, PCFG3,
and SS18L1) of the 23 genes in this subnetwork are predicted
to have competitive binding with PDGFRA regulatory miRs.
ceRNAs are mRNAs coregulated in trans by a common miR
(Sumazin et al., 2011; Tay et al., 2011). Here, we used a correla-
tion- and NLS-based approach, integrating miRNA and mRNA
expression and copy-number profiles to predict ceRNAs for
four GBM signature genes: PDGFRA, EGFR, NF1, and PTEN.
Interestingly, predicted PDGFRA ceRNAs significantly overlap-
ped with proneural GBM signature genes (p value < 1 3 10�15),
whereas EGFR ceRNAs significantly overlapped with classical
GBM signature genes (p value = 1.2 3 10�14) (see Data Portal).
Predicted ceRNAs of NF1 overlapped with proneural signatures
(p < 1 3 10�15) and PTEN-associated ceRNAs were correlated
with the mesenchymal signature. This provocative finding raises
thepossibility that ceRNA regulationbymiRmaycontribute to the
transcriptomic signature that defines the molecular subtypes in
GBM, although this hypothesis remains to be tested.
Signaling Pathway Activation in Different MolecularSubtypes of GBMTo assess whether enrichment of genomic alterations in molec-
ular subtypes translates into downstream pathway activation,
we performed targeted proteomic profiling by RPPA. Two hun-
dred and fourteen sample lysates were probed with 171 anti-
bodies targeting phospho- and/or total-protein levels among
signaling pathways as previously described (TCGA, 2012c). After
normalization, coclusters of correlated signaling molecules
within specific signaling pathways were observed (see Extended
Experimental Procedures; Data Portal) and were utilized as
readout of pathway activity status for correlative analyses.
Unsupervised clustering of RPPA data failed to produce a
consistent partitioning of the sample cohort into clearly-defined
subtypes. However, 127 out of the 171 antibodies were found
to correlate significantly with transcriptomal subtype (Kruskal-
Wallis, p < 0.05; Extended Experimental Procedures). As antici-
pated, EGFR amplification/mutation was associated with signifi-
cant elevations in total EGFR expression (p = 3.74 3 10�15) and
phosphorylation (p = 1.44 3 10�12, Figure S7A), both prominent
in classical subtype tumors (Figure S7B). Classical GBMs also
showed relative downregulation of proapoptotic proteins
(including cleaved caspase 7, cleaved caspase 9, Bid, and Bak)
as well as MAP kinase signaling, including its downstream target
p90RSK. Notch1 and Notch3 expression were moderately
increased in classical tumors, consistent with previous reports
linking EGFR and Notch activation in GBM (Brennan et al., 2009).
Mesenchymal subtype tumors exhibited elevated levels of
endothelial markers, such as CD31 and VEGFR-2, consistent
with previous findings (Phillips et al., 2006), as well as markers
of inflammation (e.g., fibronectin and its downstream target
COX-2). Mesenchymal tumors showed moderately increased
activation of the MAPK pathway, as evidenced by higher levels
of phospho-Raf, phospho-MEK, and phospho-ERK (Figure 6).
These tumors also exhibited decreased levels of the mTOR reg-
ulatory protein, tuberin (TSC2 gene product), which is inhibited
by ERK phosphorylation.
In contrast to the mesenchymal subtype, proneural GBMs
showed relatively elevated expression and activation of the
PI3K pathway including the Akt-regulated mTorc1 activation
site (Figure 6). Proneural tumors showed greater inhibition of
the 4EBP1 translation repressor, whereas mesenchymal tumors
display elevated S6 kinase activation (indicative of mTOR
effector pathway activation). Therefore, both subtypes achieve
mTOR pathway activation although the specific patterns of
steady-state protein activation differ.
G-CIMP+ tumors shared characteristics with their proneural
superfamily, but also showed decreased expression of several
proteins, including Cox-2, IGFBP2, and Annexin 1. Among the
171 antibodies tested in the TCGA data set, these three proteins
Cell 155, 462–477, October 10, 2013 ª2013 Elsevier Inc. 473
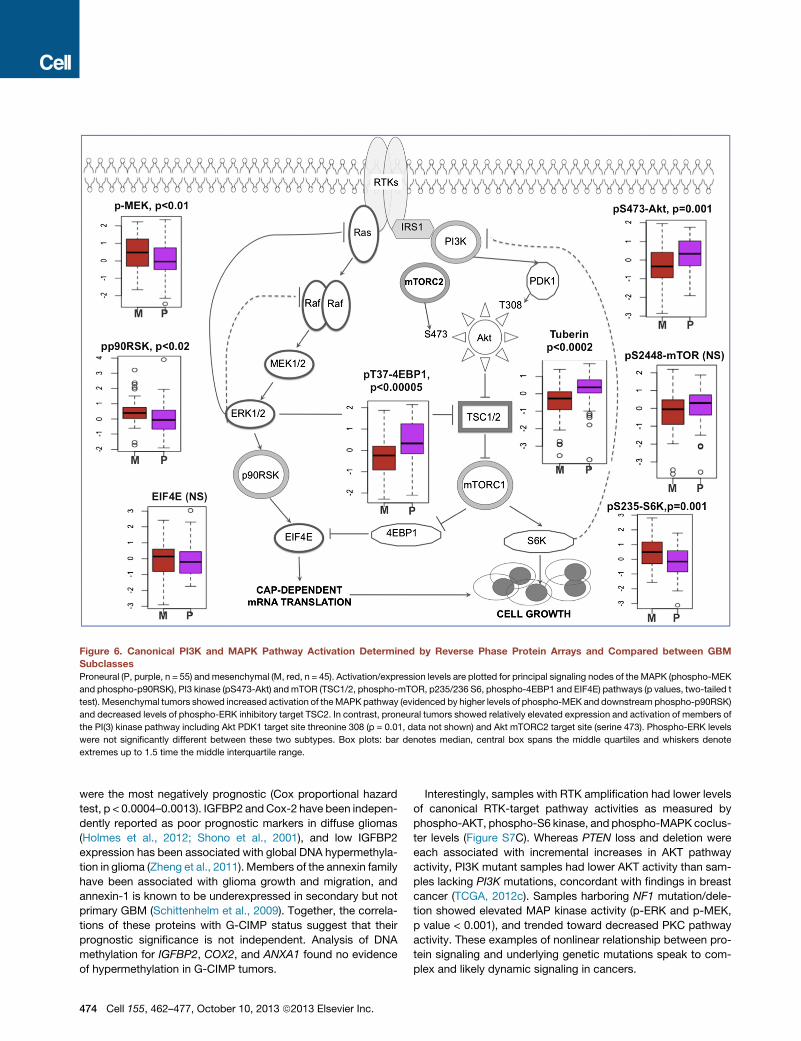
Figure 6. Canonical PI3K and MAPK Pathway Activation Determined by Reverse Phase Protein Arrays and Compared between GBM
Subclasses
Proneural (P, purple, n = 55) andmesenchymal (M, red, n = 45). Activation/expression levels are plotted for principal signaling nodes of the MAPK (phospho-MEK
and phospho-p90RSK), PI3 kinase (pS473-Akt) andmTOR (TSC1/2, phospho-mTOR, p235/236 S6, phospho-4EBP1 and EIF4E) pathways (p values, two-tailed t
test). Mesenchymal tumors showed increased activation of theMAPK pathway (evidenced by higher levels of phospho-MEK and downstream phospho-p90RSK)
and decreased levels of phospho-ERK inhibitory target TSC2. In contrast, proneural tumors showed relatively elevated expression and activation of members of
the PI(3) kinase pathway including Akt PDK1 target site threonine 308 (p = 0.01, data not shown) and Akt mTORC2 target site (serine 473). Phospho-ERK levels
were not significantly different between these two subtypes. Box plots: bar denotes median, central box spans the middle quartiles and whiskers denote
extremes up to 1.5 time the middle interquartile range.
were the most negatively prognostic (Cox proportional hazard
test, p < 0.0004–0.0013). IGFBP2 andCox-2 have been indepen-
dently reported as poor prognostic markers in diffuse gliomas
(Holmes et al., 2012; Shono et al., 2001), and low IGFBP2
expression has been associated with global DNA hypermethyla-
tion in glioma (Zheng et al., 2011). Members of the annexin family
have been associated with glioma growth and migration, and
annexin-1 is known to be underexpressed in secondary but not
primary GBM (Schittenhelm et al., 2009). Together, the correla-
tions of these proteins with G-CIMP status suggest that their
prognostic significance is not independent. Analysis of DNA
methylation for IGFBP2, COX2, and ANXA1 found no evidence
of hypermethylation in G-CIMP tumors.
474 Cell 155, 462–477, October 10, 2013 ª2013 Elsevier Inc.
Interestingly, samples with RTK amplification had lower levels
of canonical RTK-target pathway activities as measured by
phospho-AKT, phospho-S6 kinase, and phospho-MAPK coclus-
ter levels (Figure S7C). Whereas PTEN loss and deletion were
each associated with incremental increases in AKT pathway
activity, PI3K mutant samples had lower AKT activity than sam-
ples lacking PI3K mutations, concordant with findings in breast
cancer (TCGA, 2012c). Samples harboring NF1 mutation/dele-
tion showed elevated MAP kinase activity (p-ERK and p-MEK,
p value < 0.001), and trended toward decreased PKC pathway
activity. These examples of nonlinear relationship between pro-
tein signaling and underlying genetic mutations speak to com-
plex and likely dynamic signaling in cancers.
DISCUSSION
In this study, we provided a comprehensive catalog of
somatic alterations associated with glioblastoma, constructed
through whole-genome, exome, and RNA sequencing as well
as copy-number, transcriptomic, epigenomic, and targeted pro-
teomic profiling. With the availability of detailed clinical informa-
tion including treatment and survival outcome for nearly the entire
cohort, this rich data set offers newopportunity to discover geno-
mics-based biomarkers, validate disease-related mechanisms
and generate novel hypotheses.
In addition to alterations in signature oncogenes of GBM, such
as EGFR and PI3K, we found that over 40% of tumors harbor at
least one nonsynonymous mutation among the chromatin-mod-
ifier genes. A role for chromatin organization in GBM pathology,
which has been described for cancer types such as ovarian car-
cinoma (Wiegand et al., 2010) and renal carcinoma (Varela et al.,
2011), is suggested. We also detected mutations in genes for
which targeted therapies have been developed, such as BRAF
(Chapman et al., 2011a), and FGFR1/FGFR2/FGFR3 (Singh
et al., 2012), demonstrating the potential clinical impact of this
TCGA data set.
Structural rearrangements that contributed to the overall
complexity of the genome and transcriptome were detected in
the majority of GBM. A high frequency of structural variants on
the q arm of chromosome 12, involving the MDM2 and CDK4
genes, was observed and associated with the presence of dou-
ble minute, extrachromosomal DNA fragments, which may be
functionally relevant (Zheng et al., 2013). The identification of
complex EGFR fusion and deletion variants in nearly half of
GBM confirm relevance of this category of somatic alterations
to the disease. While the development of a therapeutic strategy
targeting mutated EGFR could have a major impact on survival
and continues to be a topic of great interest (Vivanco et al.,
2012), strategies will need to address the possibility that different
EGFR alterations might exist concurrently in a tumor and yield
differential biological activities and/or responses to any given
targeted inhibitor.
Another level of biological complexity is revealed by targeted
proteomic profile, which showed that the impact of specific
genomic alterations on downstream pathway signaling is not
linear and not always predictably concordant with genotype.
This observation has provocative clinical implication as it directly
challenges the notion that therapeutic inhibition of downstream
signaling components along a pathway would yield similar effi-
cacy of targeting the mutated gene itself. Additionally, this
observation highlights the limitation of TCGA data, namely its
inherent static nature given a single time point analysis, and its
inability tomap specific genetic or protein changes to the individ-
ual cells or cell populations through whole-tumor tissue analysis.
In summary, this report reaffirms the power and value of
TCGA’s comprehensive multidimensional and clinically anno-
tated GBM reference data set in enabling hypothesis genera-
tion based on unanticipated observations and relationships
emerged from unbiased data-driven analyses. We believe that
this public resource will serve to facilitate discovery of new
insights that can advance our molecular understanding of this
disease.
EXPERIMENTAL PROCEDURES
Patient and Sample Characteristics
Specimens were obtained from patients, with appropriate consent from insti-
tutional review boards. Details of sample preparation are described in the
Extended Experimental Procedures.
Data Generation
In total, 599 patients were assayed on at least onemolecular profiling platform,
which platforms included: (1) exome sequencing, (2) DNA copy-number and
single-nucleotide polymorphism arrays, (3) whole-genome sequencing, (4)
gene expression arrays, (5) RNA sequencing, (6) DNA methylation arrays, (7)
reverse phase protein arrays, and (8) miRNA arrays. Details of data generation
are described in the Extended Experimental Procedures.
Whole-Genome and Exome Sequencing Data Analysis
Massively Parallel Sequencing Exome capture was performed by using Agilent
SureSelect Human All Exon 50 Mb according the manufacturer’s instructions.
All exome and whole-genome sequencing was performed on the Illumina
GA2000 and HiSeq platforms. Basic alignment and sequence quality control
were done by using the Picard and Firehose pipelines at the Broad Institute.
Mapped genomes were processed by the Broad Firehose pipeline to perform
additional quality control, variant calling, and mutational significance analysis.
RNA Sequencing Data Analysis
Libraries were generated from total RNA and constructed using the manufac-
turers protocols. Sequencing was done on the Illumina HiSeq platform. Read
mapping and downstream data analysis (expression profiles, fusion tran-
scripts, and structural transcript variants) were performed using the PRADA
pipeline.
Array Data Preprocessing and Analysis
To ensure across-platform comparability, features from all array platforms
were compared to a reference genome as previously described (TCGA,
2008). Both single platform analyses and integrated cross-platform analyses
were performed, as described in detail in the Extended Experimental
Procedures.
SUPPLEMENTAL INFORMATION
Supplemental Information includes Extended Experimental Procedures, six
figures, and seven tables and can be found with this article online at http://
dx.doi.org/10.1016/j.cell.2013.09.034.
CONSORTIA
The members of TCGA Research Network are: Christopher Benz, Jill Barn-
holtz-Sloan, Wendi Barrett, Quinn Ostrom, Yingli Wolinsky, Keith L. Black,
Bikash Bose, Paul T. Boulos, Madgy Boulos, Jenn Brown, Christine Czerinski,
Matthew Eppley, Mary Iacocca, Thelma Kempista, Teresa Kitko, Yakov Koyf-
man, Brenda Rabeno, Pawan Rastogi, Michael Sugarman, Patricia Swanson,
Kennedy Yalamanchii, Ilana P. Otey, Yingchun Spring Liu, Yonghong Xiao,
J.Todd Auman, Peng-Chieh Chen, Angela Hadjipanayis, Eunjung Lee, Semin
Lee, Peter J. Park, Jonathan Seidman, Lixing Yang, Raju Kucherlapati, Steven
Kalkanis, Tom Mikkelsen, Laila M. Poisson, Aditya Raghunathan, Lisa Scar-
pace, Brady Bernard, RyanBressler, Andrea Eakin, Lisa Iype, Richard B. Kreis-
berg, Kalle Leinonen, Sheila Reynolds, Hector Rovira, Vesteinn Thorsson, Ilya
Shmulevich, Matti J. Annala, Robert Penny, Joseph Paulauskis, Erin Curley,
Martha Hatfield, David Mallery, Scott Morris, Troy Shelton, Candace Shelton,
Mark Sherman, Peggy Yena, Lucia Cuppini, Francesco DiMeco, Marica Eoli,
Gaetano Finocchiaro, Emanuela Maderna, Bianca Pollo, Marco Saini, Saia-
nand Balu, Katherine A. Hoadley, Ling Li, C. Ryan Miller, Yan Shi, Michael D.
Topal, Junyuan Wu, Gavin Dunn, Caterina Giannini, Brian P. O’Neill, B. Arman
Aksoy, Yevgeniy Antipin, Laetitia Borsu, Samuel H. Berman, Cameron W.
Brennan, Ethan Cerami, Debyani Chakravarty, Giovanni Ciriello, Jianjiong
Gao, Benjamin Gross, Anders Jacobsen, Marc Ladanyi, Alex Lash, Yupu
Liang, Boris Reva, Chris Sander, Nikolaus Schultz, Ronglai Shen, Nicholas
Cell 155, 462–477, October 10, 2013 ª2013 Elsevier Inc. 475
D. Socci, Agnes Viale, Martin L. Ferguson, Qing-Rong Chen, John A. Dem-
chok, Laura A.L. Dillon, Kenna R. Mills Shaw, Margi Sheth, Roy Tarnuzzer,
Zhining Wang, Liming Yang, Tanja Davidsen, Mark S. Guyer, Bradley A. Ozen-
berger, Heidi J. Sofia, Julie Bergsten, John Eckman, Jodi Harr, Jerome Myers,
Christine Smith, Kelly Tucker, Cindy Winemiller, Leigh Anne Zach, Julia Y. Lju-
bimova, Greg Eley, Brenda Ayala, Mark A. Jensen, Ari Kahn, Todd D. Pihl,
David A. Pot, Yunhu Wan, Jennifer Eschbacher, Greg Foltz, Nathan Hansen,
Parvi Hothi, Biaoyang Lin, Nameeta Shah, Jae-geun Yoon, Ching Lau, Michael
Berens, Kristin Ardlie, Rameen Beroukhim, Scott L. Carter, Andrew D. Cher-
niack, Mike Noble, Juok Cho, Kristian Cibulskis, Daniel DiCara, Scott Frazer,
Stacey B. Gabriel, Nils Gehlenborg, Jeff Gentry, David Heiman, Jaegil Kim,
Rui Jing, Eric S. Lander, Michael Lawrence, Pei Lin, Will Mallard, Matthew
Meyerson, Robert C. Onofrio, Gordon Saksena, Steve Schumacher, Carrie
Sougnez, Petar Stojanov, Barbara Tabak, Doug Voet, Hailei Zhang, Lihua
Zou, Gad Getz, Nathan N. Dees, Li Ding, Lucinda L. Fulton, Robert S. Fulton,
Krishna-Latha Kanchi, Elaine R. Mardis, Richard K. Wilson, Stephen B. Baylin,
David W. Andrews, Larry Harshyne, Mark L. Cohen, Karen Devine, Andrew E.
Sloan, Scott R. VandenBerg, Mitchel S. Berger, Michael Prados, Daniel Carlin,
Brian Craft, Kyle Ellrott, Mary Goldman, Theodore Goldstein, Mia Grifford,
David Haussler, Singer Ma, Sam Ng, Sofie R. Salama, J. Zachary Sanborn,
Joshua Stuart, Teresa Swatloski, Peter Waltman, Jing Zhu, Robin Foss, Bar-
bara Frentzen, William Friedman, Raquel McTiernan, Anthony Yachnis, D.
Neil Hayes, Charles M. Perou, Siyuan Zheng, Rahulsimham Vegesna, Yong
Mao, Rehan Akbani, Kenneth Aldape, Oliver Bogler, Gregory N. Fuller, Wenbin
Liu, Yuexin Liu, Yiling Lu, Gordon Mills, Alexei Protopopov, Xiaojia Ren, Yout-
ing Sun, Chang-Jiun Wu, W.K. Alfred Yung, Wei Zhang, Jianhua Zhang, Ken
Chen, John N. Weinstein, Lynda Chin, Roel G.W. Verhaak, Houtan Noush-
mehr, Daniel J. Weisenberger, Moiz S. Bootwalla, Phillip H. Lai, Timothy J.
Triche, Jr., David J. Van Den Berg, Peter W. Laird, David H. Gutmann, Norman
L. Lehman, Erwin G. VanMeir, Daniel Brat, Jeffrey J. Olson, Gena M. Mastro-
gianakis, Narra S. Devi, Zhaobin Zhang, Darell Bigner, Eric Lipp, and Roger
McLendon.
ACKNOWLEDGMENTS
The TCGA research network contributed collectively to this study. Bio-
specimens were provided by the Tissue Source Sites and processed by the
Biospecimen Core Resource. Data generation and analyses were performed
by the Genome Sequencing Centers, Cancer Genome Characterization Cen-
ters, and Genome Data Analysis Centers. All data were released through the
Data Coordinating Center. Project activities were coordinated by NCI and
NHGRI Project Teams. This work was supported by the following grants from
the USA National Institutes of Health: U24CA143883, U24CA143858, U24C
A143840, U24CA143799, U24CA143835, U24CA143845, U24CA143882, U24
CA143867, U24CA143866, U24CA143848, U24CA144025, U24CA143843,
U54HG003067, U54HG003079, U54HG003273, U24CA126543, U24CA12
6544, U24CA126546, U24CA126551, U24CA126554, U24CA126561, U24CA
126563, and U24CA143731.
Received: January 11, 2013
Revised: July 28, 2013
Accepted: September 17, 2013
Published: October 10, 2013
REFERENCES
Bady, P., Sciuscio, D., Diserens, A.C., Bloch, J., van den Bent, M.J., Marosi,
C., Dietrich, P.Y., Weller, M., Mariani, L., Heppner, F.L., et al. (2012). MGMT
methylation analysis of glioblastoma on the Infinium methylation BeadChip
identifies two distinct CpG regions associated with gene silencing and
outcome, yielding a prediction model for comparisons across datasets, tumor
grades, and CIMP-status. Acta Neuropathol. 124, 547–560.
Bartel, D.P. (2004). MicroRNAs: genomics, biogenesis, mechanism, and func-
tion. Cell 116, 281–297.
Berger, M.F., Hodis, E., Heffernan, T.P., Deribe, Y.L., Lawrence, M.S., Proto-
popov, A., Ivanova, E., Watson, I.R., Nickerson, E., Ghosh, P., et al. (2012).
476 Cell 155, 462–477, October 10, 2013 ª2013 Elsevier Inc.
Melanoma genome sequencing reveals frequent PREX2 mutations. Nature
485, 502–506.
Beroukhim, R., Mermel, C.H., Porter, D., Wei, G., Raychaudhuri, S., Donovan,
J., Barretina, J., Boehm, J.S., Dobson, J., Urashima, M., et al. (2010). The land-
scape of somatic copy-number alteration across human cancers. Nature 463,
899–905.
Brennan, C., Momota, H., Hambardzumyan, D., Ozawa, T., Tandon, A.,
Pedraza, A., and Holland, E. (2009). Glioblastoma subclasses can be defined
by activity among signal transduction pathways and associated genomic alter-
ations. PLoS ONE 4, e7752.
Callaghan, T., Antczak, M., Flickinger, T., Raines, M., Myers, M., and Kung,
H.J. (1993). A complete description of the EGF-receptor exon structure: impli-
cation in oncogenic activation and domain evolution. Oncogene 8, 2939–2948.
Carter, S.L., Cibulskis, K., Helman, E., McKenna, A., Shen, H., Zack, T., Laird,
P.W., Onofrio, R.C., Winckler, W., Weir, B.A., et al. (2012). Absolute quantifica-
tion of somatic DNA alterations in human cancer. Nat. Biotechnol. 30,
413–421.
Chapman, P.B., Hauschild, A., Robert, C., Haanen, J.B., Ascierto, P., Larkin,
J., Dummer, R., Garbe, C., Testori, A., Maio, M., et al.; BRIM-3 Study Group.
(2011a). Improved survival with vemurafenib in melanoma with BRAF V600E
mutation. N. Engl. J. Med. 364, 2507–2516.
Chen, A.J., Paik, J.H., Zhang, H., Shukla, S.A., Mortensen, R., Hu, J., Ying, H.,
Hu, B., Hurt, J., Farny, N., et al. (2012). STAR RNA-binding protein Quaking
suppresses cancer via stabilization of specific miRNA. Genes Dev. 26,
1459–1472.
Cho, J., Pastorino, S., Zeng, Q., Xu, X., Johnson,W., Vandenberg, S., Verhaak,
R., Cherniack, A.D., Watanabe, H., Dutt, A., et al. (2011). Glioblastoma-derived
epidermal growth factor receptor carboxyl-terminal deletion mutants are
transforming and are sensitive to EGFR-directed therapies. Cancer Res. 71,
7587–7596.
Ciriello, G., Cerami, E., Sander, C., and Schultz, N. (2012). Mutual exclusivity
analysis identifies oncogenic network modules. Genome Res. 22, 398–406.
Dolecek, T.A., Propp, J.M., Stroup, N.E., and Kruchko, C. (2012). CBTRUS
statistical report: primary brain and central nervous system tumors diagnosed
in the United States in 2005-2009. Neuro-oncol. 14 (Suppl 5), v1–v49.
Dunn, G.P., Rinne, M.L., Wykosky, J., Genovese, G., Quayle, S.N., Dunn, I.F.,
Agarwalla, P.K., Chheda, M.G., Campos, B., Wang, A., et al. (2012). Emerging
insights into the molecular and cellular basis of glioblastoma. Genes Dev. 26,
756–784.
Hegi, M.E., Diserens, A.C., Gorlia, T., Hamou, M.F., de Tribolet, N., Weller, M.,
Kros, J.M., Hainfellner, J.A., Mason, W., Mariani, L., et al. (2005). MGMT gene
silencing and benefit from temozolomide in glioblastoma. N. Engl. J. Med. 352,
997–1003.
Hodis, E., Watson, I.R., Kryukov, G.V., Arold, S.T., Imielinski, M., Theurillat,
J.P., Nickerson, E., Auclair, D., Li, L., Place, C., et al. (2012). A landscape of
driver mutations in melanoma. Cell 150, 251–263.
Holmes, K.M., Annala, M., Chua, C.Y., Dunlap, S.M., Liu, Y., Hugen, N., Moore,
L.M., Cogdell, D., Hu, L., Nykter, M., et al. (2012). Insulin-like growth factor-
binding protein 2-driven glioma progression is prevented by blocking a
clinically significant integrin, integrin-linked kinase, and NF-kB network.
Proc. Natl. Acad. Sci. USA 109, 3475–3480.
Ichimura, K., Pearson, D.M., Kocialkowski, S., Backlund, L.M., Chan, R.,
Jones, D.T., andCollins, V.P. (2009). IDH1mutations are present in themajority
of common adult gliomas but rare in primary glioblastomas. Neuro-oncol. 11,
341–347.
Imielinski, M., Berger, A.H., Hammerman, P.S., Hernandez, B., Pugh, T.J.,
Hodis, E., Cho, J., Suh, J., Capelletti, M., Sivachenko, A., et al. (2012). Mapping
the hallmarks of lung adenocarcinomawithmassively parallel sequencing. Cell
150, 1107–1120.
Inda, M.M., Bonavia, R., Mukasa, A., Narita, Y., Sah, D.W., Vandenberg, S.,
Brennan, C., Johns, T.G., Bachoo, R., Hadwiger, P., et al. (2010). Tumor
heterogeneity is an active process maintained by a mutant EGFR-induced
cytokine circuit in glioblastoma. Genes Dev. 24, 1731–1745.
Kannan, K., Inagaki, A., Silber, J., Gorovets, D., Zhang, J., Kastenhuber, E.R.,
Heguy, A., Petrini, J.H., Chan, T.A., and Huse, J.T. (2012). Whole-exome
sequencing identifies ATRX mutation as a key molecular determinant in
lower-grade glioma. Oncotarget 3, 1194–1203.
Killela, P.J., Reitman, Z.J., Jiao, Y., Bettegowda, C., Agrawal, N., Diaz, L.A.,
Jr., Friedman, A.H., Friedman, H., Gallia, G.L., Giovanella, B.C., et al. (2013).
TERT promoter mutations occur frequently in gliomas and a subset of tumors
derived from cells with low rates of self-renewal. Proc. Natl. Acad. Sci. USA
110, 6021–6026.
Krol, J., Loedige, I., and Filipowicz, W. (2010). The widespread regulation of
microRNA biogenesis, function and decay. Nat. Rev. Genet. 11, 597–610.
Kurahashi, H., Akagi, K., Inazawa, J., Ohta, T., Niikawa, N., Kayatani, F., Sano,
T., Okada, S., and Nishisho, I. (1995). Isolation and characterization of a novel
gene deleted in DiGeorge syndrome. Hum. Mol. Genet. 4, 541–549.
Kuttler, F., and Mai, S. (2007). Formation of non-random extrachromosomal
elements during development, differentiation and oncogenesis. Semin. Can-
cer Biol. 17, 56–64.
Liu, X.Y., Gerges, N., Korshunov, A., Sabha, N., Khuong-Quang, D.A., Fonte-
basso, A.M., Fleming, A., Hadjadj, D., Schwartzentruber, J., Majewski, J., et al.
(2012). Frequent ATRX mutations and loss of expression in adult diffuse astro-
cytic tumors carrying IDH1/IDH2 and TP53 mutations. Acta Neuropathol. 124,
615–625.
Lovejoy, C.A., Li, W., Reisenweber, S., Thongthip, S., Bruno, J., de Lange, T.,
De, S., Petrini, J.H., Sung, P.A., Jasin, M., et al.; ALT Starr Cancer Consortium.
(2012). Loss of ATRX, genome instability, and an altered DNA damage
response are hallmarks of the alternative lengthening of telomeres pathway.
PLoS Genet. 8, e1002772.
Mermel, C.H., Schumacher, S.E., Hill, B., Meyerson, M.L., Beroukhim, R., and
Getz, G. (2011). GISTIC2.0 facilitates sensitive and confident localization of the
targets of focal somatic copy-number alteration in human cancers. Genome
Biol. 12, R41.
Noushmehr, H., Weisenberger, D.J., Diefes, K., Phillips, H.S., Pujara, K., Ber-
man, B.P., Pan, F., Pelloski, C.E., Sulman, E.P., Bhat, K.P., et al.; Cancer
Genome Atlas Research Network. (2010). Identification of a CpG island meth-
ylator phenotype that defines a distinct subgroup of glioma. Cancer Cell 17,
510–522.
Ohgaki, H., and Kleihues, P. (2007). Genetic pathways to primary and second-
ary glioblastoma. Am. J. Pathol. 170, 1445–1453.
Ozawa, T., Brennan, C.W., Wang, L., Squatrito, M., Sasayama, T., Nakada, M.,
Huse, J.T., Pedraza, A., Utsuki, S., Yasui, Y., et al. (2010). PDGFRA gene rear-
rangements are frequent genetic events in PDGFRA-amplified glioblastomas.
Genes Dev. 24, 2205–2218.
Park, S.Y., Lee, J.H., Ha, M., Nam, J.W., and Kim, V.N. (2009). miR-29miRNAs
activate p53 by targeting p85 alpha and CDC42. Nat. Struct. Mol. Biol. 16,
23–29.
Phillips, H.S., Kharbanda, S., Chen, R., Forrest, W.F., Soriano, R.H., Wu, T.D.,
Misra, A., Nigro, J.M., Colman, H., Soroceanu, L., et al. (2006). Molecular sub-
classes of high-grade glioma predict prognosis, delineate a pattern of disease
progression, and resemble stages in neurogenesis. Cancer Cell 9, 157–173.
Sanborn, J.Z., Salama, S.R., Grifford, M., Brennan, C.W., Mikkelsen, T., Jhan-
war, S., Katzman, S., Chin, L., and Haussler, D. (2013). Doubleminute chromo-
somes in glioblastoma multiforme are revealed by precise reconstruction of
oncogenic amplicons. Cancer Res.. http://dx.doi.org/10.1158/0008-5472.
CAN-13-0186.
Schittenhelm, J., Trautmann, K., Tabatabai, G., Hermann, C., Meyermann, R.,
and Beschorner, R. (2009). Comparative analysis of annexin-1 in neuroepithe-
lial tumors shows altered expression with the grade of malignancy but is not
associated with survival. Mod. Pathol. 22, 1600–1611.
Schwartzentruber, J., Korshunov, A., Liu, X.Y., Jones, D.T., Pfaff, E., Jacob, K.,
Sturm, D., Fontebasso, A.M., Quang, D.A., Tonjes, M., et al. (2012). Driver
mutations in histone H3.3 and chromatin remodelling genes in paediatric
glioblastoma. Nature 482, 226–231.
Shono, T., Tofilon, P.J., Bruner, J.M., Owolabi, O., and Lang, F.F. (2001).
Cyclooxygenase-2 expression in human gliomas: prognostic significance
and molecular correlations. Cancer Res. 61, 4375–4381.
Singh, D., Chan, J.M., Zoppoli, P., Niola, F., Sullivan, R., Castano, A., Liu, E.M.,
Reichel, J., Porrati, P., Pellegatta, S., et al. (2012). Transforming fusions of
FGFR and TACC genes in human glioblastoma. Science 337, 1231–1235.
Snuderl, M., Fazlollahi, L., Le, L.P., Nitta, M., Zhelyazkova, B.H., Davidson,
C.J., Akhavanfard, S., Cahill, D.P., Aldape, K.D., Betensky, R.A., et al.
(2011). Mosaic amplification of multiple receptor tyrosine kinase genes in
glioblastoma. Cancer Cell 20, 810–817.
Sturm, D., Witt, H., Hovestadt, V., Khuong-Quang, D.A., Jones, D.T., Koner-
mann, C., Pfaff, E., Tonjes, M., Sill, M., Bender, S., et al. (2012). Hotspot
mutations in H3F3A and IDH1 define distinct epigenetic and biological sub-
groups of glioblastoma. Cancer Cell 22, 425–437.
Sumazin, P., Yang, X., Chiu, H.S., Chung, W.J., Iyer, A., Llobet-Navas, D.,
Rajbhandari, P., Bansal, M., Guarnieri, P., Silva, J., and Califano, A. (2011).
An extensive microRNA-mediated network of RNA-RNA interactions regulates
established oncogenic pathways in glioblastoma. Cell 147, 370–381.
Szerlip, N.J., Pedraza, A., Chakravarty, D., Azim, M., McGuire, J., Fang, Y.,
Ozawa, T., Holland, E.C., Huse, J.T., Jhanwar, S., et al. (2012). Intratumoral
heterogeneity of receptor tyrosine kinases EGFR and PDGFRA amplification
in glioblastoma defines subpopulations with distinct growth factor response.
Proc. Natl. Acad. Sci. USA 109, 3041–3046.
Tay, Y., Kats, L., Salmena, L.,Weiss,D., Tan, S.M., Ala,U., Karreth, F., Poliseno,
L., Provero, P., Di Cunto, F., et al. (2011). Coding-independent regulation of the
tumor suppressor PTENby competing endogenousmRNAs.Cell147, 344–357.
(TCGA) Cancer Genome Atlas Research Network. (2008). Comprehensive
genomic characterization defines human glioblastoma genes and core path-
ways. Nature 455, 1061–1068.
(TCGA) Cancer Genome Atlas Research Network. (2011). Integrated genomic
analyses of ovarian carcinoma. Nature 474, 609–615.
(TCGA) Cancer Genome Atlas Research Network. (2012a). Comprehensive
genomic characterization of squamous cell lung cancers. Nature 489,
519–525.
(TCGA) Cancer Genome Atlas Network. (2012b). Comprehensive molecular
characterization of human colon and rectal cancer. Nature 487, 330–337.
(TCGA) Cancer Genome Atlas Network. (2012c). Comprehensive molecular
portraits of human breast tumours. Nature 490, 61–70.
Varela, I., Tarpey, P., Raine, K., Huang, D., Ong, C.K., Stephens, P., Davies, H.,
Jones, D., Lin, M.L., Teague, J., et al. (2011). Exome sequencing identifies
frequent mutation of the SWI/SNF complex gene PBRM1 in renal carcinoma.
Nature 469, 539–542.
Verhaak, R.G., Hoadley, K.A., Purdom, E., Wang, V., Qi, Y., Wilkerson, M.D.,
Miller, C.R., Ding, L., Golub, T., Mesirov, J.P., et al.; Cancer Genome Atlas
Research Network. (2010). Integrated genomic analysis identifies clinically
relevant subtypes of glioblastoma characterized by abnormalities in PDGFRA,
IDH1, EGFR, and NF1. Cancer Cell 17, 98–110.
Vivanco, I., Robins, H.I., Rohle, D., Campos, C., Grommes, C., Nghiemphu,
P.L., Kubek, S., Oldrini, B., Chheda, M.G., Yannuzzi, N., et al. (2012). Differen-
tial sensitivity of glioma- versus lung cancer-specific EGFRmutations to EGFR
kinase inhibitors. Cancer Discov 2, 458–471.
Wiegand, K.C., Shah, S.P., Al-Agha, O.M., Zhao, Y., Tse, K., Zeng, T., Senz, J.,
McConechy, M.K., Anglesio, M.S., Kalloger, S.E., et al. (2010). ARID1A muta-
tions in endometriosis-associated ovarian carcinomas. N. Engl. J. Med. 363,
1532–1543.
Zheng, S., Houseman, E.A., Morrison, Z., Wrensch, M.R., Patoka, J.S.,
Ramos, C., Haas-Kogan, D.A., McBride, S., Marsit, C.J., Christensen, B.C.,
et al. (2011). DNA hypermethylation profiles associated with glioma subtypes
and EZH2 and IGFBP2 mRNA expression. Neuro-oncol. 13, 280–289.
Zheng, S., Fu, J., Vegesna, R., Mao, Y., Heathcock, L.E., Torres-Garcia, W.,
Ezhilarasan, R., Wang, S., McKenna, A., Chin, L., et al. (2013). A survey of intra-
genic breakpoints in glioblastoma identifies a distinct subset associated with
poor survival. Genes Dev. 27, 1462–1472.
Cell 155, 462–477, October 10, 2013 ª2013 Elsevier Inc. 477