goalgoal--based measurement (gbm)based measurement (gbm
TRANSCRIPT

SENG 421:SENG 421:Software MetricsSoftware Metrics
GoalGoal--Based Software Based Software Measurement FrameworkMeasurement Framework
(Chapter 3)(Chapter 3)
Department of Electrical & Computer Engineering, University of Calgary
B.H. Far ([email protected])http://www.enel.ucalgary.ca/People/far/Lectures/SENG421/03/
ContentsContents Software measure classification Goal-based paradigms:
Goal-Question-Metrics (GQM) Goal-Question-Indicator-Metrics (GQIM)
Applications of GQM and GQIM
GoalGoal--Based Measurement (GBM)Based Measurement (GBM) The primary question in goal-based measurement: “What do we want to know or learn?”
instead of “What metrics should we use?” Because the answers depend on your goals, no fixed
set of metrics is universally appropriate. Instead of attempting to develop general-purpose
measures, one has to describe an adaptable process that users can use to identify and define measures that provide insights into their own development problem.
GBM ProcessGBM Process
Determining what to measure Identifying entities Classifying entries to be examined Determining relevant goals
Determining how to measure Inquire about metrics Assign metrics
Identifying EntitiesIdentifying Entities Product, process, resource [Fenton’ 91]. Artifacts, activities, agents [Armitage’ 94]. Both schemes are incomplete and haven’t enough
representational power. E.g., neither seems to deal with entities such as
“defects”. Is a defect a product, a process, or a resource? Is defect an artifact, activity, or agent?
Process, Product, ResourceProcess, Product, Resource ProcessProcess
A collection of software related activities usually associated with some timescale.
Different SE processes: development, maintenance, testing, reuse, configuration and management process, etc.
ProductProduct Any artifacts, deliverables or documents that result from
a process activity. ResourceResource
Entities required by a process activity.

Types of AttributesTypes of Attributes
Internal attributesInternal attributes Attributes that can be measured entirely in terms
of the process, product or resource itself separate from its behaviour e.g., size
External attributesExternal attributes Attributes that can be measured with respect to
how the process, product or resource relates to its environment through its behaviour e.g., quality
Sample Process Measures /1Sample Process Measures /1
Process Entities Attributes Possible Measures
developmentprocess
elapsed time Calendar days, working days
milestones Calendar dates
development effort Staff-hours, days, or months
phase containment Percent of total defects found in phase where introduced
process compliance Percent of tasks complying with standard procedures or directives
performance Number of tests passed divided by numberof tests executed
test process volume Number of tests scheduled
progress Number of tests executedNumber of tests passed
Sample Process Measures /2Sample Process Measures /2
Process Entities Attributes Possible Measures
detaileddesign
elapsed time calendar days, working days
design quality defect density: number of design defects found in down-stream activities divided by a measure of product size, such as function points or physical source lines of code.
maintenance cost dollars per yearstaff-hours per change request
Change request backlog
size number of change requests awaiting serviceestimated effort (staff-hours) for pending requests
Sample Product Measures /1Sample Product Measures /1Product Entities Attributes Possible Measures
system size number of modulesnumber of bubbles in a data-flow diagramnumber of function pointsnumber of physical source lines of codenumber of memory bytes or words required (or allocated)
defect density defects per KLOCdefects per function point
module length physical source lines of codelogical source statements
percent reused ratio of unchanged physical lines to total physical lines, comments and blanks excluded
Sample Product Measures /2Sample Product Measures /2Product Entities Attributes Possible Measures
unit number of linearly independent flowpaths
McCabe’s complexity
document length number of pages
line of code statement type type names
how produced name of production method
programming language language name
defect type type names
origin name of activity where introduced
severity an ordered set of severity classes
effort to fix staff-hours
Sample Resource MeasuresSample Resource Measures
Resource Entities Attributes Possible MeasuresAssigned staff team size number of people assigned
experience years of domain experienceyears of programming experience
CASE tools type name of typeIs used? yes/no (a binary classification)
time start date, due date calendar dateselapsed time daysExecution time CPU clocks

GQM Approach /1GQM Approach /1 Goal-Question-Metric (GQM) approach to process
metrics provides a framework for deriving measures from organization or business goals.
References: V.R. Basili and D. Weiss (1984), A Methodology for
Collecting Valid Software Engineering Data, IEEE Trans. Software Engineering, vol. 10, pp.728-738.
V.R. Basili and H.D. Rombach (1988), The Tame Project: Towards Improvement-Oriented Software Environments, IEEE Trans. Software Engineering, vol.14, pp.758-773.
Basili’s GQM Basili’s GQM Basili’s GQM process model [Basili 1992]Phase Description
1 Developing a set of corporate, division and project goals
2Generating questions that define those goals as completely as possible in
a quantifiable way
3Specifying measures (metrics) needed to be collected to answer those
questions and to track process and product conformance to the goals
4 Developing mechanisms for data collection
5Collecting, validating and analyzing the data in real time to provide
feedback to projects for corrective action, to assess conformance to the goals and make recommendations for future improvements
STTISTTI--KL’s GQMKL’s GQM GQM process model defined by the Software
Technology Transfer Initiative - Kaiserslautern (STTI-KL) in 1995 [Gresse 1995].
No. Phase Description
1Prestudy The collection of information which is relevant
to the introduction of a GQM-based measurement program
2Identification of the GQM goals
Based on the prestudy, the GQM goals are derived from the informal organizational improvement goals and project goals
3
Production of GQM plan
Finding out the implicit knowledge of people with respect to the measurement goal by interviewing; Merge the results; Refine a GQM plan; Review the GQM plan
STTISTTI--KL’s GQM (cont’d)KL’s GQM (cont’d)
No. Phase Description
4
Production of the measurement plan
Defining the data collection procedures and checking whether the prescribed data collection procedures are consistent with the project plan
5Collection and validation of the data
Collecting measurement data according to the defined procedures; validated and stored data
6 Analysis of the data Analyzing and interpreting of the collected data by feedback sessions
7 Packaging the experiences
Recording the results and experiences gained by the measurement program
Solingen’s GQMSolingen’s GQM
GQM process model defined by Solingen[Solingen et al. 1999]
No. Phase Procedures
1 PlanningEstablish GQM team; Select improvement area; Select application project and establish a project team; Create project plan; Training and promotion
2 Definition
Define measurement goals; Review or produce software process models; Conduct GQM interviews; Define questions and hypotheses; Review questions and hypotheses; Define metrics; Check on metric consistency and completeness; Produce a GQM plan; Produce measurement plan; Produce analysis plan; Review plans
Solingen’s GQM (cont’d)Solingen’s GQM (cont’d)
No. Phase Procedures
3 Data collectionDefining the data collection steps, forms, and using tools; Data collection start up and training; Building a measurement support system (MSS)
4 InterpretationPreparation of a feedback session; Holding a feedback session; Reporting interpretations of measurement results; Cost and benefits analysis of a measurement program

SEI’s GQMSEI’s GQM The goal-driven process model defined by Software
Engineering Institute (SEI) in1996 [Park 1996]. This GQM process model defines ten steps to fulfill
the task of developing a software measurement plan.
It focuses on the whole process of converting a business goal into several specific measurement goals and refining to a software measurement plan.
This process model is easy to understand and follow in that it works in a pipeline style, which means that the output of a step is the input of the next step [Chen 2003].
Comparison of ModelsComparison of Models
GQM Process Model Simplicity Clearness CompletenessProcess model defined in
by Basili 1992 X
Process model defined by STTI-KL in 1995 X
Process model defined by Solingen in 1999 X X
Goal-driven process defined by SEI in 1996
X X X
We will focus on thisWe will focus on this
GQM Approach /2GQM Approach /2
Goal:Goal: List major goals of development or maintenance project.
Question:Question: Derive from each goal the questions that must be answered to determine if the goals are being met.
Metrics:Metrics: Decide what must be measured in order to be able to answer the questions adequately.
GQM: Example /1GQM: Example /1
Example from Fenton’s Book
GQM: Example /2GQM: Example /2 You are manager for a software development team
and you have to decide upon the release time of your product. Construct a GQM tree related to this goal.
Goal: suitableRelease time
Questions:
What is reliability requirement?
What is current reliability?
What are time constraints?
Size of code
Number of failures discovered
Number of test cases
Hours of use
Number of person daysAvailable for testing
Days till deadline
GQM: Example /3GQM: Example /3 Construct a GQM graph for the goal of “improving improving
maintainability of your developed softwaremaintainability of your developed software”.

GQM: Data AnalysisGQM: Data Analysis Suppose that you propose to collect data to examine the
effects of programmer experience on development effort. You are expecting that effort (staff-hours) will decrease as the experience of the people assigned increases (Fig. a) but the collected data shows effort increasing with increasing experience (Fig. b). What may be wrong?
Technology factor? under-staffing? Cognitive overload? Rapidly changing requirements? staff morale? team-work problems?
Case Study: AT&T’s GQM Case Study: AT&T’s GQM
Goal: Better code base inspection Subgoals:
Better inspection planning: [Plan] Better monitor and control of the code: [Control] Improving code inspection: [Improve]
AT&T’s GQM /1AT&T’s GQM /1GA: Code inspection: PlanGA: Code inspection: Plan
Q1: How much does the inspection process cost? M1-1: Average effort per KLOC M1-2: Percentage of re-inspection Q2: How much calendar time does the inspection process
take? M2-1: Average effort per KLOC M2-2: Total KLOC inspected
AT&T’s GQM /2AT&T’s GQM /2GB: Code inspection: Monitor & controlGB: Code inspection: Monitor & control
Q1: What is the quality of the inspection software? M1-1: Average fault detected per KLOC M1-2: Average inspection rate M1M1--3:3: Average preparation rate Q2: To what degree did the staff conform to procedure? M2-1: Average inspection rate M2-2: Average preparation rate M2-3: Average lines of code inspected M2-4: Percentage of re-inspection Q3: What is the status of the inspection process? M3: Total KLOC inspected
AT&T’s GQM /3AT&T’s GQM /3GC: Code inspection: ImproveGC: Code inspection: Improve
Q1: How effective is the inspection process? M1-1: Defect removal efficiency M1-2: Average fault detected per KLOC M1-3: Average inspection rate M1-4: Average preparation rate M1-5: Average lines of code inspected Q2: What is the productivity of the inspection process? M2-1: Average effort per fault detected M2-2: Average inspection rate M2-3: Average preparation rate M2-4: Average lines of code inspected
Case Study: HP’s GQMCase Study: HP’s GQM
Three goals: A: Maximize customer satisfaction B: Minimize engineering effort and schedule C: Minimize defects

Example: HP’s GQMExample: HP’s GQM--A /1A /1GA: Maximize customer satisfaction.GA: Maximize customer satisfaction.
QA1: What are the attributes of customer satisfaction? MA1: Functionality, usability, reliability, performance, supportability.
QA2: What are the key indicators of customer satisfaction? MA2: Survey, quality function deployment (QFD).
QA3: What aspects result in customer satisfaction? MA3: Survey, QFD.
QA4: How satisfied are customers? MA4: Survey, interview record, number of customers severely affected
by defects. QA5: How many customers are affected by a problem?
MA5: Number of duplicate defects by severity
Example: HP’s GQMExample: HP’s GQM--A /2A /2GA: Maximize customer satisfaction.GA: Maximize customer satisfaction.
QA6: How many problems are affecting the customer? MA6-1: Incoming defect rate MA6-2: Open critical and serious defects MA6-3: Defect report/fix ratio MA6-4: Post-release defect density
QA7: How long does it take to fix a problem? MA7-1: Mean time to acknowledge problem MA7-2: Mean time to deliver solution MA7-3: Scheduled vs. actual delivery MA7-4: Customer expectation of time to fix
Example: HP’s GQMExample: HP’s GQM--A /2A /2GA: Maximize customer satisfaction.GA: Maximize customer satisfaction.
QA8: How does installing a fix affect the customer? MA8-1: Time customers operation is down MA8-2: Customers effort required during installation
QA9: Where are the bottlenecks? MA9: Backlog status, time spent doing different activities
Example: HP’s GQMExample: HP’s GQM--B /1B /1GB: Minimize engineering effort & schedule.GB: Minimize engineering effort & schedule.
QB1: Where are the worst rework loops in the process? MB1: Person-months by product-component-activity.
QB2: What are the total life-cycle maintenance and support costs for the product? MB2-1: Person-months by product-component-activity. MB2-2: Person-months by corrective, adaptive, perfective
maintenance. QB3: What development methods affect maintenance
costs? MB3: Pre-release records of methods and post-release costs.
Example: HP’s GQMExample: HP’s GQM--B /2B /2GB: Minimize engineering effort & schedule.GB: Minimize engineering effort & schedule.
QB4: How maintainable is the product as changes occur? MB4-1: Incoming problem rate MB4-2: detect density MB4-3: Code stability MB4-4: Complexity MB4-5: Number of modules changed to fix one detect
QB5: What will process monitoring cost and where are the costs distributed? MB5: Person-months and costs
QB6: What will maintenance requirements be? MB6-1: Code stability, complexity, size MB6-2: Pre-release defect density
Example: HP’s GQMExample: HP’s GQM--B /3B /3GB: Minimize engineering effort & schedule.GB: Minimize engineering effort & schedule.
QB7: How can we predict cycle time, reliability, and effort? MB7-1: Calendar time MB7-2: Person-month MB7-3: Defect density MB7-4: Number of detects to fix MB7-5: Defect report/fix ratio MB7-6: Code stability MB7-7: Complexity
MB7-8: Number of lines to change

Example: HP’s GQMExample: HP’s GQM--B /4B /4GB: Minimize engineering effort & schedule.GB: Minimize engineering effort & schedule.
QB8: What practices yield best results? MB8: Correlations between pre-release practices and customer
satisfaction data QB9: How much do the maintenance phase activities
cost? MB9: Personal-months and cost
QB10: What are major cost components? MB10: Person-months by product-component-activity
QB11: How do costs change over time? MB11: Track cost components over entity maintenance life-
cycle.
Example: HP’s GQMExample: HP’s GQM--C /1C /1GC: Minimize defectsGC: Minimize defects
QC1: What are key Indicators of process health and how are we doing? MC1: Release schedule met, trends of defect density, serious and
critical detects.
QC2: What are high-leverage opportunities for preventive maintenance? MC2-1: Defect categorization MC2-2: Code stability
QC3: Are fixes effective with less side effects? MC3: Defect report/fix ratio
Example: HP’s GQMExample: HP’s GQM--C /2C /2GC: Minimize defectsGC: Minimize defects
QC4: What is the post-release quality of each module? MC4: Defect density, critical and serious detects.
QC5: What are we doing right? MC5-1: Defect removal efficiency MC5-2: Defect report/fix ratio
QC6: How do we know when to release? MC6-1: Predicted defect detection and remaining defects. MC6-2: Test coverage.
Example: HP’s GQMExample: HP’s GQM--C /3C /3GC: Minimize defectsGC: Minimize defects
QC7: How effective is the development process in preventing defects? MC7: Post-release detect density
QC8: What can we predict will happen post-release based on pre-release data? MC8: Corrections between pre-release complexity, defect
density, stability, and customer survey data.
QC9: What defects are getting through and there causes? MC9: Detect categorization
Goal Based Software Goal Based Software Measurement: Measurement: GQ(I)M ProcessGQ(I)M Process
GQM Approach: ReviewGQM Approach: Review
Goal:Goal: List major goals of development or maintenance project.
Question:Question: Derive from each goal the questions that must be answered to determine if the goals are being met.
Metrics:Metrics: Decide what must be measured in order to be able to answer the questions adequately.

GQ(I)M: ConceptGQ(I)M: Concept
A methodology to convert a business goal into a measurement plan.
GQIM ProcessBusiness Goal Measurement
Plan
Business Goal: Reduce cost?
Measurement Plan:
1…………………….
2…………………….
GQ(I)M: PreceptsGQ(I)M: Precepts
The GQ(I)M method is based on 3 precepts, and it consists of 10 steps
The three precepts are: Measurement goals are derived from business
goals Evolving mental models provide context and
focus GQ(I)M translates informal business goals into
executable measurement structures
GQ(I)M ProcessGQ(I)M Process
10 steps of the GQIM process
A home brewed tool to automate this process exists (ISMS)
MG1MG1
Q1Q1 Q2Q2
MG1MG1
Q3Q3
I1I1 I2I2 I3I3 I4I4
M1M1
M2M2 M3M3
GG
II
MM
MG1MG1 MG1MG1
BG1BG1
Action PlanAction Plan
9) Identify actions9) Identify actions
10) Create plan10) Create plan
Create Action PlanCreate Action Plan
6) Identify questions and indicators6) Identify questions and indicators
7) Identify measures7) Identify measures
8) Define measures8) Define measures
Define IndicatorsDefine Indicators
1) Identify Business Goals1) Identify Business Goals
2) Identify what to know2) Identify what to know
3) Identify subgoals3) Identify subgoals
4) Identify entities & attributes4) Identify entities & attributes
5) Formalize Measurement Goals5) Formalize Measurement Goals
Identify GoalsIdentify Goals
MG1
Q1 Q2
MG1
Q3
I1 I2 I3 I4
M1
M2 M3
G
Q
I
M
MG1 MG1
BG1
Action Plan
9) Identify actions
10) Create plan
Create Action Plan
6) Identify questions and indicators
7) Identify measures
8) Define measures
Define Indicators
1) Identify Business Goals
2) Identify what to know
3) Identify subgoals
4) Identify entities & attributes
5) Formalize Measurement Goals
Identify Goals
GQ(I)M: Steps /1GQ(I)M: Steps /11. Identify business goals2. Identify what you want to know or learn3. Identify subgoals4. Identify entities and attributes related to
subgoals5. Formalize measurement goals
Measurementgoal
Businessgoal
GQ(I)M: Steps /2GQ(I)M: Steps /26. Identify quantifiable questions and indicators that
will be used to achieve measurement goals 7. Identify data elements that will be collected to
construct the indicators to answer questions8. Define measures to be used, and make these
definitions operational9. Identify actions that will be taken to implement the
measures10. Prepare a plan for implementing the measures
Measurementplan
Measurementgoal
GQ(I)M: Steps /3GQ(I)M: Steps /3 The GQ(I)M method
begins with identifying business goals and breaking them down into manageable subgoals.
It ends with a plan for implementing well-defined measures and indicators that support the goals.
It can also maintain traceability back to the business goals.
1
2
3 4
5
6
7
8 9 10

GQ(I)M: Process /1GQ(I)M: Process /1 Processes are composed of four types of elements:
Things (i.e., entities) they receive (e.g., inputs and resources)—these are used or consumed
Things (i.e., entities) they produce (e.g., outputs)—these include products, by-products, and effects
Things (i.e., entities) they consist of (e.g., activities, flowpaths, and agents)—the structure of the process
Things (i.e., entities) they hold or retain (e.g., internal artifacts, such as inventory and work in process)
consists of
holds
Process
receives produces
GQ(I)M: Process /2GQ(I)M: Process /2Receives …Receives …
Resources People, facilities, tools, money
Consumables Time, energy, effort
Guidelines and directions Policies, procedures, goals, constraints, rules, laws,
regulations, training, instructions Products and by-products from other processes
GQ(I)M: Process /3GQ(I)M: Process /3Consists of …Consists of …
Processes Tasks, steps, activities, subprocesses, transformations, reviews,
inspections
Controllers Flow controllers
Flowpaths Product paths, resource paths, data paths, control paths
Buffers and dampers Queues, stacks
GQ(I)M: Process /4GQ(I)M: Process /4
Holds …Holds … inventory materials work in process tools data knowledge experience
GQ(I)M: Process /5GQ(I)M: Process /5Produces …Produces …
ProductsRequirements, specifications, plans, architectures, preliminary designs, detailed designs, reviewed designs, code, reviewed code, integrated code, tested code, test cases, test results, tested components, change requests, documentation, defect reports, data
By-productsKnowledge, experience, skills, process improvements, waste and scrap data, defects
Step 1: Identify Business GoalsStep 1: Identify Business Goals The business goal can
be initiated at any organizational level
Examples: Reduce time to market
(TTM) Improve customer
satisfaction Improve quality of the
code
1
2

Templates Templates for Goal Definitionfor Goal Definition(1) Purpose(1) Purpose:: To (characterize, evaluate, predict, motivate, etc.)
the (process, product, model, metric, etc.) in order to (understand, assess, manage, engineer, learn, improve, etc.) it. Example: Evaluating maintenance process in order to improve it.
(2) Perspective(2) Perspective:: Examine the (cost, effectiveness, correctness, defects, changes, product measures, etc.) from the viewpoint of the (developer, manager, customer, etc.) Example: Examine the cost of software development from the
viewpoint of the manager.
Templates Templates for Goal Definitionfor Goal Definition(3) Environment(3) Environment:: The environment consists of the following:
process factors, people factors, problem factors, methods, tools, constraints, etc.
Example: The maintenance staff are poorly motivated programmers who have limited access to tools.
Step 1: Identify Goals Step 1: Identify Goals The output of Step 1 is a
sorted checklist of business goals (i.e., management goals, development goals, and maintenance goals, etc.) along with their definitions.
If more than one goal: generate plan for each goal separately.
Typical expansion rate: 1-4 times
Business Goal #1:
Business Goal #2:
Business Goal #3:
Business Goal #n:
Example Example
Primary Business Goal:Primary Business Goal:Saving money by improving productivity of software development team
Examine the effect of productivity of software development team on project costs(Analyzed from project manager’s perspective)
Step 2: Identify What to KnowStep 2: Identify What to Know
Step 2: Identify What to KnowStep 2: Identify What to Know Identifying what is needed to be known in order to understand, assess,
predict, or improve the activities related to achieving goals by asking questions such as: “What activities do we manage or execute?” “What do we want to achieve or improve?”
and by completing statements such as “To do this, we will need to…”
Repeat these questions several times and break top-level goals down into specific things should be accomplished and issues that are needed to be addressed.
The output of this step is the entity-question checklist. Make sure that entities addressed should be in four categories: input and resources, products and by-products, internal artefacts, and activities and flowpaths. For each entity, list questions that can help us address those business goals.
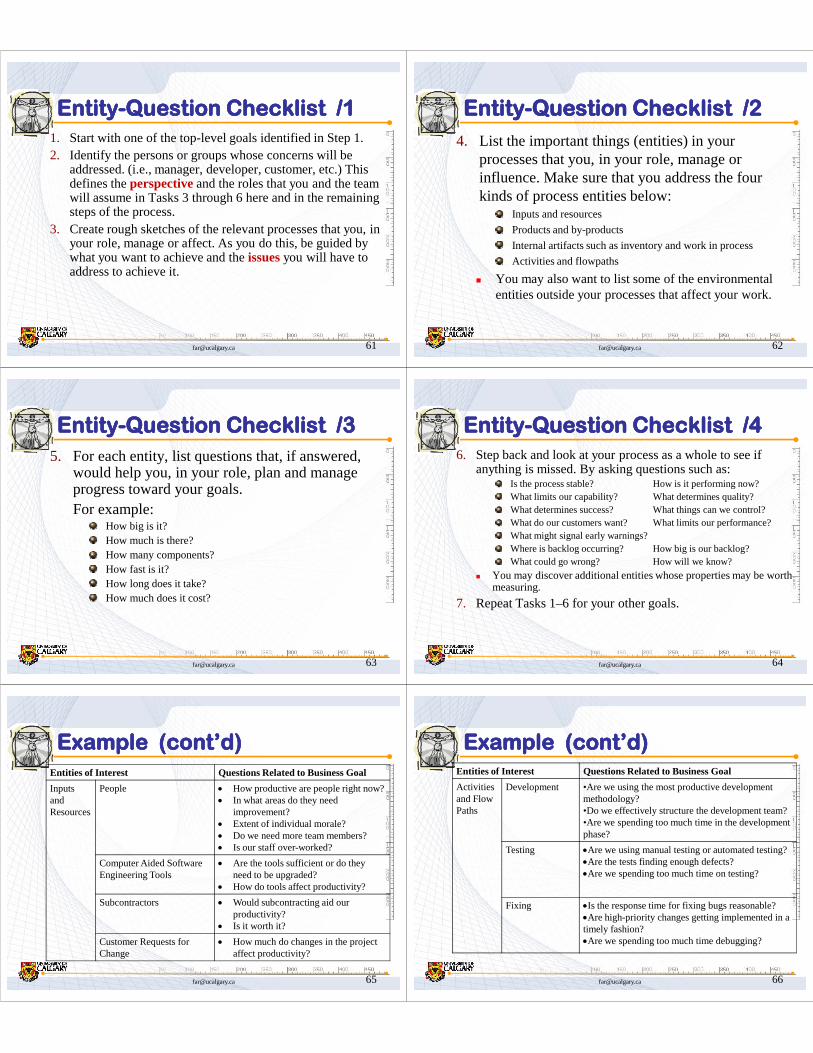
EntityEntity--Question Checklist /1Question Checklist /11. Start with one of the top-level goals identified in Step 1.2. Identify the persons or groups whose concerns will be
addressed. (i.e., manager, developer, customer, etc.) This defines the perspective and the roles that you and the team will assume in Tasks 3 through 6 here and in the remaining steps of the process.
3. Create rough sketches of the relevant processes that you, in your role, manage or affect. As you do this, be guided by what you want to achieve and the issues you will have to address to achieve it.
EntityEntity--Question Checklist /2Question Checklist /24. List the important things (entities) in your
processes that you, in your role, manage or influence. Make sure that you address the four kinds of process entities below:
Inputs and resourcesProducts and by-productsInternal artifacts such as inventory and work in processActivities and flowpaths
You may also want to list some of the environmental entities outside your processes that affect your work.
EntityEntity--Question Checklist /3Question Checklist /35. For each entity, list questions that, if answered,
would help you, in your role, plan and manage progress toward your goals. For example:
How big is it?How much is there?How many components?How fast is it?How long does it take?How much does it cost?
EntityEntity--Question Checklist /4Question Checklist /46. Step back and look at your process as a whole to see if
anything is missed. By asking questions such as:Is the process stable? How is it performing now?What limits our capability? What determines quality?What determines success? What things can we control?What do our customers want? What limits our performance?What might signal early warnings?Where is backlog occurring? How big is our backlog?What could go wrong? How will we know?
You may discover additional entities whose properties may be worth measuring.
7. Repeat Tasks 1–6 for your other goals.
Example (cont’d)Example (cont’d)Entities of Interest Questions Related to Business GoalInputs and Resources
People How productive are people right now? In what areas do they need
improvement? Extent of individual morale? Do we need more team members? Is our staff over-worked?
Computer Aided Software Engineering Tools
Are the tools sufficient or do they need to be upgraded?
How do tools affect productivity?Subcontractors Would subcontracting aid our
productivity? Is it worth it?
Customer Requests for Change
How much do changes in the project affect productivity?
Example (cont’d)Example (cont’d)Entities of Interest Questions Related to Business GoalActivities and Flow Paths
Development •Are we using the most productive development methodology?•Do we effectively structure the development team?•Are we spending too much time in the development phase?
Testing Are we using manual testing or automated testing?Are the tests finding enough defects?Are we spending too much time on testing?
Fixing Is the response time for fixing bugs reasonable?Are high-priority changes getting implemented in a timely fashion?Are we spending too much time debugging?

Example (cont’d)Example (cont’d)Entities of Interest Questions Related to Business GoalProducts and By-products
Documents Are the documents we produce readable?Is it possible to trace system features from one document to the next?
Source Code Is the source code consistent with the documents?Is the source code error free?Does source code follow programming standards?
Plans Do the plans change too much?Budget Do we have enough money to increase salaries and
invest in tools?
Step 3: Identify Subgoals /1Step 3: Identify Subgoals /1
Step 3: Identify Subgoals /2Step 3: Identify Subgoals /2 Grouping related questions helps identify subgoals In Step 3, you identify the questions that you have
about the entities, then group them and identify the issues they address.
Then groupings of issues and questions translate naturally into candidate subgoals.
Sometimes, you may find several issues mapping into a single subgoal, or single issues mapping into several subgoals.
Example (cont’d)Example (cont’d)Questions Related to Development Team ProductivityGROUPING #1(People)
How productive are our employees right now? In what areas do they need improvement? Extent of overall office morale? Do we need more team players? Is our staff over-worked?
GROUPING #2(Development)
Are the tools sufficient or do they need to be upgraded? How do tools affect productivity? Would subcontracting aid our productivity? Is it worth it? Are we using the most productive development
methodology? Are we spending too much time in the development phase? Is the source code consistent with the documents? Is the source code error free? Does source code follow programming standards? Do we have enough money to invest in tools?
Example (cont’d)Example (cont’d)Questions Related to Development Team ProductivityGROUPING #3(Response to Change)
How much do changes in the project affect productivity?Do the plans change too much?
GROUPING #4(Quality Assurance)
Are we using manual testing or automated testing?Are the tests finding enough defects?Are we spending too much time on testing?Is the response time for fixing bugs reasonable?Are high-priority changes getting implemented in a timely fashion?Are we spending too much time debugging?Do we need better testing to be done?Are the documents we produce readable?Is it possible to trace system features from one document to the next?
Example (cont’d)Example (cont’d)
Derived Subgoals (from Project Manager’s Perspective) Subgoal #1 Improve performance of staff Subgoal #2 Improve code development
processes Subgoal #3 Minimize the negative effects of
project changes in productivity Subgoal #4 Improve quality assurance

Step 4: Identify Entities & Step 4: Identify Entities & Attributes /1Attributes /1
4
Step 4: Identify Entities & Step 4: Identify Entities & Attributes /2Attributes /2
Once having a list of questions, you should examine each question and identify entities implicit in it. Then list pertinent attributes associated with each entity.
Pertinent attributes are those which, if quantified, help answer your question or establish a context for interpreting the answers.
Pertinent attributes are usually cited in the question, either explicitly or implicitly.
List of entities and the attributes for each entity are the principal outputs of this step.
The attributes will become candidates for the things that should be measured.
Example (cont’d)Example (cont’d) Subgoal 1: Improve the performance of our staff Question 1:
Currently, how productive is our development team? Entity:
Development team Attributes:
Team personality factors Expertise of the development organization Team’s analysis and design techniques Knowledge of programming languages
Example (cont’d)Example (cont’d) Subgoal 1: Improve the performance of our staff Question 2:
How is the overall office’s morale? Entity:
Working Environment Attributes:
Accommodations Incentives Extra-curricular activities Hardware and software used Work time to break time ratio Workspace (room and desk size, ventilation)
Example (cont’d)Example (cont’d) Subgoal 2: Improve Code Development Process Question 1:
Are we spending too much time in the development phase? Entity:
The development process Attributes:
Average duration of development process, per line of code Percentage of development process’ duration for average project Company expectations for percentage duration of code development
Example (cont’d)Example (cont’d) Subgoal 3: Minimize the negative effects of
project changes in productivity Question 1:
How much do changes in the project affect productivity? Entity:
Set of change requests received from the customer Attributes:
Number of change requests Estimated total effort to satisfy change requests Total effort for project

Example (cont’d)Example (cont’d) Subgoal 4: Improve quality assurance Question 1:
Are we using manual testing or automated testing?
Entity: Testing method
Attributes: Type (name of type) Is used? Yes/no (a binary classification)
Example (cont’d)Example (cont’d) Subgoal 4: Improve quality assurance Question 2:
How effective are the tests? Are we spending too much time on testing?
Entity: Testing
Attributes: Volume number of tests scheduled Progress number of tests executed
number of tests passed
Step 5: Formalize Measurement Step 5: Formalize Measurement Goals /1Goals /1
5
What is a Measurement Goal?What is a Measurement Goal? Business goals (or subgoals) are usually represented
by a phrase or sentence in natural language. A measurement goal (or subgoal) is a semi-formal
representation of a business goal (or subgoal), composed of 4 components: An object of interest (entity) A purpose A perspective
A description of environment & constraints
What is a Measurement Goal?What is a Measurement Goal? Traceability:Traceability: Measurement subgoals should be
traced back to the subgoals and business goals to show that they are consistent with the business objective.
Active & Passive Measurement Active & Passive Measurement GoalsGoals Active measurement goalsActive measurement goals are directed toward
controlling processes or causing changes to products, processes, resources, or environments. These are the kinds of goals that are found in project management and process improvement activities.
Passive measurement goals Passive measurement goals are meant to enable learning or understanding. Passive goals are often accomplished by characterizing objects of interest according to some productivity or quality model.

Active & Passive Measurement Active & Passive Measurement Goals: ExamplesGoals: Examples
Active Goals Meet the scheduled
completion date Reduce variability Improve product reliability Improve productivity of
the process Improve time-to-market Reduce employee turnover
Passive GoalsPassive Goals Understand the current
development process Identify root causes Assess product maintainability Identify capabilities and trends,
so that we can better predict future performance
Understand relationships among attributes, so that we can develop models for predicting and estimating
Measurement Goal: ObjectMeasurement Goal: Object Anything real or abstract, that we want to describe
or know more about is a potential object for measurement.
An object is an entity we want to describe with measured values.
Object of interest (entity):Object of interest (entity):_______________ a process, product,
resource, task,_______________ activity, agent,
artefact, metric,environment, etc.
Measurement Goal: PurposeMeasurement Goal: Purpose Purpose of a measurement activity may be to understand, predict, plan,
control, compare, assess, or improve some productivity or quality aspect of the object.
Examples include: cost, size, reliability, test coverage, responsiveness, peer review effectiveness, process compliance, time to market, quality, customer satisfaction.
Purpose:Purpose:characterize, analyze,
_______________ evaluate, etc.
the ___________ <entity>, <aspect>,<attribute(s)>, etc.understand, baseline, predict,
in order to __________ it. plan, control, assess, compare,improve, etc.
Measurement Goal: PerspectiveMeasurement Goal: Perspective The perspective identifies who is interested in the measurement results,
such as: developer, maintainer, manager, or customer. The perspective is stated to clarify the purpose of the measurement
activity.
Perspective:Perspective:Examine the ___________ modifiability, quality, changes,
defects, defect types, backlog, behaviour, stability, progress, <specific attribute(s)>, etc.
from the point of view of (the) _______________. developer, manager, customer,
engineer, process improvementteam, senior management, etc.
Measurement Goal: EnvironmentMeasurement Goal: Environment A description of environment provides a context for interpreting measurement
results. The environment includes everything that affects or is affected by the object to
be measured, such as time, resources, unusual performance criteria, etc., as well as constraints on the scope or time span of the measurement process itself.
Environment:Environment: List or otherwise describe the environmental factors & related
parameters that should be understood to put the observed results in context.
Focus on describing similarities to (and differences from) other familiar products, processes, and settings. This information becomes part of the database for future comparisons.
Factors and parameters to consider include:- application factors - customer factors- people factors - methods- resource factors - tools- process factors - constraints
Measurement Goal: TemplateMeasurement Goal: Template
Template for measurement (sub)goal:Object of interest: ___________
Purpose:__________ the __________ in order to __________ it.
Perspective:Examine the ______________from the point of view of (the) ___________________.
Environment:___________, ___________, ___________, ___________,___________, ___________, ___________, ___________,

Example (cont’d)Example (cont’d)Object of Interest: Development Team Purpose:
Determine a way to improve the productivity of our development team by evaluating their current productivity.
Perspective: Examine the team personality factors, expertise of the development
organization, team’s analysis and design techniques, knowledge of programming languages of our development team from project manager’s point of view.
Environment & Constraints: Payroll applications programming in C++ 100 software developers with 5 or more years experience in C++ Customers are businesses Do not maintain a reusable module database. Examine new projects completed and sold from 1/1/1995 to 31/12/2002.
Example (cont’d)Example (cont’d)Object of Interest: Working Environment Purpose:
Evaluate the working environment in order to identify opportunities in improving the productivity of our development team.
Perspective: Examine the ratio of work time to break time of our employees, the accommodations,
incentives, and extra-curricular activities offered to our employees, and the workspace (room and desk size, ventilation) where our employees work from the point of view of the employees themselves.
Environment & Constraints: Payroll applications programming in C++ 100 software developers with 5 or more years experience in C++ Customers are businesses Do not maintain a reusable module database. Examine new projects completed and sold from 1/1/1995 to 31/12/2002.
Example (cont’d)Example (cont’d)Object of Interest: CASE Tools Purpose:
Evaluate the impact of various CASE tools on the productivity of the development team.
Perspective: Examine the effectiveness of using various CASE tools to help in the
development of our product from the point of view of the developers and testers.
Environment & Constraints: Payroll applications programming in C++ 100 software developers with 5 or more years experience in C++ Customers are businesses Do not maintain a reusable module database. Examine new projects completed and sold from 1/1/1995 to 31/12/2002.
GQ(I)M: ReviewGQ(I)M: Review
1. Identify business goals (a list of goals in NL)2. Identify what you want to know or learn in order to
achieve the goals (what is? who is? in what way is involved?) (entity - question checklist)
3. Identify subgoals (subgoal - question list)4. Identify entities and attributes related to subgoals
(entities - attributes)5. Formalize measurement goals (MGs) (MG: entity,
purpose, perspective and environment)
Already presented in the previous session!Already presented in the previous session!
Business Goal Measurement
PlanGQIM Process
GQ(I)M: Next Steps /1GQ(I)M: Next Steps /16. Identify quantifiable questions and indicators that
will be used to achieve measurement goals.7. Identify data elements that will be collected to
construct the indicators.8. Define measures to be used, and make these
definitions operational.9. Identify actions that will be taken to implement
the measures.10. Prepare a plan for implementing the measures.
GQ(I)M: Next Steps /2GQ(I)M: Next Steps /2 The GQ(I)M method
begins with identifying business goals and breaking them down into manageable subgoals.
It ends with a plan for implementing well-defined measures and indicators that support the goals.
It can also maintain traceability back to the business goals.
1
2
3 4
5
6
7
8 9 10

Step 6: Identify Indicators /1Step 6: Identify Indicators /1 What is an indicator?
Indicator is a display of one or more measurement results that is designed to communicate or explain the significance of those results to the user.
Why is it useful? Seeing how measurement
data will be displayed helps clarify exactly what must be measured.
1
2
3 4
5
6
7
8 9 10
Step 6: Identify Indicators /2Step 6: Identify Indicators /2
How to proceed?1. Select a measurement goal2. Identify quantifiable questions related to this
goal that you would like to be answered. 3. Prepare sketches for displays (indicators) that
will help you address your questions. 4. Prioritize the indicators and identify the ones
that will be most useful to you.
Quantifiable QuestionQuantifiable Question
What is quantifiable question? How is it different from questions in Step 2?
Question: “Is there sufficient code inspection?”
(addresses a generic class of entities; answer: not necessarily numeric or logic)
Quantifiable Question: “What percentage of the code in Module A is inspected?”
(addresses a specific entity; answer: numeric or logic)
Example (cont’d)Example (cont’d)Measurement Goal 1: Development Team Questions: questions that we would like answered are:
What are the personality factors of all the development team members?
What is the rate at which individual engineers involved in software development produce software and associated documentation?
What design and analysis techniques are most effective in product development?
Is the development team structured to effectively utilize members’ skills?
How many years of experience do the team members have and in what domain?
Example (cont’d)Example (cont’d)
Measurement Goal #9: CASE Tools Questions:
How much would CASE tools cost? What percentage of the budget is available for
tools? Is the increase in productivity offset by the cost
of the tools? How long will we have to train employees with
the tools?
Example (cont’d) G9 / Ind. bExample (cont’d) G9 / Ind. bMeasurement Goal #9: How much would CASE tools cost?
Case Tool #1Case Tool #1 Case Tool #2Case Tool #2 Case Tool #3Case Tool #3
Cos
t 1
00
0 $
CD
NC
ost
10
00
$C
DN

Example (cont’d): G9 / Ind. aExample (cont’d): G9 / Ind. aMeasurement Goal #9: What percentage of the budget is available for
tools?RequirementsRequirements
DesignDesign
CodingCoding
TestTest
MaintenanceMaintenanceCase ToolCase Tool
Example (cont’d) G9 / Ind. c & dExample (cont’d) G9 / Ind. c & d
Measurement Goal #9: Is the increase in
productivity offset by the cost of the tools?
TimeTime
Productivity (LOC)Productivity (LOC)
afterafter
beforebefore
Average Average Cost per Cost per KLOCKLOC
withoutwithout withwith
CaseCasetool tool costcost
LOC LOC costcost
Example (cont’d): G9 / Ind. eExample (cont’d): G9 / Ind. eMeasurement Goal #9: How long will we have to train employees with the
tools?
Case Tool #1Case Tool #1 Case Tool #2Case Tool #2 Case Tool #3Case Tool #3
Day
s of
tra
inin
gD
ays
of t
rain
ing
Step 7: Identify Data ElementsStep 7: Identify Data ElementsAt this Step we must identify: Data elements that must be collected to construct the
indicators identified in Step 6 Definition of data elements, so that the indicators will show
what they are supposed to show.
7
Identify Data Elements (cont’d)Identify Data Elements (cont’d)
Data elements identification involves: Preparing a list of data items (attributes). Preparing a checklist cross-referencing data items
and indicators, i.e., which data element is used by which indicator.
Definitions for data items including scales, ranges and precision will be added in the next step.
Example (cont’d)Example (cont’d) List the data elements vs. the indicators identified in
Step 6.
Required Data Elements Required Data Elements IndicatorsIndicators

Step 8: Define Measure /1Step 8: Define Measure /1 What is a measure
definition? A measure definition is a
semi-formal specification for the object to be measured.
Why is it useful? It is extremely useful to
clarify the implicit assumptions, what is included and what is not in the measurement.
1
2
3 4
5
6
7
8 9 10
Step 8: Define Measure /2Step 8: Define Measure /2 After the measures are identified they must be
defined clearly Definitions must indicate:
Name and short description Scale Range of variation Precision required Implicit and explicit assumptions related to measurement,
what is included and what is not. Anything else that may help interpret the measurement
procedure and values correctly
Step 8: Example /1Step 8: Example /1 Measuring the height of school children, between
the ages of 6 and 12 Measure Definition 1: Height is standing height,
measured in inches. Measure Definition 2: Height is standing height
(exclusive of piled up hair and hats), measured in inches, bare foot, on a calibrated scale, by a trained nurse, between 8 and 9 o'clock in the morning.
Which set of height measurements is expected to be more reliable, more consistent across schools, and more fit for interpretation?
Step 8: Example /2Step 8: Example /2 The same applies to definitions such as:
The measure for software size is the number of non-commented, nonblank, executable source statements.
The measure for cost is the total direct labour hours from the start of the project.
These are ill-specified examples of definitions of measures that definitely lead to misinterpretations of measurements and recorded values.
Step 8: Define Measure /3Step 8: Define Measure /3 Measures can be best
defined using Definition checklists &
descriptive forms Advantages: Making
explicit many issues, assumptions and decisions that usually go unrecorded.
Example (cont’d) Example (cont’d)

Example (cont’d)Example (cont’d)
Step 9: Identify Actions to Step 9: Identify Actions to Implement MeasuresImplement Measures
This step is to assemble information about the current status and use of the measures, so as to prepare a plan for implementing the measures defined, through: Analysis & Diagnosis & Actions
1
2
3 4
5
6
7
8 9 10
Step 9.1: AnalysisStep 9.1: Analysis Analysis means identifying the measures that the
organization is using now and understanding how it is collecting them using questions such as: What data elements are required for our goal-driven
measures? Which data elements are collected now? How are they collected? What are the processes that provide the data? How are the data elements stored and reported?
Step 9.2: DiagnosisStep 9.2: Diagnosis Diagnosis means evaluating the data elements that the
organization is collecting now, determining how well they meet the needs of new measurements, and proposing appropriate actions for: Using the data, adapting data to the needs, adapting needs to the data
and obtaining what is missing. By asking questions such as:
What existing measures and processes can be used to satisfy data requirements?
What elements of measurement definitions or practices must be changed or modified?
What new or additional processes are needed?
Step 9.3: ActionStep 9.3: Action Action means translating the results of the analysis and
diagnosis into implementable steps. Action identifies elements that measurement plan will be
built upon. Some pre-planning tasks are: Identify sources of data within existing software process(es). Define methods that will be used to collect and report data. Identify tools that will be required to support collecting, reporting,
and storing data. Determine requirements (constraints) for points in time and
frequencies of measurement. Document data collection procedures.
Identify responsible persons and organizations. Determine where, how, and when to collect and report. Create sketches for the data collection records will be used.
Step 9.3: Action Item ChecklistStep 9.3: Action Item Checklist Define data elements (Step 8). Define frequencies of collection and points in the process where
measurements will be made. Define timelines required for moving measurement results from the
points of collection to databases or users. Create forms and procedures for collecting and recording data. Define how data is to be stored and how data will be accessed. Identify
who is responsible for designing the database and for entering, retaining, and overseeing the data.
Determine who will collect and access data. Assign responsibilities for these actions.
Define how data will be analyzed and reported. Identify supporting tools that must be developed or acquired to help you
automate and administer the process. Prepare a process guide for collecting data.

Step 10: Prepare a PlanStep 10: Prepare a Plan Measurement
implementation plan is based on analysis, diagnosis and actions (Step 9)
Measurement plan template includes:
1. Objective2. Description3. Implementation4. Sustained operations
1
2
3 4
5
6
7
8 9 10
Step 10: Plan Template /1Step 10: Plan Template /1
10.1 Objective10.1 Objective List the principal objectives of this measurement
implementation effort. Identify the measures to be implemented, explain
why they are important to the organization, and summarize the expected outcomes.
Step 10: Plan Template /2Step 10: Plan Template /210.2 Description10.2 Description
1.1. BackgroundBackground A brief history of the events that have led to or motivated this
plan. Describe the origins of the plan, the work that has been done to date and who participated. Relate the planned actions to other existing or concurrent measurement activities within the organization and (if appropriate) in those of customers or suppliers.
2.2. GoalsGoals List and explain the goals that motivate and guide the activities
under this plan by identifying three kinds of goals: (a) business goals, (b) measurement goals, and (c) the goals of this plan.
Step 10: Plan Template /3Step 10: Plan Template /310.2 Description10.2 Description
3.3. ScopeScope Relate the measures that this plan implements to the
measurement goals. Do the measures apply to new projects only? To development projects? To large or small programs? To only certain divisions or departments? Who are the major stakeholders? Who will be affected by the measurement practices, processes, and methods? Who will use the results? Identify the time span over which this plan is to be effective.
Step 10: Plan Template /4Step 10: Plan Template /410.2 Description10.2 Description
4.4. Relationship to other software process improvement Relationship to other software process improvement effortsefforts Describe how the measurement efforts in this plan relate to
other process improvement activities at the organization, such as the CMM, the Baldrige Award, or ISO 9000 certification.
5.5. Relationship to other functional activitiesRelationship to other functional activities Describe how the measurement efforts in this plan relate to
other functional groups and activities at the organization, such as cost estimating, time and effort reporting, cost accounting, and quality assurance.
Step 10: Plan Template /5Step 10: Plan Template /510.3 Implementation10.3 Implementation
Describe the actions that are to be taken to implement the measures identified in the Description. It includes detailed information on Activities, products, and tasks Schedules Resources Responsibilities Measurement and monitoring Assumptions Risk management

Step 10: Plan Template /6Step 10: Plan Template /6 3.1 Activities, Products, and Tasks3.1 Activities, Products, and Tasks
Describe how the effort is to be accomplished. Partition the effort into manageable activities, products, and tasks that can be used as a basis for planning, reporting, and control. For each activity, product, or task, state the objective and identify the principal subtasks. Where possible, identify entry and exit conditions that will determine start and completion of the task.
3.2 Schedule3.2 Schedule Describe when each activity, product, or task is to be accomplished.
Use PERT charts, or alternative displays to describe sequences and dependencies. Translate key actions, events, and deliverables into milestones so that performance can be tracked against plans.
Step 10: Plan Template /6Step 10: Plan Template /6 3.3 Resources3.3 Resources
Describe resources that are being allocated to this effort, such as: personnel, money, facilities, computer resources, etc.
3.4 Responsibilities3.4 Responsibilities Name individuals or groups that will be responsible for overseeing,
planning, implementing, managing, approving, and funding this effort. Assign responsibility and authority for acquiring tools, for training, and for implementing and operating databases.
3.5 Measurement and Monitoring3.5 Measurement and Monitoring Describe how the progress of implementing these measures will be
measured, analyzed, and reported. Identify replanning points and describe how significant schedule deviations or changes and revised funding needs will be handled.
Step 10: Plan Template /7Step 10: Plan Template /7 3.6 Assumptions3.6 Assumptions
Identify key assumptions upon which this plan is based. Key assumptions are ones which, if not satisfied, pose risks for successful implementation.
3.7 Risk management3.7 Risk management Describe how you will identify, assess, track, and do contingency
planning for the risk factors associated with the measurement implementation efforts covered by this plan. Describe actions that will be taken to monitor the assumptions, and provide mechanisms for reacting if assumptions are not met. Identify all places where planned schedules and resources differ from estimates and describe actions being taken to make the planned outcomes achievable.
Step 10: Plan Template /8Step 10: Plan Template /810.4 Sustained operations10.4 Sustained operations
Describe the actions that will be taken to sustain and use the measures implemented.
Assign resources and responsibilities and make provisions for continuing evolution.
Describe the practices that will be used to evaluate and monitor the effectiveness of the measures and to assess their business value and their effects on organizational performance.
Alternatively, if appropriate, provide direction and resources for preparing an operational plan for sustaining the collection, use, retention, evolution, and evaluation of these measures.
ExercisesExercises
Exercise /1Exercise /1 What different attributes might be measured by the
followings: The number of faults in program P using a set of test
cases created specifically for the program P. Failure (rate) intensity
The number of faults in program P using a standard set (benchmark) of test data. Code efficiency
The number of faults in program P by programmer Aduring 1 hour. (Individual) test efficiency

Exercise /3Exercise /3 A study of 1st grade school children found a high correlation
between shoe size and reading ability, i.e., “the bigger the shoe size the higher reading ability”. Does this mean that shoe size is a good measure of intelligence of 1st grade school children? Use the concept of scale and measurement verification to explain why. No. Shoe size correlates well with age. Age correlates well with reading ability. Neither would be a good measure, since neither would satisfy the conditions for measurement verification system. That is, the relationship between “shoe size” and “age” is not monotonically increasing for all members of population (e.g., some older students may have smaller shoe size) and also the relationship between “age” and “reading ability” is not monotonically increasing either (e.g, some younger kids may have higher reading ability).
Exercise 4 :GQM /1Exercise 4 :GQM /1 Suppose that company X’s main business goal is to “find a find a
way to deal with fragile customer requirementsway to deal with fragile customer requirements” – that is, customer requirements that may be incomplete or that may change during the software development process. For this project, we want to create a measurement plan using GQM technique. During the step of “identify what we want to know or learn” we must specify the followings: Persons affected Products and by-products Inputs and resources Internal artifacts Activities and flowpaths
Exercise 4 :GQM /2Exercise 4 :GQM /2
Ask at least one question for each of the (a) -(e) that will contribute to the goal.
a) Persons affected: Who are the people that will be affected by this goal?
b) Products and by-products: What are the products covered by this goal?
c) Inputs and resources: What resources are potentially involved?
d) Internal artifacts: What are the artifacts affected?e) Activities and flowpaths: What activities are involved?
Exercise 4 :GQM /3Exercise 4 :GQM /3
Identify at least 3 relevant candidates for each of the (a) - (e) for this project.
a) Persons affected: Who are the people that will be affected by this goal?Customers; Project Managers; Programmers; Document personnel; Testers
b) Products and by-products: What are the products covered by this goal?Documents; Working system; Budget
c) Inputs and resources: What resources are potentially involved?People; Computers and development environment; Customers
d) Internal artifacts: What are the artifacts affected?Prototype applications; Change requests; Project history and previous metrics
e) Activities and flowpaths: What activities are involved?Developing; Requirements gathering; Acceptance testing
Exercise /5Exercise /5 Your organization has just completed a software process
assessment. One of the findings was that your projects are delivering software functions and documentation on time, but customers are not as satisfied as you would like them to be.
The process improvement team has identified “improving customer satisfaction” as one of its primary goals.
You are a project manager, and you need a set of measures that will help your project make progress toward this goal.
Devise subgoals to achieve this goal.
Start with asking questions about entities of interest (i.e., inputs and resources; internal artefacts; activities and flows; products and by-products)
EntityEntity--Question List (Part 1)Question List (Part 1) Inputs and ResourcesInputs and Resources
People Are our people qualified to produce the results the customer wants?Is personnel turnover hampering product quality?
Subcontractors Are the practices of our subcontractors consistent with those of the activities they support?
Computers Is the target system meeting its performance requirements?Is the target system reliable?
Customer change requests
Do customer change requests contain the information that we must have to produce timely and effective changes?

EntityEntity--Question List (Part 2)Question List (Part 2) Internal ArtifactsInternal Artifacts
Customer changerequests (work in process)
How large is our backlog of customer change requests?Where are the backlogs occurring?
EntityEntity--Question List (Part 3)Question List (Part 3) Activities and FlowpathsActivities and Flowpaths
Development Is development progress visible to the customer?Testing Are our testing procedures adequate for the operational use of the
system?Does the customer accept the testing procedure and test results?
Fixing Is the response time for fixing bugs compatible with customer constraints?Is change control adhered to?Are high-priority changes getting implemented in a timely fashion?Are status and progress visible to the customer?
EntityEntity--Question List (Part 4)Question List (Part 4) Products and ByProducts and By--productsproductsDocuments Are the documents we produce readable?
Is it possible to trace system features from one document to the next?Are documents concise and complete?Is the terminology correct?
Source code & compiled products
Is the source code consistent with the documents?Is the source code error free?Does source code follow programming standards?Is the system response time adequate?Is the man-machine interface satisfactory?
Plans Are plans consistent with customer constraints?Are they kept up to date?Are plans and changes communicated to the customer?
Budget Are budgets consistent with plans?Are budgets consistent with customer constraints?
Grouping /1Grouping /1
Grouping #1(documents)
Are the documents we produce readable?Is it possible to trace system features from one document to the next?Are documents concise and complete?Is the terminology correct?
Grouping #2(softwareproduct)
Is the source code consistent with the documents?Is the source code error free?Does source code follow programming standards?Is the system response time adequate?Is the man-machine interface satisfactory?Is the target system meeting its performance requirements?Is the target system reliable?Is change control adhered to?Are testing procedures adequate for operational use of the system?
Grouping /2Grouping /2
Grouping #3(project management)
Are plans consistent with customer constraints?Are they kept up to date?Are budgets consistent with plans?Are budgets consistent with customer constraints?
Grouping #4(change management)
Do customer change requests contain the information that we must have to produce timely and effective changes?How large is our backlog of customer change requests?Is the response time for fixing bugs compatible with customer constraints?Is change control adhered to?Are high-priority changes getting implemented in a timely fashion?
Grouping /3Grouping /3
Grouping #5(communications)
Are plans and changes communicated to the customer?Is development progress visible to the customer?Does the customer accept the testing procedure and test results?Are status and progress of change requests visible to the customer?
Other Are our people qualified to produce the results the customer wants?Is personnel turnover hampering product quality?Are the practices of our subcontractors consistent with those of the activities they support?

Derived SubgoalsDerived Subgoals
Subgoal #1 Improve readability and traceability of documents.
Subgoal #2 Improve reliability and performance of released code.
Subgoal #3 Improve monitoring of plans and budgets.Subgoal #4 Improve performance of the change management
process.Subgoal #5 Improve communications with the customer.
Subgoal #6 Assess qualification of the personnel.#6 not directly related to the project manager