boards of commissioners update - fresno...
TRANSCRIPT

www.fresnohousing.org 1331 Fulton Street, Fresno, California 93721 (559) 443-8400 TTY (800) 735-2929
Boards of Commissioners Update March 2019
www.fresnohousing.org 1331 Fulton Street, Fresno, California 93721 (559) 443-8400 TTY (800) 735-2929
Boards of Commissioners Update – March 2019
Table of Contents
Topic: Page
Federal Budget Update 3
HAP Report – January 2019 8
BOARD UPDATE O (559) 443-8400 F (559) 445-8981
1331 Fulton Street Fresno, California 93721 T T Y (800) 735-2929
www.fresnohousing.org
Executive Summary
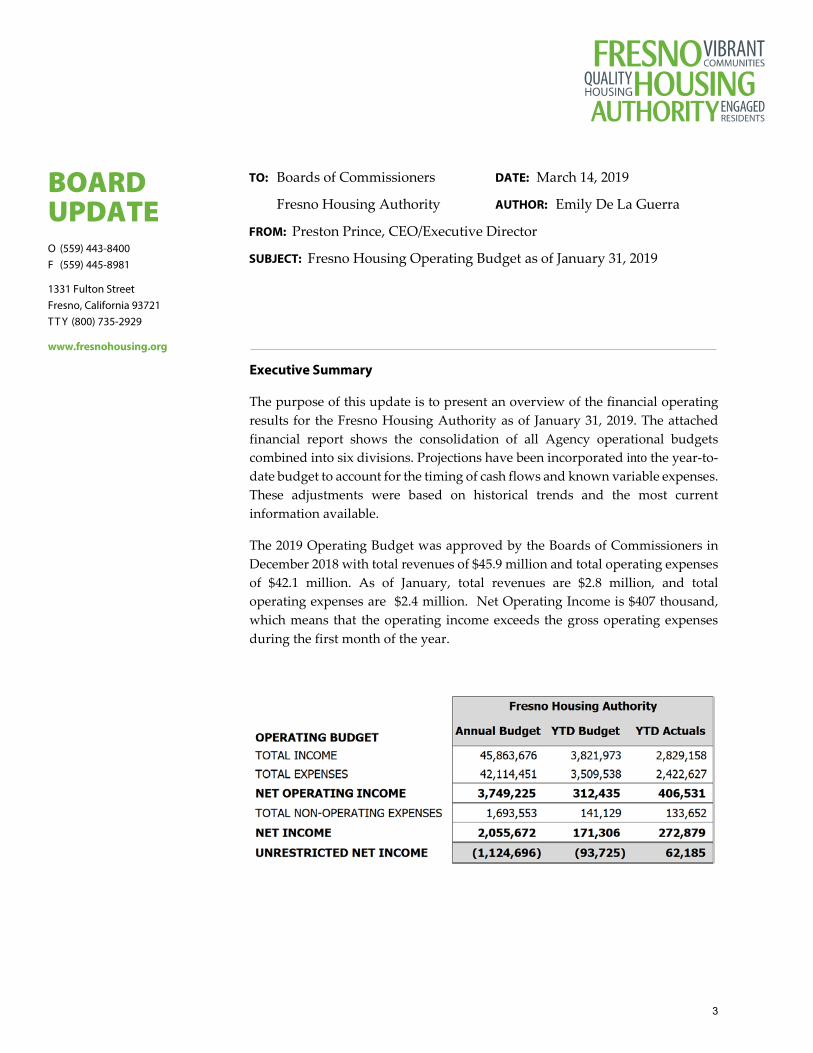
The purpose of this update is to present an overview of the financial operating results for the Fresno Housing Authority as of January 31, 2019. The attached financial report shows the consolidation of all Agency operational budgets combined into six divisions. Projections have been incorporated into the year-to-date budget to account for the timing of cash flows and known variable expenses. These adjustments were based on historical trends and the most current information available.
The 2019 Operating Budget was approved by the Boards of Commissioners in December 2018 with total revenues of $45.9 million and total operating expenses of $42.1 million. As of January, total revenues are $2.8 million, and total operating expenses are $2.4 million. Net Operating Income is $407 thousand, which means that the operating income exceeds the gross operating expenses during the first month of the year.
TO: Boards of Commissioners
Fresno Housing Authority
DATE: March 14, 2019
AUTHOR: Emily De La Guerra
FROM: Preston Prince, CEO/Executive Director
SUBJECT: Fresno Housing Operating Budget as of January 31, 2019
3

Agency Revenue
Overall, year-to-date revenue is $2.8 million, or 26% less than the year-to-date budget largely due to the timing of developer fee revenue in P&CD and interest income to Instrumentalities.
– Core: Admin & Management Fee Income in Core is less than budgeted due to a reduction in allocation revenue earned from Central Office charges, IT Services and Staff Development. Fees for these services are collected from Agency properties and programs, and the revenue is booked in Core. As of January, expenses related to Central Office, IT Services and Staff Development have been less than budgeted therefore, less revenue has been collected and the net effect on the overall budget is neutral.
– Inst.: The budget variance in Instrumentalities are mainly due to timing delays in bookkeeping. Interest income to HRFC is booked quarterly, so revenue will not be reflected in the budget report until March. Other Income to Instrumentalities is the transfer of funds from the Housing Authority to HRFC, which will need to be approved by the Boards in the second quarter.
– P&CD: No Developer Fees were received in January. Staff anticipates the developer fees for several projects that were budgeted will be received in the first and second quarters of 2019.
– AHD: HUD Grant Income is lower than budgeted due to the timing of reimbursements from non-HCV grants, including A Family Home and Resident Opportunities and Self-Sufficiency (ROSS).
– HSM: Contract income is lower than budgeted due to planned vacancies at the Parlier Migrant Center. The center is occupied on a seasonal basis and will be leased up in the spring.
4
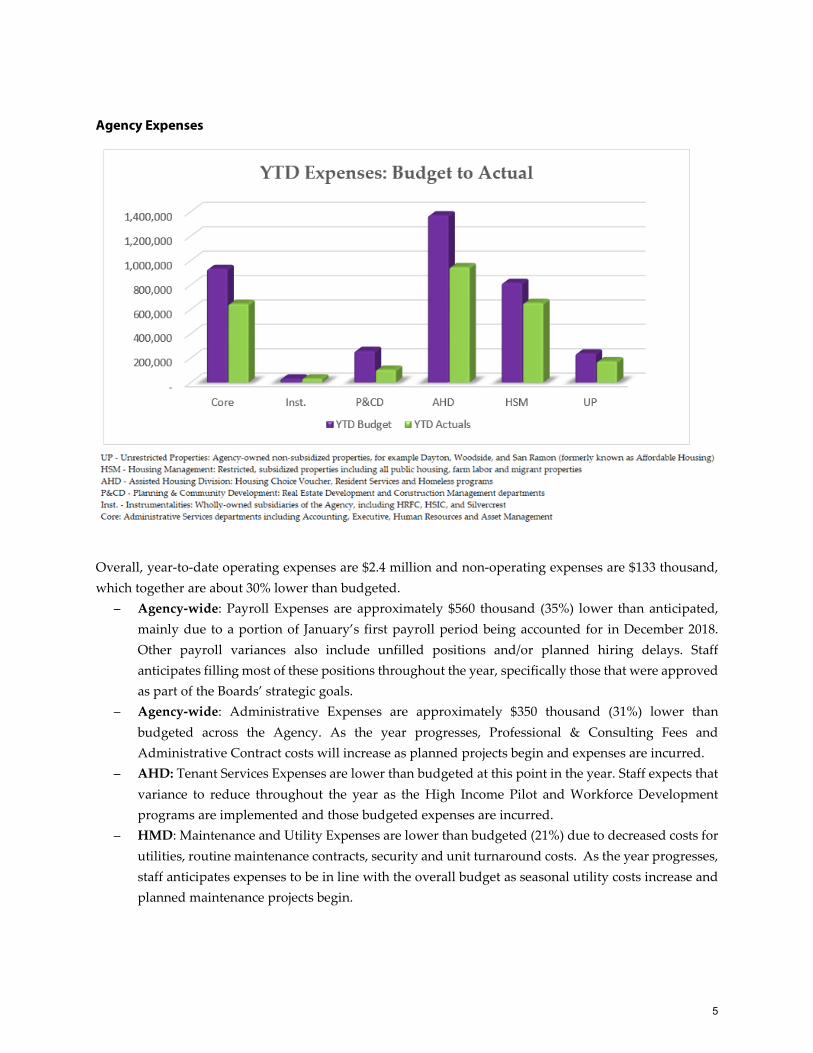
Agency Expenses
Overall, year-to-date operating expenses are $2.4 million and non-operating expenses are $133 thousand, which together are about 30% lower than budgeted.
– Agency-wide: Payroll Expenses are approximately $560 thousand (35%) lower than anticipated, mainly due to a portion of January’s first payroll period being accounted for in December 2018. Other payroll variances also include unfilled positions and/or planned hiring delays. Staff anticipates filling most of these positions throughout the year, specifically those that were approved as part of the Boards’ strategic goals.
– Agency-wide: Administrative Expenses are approximately $350 thousand (31%) lower than budgeted across the Agency. As the year progresses, Professional & Consulting Fees and Administrative Contract costs will increase as planned projects begin and expenses are incurred.
– AHD: Tenant Services Expenses are lower than budgeted at this point in the year. Staff expects that variance to reduce throughout the year as the High Income Pilot and Workforce Development programs are implemented and those budgeted expenses are incurred.
– HMD: Maintenance and Utility Expenses are lower than budgeted (21%) due to decreased costs for utilities, routine maintenance contracts, security and unit turnaround costs. As the year progresses, staff anticipates expenses to be in line with the overall budget as seasonal utility costs increase and planned maintenance projects begin.
5

Agency Net Income
– Unrestricted net income is approximately $156 thousand dollars higher than budgeted as of January 2019. This will decrease during the year, as new pilot programs begin.
– Restricted net income is lower than budgeted due to less revenue in Instrumentalities and HMD. Staff expects that these revenues will be received in the first and second quarter of 2019.
6
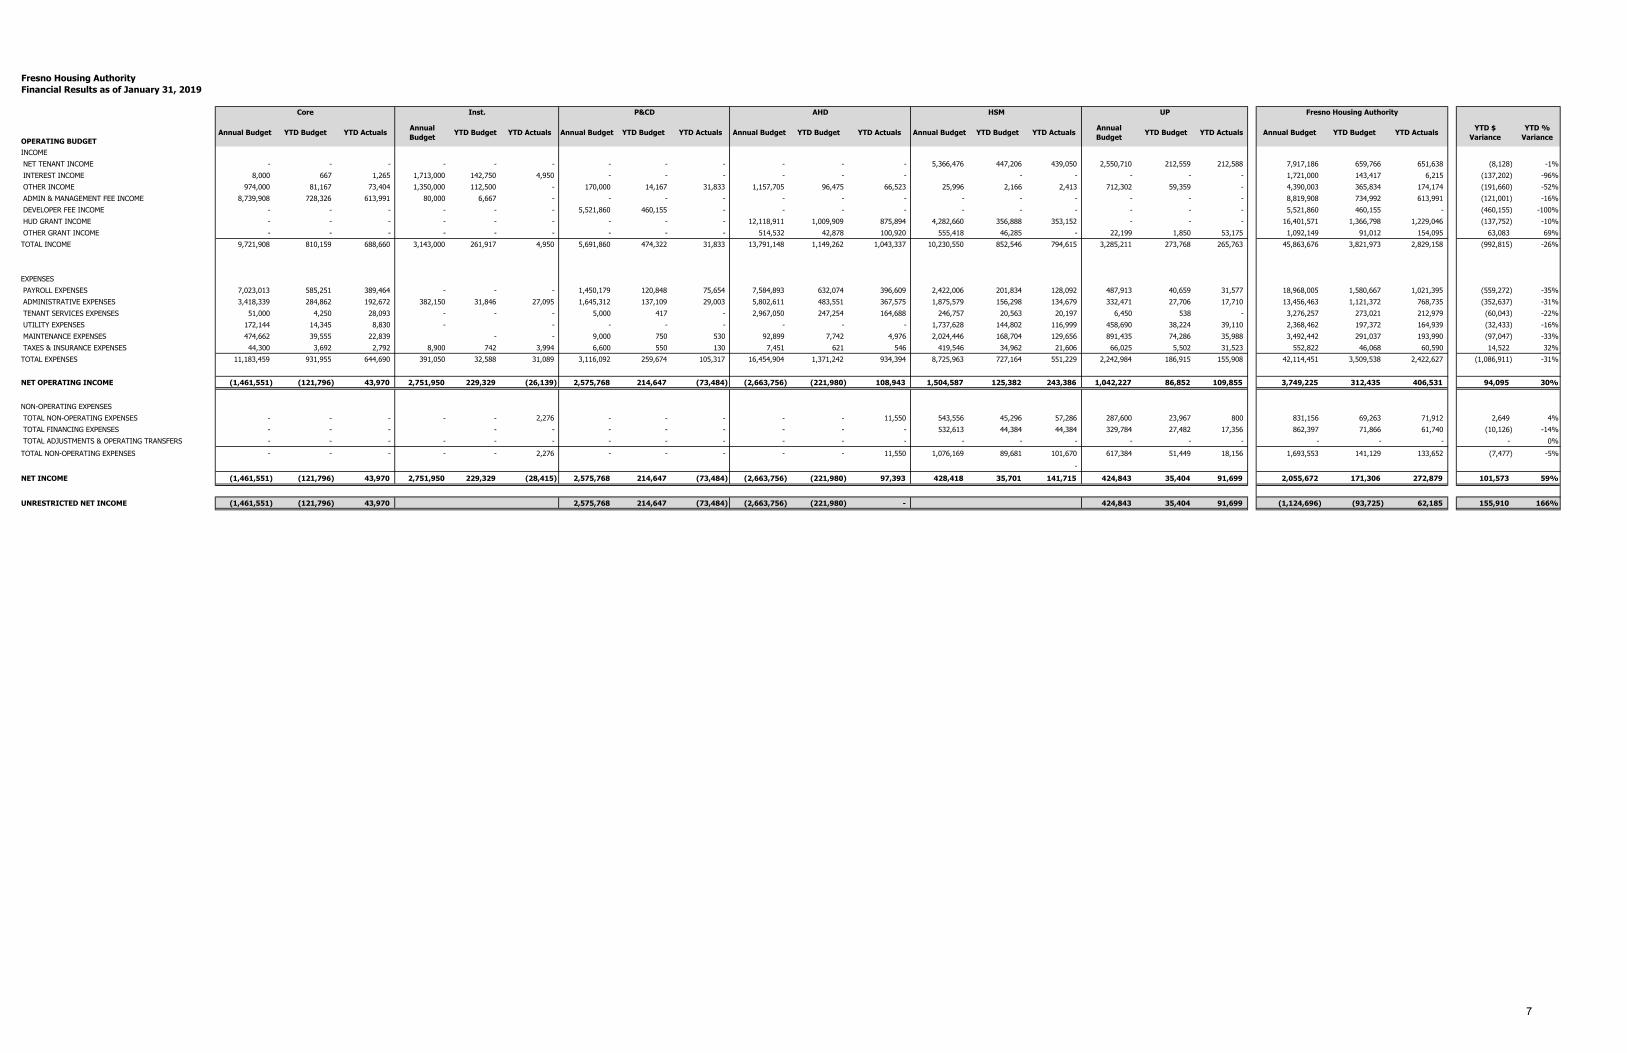
Fresno Housing Authority 1Financial Results as of January 31, 2019
OPERATING BUDGETAnnual Budget YTD Budget YTD Actuals Annual
Budget YTD Budget YTD Actuals Annual Budget YTD Budget YTD Actuals Annual Budget YTD Budget YTD Actuals Annual Budget YTD Budget YTD Actuals Annual Budget YTD Budget YTD Actuals Annual Budget YTD Budget YTD Actuals YTD $
VarianceYTD %
Variance
INCOME NET TENANT INCOME - - - - - - - - - - - - 5,366,476 447,206 439,050 2,550,710 212,559 212,588 7,917,186 659,766 651,638 (8,128) -1% INTEREST INCOME 8,000 667 1,265 1,713,000 142,750 4,950 - - - - - - - - - - - 1,721,000 143,417 6,215 (137,202) -96% OTHER INCOME 974,000 81,167 73,404 1,350,000 112,500 - 170,000 14,167 31,833 1,157,705 96,475 66,523 25,996 2,166 2,413 712,302 59,359 - 4,390,003 365,834 174,174 (191,660) -52% ADMIN & MANAGEMENT FEE INCOME 8,739,908 728,326 613,991 80,000 6,667 - - - - - - - - - - - - - 8,819,908 734,992 613,991 (121,001) -16% DEVELOPER FEE INCOME - - - - - - 5,521,860 460,155 - - - - - - - - - - 5,521,860 460,155 - (460,155) -100% HUD GRANT INCOME - - - - - - - - - 12,118,911 1,009,909 875,894 4,282,660 356,888 353,152 - - - 16,401,571 1,366,798 1,229,046 (137,752) -10% OTHER GRANT INCOME - - - - - - - - - 514,532 42,878 100,920 555,418 46,285 - 22,199 1,850 53,175 1,092,149 91,012 154,095 63,083 69%TOTAL INCOME 9,721,908 810,159 688,660 3,143,000 261,917 4,950 5,691,860 474,322 31,833 13,791,148 1,149,262 1,043,337 10,230,550 852,546 794,615 3,285,211 273,768 265,763 45,863,676 3,821,973 2,829,158 (992,815) -26%
EXPENSES PAYROLL EXPENSES 7,023,013 585,251 389,464 - - - 1,450,179 120,848 75,654 7,584,893 632,074 396,609 2,422,006 201,834 128,092 487,913 40,659 31,577 18,968,005 1,580,667 1,021,395 (559,272) -35% ADMINISTRATIVE EXPENSES 3,418,339 284,862 192,672 382,150 31,846 27,095 1,645,312 137,109 29,003 5,802,611 483,551 367,575 1,875,579 156,298 134,679 332,471 27,706 17,710 13,456,463 1,121,372 768,735 (352,637) -31% TENANT SERVICES EXPENSES 51,000 4,250 28,093 - - - 5,000 417 - 2,967,050 247,254 164,688 246,757 20,563 20,197 6,450 538 - 3,276,257 273,021 212,979 (60,043) -22% UTILITY EXPENSES 172,144 14,345 8,830 - - - - - - - - 1,737,628 144,802 116,999 458,690 38,224 39,110 2,368,462 197,372 164,939 (32,433) -16% MAINTENANCE EXPENSES 474,662 39,555 22,839 - - 9,000 750 530 92,899 7,742 4,976 2,024,446 168,704 129,656 891,435 74,286 35,988 3,492,442 291,037 193,990 (97,047) -33% TAXES & INSURANCE EXPENSES 44,300 3,692 2,792 8,900 742 3,994 6,600 550 130 7,451 621 546 419,546 34,962 21,606 66,025 5,502 31,523 552,822 46,068 60,590 14,522 32%TOTAL EXPENSES 11,183,459 931,955 644,690 391,050 32,588 31,089 3,116,092 259,674 105,317 16,454,904 1,371,242 934,394 8,725,963 727,164 551,229 2,242,984 186,915 155,908 42,114,451 3,509,538 2,422,627 (1,086,911) -31%
NET OPERATING INCOME (1,461,551) (121,796) 43,970 2,751,950 229,329 (26,139) 2,575,768 214,647 (73,484) (2,663,756) (221,980) 108,943 1,504,587 125,382 243,386 1,042,227 86,852 109,855 3,749,225 312,435 406,531 94,095 30%
NON-OPERATING EXPENSES TOTAL NON-OPERATING EXPENSES - - - - - 2,276 - - - - - 11,550 543,556 45,296 57,286 287,600 23,967 800 831,156 69,263 71,912 2,649 4% TOTAL FINANCING EXPENSES - - - - - - - - - - - 532,613 44,384 44,384 329,784 27,482 17,356 862,397 71,866 61,740 (10,126) -14% TOTAL ADJUSTMENTS & OPERATING TRANSFERS - - - - - - - - - - - - - - - - - - - - - - 0%TOTAL NON-OPERATING EXPENSES - - - - - 2,276 - - - - - 11,550 1,076,169 89,681 101,670 617,384 51,449 18,156 1,693,553 141,129 133,652 (7,477) -5%
- NET INCOME (1,461,551) (121,796) 43,970 2,751,950 229,329 (28,415) 2,575,768 214,647 (73,484) (2,663,756) (221,980) 97,393 428,418 35,701 141,715 424,843 35,404 91,699 2,055,672 171,306 272,879 101,573 59%
UNRESTRICTED NET INCOME (1,461,551) (121,796) 43,970 2,575,768 214,647 (73,484) (2,663,756) (221,980) - 424,843 35,404 91,699 (1,124,696) (93,725) 62,185 155,910 166%
Fresno Housing AuthorityCore Inst. P&CD AHD HSM UP
7
BOARD UPDATE O (559) 443-8400 F (559) 445-8981
1331 Fulton Mall Fresno, California 93721 T T Y (800) 735-2929
www.fresnohousing.org
Executive Summary
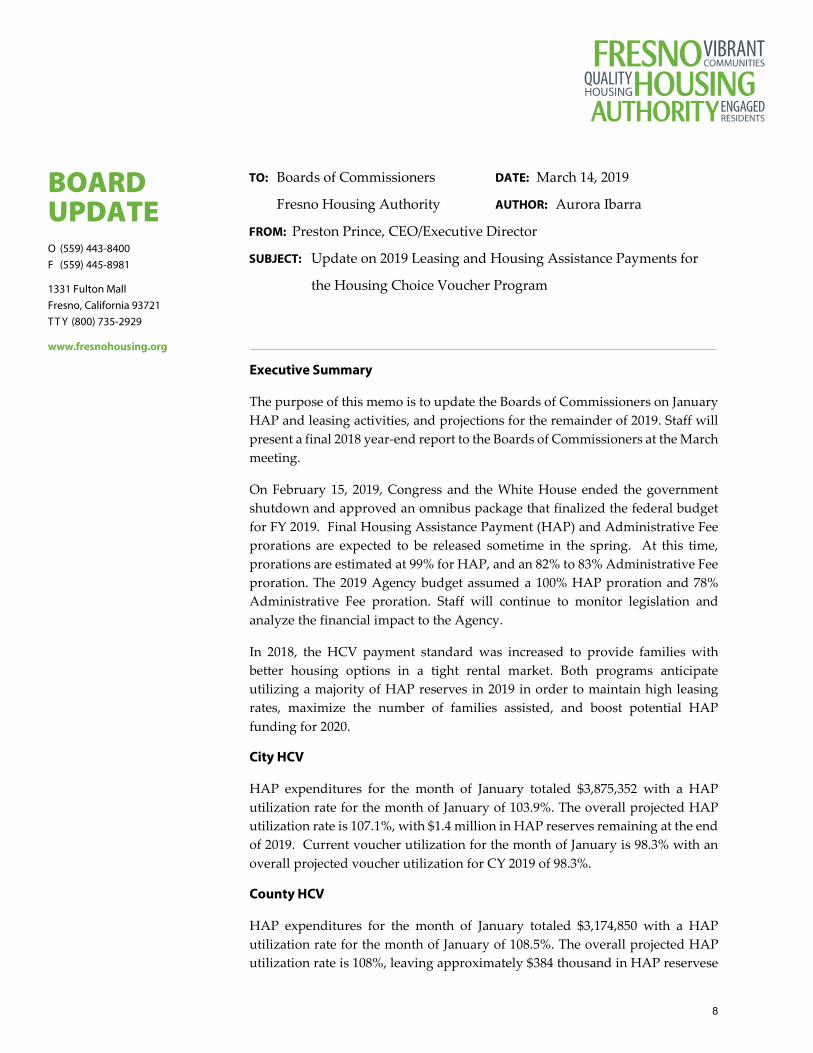
The purpose of this memo is to update the Boards of Commissioners on January HAP and leasing activities, and projections for the remainder of 2019. Staff will present a final 2018 year-end report to the Boards of Commissioners at the March meeting.
On February 15, 2019, Congress and the White House ended the government shutdown and approved an omnibus package that finalized the federal budget for FY 2019. Final Housing Assistance Payment (HAP) and Administrative Fee prorations are expected to be released sometime in the spring. At this time, prorations are estimated at 99% for HAP, and an 82% to 83% Administrative Fee proration. The 2019 Agency budget assumed a 100% HAP proration and 78% Administrative Fee proration. Staff will continue to monitor legislation and analyze the financial impact to the Agency.
In 2018, the HCV payment standard was increased to provide families with better housing options in a tight rental market. Both programs anticipate utilizing a majority of HAP reserves in 2019 in order to maintain high leasing rates, maximize the number of families assisted, and boost potential HAP funding for 2020.
City HCV
HAP expenditures for the month of January totaled $3,875,352 with a HAP utilization rate for the month of January of 103.9%. The overall projected HAP utilization rate is 107.1%, with $1.4 million in HAP reserves remaining at the end of 2019. Current voucher utilization for the month of January is 98.3% with an overall projected voucher utilization for CY 2019 of 98.3%.
County HCV
HAP expenditures for the month of January totaled $3,174,850 with a HAP utilization rate for the month of January of 108.5%. The overall projected HAP utilization rate is 108%, leaving approximately $384 thousand in HAP reservese
TO: Boards of Commissioners
Fresno Housing Authority
DATE: March 14, 2019
AUTHOR: Aurora Ibarra
FROM: Preston Prince, CEO/Executive Director
SUBJECT: Update on 2019 Leasing and Housing Assistance Payments for
the Housing Choice Voucher Program
8

at the end of 2019. Current voucher utilization for the month of January is 102.5% with an overall projected voucher utilization for CY 2019 of 99.2%.
Leasing Update
Staff reviewed leasing trends beginning with the number of applicants pulled from the interest list, applicant attendance rates at scheduled appointments, voucher issuance rates, and the most recent leasing success rates. After analyzing the trends, the department’s leasing strategy is expected to balance leasing activities this year and leading into the next year. Based on current attendance rates and leasing trends, the Agency expects to exhaust the current wait list in May 2019, and staff expects to open the interest list for the HCV program in that same month.
9

HCV Leasing and Spending Projection
HAP expenditures for January totaled $3,875,352 with a HAP utilization rate for the month of January of 103.9%. Current voucher utilization for the month of January is 98.3% with an overall projected voucher utilization rate for CY 2019 of 98.3% (Non-VASH).
Year 1 PUC(Average monthly cost of a voucher - Year 1)
$571 91-120 Days121-150 Days 14%
31-60 Days61-90 Days
CA006 Summary
Under this scenario, the PHA faces an offset of $446,325 this year and no offset the following year. Additionally, the higher of this year's leased units (98.3%) or dollars (107.1%) is 107.1%, indicating full leasing indicator points in SEMAP. This is an estimate.
22%
After deciding upon the above variables, the largest driver of the program revolves around the decision to issue vouchers. This scenario includes issuing 3,048 in the 2019, which includes new admissions and moves. Please see the below graph, which shows issued vouchers and associated leasing, as well as the total program UMLs, which takes into account attrition:
29%
Leased in10%
19%
CA006 Two-Year Voucher Forecasting Summary
3/14/2019
Prepared for: Prepared by:City Board of Commissioners Housing Choice Department
Under the Housing Choice Voucher (HCV) Two-Year Tool, which allows a user to examine a PHA's voucher program under a variety of leasing, per-unit cost (PUC), and other key program scenarios, the Two-Year Tool estimates the program to end the current year with $1,382,674 HAP reserves, or 3% of budget authority. This scenario relies upon the following key variables:
Success Rate(How many issued vouchers will go to HAP)
53%
Attrition Rate(What percent of partipants annually leave)
0-30 Days
Time from Issuance to HAP Effective Date(How fast do successful issuances lease up)
Percent16%
6,700
6,750
6,800
6,850
6,900
6,950
7,000
7,050
7,100
7,150
7,200
0
50
100
150
200
250
300
350
400
UM
LSIs
suan
ces
Leasing
Vouchers issued or projected to be issued Projected New Leasing from Issued Vouchers
Actual or Projected Units Leased
10
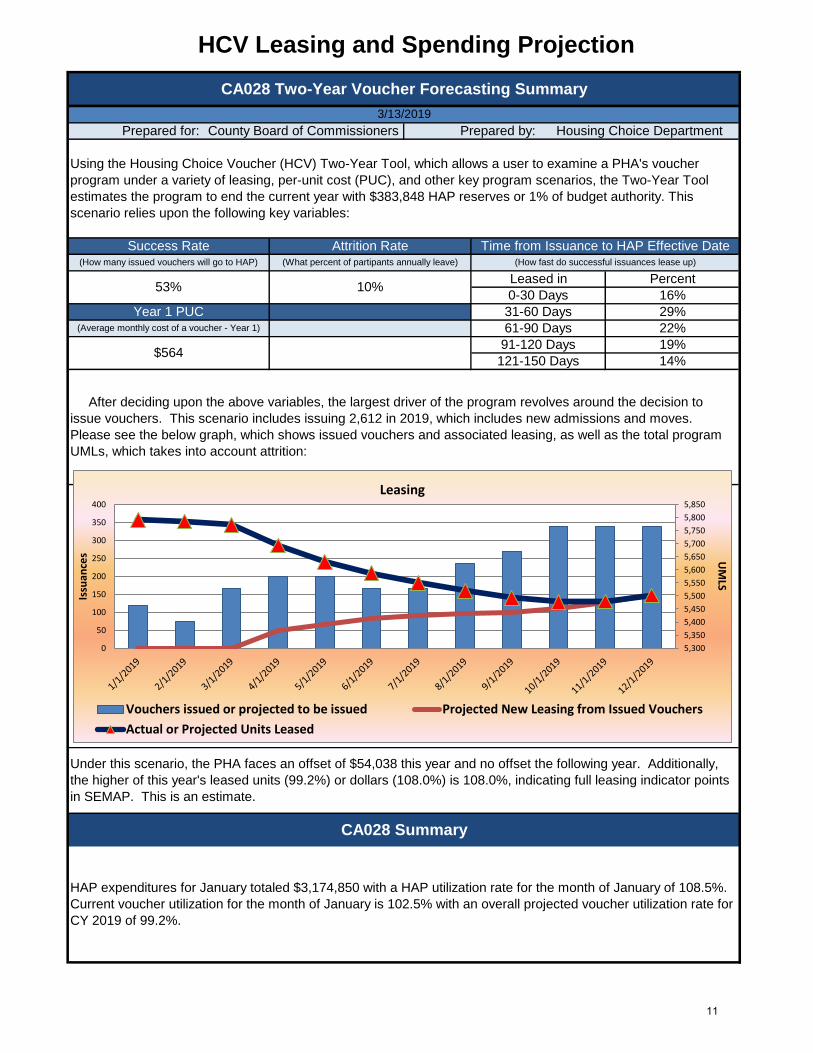
HCV Leasing and Spending Projection
Using the Housing Choice Voucher (HCV) Two-Year Tool, which allows a user to examine a PHA's voucher program under a variety of leasing, per-unit cost (PUC), and other key program scenarios, the Two-Year Tool estimates the program to end the current year with $383,848 HAP reserves or 1% of budget authority. This scenario relies upon the following key variables:
Success Rate(How many issued vouchers will go to HAP)
53%
Attrition Rate(What percent of partipants annually leave)
0-30 Days
Time from Issuance to HAP Effective Date(How fast do successful issuances lease up)
Percent16%
CA028 Two-Year Voucher Forecasting Summary
3/13/2019Prepared for: Prepared by:County Board of Commissioners Housing Choice Department
After deciding upon the above variables, the largest driver of the program revolves around the decision to issue vouchers. This scenario includes issuing 2,612 in 2019, which includes new admissions and moves. Please see the below graph, which shows issued vouchers and associated leasing, as well as the total program UMLs, which takes into account attrition:
29%
Leased in10%
19%
HAP expenditures for January totaled $3,174,850 with a HAP utilization rate for the month of January of 108.5%. Current voucher utilization for the month of January is 102.5% with an overall projected voucher utilization rate for CY 2019 of 99.2%.
Year 1 PUC(Average monthly cost of a voucher - Year 1)
$564 91-120 Days121-150 Days 14%
31-60 Days61-90 Days
CA028 Summary
Under this scenario, the PHA faces an offset of $54,038 this year and no offset the following year. Additionally, the higher of this year's leased units (99.2%) or dollars (108.0%) is 108.0%, indicating full leasing indicator points in SEMAP. This is an estimate.
22%
5,300
5,350
5,400
5,450
5,500
5,550
5,600
5,650
5,700
5,750
5,800
5,850
0
50
100
150
200
250
300
350
400
UM
LSIs
suan
ces
Leasing
Vouchers issued or projected to be issued Projected New Leasing from Issued Vouchers
Actual or Projected Units Leased
11