boe report student performance nwea maps assessment june
TRANSCRIPT
BOE Report Student Performance NWEA MAPS Assessment
June 8, 2016
USD 253 Board of Education Goals for Student Achievement: Maintain a plan that consistently moves every student to read on or above grade level by the end of 3rd
grade; and monitor and support a plan of action that will maintain or improve that level of excellence at subsequent grade levels while effectively supporting students not reading at grade level.
Rank consistently in the top quartile of Kansas/national school districts within the next five years for students prepared to be college and career ready.
Curriculum, Instruction and Assessment updates since 2010:
Adopted and aligned curriculum to Kansas College & Career Ready Standards (KCCRS) Began to develop common and benchmark assessments aligned to KCCRS Adopted Math Expressions (K5), Big Ideas (68), and Big Ideas (High School) Algebra 1, Geometry,
and Algebra 2 Adjusted how professional development is embedded and delivered by instructional coaches and
mentors Aligned Imagine It! to district CCR curriculum Implemented Literacy First framework districtwide STREAM Project Focused on increasing the number of students who are on track to be CCR Maintained PLC structure and created opportunities to embed into daily activities Aligned assessments to CCR expectations (state assessments changed each of the last 3 years) Developed and began to implement local benchmark assessments in ELA and Mathematics Transitioned to SchoolNet as the data warehouse system CoIIN Grant (implemented Fall 2015) in partnership with Crosswinds Counseling and Wellness to
share our collaborative experiences with a National panel of social/emotional learning experts
1

NWEA MAP Assessment Overview: The Northwest Evaluation Agency (NWEA) Reading and Mathematics Measures of Academic Progress (MAP) assessment is one piece of data the district uses to monitor academic progress. The MAP assessment is given to all students in grades K through 10 in the fall and to all students in grades K through 9 in the spring. About every three years, NWEA does a norming study to establish new gradelevel norms for each grade. We utilized the 50th percentile as the lower bound for students performing on grade level. In addition to gradelevel norming, NWEA provides a Kansas Assessment Program (KAP) Linking to NWEA MAP assessment research study. We use the linking study to summarize the percent of students who are on grade level (OGL) and on track to be college ready (CR). Table 1 and Table 2 describe the relationship between the Kansas Assessments and the MAP assessments for Reading and Mathematics. NWEA only supplies information for grades 38 and 10; the grey cells indicate estimates. As a reminder, students who score in Level 2, Level 3 and Level 4 are considered to be OGL while students who score in Level 3 and Level 4 are considered on track to be College Ready.
Table 1:
Table 2:
2
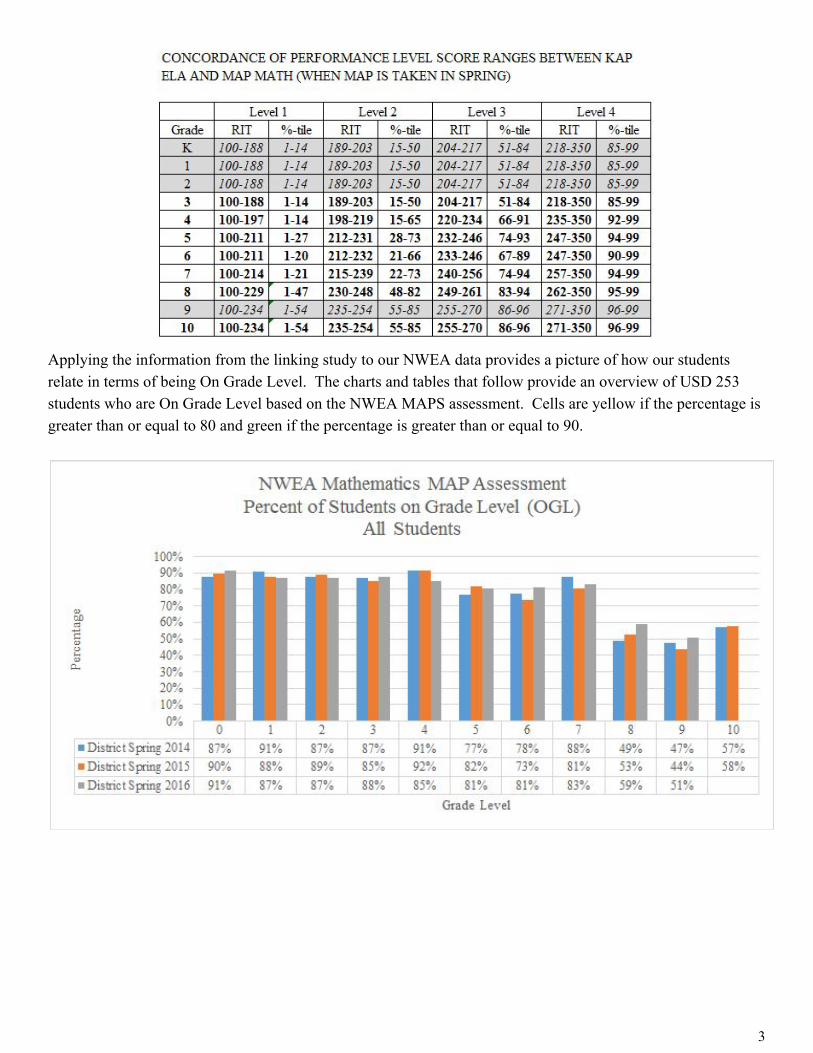
Applying the information from the linking study to our NWEA data provides a picture of how our students relate in terms of being On Grade Level. The charts and tables that follow provide an overview of USD 253 students who are On Grade Level based on the NWEA MAPS assessment. Cells are yellow if the percentage is greater than or equal to 80 and green if the percentage is greater than or equal to 90.
3

As a district, the percentage of students on grade level in Mathematics, based on the Kansas Linking Study, has increased from 78.2% in Spring 2014 to 79.3% in Spring 2016. Furthermore, the percentage of 9th grade students on grade level has increased from 47% in Spring 2014 to 51% in Spring 2016; the percentage of middle school students performing on grade level has increased from 71% in Spring 2014 to 74% in Spring 2016. This growth is highlighted by 81% of 6th graders and 83% of 7th performing on grade level in Spring 2016. Finally, the percentage of elementary students performing on grade level has remained constant at approximately 86% since Spring 2014. While the overall trend has been steady in the elementary, Kindergarten, 3rd grade, and 5th grade demonstrated improvement from Spring 2014 to Spring 2016.
4

5

As a district, the percentage of students on grade level in Reading based on the Kansas Linking Study has increased from 78.2% in Spring 2014 to 80.1% in Spring 2016. Furthermore, the percentage of 9th grade students on grade level has increased from 63% in Spring 2014 to 71% in Spring 2016. The percentage of middle school students performing on grade level has increased from 73% in Spring 2014 to 76% in Spring 2016. This growth is highlighted by 78% of 6th graders and 80% of 8th graders performing on grade level in Spring 2016. Finally, the percentage of elementary students performing on grade level has remained constant at approximately 83% since Spring 2014. While the overall trend has been steady in the elementary, 2nd grade has improved from 71% in Spring 2014 to 80% in Spring 2016, 4th grade has improved from 89% in Spring 2014 to 92% in Spring 2016, and 5th grade has improved from 85% in Spring 2014 to 90% in Spring 2016.
6

In addition to On Grade Level status, we use the Kansas Assessment Linking study data to generalize our students as on track to be College Ready. As a reminder, students who score in Level 3 and Level 4 are considered to be on track to be CR.
7

As a district, the percentage of students on track to be College Ready in Mathematics based on the Kansas Linking Study has increased from 35.8% in Spring 2014 to 36.6% in Spring 2016. Furthermore, the percentage of 9th grade students on track to be College Ready has increased from 14% in Spring 2014 to 17% in Spring 2016. The percentage of middle school students on track to be College Ready has increased from 16% in Spring 2014 to 24% in Spring 2016. This growth is highlighted by 31% of 6th graders being on track to be College Ready in Spring 2016. Finally, the percentage of elementary students on track to be College Ready was 48.6% in Spring 2014, 50.4% in Spring 2015 and 45.3% in Spring 2016.
8
9
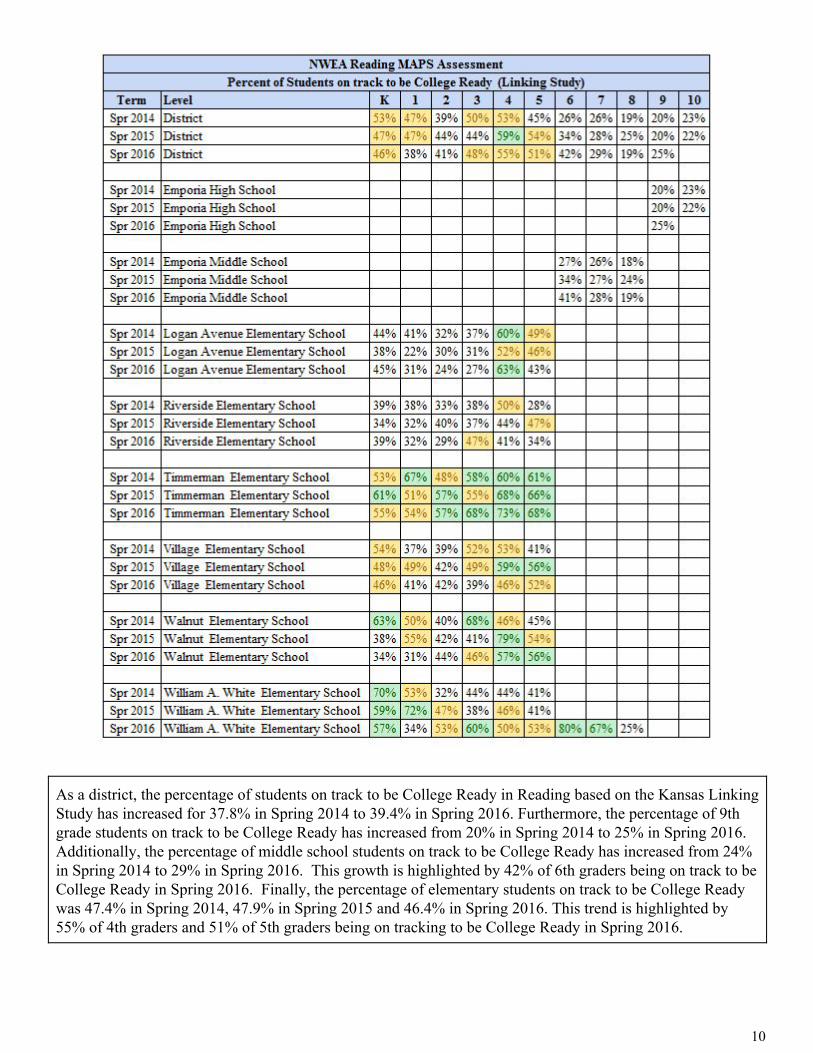
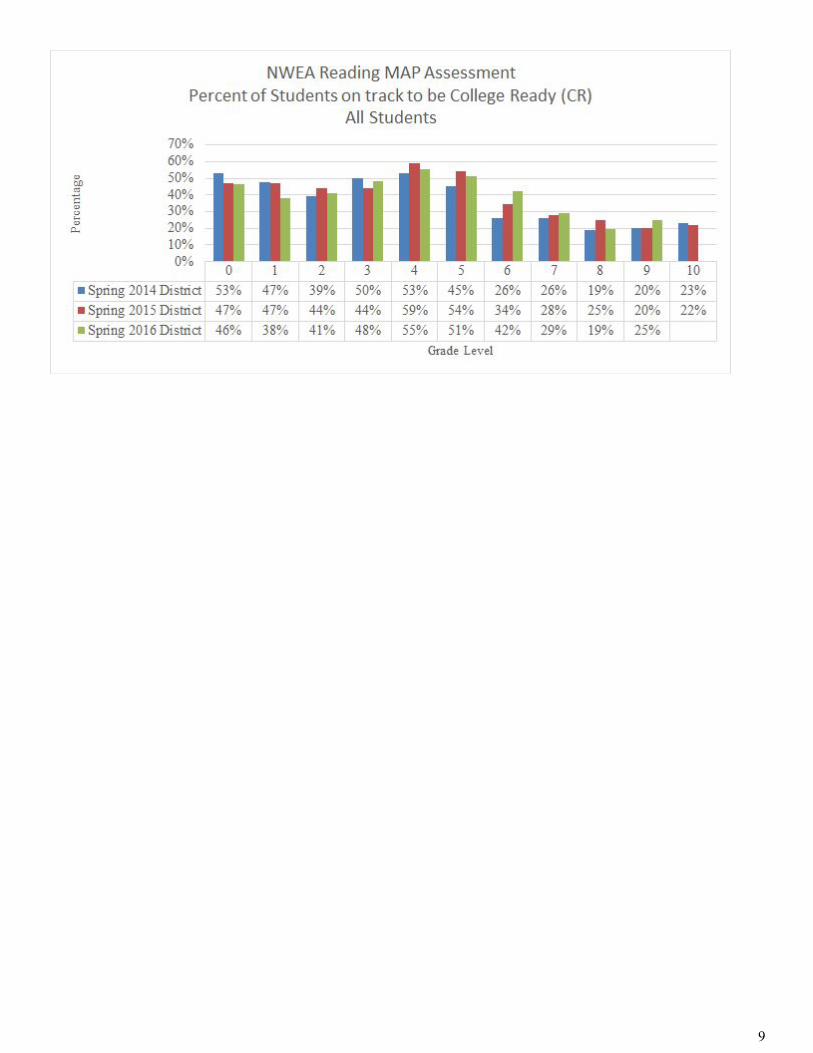
As a district, the percentage of students on track to be College Ready in Reading based on the Kansas Linking Study has increased for 37.8% in Spring 2014 to 39.4% in Spring 2016. Furthermore, the percentage of 9th grade students on track to be College Ready has increased from 20% in Spring 2014 to 25% in Spring 2016. Additionally, the percentage of middle school students on track to be College Ready has increased from 24% in Spring 2014 to 29% in Spring 2016. This growth is highlighted by 42% of 6th graders being on track to be College Ready in Spring 2016. Finally, the percentage of elementary students on track to be College Ready was 47.4% in Spring 2014, 47.9% in Spring 2015 and 46.4% in Spring 2016. This trend is highlighted by 55% of 4th graders and 51% of 5th graders being on tracking to be College Ready in Spring 2016.
10

In addition to the Kansas Assessment Linking Study, NWEA provides us with a MAP College Readiness Research Brief. The research brief describes a set of college readiness benchmarks for use with the Reading and Mathematics MAPS assessments for grades 5 through 9. NWEA only supplies information for grades 59; the grey cells indicate estimates. Table 3 describes the relationship between the ACT and the MAP assessments for Reading and Mathematics. Table 3:
Applying the information from the research brief to our NWEA data provides a picture of how our students compare in terms of College Readiness status. The charts and tables that follow provide an overview of USD 253 College Readiness status based on the NWEA MAPS assessment. For Mathematics, the Kansas Assessment Linking Study produces better results for K3 while the NWEA College Readiness Study produces better results for grades 49. For Reading, the Kansas Assessment Linking Study produces better results for grades K4 while the NWEA College Readiness Study produces better results for grades 59. We will continue to monitor the data and studies produced by NWEA in order to make a decision concerning the direction to follow concerning College Readiness. Cells are yellow if the percentage is greater than or equal to 45 and green if the percentage is greater than or equal to 55.
11
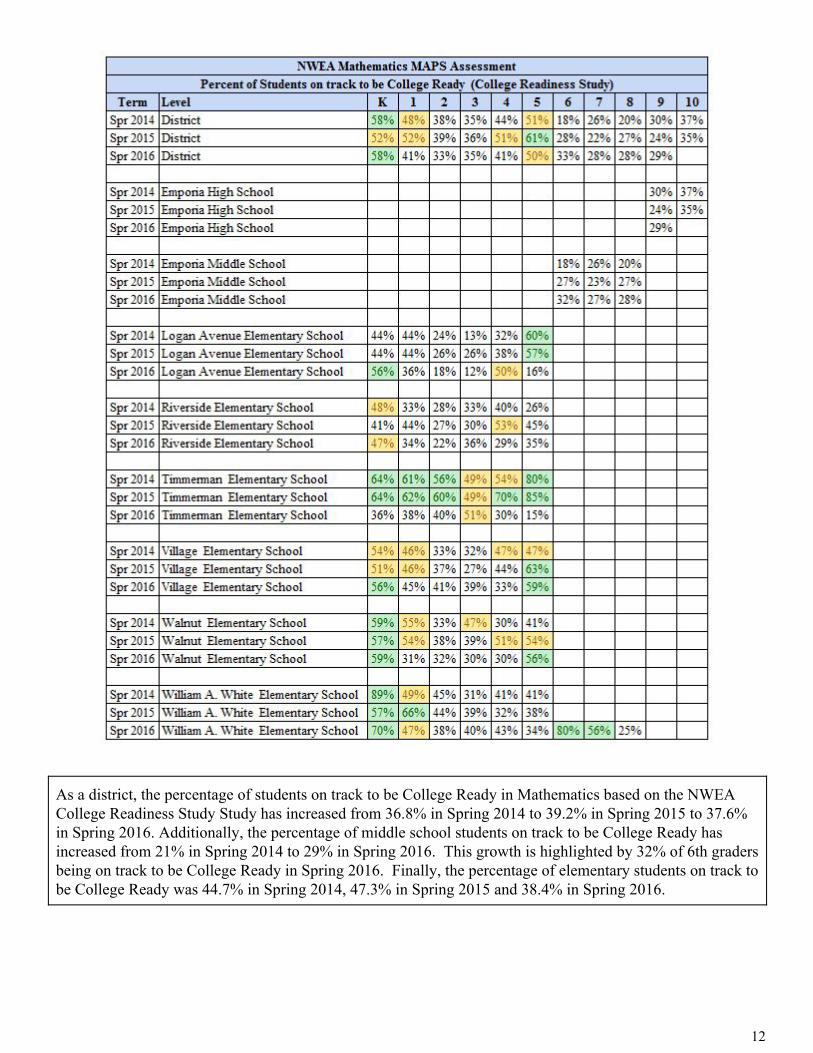
As a district, the percentage of students on track to be College Ready in Mathematics based on the NWEA College Readiness Study Study has increased from 36.8% in Spring 2014 to 39.2% in Spring 2015 to 37.6% in Spring 2016. Additionally, the percentage of middle school students on track to be College Ready has increased from 21% in Spring 2014 to 29% in Spring 2016. This growth is highlighted by 32% of 6th graders being on track to be College Ready in Spring 2016. Finally, the percentage of elementary students on track to be College Ready was 44.7% in Spring 2014, 47.3% in Spring 2015 and 38.4% in Spring 2016.
12
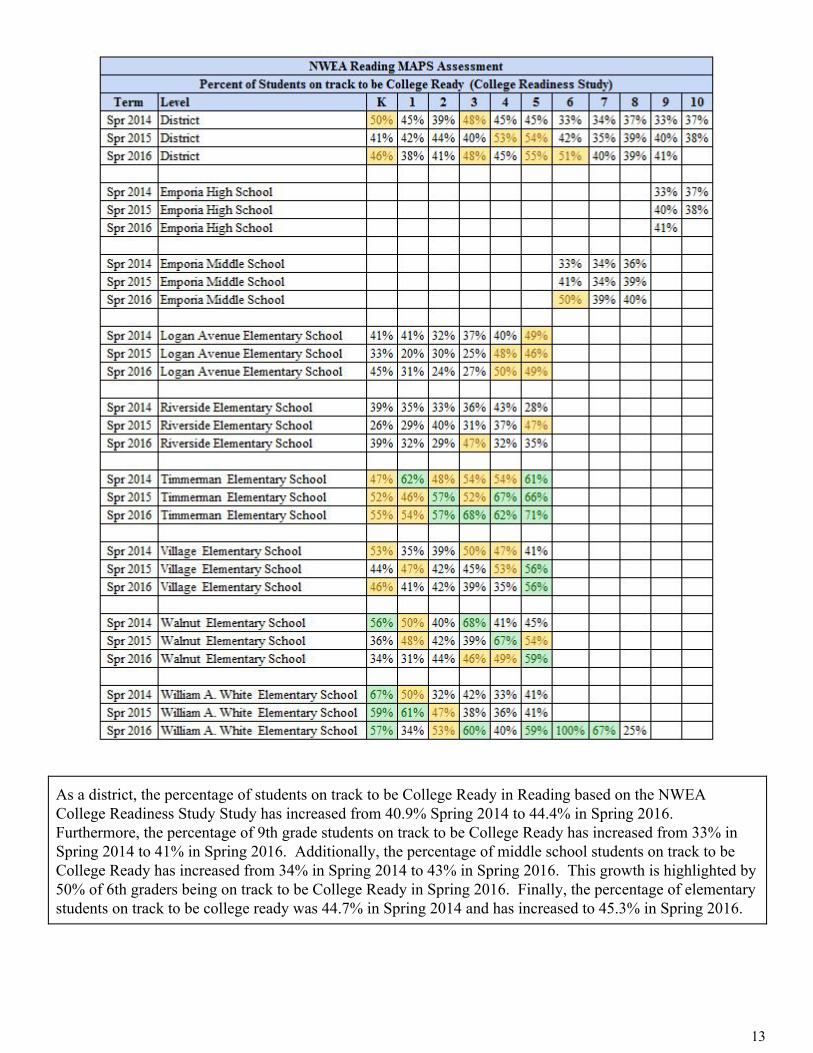
As a district, the percentage of students on track to be College Ready in Reading based on the NWEA College Readiness Study Study has increased from 40.9% Spring 2014 to 44.4% in Spring 2016. Furthermore, the percentage of 9th grade students on track to be College Ready has increased from 33% in Spring 2014 to 41% in Spring 2016. Additionally, the percentage of middle school students on track to be College Ready has increased from 34% in Spring 2014 to 43% in Spring 2016. This growth is highlighted by 50% of 6th graders being on track to be College Ready in Spring 2016. Finally, the percentage of elementary students on track to be college ready was 44.7% in Spring 2014 and has increased to 45.3% in Spring 2016.
13