boiler burner energy systems technology · 2013-10-29 · boiler burner energy system technology...
TRANSCRIPT

E n e r g y R e s e a r c h a n d D e v e l o p m e n t D i v i s i o n
F I N A L P R O J E C T R E P O R T
Boiler Burner Energy Systems Technology
MARCH 2013
CE C-500-2013-112
Prepared for: California Energy Commission
Prepared by: Altex Technologies

PREPARED BY: Primary Author(s): John Kelly Eric Darby Altex Technologies, Inc. 244 Sobrante Way Sunnyvale, CA 94086 408-328-8300 www.altextech.com Grant Number: PIR-09-012 Prepared for: California Energy Commission Mike Kane Contractor Manager Linda Spiegel Office Manager Energy Generation Research Office Laurie ten Hope Deputy Director ENERGY RESEARCH AND DEVELOPMENT DIVISION Robert P. Oglesby Executive Director
DISCLAIMER
This report was prepared as the result of work sponsored by the California Energy Commission. It does not necessarily represent the views of the Energy Commission, its employees or the State of California. The Energy Commission, the State of California, its employees, contractors and subcontractors make no warrant, express or implied, and assume no legal liability for the information in this report; nor does any party represent that the uses of this information will not infringe upon privately owned rights. This report has not been approved or disapproved by the California Energy Commission nor has the California Energy Commission passed upon the accuracy or adequacy of the information in this report.

ACKNOWLEDGEMENTS
The authors thank Franco Castaldini, Lee Wilson, and Mark Huajardo of Leva Energy; Carlo Castaldini of CMC-Engineering; Lou Brizzolara and James Harber of AHM Associates; and Joe Gurnari of the Costa Mesa Westin Hotel, for their help throughout this project and in the writing of this report.
The authors also acknowledge the dedication and commitment of Altex Technologies staff members David Arft, Chad Oliveri, Andrew Saucedo, Linda DiBocce, and Stella Kelly.
i

PREFACE
The California Energy Commission Energy Research and Development Division supports public interest energy research and development that will help improve the quality of life in California by bringing environmentally safe, affordable, and reliable energy services and products to the marketplace.
The Energy Research and Development Division conducts public interest research, development, and demonstration (RD&D) projects to benefit California.
The Energy Research and Development Division strives to conduct the most promising public interest energy research by partnering with RD&D entities, including individuals, businesses, utilities, and public or private research institutions.
Energy Research and Development Division funding efforts are focused on the following RD&D program areas:
• Buildings End-Use Energy Efficiency
• Energy Innovations Small Grants
• Energy-Related Environmental Research
• Energy Systems Integration
• Environmentally Preferred Advanced Generation
• Industrial/Agricultural/Water End-Use Energy Efficiency
• Renewable Energy Technologies
• Transportation
Boiler Burner Energy System Technology Final Report is the final report for the Boiler Burner Energy System Technology project PIR-09-012 conducted by Altex Technologies, Inc. ]. The information from this project contributes to Energy Research and Development Division’s Renewable Energy Technologies Program.
For more information about the Energy Research and Development Division, please visit the Energy Commission’s website at www.energy.ca.gov/research/ or contact the Energy Commission at 916-327-1551.
ii

ABSTRACT
This report documented the integration of a simple cycle micro gas turbine with an ultra reduced nitrogen oxide boiler burner to create a unique combined heat and power system that meets a facility’s steam needs while cogenerating 100 kilowatts of electric power. Altex Technologies converted a recuperated turbine into a simple cycle unit to reduce cost and provide additional heat to the boiler. They also designed and built an ultra low nitrogen oxide silo combustor that allowed the turbine to meet California emissions requirements. The boiler burner and the silo combustor were based on a patented Altex design, and for this project the boiler burner was customized to operate with turbine exhaust as the primary oxidant source.
The system was integrated with a firetube boiler at the Altex testing facility. A variety of tests demonstrated the system’s capability to achieve nitrogen oxide emissions below nine parts per million, increase boiler efficiency, and generate 100 kilowatts net electrical power. The system was then installed and commissioned at the Costa Mesa Westin hotel on an existing boiler. The system satisfied the hotel’s steam demand while generating approximately 25 percent of its electrical needs. Third party testing was performed by Southern California Gas Company and verified emissions compliance to the South Coast Air Quality Management District permit limits across the operating range required by the facility.
Keywords: California Energy Commission, combined heat and power, distributed generation, boiler burners, emissions, low NOx, cogeneration, energy efficiency, steam, microturbines, simple cycle, gas turbines, on-site generation
Please use the following citation for this report:
Kelly, John, Eric Darby. Altex Technologies, Inc. 2013. Boiler Burner Energy System Technology Final Report. California Energy Commission. Publication number: CEC-500-2013-112.
iii

TABLE OF CONTENTS
Acknowledgements ................................................................................................................................... i
PREFACE ................................................................................................................................................... ii
ABSTRACT .............................................................................................................................................. iii
TABLE OF CONTENTS ......................................................................................................................... iv
LIST OF FIGURES .................................................................................................................................... v
LIST OF TABLES ................................................................................................................................... vii
EXECUTIVE SUMMARY ........................................................................................................................ 1
Introduction ........................................................................................................................................ 1
Project Purpose ................................................................................................................................... 1
Project Results ..................................................................................................................................... 1
Project Benefits ................................................................................................................................... 3
CHAPTER 1: Project Definition ............................................................................................................ 4
1.1 System Description .......................................................................................................................... 4
1.2 System Design and Analysis .......................................................................................................... 5
1.3 URNB Design and Analysis............................................................................................................ 8
1.4 Altex Test Facility Upgrades ........................................................................................................ 11
1.5 SCGT Selection and Modification ................................................................................................ 15
1.6 Integration Component Analysis and Design ........................................................................... 25
1.7 Subscale Eductor Testing .............................................................................................................. 30
1.8 Additional System Components .................................................................................................. 35
1.9 System Assembly ........................................................................................................................... 42
CHAPTER 2: Lab Testing Activities ................................................................................................... 48
2.1 Subcomponent Testing .................................................................................................................. 48
2.2 URNB Testing ................................................................................................................................. 51
2.3 SCGT and Full System Testing ..................................................................................................... 53
CHAPTER 3: Field Demonstration ..................................................................................................... 59
3.1 Demonstration Site Selection ........................................................................................................ 59
iv

3.2 Field Test Planning, Permitting, and Installation ...................................................................... 63
3.3 Altex Field Test Data ..................................................................................................................... 71
3.4 Third Party Emissions Test Results ............................................................................................. 74
3.5 24-Hour Performance Demonstration ......................................................................................... 76
CHAPTER 4: Commercialization Activities ...................................................................................... 80
4.1 Performance and Cost Evaluation Results ................................................................................. 80
4.2 Commercialization Readiness Plan ............................................................................................. 85
4.3 Technology Transfer Activities .................................................................................................... 87
4.4 Production Readiness .................................................................................................................... 91
CHAPTER 5: Project Financial Summary ........................................................................................ 100
CHAPTER 6: Conclusions .................................................................................................................. 101
APPENDIX A: Efficiency and Heat Rate Calculation Methods .................................................. A-1
LIST OF FIGURES
Figure 1: BBEST, mated to a 250BoHP Firetube Boiler ........................................................................ 5 Figure 2: Three-Pass Wetback Scotch Marine (Firetube) Package Boiler ........................................... 6 Figure 3: Initial CFD Results: Burner Head Operating Modes ............................................................ 9 Figure 4: Burner Head CFD Results; Eductor at Left, Burner Head at Right .................................. 10 Figure 5: Burner Head Design, Showing Process Flow Inlet Locations ........................................... 11 Figure 6: A ltex Test Facility Design ....................................................................................................... 11 Figure 7: Radiator and Fan Array Design ............................................................................................. 12 Figure 8: Completed Radiator Array with Fans Installed .................................................................. 13 Figure 9: Boiler Unloading at the A ltex Test Facility .......................................................................... 14 Figure 10: Boiler Being Rigged into Altex Test Facility ...................................................................... 14 Figure 11: Boiler Exhaust Stack and Electrical Conduit Support Structure ..................................... 15 Figure 12: Turbec/ GI&E Turbine .......................................................................................................... 16 Figure 13: T100 SCGT Parameters (standard recuperated configuration) ....................................... 17 Figure 14: Section View of T100 Engine, as Installed in a Recuperated CHP System .................... 18 Figure 15: T100 Compressor Operating Characteristics ..................................................................... 19 Figure 16: Diffuser Types, (a) Vaneless and (b) Vaned ...................................................................... 19 Figure 17: Altex SCGT Design ................................................................................................................ 20 Figure 18: Altex SCGT Design Fabricated ............................................................................................ 20 Figure 19: Altex Sub-scale Combustor NOx and CO Test Results .................................................... 21 Figure 20: Altex-Designed Ultra Low-NOx Silo Combustor, ............................................................ 22 Figure 21: Altex-Designed Ultra Low-NOx Silo Combustor, Fabricated ........................................ 23 Figure 22: One Atmosphere Pressure Silo Combustor Test Fixture Design .................................... 23 Figure 23: Combustor Test Fixture Fabricated and Installed in the A ltex Lab ............................... 24 Figure 24: SCGT Power Electronics ....................................................................................................... 24 Figure 25: Original Eductor Concept .................................................................................................... 26
v

Figure 26: Single Eductor Geometry ..................................................................................................... 27 Figure 27: Full Scale Eductor Design Attached to Turbine Exhaust ................................................. 27 Figure 28: CFDesign Results for Full-Scale BBEST Eductor Design ................................................. 28 Figure 29: Eductor Geometry Analysis Results ................................................................................... 29 Figure 30: Final Design Results, Backpressure Sensitivity ................................................................. 29 Figure 31: Eductor Cold Flow Test Set-up ............................................................................................ 30 Figure 32: Volume-Based Eduction Relationship ................................................................................ 30 Figure 33: Mass-Based Eduction Relationship ..................................................................................... 31 Figure 34: Backpressure Effects on Eductor Performance (D/ d=1.5, 0” Nozzle Length) .............. 31 Figure 35: Near Full-Scale Eductor Test Component Design ............................................................ 32 Figure 36: APU-Based Altex Microturbine Test Bed .......................................................................... 33 Figure 37: Eductor Installed on A ltex Microturbine Test Bed .......................................................... 33 Figure 38: Partially-Welded Integration Component ......................................................................... 34 Figure 39: Integration Component (at left) during installation on SCGT ........................................ 35 Figure 40: BBEST Combustion A ir Blower, As-Received at A ltex .................................................... 36 Figure 41: BBEST FGR Blower, As-Received at A ltex ......................................................................... 36 Figure 42: High-Temperature A ir Butterfly Damper (left) and Fuel Control Valve Assembly .... 37 Figure 43: Blast Pilot Assembly Delivered and Ready for Initial Testing ........................................ 38 Figure 44: Blast Pilot Flame Performance Testing ............................................................................... 38 Figure 45: Hydrovane Compressor Received at Altex ....................................................................... 39 Figure 46: Turbine Fuel Control Valves Installed, Ready for Calibration Tests ............................. 39 Figure 47: Fireye Nexus System Running in the Altex Test Facility ................................................. 40 Figure 48: Controls for Compressor (left) and Blowers during Installation @ Altex ..................... 41 Figure 49: Tightly Integrated Control System for Demonstration Site Installation ........................ 41 Figure 50: Turbine Upgrade in Process ................................................................................................. 42 Figure 51: URNB Combustor Installed with Fuel Manifolds ............................................................ 43 Figure 52: BOP Cabinet Rear View, with Cooling System Components Installed ......................... 44 Figure 53: BOP Cabinet, Side View ....................................................................................................... 44 Figure 54: Burner Head Installation at A ltex ....................................................................................... 45 Figure 55: Assembled BBEST System During Final Wiring and Quality Check ............................. 46 Figure 56: Fully Assembled BBEST System, ......................................................................................... 47 Figure 57: Altex Test Facility Emissions Monitoring Equipment...................................................... 49 Figure 58: BBEST Combustor Emissions Results (Corrected to 15percent O2) ............................... 50 Figure 59: BBEST Burner Primary Flame .............................................................................................. 52 Figure 60: Preliminary BBEST Emissions ............................................................................................. 53 Figure 61: Preliminary Turbine-Only Test Results .............................................................................. 54 Figure 62: Preliminary CHP-Mode Testing .......................................................................................... 55 Figure 63: Combustor Modification Results ......................................................................................... 56 Figure 64: BBEST URNB Re-installation in the Altex Test Facility ................................................... 57 Figure 65: Bryan Watertube Boiler ........................................................................................................ 60 Figure 66: Boiler Front and Existing 30-ppm NOx Burner @ Westin ............................................... 61 Figure 67: Westin Monthly Steam Demand ......................................................................................... 63 Figure 68: Planned System Layout ........................................................................................................ 64 Figure 69: Effect of O2 Correction Factor on Reported Emissions ..................................................... 65 Figure 70: URNB During Crating at Altex ........................................................................................... 66 Figure 71: System Re-staging at Installation Contractor’s Facility.................................................... 67 Figure 72: BBEST Turbine Enclosure During Installation at Westin Site ......................................... 68 Figure 73: Completed Pilot, Ignition Transformer, and FGR Piping ................................................ 68
vi

Figure 74: Burner Control Cabinet Installation Complete ................................................................. 69 Figure 75: Boiler Room Entrance—PE at left of red doorframe, in hallway; ................................... 69 Figure 76: Completed SCGT Controls and Power Output, from left to right: ................................ 70 Figure 77: UL Field Evaluated Product Sticker, applied to BBEST controls cabinet ...................... 71 Figure 78: NOx Emissions at Westin Demonstration Site .................................................................. 72 Figure 79: CO Emissions (corrected to 3 percent O2) at Westin Demonstration Site ..................... 72 Figure 80: Fuel Flow Comparison—BBEST (aka PB 100) vs. Matrix Burner (Powerflame) .......... 73 Figure 81: SCG Test Report Excerpt—All Sourced from SCG-EAC Draft Report .......................... 75 Figure 82: BBEST Demonstration Test Summary ................................................................................ 77 Figure 83: 24 Hour Operation, December 5, 2012 ................................................................................ 78 Figure 84: 24 Hour Operation, December 12, 2012 .............................................................................. 78 Figure 85: Turbine Enclosure, as Installed on a 250 BoHP Firetube Boiler ...................................... 98 Figure 86: Project Spending Rate ......................................................................................................... 100
LIST OF TABLES
Table 1: Conventional Burner Key Characteristics ................................................................................ 7 Table 2: Comparison of Test Bed Mode and Eductor Hot Test Results .......................................... 34 Table 3: A ir Flow Test Data for Louver and Butterfly-Type Dampers ............................................. 48 Table 4: Emissions Monitoring Equipment .......................................................................................... 49 Table 5: BEST Emissions Test Results ................................................................................................... 58 Table 6: Predicted Improvements over Existing Burner – 8/ 11 Test ................................................ 62 Table 7: Energy and Environmental Savings ....................................................................................... 62 Table 8: Test Point Comparison ............................................................................................................. 74 Table 9: Ultra Low NOx Burner Comparisons .................................................................................... 80 Table 10: BBEST LCOE Analysis Inputs and Result ........................................................................... 81 Table 11: Comparison of LCOE for BBEST and Conventional CHP Systems ................................. 82 Table 12: Comparison of BBEST Cost per kW to Alternative DG ..................................................... 82 Table 13: BBEST Pricing Projection ....................................................................................................... 83 Table 14: BBEST ROI Model Variables .................................................................................................. 84 Table 15: Conferences Attended in Support of Technology Transfer .............................................. 87 Table 16: Customer Meetings Held in Support of Technology Transfer ......................................... 88 Table 17: Partner Meetings Held in Support of Technology Transfer .............................................. 89 Table 18: Investment Meetings Held in Support of Technology Transfer ....................................... 90 Table 19: Sizing Variation of Other Low-NOx Burners ..................................................................... 92 Table 20: Project Objectives and Performance ................................................................................... 101
vii

EXECUTIVE SUMMARY
Introduction Boilers in California annually consume 87 billion cubic feet (BCF) of natural gas. Thousands of these boilers could be retrofitted with compact combined heat and power (CHP) packages that replace existing burners and cogenerate electricity while providing reliable heat input that serves process needs. Generating electric power with a micro gas turbine and recovering all of the turbine’s exhaust heat in the boiler can lead to overall fuel-to-useful-output efficiencies that exceed 80 percent. Fuel use, fuel costs, greenhouse gas emissions, and air pollution are less than the equivalent output from central plant power generation and boiler operation, benefitting both burner users and the public. Importantly, the locally-generated power offsets the site’s grid power needs. This provides a return on the burner investment and a short payback period. While the advantages of this CHP operation are clear for California industry, it’s challenging to integrate reliable power and process heat generation into a compact and low-cost device that can provide an attractive economic return. The integration challenge is even greater for common firetube boiler applications where the turbine’s exhaust flow is comparable to the boiler burner requirement for oxygen supply.
Project Purpose The goal of this project was integrating a simple cycle micro gas turbine with an ultra reduced nitrogen oxide (NOx) boiler burner to create a unique combined heat and power system that meets a facility’s steam needs while co-generating 100 kilowatts of electric power.
Project Results Altex and its project partners—CMC-Engineering, Leva Energy, and AHM Associates—engineered, laboratory tested, and field tested the Boiler Burner Energy System Technology (BBEST) using a simple cycle gas turbine and an Altex-developed ultra reduced NOx burner. This work was performed under California Energy Commission project PIR-09-012. The BBEST utilized an existing turbine from a recuperated CHP system that did not have a California-compliant combustor. Using Altex-developed technology, the existing engine was converted to a simple cycle gas turbine with a low-NOx combustor that was compatible with BBEST. Altex also designed and managed the building of an ultra reduced NOx burner head that was mated to the turbine exhaust using an integration component. An Underwriters Laboratories (UL)-listed control system was connected to the system to create the BBEST 10 million British thermal unit per hour (MMBtu/hr) burner capacity test article. Altex installed a 10MMBtu/hr Superior Boiler Works firetube boiler in the Altex test facility and fully instrumented the unit for the BBEST proof tests. BBEST operation was proven for both CHP mode, where the turbine is operating and producing power, and a burner head only (BHO) mode, where the engine is not operating but the boiler heat input needs are fully met. This latter operation is a backup mode that gives potential BBEST customers confidence that their process needs can be met with this new technology, even if the turbine is unavailable for any reason. The BBEST unit was removed and installed in one of the existing boilers at the Westin hotel in Costa Mesa, California following the laboratory tests. The unit was commissioned with needed adjustments in natural gas fuel valve actuations to be compatible with the site and existing boiler. After
1

commissioning, the unit was operated continuously in the CHP mode to supply site steam needs 24 hours per day while cogenerating approximately 100 kilowatt electrical (kWe) of power. Altex monitored emissions, efficiency and power output throughout the test and Southern California Gas provided testing services and third-party verification that corroborated the Altex measurements. Permitted emissions levels were met, and boiler efficiency increased. These field test results showed the potential of BBEST to achieve the stated CHP performance goals.
Based on laboratory test results that simulated boiler operation in the field, the BBEST showed the potential to:
• Lower overall firetube boiler emissions in CHP and BHO modes to below 9 parts per million (ppm) three percent oxygen (O2) to meet emissions regulations in all California regions.
• Allow boiler operation at low excess air (three percent excess O2) under both full and some part-load conditions to minimize sensible (dry gas) heat losses in the stack and to reduce fuel costs.
• Reduce incremental cost of power generation and provide a payback of two years for most 100 kWe installations.
• Minimize incremental operating and maintenance costs of power generation by achieving equivalent power conversion efficiencies above 90 percent, with a reliable compact package.
• Achieve overall CHP efficiencies of 82 percent, by improving boiler-burner operation, especially at partial loads.
• Improve micro turbine generator (MTG) reliability and reduce cost by eliminating the recuperator and using a low-temperature, low-NOx combustor.
The field test results at the Westin hotel showed that BBEST:
• Met the hotel variable steam demand over 24-hour periods while cogenerating nearly 100 kWe power throughout the period.
• Achieved an overall boiler efficiency of 80 percent on a 39-year-old boiler.
• Lowered NOx emissions by 50 percent relative to the previous burner performance.
• Met the permitted emissions limits, which was confirmed by third-party testing.
Leva Energy performed extensive market and cost assessments using direct customer and manufacturer inputs. The results supported the short payback periods predicted at the beginning of the effort and confirmed BBEST’s economic viability. Based on successful performance testing, economic viability, and potential customer interest, Altex and its partners were pursuing investment and other resources that will result in the commercialization of BBEST for California and other markets. While the BBEST capacity of 10 MMBtu/hr is a
2

common size for California markets, further development and testing of BBEST capacities from five MMBtu/hr to 50 MMBtu/hr are needed to fully deploy BBEST.
Project Benefits BBEST could be deployed on approximately 3,000 boilers in California in the near term. These boilers consume approximately 87 BCF per year of natural gas. Approximately 2,600 million kilowatt hours of grid power would not be needed by implementing BBEST. If that grid power were produced by an efficient combined cycle power plant, the deployment of BBEST would reduce fuel consumption and cost by 11 BCF natural gas and $77 million per year, with greenhouse gases and ozone precursor pollutants reduced by 447,000 tons per year and 192 tons per year, respectively. This would benefit BBEST users as well as the public. If BBEST was deployed worldwide, these benefits would increase by a factor of 50 based on the size of the worldwide boiler population. BBEST production would also create approximately 3,000 California-based jobs in manufacturing, marketing, sales and service if this technology was deployed worldwide.
3

CHAPTER 1: Project Definition 1.1 System Description Boiler Burner Energy System Technology (BBEST) integrates a Simple Cycle Micro Gas Turbine (SCGT) with an Altex Technologies Ultra-Reduced NOx Burner head (URNB) to create a unique Combined Heat and Power (CHP) solution for firetube boilers. BBEST converts natural gas into low-cost electricity, and provides the heat necessary to operate these boilers. The SCGT is mated to a 100 kWe AC generator and a natural gas-fired Ultra-Low NOx silo combustor. The combustor drives the turbine and generator, and supplies high velocity, high temperature exhaust to the URNB burner head, which can be fabricated in several sizes to cover the 5 to 50 MMBTU/hr boiler capacity range. This project’s objectives were to develop and then demonstrate in the field the BBEST concept for firetube boilers. As part of the effort, BBEST economics were also evaluated.
The performance and cost objectives for BBEST system were as follows:
• Lower overall firetube boiler emissions to meet emissions limits in all CA regions
• Allow boiler operation at low excess air (2-3 percent excess O2) under both full and part load conditions, to minimize sensible (dry gas) heat losses in stack and reduce fuel costs
• Reduce incremental cost of power generation to <$700/Kilowatt (kW), and provide payback of 1.5-2 years for most 100kWe installations
• Minimize incremental operating/maintenance costs of power generation by reaching equivalent power conversion efficiencies of above 90 percent, within a reliable, compact package
• Achieve overall CHP efficiencies of 82 percent, by improving boiler-burner operation, especially at part loads
• Improve the reliability of the purchased turbine by eliminating the recuperator, and using low temperature/low NOx combustor to create a simple cycle gas turbine that will have lower production costs.
As shown, these were important and beneficial goals that were achievable based on our prior watertube and URNB experience.
4

1.2 System Design and Analysis
Figure 1: BBEST, mated to a 250BoHP Firetube Boiler
Source: Altex Technologies, Inc.
To ensure that BBEST, as shown in Figure 1, would be compatible with most existing and new boiler designs, the project team examined products from Superior Boiler Company, Hurst, Johnston Boiler, Columbia, and Cleaver Brooks. Also, it was important to consider the space downstream of attachment that would contain the burner flame. Firetube boilers are designed with a “Morrison” Tube (MT) that contains the burner flame. For long term durability, it must be large enough to contain the flame without impingement on the walls or the downstream chamber. Figure 2 is a cutaway of a Superior Boiler Works firetube boiler that illustrates the MT (#10 in Figure 2) into which the burner exhausts (#4).
5

Figure 2: Three-Pass Wetback Scotch Marine (Firetube) Package Boiler
Source: Superior Boilerworks
In support of BBEST size and process assessment, Altex engineers created a proprietary spreadsheet that incorporated BBEST key design parameters obtained from prior study, as well as analysis specific to the patented URNB burner that has been successfully tested on boilers without an integrated SCGT. For BBEST, this analysis was updated by including the SCGT exhaust as the burner partial or full oxidant. These gases are at approximately 1150 F, with 15 percent oxygen, at full SCGT load. From process parameters, engineers defined key burner dimensions. BBEST’s flexibility allows it to cover the full range of boiler capacities with only a limited number of burner models.
As an example of conventional low NOx burners, Table 1 presents a Cleaver-Brooks product line, including burner capacities, head diameters, blower horsepower, and fuel pressure. As shown, they cover a range of capacities up to 900 BoHP. Also shown in Table 1 is the burner head diameter. The BBEST head diameter was sized to be either equal to or smaller than this dimension. Note that the fourteen different input capacities are met by six head diameters. A similar reduced number of head diameters, to cover all the capacities of interest, will be used with BBEST. Table 1 also illustrates air blower fan horsepower levels. With BBEST, the SCGT flow energy will be used to drive the oxidant into the burner, thereby saving a significant portion of the blower operating cost. For the larger capacity conventional burners, the blower horsepower requirement is high, resulting in a potential cost of over $20,000 per year. Also included as the last column in Table 1 are the minimum boiler MT diameters that were defined from a review of boiler information available from the key firetube boiler manufacturers listed
6

above. The MT minimum diameters are larger than the Cleaver Brooks burner diameters, as expected. This provides several inches of clearance between the burner and the MT. The Cleaver-Brooks burner information only covers capacities up to 37.8 MMBtu/hr, but boiler MT data was available up to the BBEST maximum capacity of 50MMBtu/hr.
Table 1: Conventional Burner Key Characteristics
CAPACITY (MM B/H)
CAPACITY (BoHP)
BURNER HEAD DIAM
(IN) BLOWER
(HP) FUEL PRESS
(IN H2O)
MT DIA (IN)
5.25 125 19 5 6 24 6.3 150 19 7.5 9 24
7.35 175 19 10 14 32 8.4 200 22 15 7 28
10.5 250 22 15 10 28 12.6 300 22 20 13 28 14.7 350 27.5 25 12 33 16.8 400 31.5 30 11 36
21 500 31.5 40 15 38 25.2 600 31.5 40 11 40
30 714 33 60 11 42 31.5 750 34.625 60 22 46 33.6 800 34.625 75 34 42 37.8 900 34.625 75 38 48 44.0 1000 48 48.4 1100 50 52.8 1200 50
Source: Cleaver-Brooks The BBEST system uses some educted air from the integration component, described in Section 1.6, to augment the SCGT exhaust and meet the burner oxidizer requirements across the full load range. This requirement can be calculated using fuel needs to meet load requirements. The total amount of air flow into both the SCGT and educted into the burner was calculated for several burner capacities. At a nominal 2 MMBtu/hr thermal input to the boiler, the SCGT power is 100kWe. Beyond this capacity, burner fuel is added to the SCGT flow until the 7.0 - 8.0 MMBtu/hr load is met. At this point, the excess oxygen level has decreased to the optimum efficiency level of 2 to 3 percent. Further increases in load require air to be educted (or otherwise added) into the burner. The optimal 3 percent excess oxygen can be maintained from 8.0 MMBtu/hr up to maximum load. For a 20 MMBtu/hr burner, this equates to a 10 to 1 turndown. This capability far exceeds most Ultra Low-NOx Burners (ULNB) surface burners, which have turndown ratios of 2 or 3 to 1, and typical ultralow NOx flame burners—such as the Cleaver Brooks—which are limited to a turndown of 4 to 1. This extra flexibility is an important advantage for BBEST versus alternative ULNB’s.
7

The model also determined benefits of improved boiler efficiency when implementing BBEST instead of the ULNBs currently being installed in California for compliance with various Air Quality Management Districts' (AQMD) requirements. The most stringent AQMD regulations call for 9 ppm NOx maximum production, corrected to 3 percent stack O2.
Compliance with this requirement is, by-and-large, being achieved with the retrofit of ULNBs such as the NOxMaticTM or the Alzeta CSB and CSB MicroSTARTM burners. These fully premixed burners operate with up to 60 percent excess air which results in excessively high exhaust dry gas losses for the boiler. Optimum boiler efficiencies are achieved by operating gas-fired boilers with excess air in the range of 10-15 percent. High excess air also causes higher stack temperatures and an increase in fan power consumption. Typically, a 10 percent reduction in excess air will also reduce stack temperatures by 10 F. The increased power required by the combustion air blower is a function of the amount of back pressure, which varies from boiler to boiler, and the type of motor used. The added improvement in boiler efficiency that would be achieved by replacing these high excess air ULNBs with the BBEST technology (15 percent excess air) can be easily calculated.
For a high excess air ULNB operating with an 8.5 percent oxygen in the stack, measured on a dry basis, boiler efficiency is 77.7 percent (calculated using the ASME PTC-4.1Heat Loss Method). The associated energy cost of operating this boiler amounts to $244,359/year, based on an 80 percent load factor, $7/MMBtu gas and $0.11/kw-hr electricity. When the same boiler is operated with BBEST, the boiler efficiency is 80.6 percent, since BBEST creates 3percent oxygen flue gas at loads over 8 MMBtu/hr. The total cost of operating the boiler with BBEST is reduced to about $210,000/year—a net improvement of $33,359/year. These energy savings add to the Return on Investment (ROI) of the BBEST and, in most cases, can diminish the often-reported dependence of ROI on spark spread.
1.3 URNB Design and Analysis Altex used custom mathematical models, CFDesign computational fluid dynamics (CFD) software, and SolidWorks CAD to analyze and design the URNB. This burner technology has previously been patented by Altex Technologies and is known to provide low NOx emissions with low excess air, thus achieving the low-emissions/high efficiency combination not possible with other existing technologies. Data from previous sub-scale tests of this patented burner provided inputs to the theoretical analyses, thus reducing design risk. The effects of the high temperature, high volumetric flow of the SCGT exhaust were included in this process model.
The burner will meet emissions, efficiency, and stability requirements when operated in a Combined Heat and Power Mode at low and mid thermal input to the boiler (using turbine exhaust as the sole oxidant source), and at high inputs (which will require additional educted air). It will also operate in a back-up Burner-Head-Only (BHO) Mode, where the burner blower supplies all combustion air. Therefore, the burner head will operate under a wider variety of operating conditions than conventional boiler burners and a comprehensive analysis was required. Engineers used CFDesign to predict the effects of these operating conditions on pressure drop and flow distribution for a variety of designs. Sample CFD results are shown in
8

Figure 3. The burner geometry shown is a simplification of the final design. The modifications reduced computing time, while still providing adequate accuracy predictions.
Figure 3: Initial CFD Results: Burner Head Operating Modes
Source: Altex Technologies, Inc.
Low Fire, CHP (microturbine operating,
eductor throttled)
High Fire, CHP (microturbine operating,
eductor flowing)
High Fire, BHO (back-up mode,
burner blower operating)
9

As indicated in Figure 3, the burner head will have three sources of oxygen: turbine exhaust, educted air, and recirculated flue gas (FGR) from boiler exhaust. All three flows will vary at different rates, and not necessarily in proportion to the desired firing rate, so the mechanical design also considered the capability of the control system to adapt to these varying flow rates and deliver the proper fuel flow to ensure acceptable emissions.
Once basic analysis was completed, Altex created a more advanced CFD model, which aided several design iterations of the burner head. The final iteration, shown in Figure 4, achieves the desired flow distribution in the burner head and indicates the potential for good fuel mixing, which is critical for Ultra-Reduced NOx operation. In the figure, the flow lines in both the secondary and primary zones are shown. For flow visualization clarity, the metal and refractory components are hidden.
Figure 4: Burner Head CFD Results; Eductor at Left, Burner Head at Right
Source: Altex Technologies, Inc.
The design team then defined final locations of process flow inputs, as shown in Figure 5, verified connection sizes and interfaces with suppliers of key subcomponents (e.g. flame detector and pilot), and created all necessary manufacturing drawings.
10

Figure 5: Burner Head Design, Showing Process Flow Inlet Locations
Source: Altex Technologies, Inc.
1.4 Altex Test Facility Upgrades In support of testing the BBEST at a capacity of interest, the Altex test facility was modified to incorporate a 10.5 MMBtu/hr Superior Boiler Works two-pass dry back boiler, purchased under Altex match funds. Altex, with the assistance of San Jose Boilerworks, installed the boiler and supporting systems in the summer of 2011, as shown in Figures 6, and 9-11.
Figure 6: Altex Test Facility Design
Source: Altex Technologies, Inc.
11

Altex also designed and directed the fabrication of an array of six fin-and-tube radiators to dissipate the heat transferred from the burner to the boiler water. Air fans provide airflow to the radiators and can be switched on and off to provide variable load. Altex also designed an exhaust dilution system, at the rear of the boiler, to reduce the temperature of the boiler exhaust as it is safely ducted from the test unit to the facility exhaust. Figures 7 and 8 show the radiator array design and the fabricated system, respectively.
Figure 7: Radiator and Fan Array Design
Source: Altex Technologies, Inc.
12

Figure 8: Completed Radiator Array with Fans Installed
Source: Altex Technologies, Inc
Altex also invested in a larger gas supply to the facility, to provide the necessary capacity for full-power testing. Altex and PG&E completed trenching and installation of the new piping and installation of a large capacity gas meter on a new concrete pad, all completed under Altex match funds. Altex also contracted to have a new 400-amp electric panel—necessary to operate the cooling fans and the various BBEST support systems—installed in the test facility. Altex also procured and installed a 208-to-480 transformer, under match funds.
San Jose Boiler Works and other contractors installed the Superior Boiler Works firetube boiler in the Alex test facility in June 2011, as shown in Figures 9-11. The team installed natural gas plumbing and Siemens VG double-block valves (which satisfy NFPA fire safety codes) beside the boiler, and connected the exhaust system to the boiler.
13

Figure 9: Boiler Unloading at the Altex Test Facility
Source: Altex Technologies, Inc
Figure 10: Boiler Being Rigged into Altex Test Facility
Source: Altex Technologies, Inc
14

Figure 11: Boiler Exhaust Stack and Electrical Conduit Support Structure
Source: Altex Technologies, Inc
1.5 SCGT Selection and Modification The initial plan for the BBEST project was to procure a Model TA-100 microturbine from Elliot Engine Systems, Inc. (EES). CMC-E had successfully integrated an Elliot engine with a watertube boiler burner under a previous CEC project to produce a CHP system for large watertube boilers. This engine was considered the best candidate for this project. However, in early November 2007, Calnetix acquired EES. In February 2010, Calnetix sold the microturbine unit to Capstone Turbine Corporation, including “substantially all of the rights and assets related to the manufacture and sale of its TA100 100kW microturbine generator.” Calnetix continued producing the turbines under a subcontract with Capstone, but only from “existing CPS TA100 backlog and select new orders received.” Seven months later, Calnetix was acquired by General Electric.
15
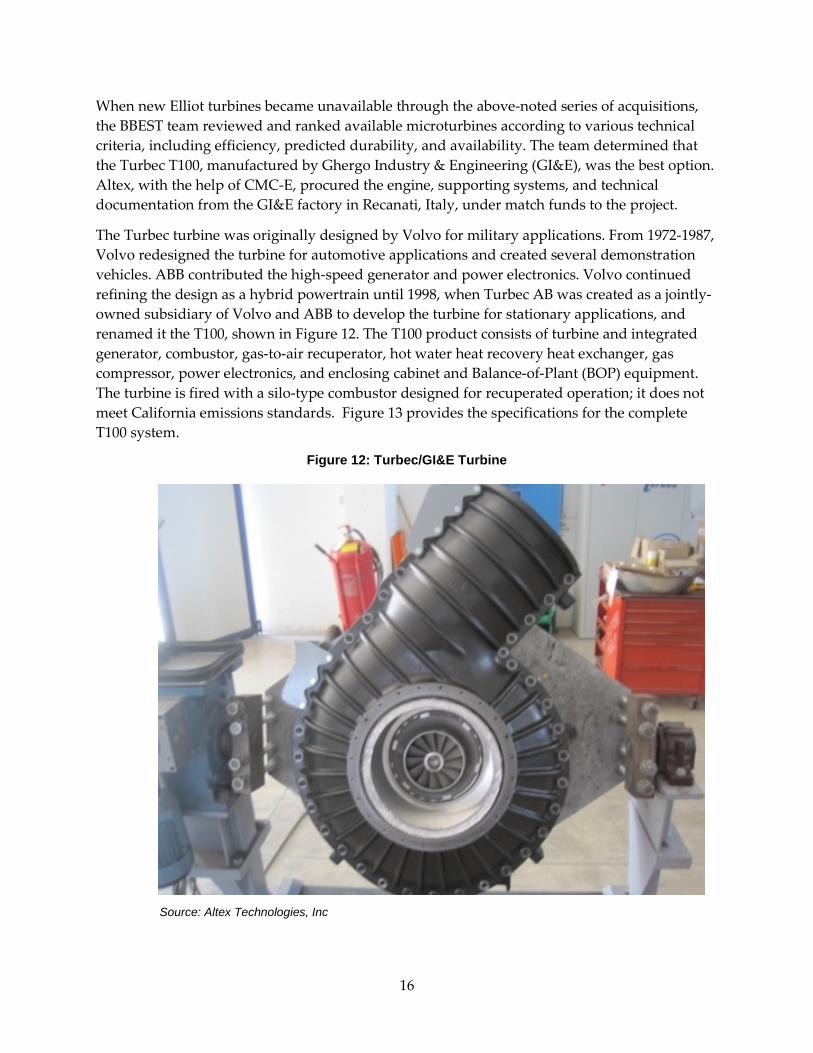
When new Elliot turbines became unavailable through the above-noted series of acquisitions, the BBEST team reviewed and ranked available microturbines according to various technical criteria, including efficiency, predicted durability, and availability. The team determined that the Turbec T100, manufactured by Ghergo Industry & Engineering (GI&E), was the best option. Altex, with the help of CMC-E, procured the engine, supporting systems, and technical documentation from the GI&E factory in Recanati, Italy, under match funds to the project.
The Turbec turbine was originally designed by Volvo for military applications. From 1972-1987, Volvo redesigned the turbine for automotive applications and created several demonstration vehicles. ABB contributed the high-speed generator and power electronics. Volvo continued refining the design as a hybrid powertrain until 1998, when Turbec AB was created as a jointly-owned subsidiary of Volvo and ABB to develop the turbine for stationary applications, and renamed it the T100, shown in Figure 12. The T100 product consists of turbine and integrated generator, combustor, gas-to-air recuperator, hot water heat recovery heat exchanger, gas compressor, power electronics, and enclosing cabinet and Balance-of-Plant (BOP) equipment. The turbine is fired with a silo-type combustor designed for recuperated operation; it does not meet California emissions standards. Figure 13 provides the specifications for the complete T100 system.
Figure 12: Turbec/GI&E Turbine
Source: Altex Technologies, Inc
16

Figure 13: T100 SCGT Parameters (standard recuperated configuration)
Source: Turbec
17

Figure 14: Section View of T100 Engine, as Installed in a Recuperated CHP System
Source: Turbec
As can be seen in Figure 14, the turbine housing is usually connected to a recuperator in the distributed-generation-type T100 CHP system. As is typical in these systems, the recuperator component cost is nearly equal to the turbine cost, but has significantly lower durability (approximately half the Mean Time Between Failure.) The BBEST system eliminates the recuperator and creates a simple cycle system, which decreases cost and increases reliability. Normally, a SCGT has half the power generation efficiency of a recuperated turbine (since approximately twice the amount of fuel is required to produce the same electrical power output), but in the BBEST system, all of the energy in the exhaust flows into the burner head and boiler. Thus, the SCGT fuel energy is passed on to the boiler, and the power generation efficiency of the fuel used to produce power is approximately 90 percent.
To implement the changes for SCGT operation, the team reviewed the Turbec engine design and identified strategies to customize the engine for potentially increased efficiencies and more compact packaging.
18

Figure 15: T100 Compressor Operating Characteristics
Source: Turbec
The microturbine’s centrifugal compressor uses a vaneless diffuser, sized for the high volumetric flow of air that is pre-heated in recuperated applications. While vaneless diffusers are easier to develop and manufacture, a vaned diffuser is best for maximum efficiency. Figure 15 provides the engine compressor mass flow and pressure ratio as a function of rotor speed. As shown, both flow and pressure ratio increase with speed. The high velocity flow exiting from the rapidly rotating compressor vanes is slowed down in a diffuser to yield the high pressure air introduced to the combustor.
Altex evaluated the risks and rewards of redesigning the turbine's compressor and housing to implement a vaned diffuser, (shown in a simplified illustration in Figure 16b), and concluded that a new diffuser would require extensive engineering analysis and CFD modeling to ensure the efficient recovery of kinetic energy and avoid flow separations during diffusion. This is a very challenging task and consultation with microturbine engineers confirmed that this engine modification would require substantial time and effort. A potential 3 percent efficiency increase did not warrant the investment cost and potential durability risk.
Figure 16: Diffuser Types, (a) Vaneless and (b) Vaned
19

Source: Altex Technologies, Inc
To adapt the T100 to simple cycle operation, Altex engineers designed a simplified ducting arrangement to connect the compressor outlet with the combustor inlet. This avoided modifying the proven Turbec turbine and housings. Figure 17 illustrates the new duct, shown connected to the compressor discharge at the bottom of the engine and then connecting to the combustor housing air inlet shown at the left side of the engine. Figure 18 shows the implementation of the design on the actual BBEST engine.
Figure 17: Altex SCGT Design
Source¨ Altex Technologies Inc.
Figure 18: Altex SCGT Design Fabricated
Source¨ Altex Technologies Inc
20

The existing GI&E/Turbec combustor is not capable of meeting California requirements for CO and NOx. Altex has proven experience designing combustors capable of low NOx operation. Combustor test data, shown below in Figure 19, shows that NOx is a strong function of the first stage stoichiometric ratio (SRRL), with values above 1.5 giving NOx levels below 4.4 ppmvd @ 15 percent O2. The second stage stoichiometric ratio (SRLL) also impacts NOx, with lowest levels achieved near SR = 1.8. CO emissions are below 3.6 ppmvd @ 15 percent O2 for all SRRL conditions tested. Given the good potential of this combustor design, Altex decided to design a new combustor that would mate to the existing GI&E design and provide the required emissions results.
Figure 19: Altex Sub-scale Combustor NOx and CO Test Results
Source: Altex Technologies Inc.
Source: Altex Technologies Inc.
21

Altex created a process model, based on the proven Altex burner design, to optimize the flow velocities and exhaust gas temperatures throughout the new combustor. This model included external cooling, as well as inlet port velocities for fuel/air mixtures and internal flows of combustion gases. Particular attention was paid to gas temperature at the turbine inlet. A low turbine inlet temperature would reduce turbine efficiency and power output; a high temperature would damage critical turbine components. The combustor design targeted the same temperature as the proven Turbec CHP system to ensure similar turbine component durability.
The mechanical design of the combustor utilizes a flow-splitting method between the primary and secondary combustion zones, similar to that of the proven GI&E combustor, and engineers selected the proper high-nickel alloys for high temperature creep and oxidation resistance. The final design, as shown in Figures 20 and 21, has a lower part count than the GI&E combustor and is predicted to have metal operating temperatures well within material limits for long-term durable operation. A jacket directs cooling air over the hottest sections, and design engineers used CFD to verify uniform air flow, thus avoiding localized hotspots.
Figure 20: Altex-Designed Ultra Low-NOx Silo Combustor,
Showing Exterior of the Combustor
Source¨ Altex Technologies Inc.
22

Figure 21: Altex-Designed Ultra Low-NOx Silo Combustor, Fabricated
Source: Altex Technologies Inc
To reduce risk to the SCGT and system components, Altex designed and built an atmospheric-pressure test setup for preliminary combustor validation testing. This test setup, as shown in Figures 22 and 23, was instrumented to measure relevant temperatures and pressures. After this one atmosphere pressure test was successfully completed, the combustor was installed in the SCGT for testing at 4.5 atmospheres pressure.
Figure 22: One Atmosphere Pressure Silo Combustor Test Fixture Design
Source: Altex Technologies Inc
23

Figure 23: Combustor Test Fixture Fabricated and Installed in the Altex Lab
Source: Altex Technologies Inc
The power electronics (PE) package purchased with the SCGT (Figure 24), has two major functions: to convert the high voltage, high frequency AC generator output into regulated, 3-phase AC power, and to control the operating conditions of the SCGT. These functions can be directly controlled through a multi-function operator interface or remotely via Ethernet-IP. Like the SCGT and other supporting hardware, the PE was purchased under match funds.
Figure 24: SCGT Power Electronics
Source: Altex Technologies Inc
24

The PE, as purchased, was designed for European electrical standards. Output power is regulated to 400V-50Hz AC, which is not compatible with the 480V-60 Hz power found in most US facilities. The BBEST project team worked with GI&E and Turbec to reprogram the inverters for 60Hz operation, and to purchase a compatible 400-480V transformer.
The GI&E turbine requires an oil and coolant supply/control system, as well as a buffer air system (to control oil flow in the turbine bearings) These BOP components were procured with the SCGT, and were repackaged into a compact system with the same form factor as the SCGT cabinet. Where required, 480V 60Hz components were procured to replace 400V-50Hz components.
1.6 Integration Component Analysis and Design The oxygen present in the exhaust of a 100 kWe SCGT can support UNRB firing rates up to 5.5 MMBtu/hr (total system input of 8 MMBtu/hr); above that, additional air must be supplied to meet boiler fuel and heat requirements and maintain 3 percent stack O2. In the BBEST system, an eductor utilizes the kinetic energy of the SCGT exhaust to entrain additional air, thus providing correct oxygen flow to the burner head, without any additional electrical consumption. The BBEST subsystem that contains the eductor—and associated hardware—is called the integration component.
Conventional eductors and air ejectors typically rely on a high-pressure jet as a motive force, and most theoretical models and formulas rely on this initial assumption. However, a high-pressure exhaust system would decrease turbine performance. Therefore, a new model and set of governing relationships had to be derived to correctly design a lower pressure system. Altex staff created this integrated model, which considered conservation of mass, momentum, and energy. The model showed that the SCGT exhaust, which creates a high-volume, high-velocity jet, could entrain up to 80 percent additional combustion air.
The analysis produced globally-correct results, integrated over space, but did not give details of velocity and pressure fields. The model also did not consider a specific eductor length, but assumed that the SCGT exhaust jet would be fully mixed with the entrained air over the full length of the eductor. However, given the high flow rate of the exhaust and the diameter of the exhaust duct on the SCGT, the length for full entrainment in as eductor would be several feet. This would increase the overall size of the BBEST system above that of conventional burners. To solve this problem, the initial BBEST concept, as illustrated in Figure 25, divided the large SCGT exhaust jet into multiple smaller jets (and multiple smaller eductors), which would substantially reduce overall system length. However this conceptual design had too much pressure drop and was not practical for manufacturing.
25

Figure 25: Original Eductor Concept
Source: Altex Technologies Inc
By using multiple jets, the jet surface area exposed to combustion air is increased for a given flow rate. As the diameter of the eductor is reduced, the entrainment distance for a given eduction is reduced. Dividing the approximately 4.5-inch diameter turbine exhaust into eight separate jets of 1.6 inch diameter would reduce the entrainment length by 65 percent. However, this would also result in a higher surface area per flow quantity in each jet, so friction and pressure losses would reduce performance.
Altex engineers created a 2-D model and analyzed it using CF Design to refine the conceptual design. CFD software can predict eduction performance for a given multi-dimensional geometry, thus furthering the practical implications beyond the capabilities of the initial model. Over 100 iterations of potential geometries were studied. To process this many iterations, simplified axisymmetric geometries were used to determine broad results. Promising configurations were then refined and analyzed in 3-D to produce optimized designs. These optimized designs showed the potential to educt up to 90 percent of additional air, even under low-pressure conditions.
Analysis showed that a single, larger eductor, as shown in Figure 26, could meet the system's airflow requirements. Compared to the multiple-eductor system, the single eductor design reduced system complexity, had lower frictional losses, maximized pressure recovery, and
26

reflected a lower-cost design for later manufacturing. Figure 27 shows how the eductor was integrated with the SCGT exhaust. The turbine housing and exhaust nozzle are shown attached to the eductor through a sliding joint with multiple ring seals that accommodate thermal expansion effects as the unit cycles from off to on and various power output conditions. For clarity, the rotating compressor and turbine components are not shown.
Figure 26: Single Eductor Geometry
Source: Altex Technologies Inc
Figure 27: Full Scale Eductor Design Attached to Turbine Exhaust
Source: Altex Technologies Inc
27

Figure 28: CFDesign Results for Full-Scale BBEST Eductor Design
Source: Altex Technologies Inc
Final design efforts focused on refinement for maximum performance at minimum length. Since the BBEST system can be used on new boilers, or retrofitted to existing units, it is desirable for the system to be as compact as existing boiler burners.
Engineers finalized the inlet, nozzle, and throat dimensions (as annotated in Figure 26), and performed detailed analysis on the outlet section geometry by creating six SolidWorks models of eductors with identical inlet, throat, and nozzle dimensions (coded as the “OW design”), but varying outlet lengths. They then analyzed these models in CFDesign at two different downstream pressure conditions. Figure 28 is an example CFD result showing the hot SCGT exhaust flow entering from the left (red color), the educted cold air surrounding the jet (blue), and the two flows mixing (green and yellow) in the downstream diverging section. The predicted test results are shown in Figure 29.
The results showed an optimum eduction percentage at an L/D ratio of 2.65, regardless of downstream pressure. “L” is defined as the eductor outlet length, with “D” the exhaust nozzle diameter. The differing performance at the two downstream pressure conditions was consistent with previous analysis results.
The 2.65 L/D design (named “OW-23”) was then analyzed at a full range of possible downstream pressures that could be produced by differing URNB and boiler installations. Figure 30 shows the improvement in performance realized by the refinement of the eductor outlet. By utilizing the OW-23 design, eduction was improved by 5-10 percent at all downstream pressure conditions. This will allow the eductor to meet system requirements across a wider range of downstream pressure conditions. Considering a system in the 8.4-10.5 MMBtu/hr range that would require 30 percent eduction, the baseline “OW-5” design was predicted to meet this goal at downstream pressures up to 14” WC; the improved “OW-23”
28

design can meet this goal at up to 16” WC, enabling successful operation across a wider range of installations.
Figure 29: Eductor Geometry Analysis Results
Source: Altex Technologies Inc
Figure 30: Final Design Results, Backpressure Sensitivity
Source: Altex Technologies Inc
29

By this time in the project schedule, the BBEST team had identified the demonstration site, and engineers could make more accurate calculations of eduction requirements. The OW-23 design exceeded the site needs for combustion air supply to supply the 10 MMbtu/hr boiler and was accepted as the final design. After a prototype was successfully tested on a smaller SCGT, Altex staff created manufacturing drawings for the eductor and housing, and specified air control valves to regulate combustion air, thus completing the design of the integration component.
1.7 Subscale Eductor Testing Subscale testing occurred in parallel with eductor CFD analysis and mechanical design. Early in the design process, it was important to verify the accuracy of the CFD method. Altex built a sub-scale, low-temperature test fixture, with a pressure blower substituted for the SCGT. Test staff used pitot tubes, water manometers, and K-type thermocouples to measure airflow parameters. The test setup is shown schematically in Figure 31.
Figure 31: Eductor Cold Flow Test Set-up
Source: Altex Technologies Inc
Altex staff fabricated a plastic eductor with variable features and performed a series of tests, creating a data set that could be compared against CFD results. Eduction of the test units can be calculated according the formula given in Figure 32:
Figure 32: Volume-Based Eduction Relationship
where vo is the volumetric airflow of the blower at a given outlet pressure (as determined from the blower’s airflow vs. backpressure curve) with no eduction, and ve is the volumetric airflow measured with the eductor attached. The difference between these two quantities defines the educted air flow rate.
30

Engineers then created planar CAD models of the test eductor, simplified irregularities in diameter—caused by couplings and adapters—as average dimensions, and created additional volumes at inlets and outlets to avoid complex flow conditions at critical boundaries.
From this CAD geometry, the engineers ran an axisymmetric CFD analysis of the nozzle length and backpressure conditions, using a turbulent, low-Mach-number flow CFDesign model. Eductor inlet (blower outlet) flow and temperature was constant for all analyses. Downstream pressure was also constant during the nozzle-length analyses, even though downstream pressure should increase as educted flow increases. Model mesh size was finer near inlets and outlets. To reduce calculation errors caused by variable temperature at the outlet plane of the model (where flow was not completely mixed) the eduction percentage was calculated on a mass basis, as given in Figure 33:
Figure 33: Mass-Based Eduction Relationship
A sample comparison of the experimental and CFD results is presented as Figure 34. Additional comparisons were provided in previous monthly and task reports, supporting the correlation of CFD and practical results.
Figure 34: Backpressure Effects on Eductor Performance (D/d=1.5, 0” Nozzle Length)
Source: Altex Technologies Inc
31

Once the single-eductor design was completed, Altex performed a "nearly full-scale" hot-flow test on the Altex Microturbine Test Bed (AMTB). This test bed is based on an aircraft-type auxiliary power unit (APU) that has design and operating parameters similar to those of the SCGT used in BBEST. The AMTB was available for use at no cost to the project and had been shown in previous testing to produce similar hot flow test conditions anticipated for BBEST. This unit provides approximately 0.5 kg/sec hot gas flow, as compared to the BBEST flow of 0.8 kg/sec. The full scale BBEST eductor design was modified slightly for adaptation to the AMTB, as shown in Figure 35. The red section at left is a representation of the existing test bed’s microturbine outlet; the gray components are test parts, based on the BBEST design.
Figure 35: Near Full-Scale Eductor Test Component Design
Source: Altex Technologies Inc
32

Figure 36: APU-Based Altex Microturbine Test Bed
Source: Altex Technologies Inc
Figures 36 and 37 show the AMTB and the eductor installed on the AMTB, respectively. Using a standard pitot tube and a water manometer, air pressure was recorded across the SCGT outlet, and across the eductor outlet. Engineers then used this data, and corresponding exhaust temperature measurements, to calculate velocity, flow distribution, and eduction percentage. Validation of the eductor design method was accomplished through the agreement between CFD-predicted results (under test bed conditions) and the actual test results.
Figure 37: Eductor Installed on Altex Microturbine Test Bed
Source: Altex Technologies Inc
33

Table 2: Comparison of Test Bed Mode and Eductor Hot Test Results
CFD (Test Point) Test Data Exhaust Flow (kg/s) 0.528 0.525
Turbine Exhaust T (C) 288 288 Eductor Inlet T (C) 18 18
Eductor Outlet P (kPa) 0.12 < 0.25 Eductor Outlet Flow (kg/s) 0.827 0.814
Eduction percent 56.6% 55.1% Source: Altex Technologies Inc
As can be seen in Table 2, the test demonstrated an eduction of 55.1 percent, which is very similar to the CFD prediction of 56.6 percent under the same conditions. Considering the accuracy of the measuring instruments, this agreement is considered excellent. Agreement was even better than the cold-flow analysis and testing, likely due to the more-representative eductor geometry used in this test.
These results and correlation gave the project team confidence in both the CFD’s capability to predict hot flow performance, and the eductor’s ability to entrain enough air to support UNRB operation at the selected demonstration site. Based on analysis and test data, design staff prepared final eductor design drawings, and Altex’s fabrication partners built the integration component, shown in-process in Figure 38. The eductor body is 321 stainless steel (for long-term durability under turbine exhaust operating conditions), and the surrounding vessel is alloy steel. Figure 39 shows the integration component installed on the SCGT, at the left side of the picture.
Figure 38: Partially-Welded Integration Component
Source: Altex Technologies Inc
34

Figure 39: Integration Component (at left) during installation on SCGT
Source: Altex Technologies Inc
1.8 Additional System Components The BBEST system includes a combustion/purge blower and a Flue Gas Recirculation (FGR) blower. Both were specified based on expected system operating characteristics. The combustion air blower, as shown in Figure 40, is a cast-aluminum pressure blower mated to a 10 hp 460V 3 phase motor; the FGR blower, as shown in Figure 41, is a fabricated steel turbo pressure blower, mated to a 3.5 hp 460V 3 phase motor.
35

Figure 40: BBEST Combustion Air Blower, As-Received at Altex
Source: Altex Technologies Inc
Figure 41: BBEST FGR Blower, As-Received at Altex
Source: Altex Technologies Inc
36

Figure 42: High-Temperature Air Butterfly Damper (left) and Fuel Control Valve Assembly
Source: Altex Technologies Inc
Variable Frequency Drives (VFD) and high-temperature-rated butterfly valves regulate the combustion air and FGR flows. The butterfly valves are located on the inlet to the FGR blower and the outlet of the combustion air blower. Since the FGR valve will experience high temperatures (typical FGR temperatures are 250-500 F), rated valves were sourced from fives-North American, a well-established combustion systems component provider. The valve, as shown in Figure 42, is of cast iron construction, fits standard six-inch pipe flanges, and is rated for 700 F. A lower-temperature version was selected used for the combustion air.
The URNB’s initial ignition is accomplished using a blast-type pilot, as shown in Figure 43. This device uses a mixer to create a pre-mix of air and fuel, which is ignited using a spark igniter connected to a high-voltage transformer. This pilot creates a strong and stable flame capable of initiating combustion under all BBEST operating conditions. Engineers bench tested the pilot was bench tested in the laboratory to determine optimal fuel/air settings, flame length, and resistance to blow-off under cross flow conditions (see Figure 44). Once they deemed performance to be satisfactory, the burner fabricator modified the pilot body so it could be integrated into the URNB design.
37

Figure 43: Blast Pilot Assembly Delivered and Ready for Initial Testing
Source: Altex Technologies Inc
Figure 44: Blast Pilot Flame Performance Testing
Source: Altex Technologies Inc
Since the SCGT compressor creates a 4.5 atm flow to the combustor, a high-pressure gas supply, separate from the URNB gas supply, is required. CMC-E provided to the project on a match funds basis a Hydrovane HV07G compressor, capable of delivering 46 cfm @ 90 psig. This brand and model of compressor has been proven reliable at the PIER-supported CHP project at
38

Hitachi in San Jose. The compressor is shown in Figure 45. The team chose South Bend Controls’ fuel control valves for the SCGT fuel control, shown installed in Figure 46.
Figure 45: Hydrovane Compressor Received at Altex
Source: Altex Technologies Inc
Figure 46: Turbine Fuel Control Valves Installed, Ready for Calibration Tests
Source: Altex Technologies Inc
39

The BBEST team chose the Fireye Nexus as the burner management system (BMS) and combustion control system (CCS) solution. This system includes a multi-board controller, touchscreen interface, servo motors, and key sensors (e.g. boiler water temperature and stack exhaust O2 percentage). It is also UL listed and conforms to NFPA 85 requirements for boiler burner control. Altex purchased and installed the controller and touch screen in a NEMA enclosure, as shown in Figure 47. As noted above, the FGR and combustion air blowers are regulated by VFD’s which are also commanded by the Nexus system. As shown in Figure 48, these VFD’s, Altex installed these in an easy-to-access location beside the boiler. The Hydrovane compressor controls were also located nearby.
Prior to delivery to the demonstration site, Altex technicians re-packaged the Nexus, VFD’s, and compressor controls into one enclosure to reduce the system footprint in the boiler room, as shown in Figure 49. This repackaging effort was performed later in the project, once the system configuration and wiring diagram had been refined.
Figure 47: Fireye Nexus System Running in the Altex Test Facility
Source: Altex Technologies Inc
40

Figure 48: Controls for Compressor (left) and Blowers during Installation @ Altex
Source: Altex Technologies Inc
Figure 49: Tightly Integrated Control System for Demonstration Site Installation
Source: Altex Technologies Inc
41

1.9 System Assembly As noted above, the microturbine, as received from GI&E, was configured for recuperated operation. Altex designed and directed the fabrication of the components required to adapt the turbine to a simple-cycle device, and then assembled them to the turbine. After the frame and cabinet assemblies were completed and powder-coated, Altex received and installed the various fabricated components and performed initial system check-outs.
A field service engineer from GI&E, the turbine manufacturer, made an on-site visit to Altex in November 2011, and identified an upgrade to the oil system in the microturbine. The team consulted with the GI&E engineering staff and decided to return the unit to Italy for the desired upgrade. During the December 2011 reporting period, Altex staff installed the upgraded SCGT in the BBEST system, as shown in Figure 50, then fabricated and installed new oil, water and cooling hoses, to accommodate the upgrades.
Figure 50: Turbine Upgrade in Process
. Source: Altex Technologies Inc
Altex and Leva staff also installed the new combustor into the turbine, then fabricated and installed the fuel manifolds and fuel control valves, as shown in Figure 51.
42

Figure 51: URNB Combustor Installed with Fuel Manifolds
Source: Altex Technologies Inc
Altex custom-designed and directed the fabrication of the cabinet and frame assemblies shown in these various figures. These subcomponents provide structural mounting of the SCGT and supporting hardware, as well as meet the thermal, acoustical, and aesthetic requirements of the system. Like all of the custom assemblies and subassemblies, the frames, cabinets, and enclosure panels were fabricated, powder-coated, and delivered by Altex’s California-based manufacturing partners.
The enclosure that houses the Balance-of-Plant (BOP) components has the same form factor as the SCGT cabinet (see Figures 52 and 53), and houses the necessary auxiliary components related to the SCGT’s air, water and oil systems, as well as the microcontroller and terminal block that communicates with the turbine’s Power Electronics.
Altex received the BOP enclosure in June 2011, ahead of the full system. Technicians fit oil, air, and water system components to check for clearance and serviceability (See Figure 53). They then disassembled the enclosure and delivered it back to the fabricator for final welding and painting. This preliminary assembly trial significantly reduced final system assembly time when the remainder of the BBEST system was delivered to Altex.
43

Figure 52: BOP Cabinet Rear View, with Cooling System Components Installed
Source: Altex Technologies Inc
Figure 53: BOP Cabinet, Side View
Source: Altex Technologies Inc
Oil Separator Mounted to Frame
Welded BOP Cabinet
Coolant Heat Exchanger (Radiator)
Oil Tank, Filter,
44

After welding and completing a quality check of the burner, Altex delivered it to the refractory installer, coordinated refractory installation and bake out, and then brought the unit to the test facility. Altex test engineers performed a brief air flow test before installing the unit in the boiler, with the assistance of CMC-E and Leva. The team completed the system instrumentation, and connected calibrated emissions monitoring equipment to the boiler exhaust for real-time emissions sampling. The completed BBEST system and test facility can be seen in Figures 55 and 56.
Figure 54: Burner Head Installation at Altex
Source: Altex Technologies Inc
45

Figure 55: Assembled BBEST System During Final Wiring and Quality Check
Source: Altex Technologies Inc
46

Figure 56: Fully Assembled BBEST System,
Attached to a 250 BoHP Firetube Boiler in the Altex Test Facility, Ready for Testing
Source: Altex Technologies Inc
47

CHAPTER 2: Lab Testing Activities 2.1 Subcomponent Testing To regulate air flow, the BBEST system uses a number of devices, including louver- and butterfly-style dampers. These dampers must be sized correctly for proper system function. When fully open, pressure drop across the device must be low enough to meet system requirements for pumping efficiency and pressure balance. When partially or fully closed, the pressure drop must be high enough that air flow can be accurately controlled.
To determine pressure drop of these components, Altex staff connected each to a blower, measured differential pressure across the device under various flow rates, and extrapolated as need to match expected full-system flow rates. Data from two sample tests are shown below in Table 3.
Table 3: Air Flow Test Data for Louver and Butterfly-Type Dampers
Flow Rate Velocity Differential Pressure (CFM) (ft/s) (in H2O)
Louver Damper (Comb. Air Control) Measured 1413 16 1.8 Extrapolated 2500 27 5.54 Butterfly Damper (Eductor Air Control) Measured 1417 120 2.57 Extrapolated 1700 144 3.7
Source: Altex Technologies Inc
The team also completed low-pressure testing of the SCGT combustor in advance of full system testing. The fully instrumented test fixture, previously shown in Figure 26, was connected to the facility’s emissions analyzers (described in Table 4 and shown in Figure 57). These same analyzers are calibrated daily with certified, known-content gases, and were used for all subsequent URNB, SCGT, and full-system tests described in this report.
48

Table 4: Emissions Monitoring Equipment
1. O2 Analyzer (Backup) Manufacturer: California Analytical Instruments (CAI), Model: 100F Serial No.: R10048 Detection Range: 0-5/10/25percent, Sensor Type: Galvanic Fuel Cell 2. CO2 Analyzer Manufacturer: Beckman, Model: 865, Serial No.: 0103222, Detection Range: 0-5/15/20percent, Sensor Type: NDIR 3. HC Analyzer Manufacturer: Mocon Inc., Model: 9000THA, Serial No.: 1208DN0042, Detection Range: 0-200 ppm, Sensor Type: FID 4. O2/CO Analyzer Manufacture: California Analytical Instruments (CAI), Model: 600 Series with internal sample pump, Serial No.: W12028-MZ, Detection Range: CO 0-200/1,000 ppm, O2 0-25percent, Sensor Type: CO–NDIR/O2- Paramagnetic 5. NO/NOx Analyzer Manufacturer: California Analytical Instruments (CAI), MODEL: 600 Series HCLD with heated sample pump, Serial No.: W12018, Detection Range: 0-3/30/300/3,000 ppm, Sensor Type: CLD Source: Altex Technologies Inc
Figure 57: Altex Test Facility Emissions Monitoring Equipment
Source: Altex Technologies Inc
49

The first low-pressure combustor tests used air only (no fuel or ignition); this experiment characterized airflows at various locations within the combustor, thus verifying the flow distribution to the various zones. These cold tests were followed by multiple firing tests at varying firing rates.
The combustor showed promising emissions data in these preliminary tests. NOx emissions of less than 7 ppm were possible at various stoichiometric ratios, and flame stability was considered good. The new combustor’s overall performance was similar to previous Altex designs, but the relationship of NOx emissions to stoichiometry did not match published laboratory data for truly premixed flames. The literature predicted that the higher stoichiometric ratios would produce lower NOx than observed. This indicated that some modification to the new combustor was required to reduce NOx at higher air-to-fuel ratios. The first area of modification was the fuel injection system.
Fuel injectors can be characterized by the ratio of outlet-to-inlet area (Ao/A). A higher ratio implies a lower pressure drop design, but at the potential expense of fuel/air mixing. The initial design exhibited both characteristics. Altex tested a modified-outlet-area design, but it had a negligible (or possibly negative) effect on emissions. Altex then substantially re-designed the injector to have a substantially smaller area ratio, and emissions results met expectations and published data. Pressure drop through the injector was still acceptable. The results of these iterations are shown in Figure 58.
Figure 58: BBEST Combustor Emissions Results (Corrected to 15 percent O2)
Source: Altex Technologies Inc
The team concluded that the improved combustor would meet the SCGT inlet temperature requirement of 950C. After the injector modifications, NOx and CO emissions followed a
50

downward trend as the firing rate of the combustor was increased, likely due to better upstream mixing of the fuel and air. Therefore, emissions at the higher firing rate of the SCGT were expected to be as low (or lower) than what was achieved in the one atmosphere pressure testing. The operating parameters that created the lowest emissions conditions were scaled to match the SCGT airflow at various turbine speeds. Similarly, the fuel ratios, based on the one atmosphere testing, were adjusted to achieve the desired stoichiometries.
2.2 URNB Testing Prior to installation and firing of the URNB, engineers performed cold flow tests were performed to characterize the air flow through the primary and each secondary, at several total air flow rates of interest. These data verified the primary and secondary air flow, and the air flow split between the two zones. Data in that test was acquired using water-tube manometers and pitot tubes, which would have been impractical for real-time, live fire testing. To improve test efficiency, Altex invested in electronic pressure sensors, purchased with match funds, to replace the manometers. Altex technicians wired these devices to the facility DAQ and engineers applied proper signal conditioning and scaling factors. The CO, NOx, and O2 analyzers were also wired to the DAQ. After these upgrades, all pressure, temperature, and emissions sampling data were electronically acquired.
After cold-flow testing was complete, the team installed the burner head in the Superior boiler, and the burner head primary zone was successfully fired at up to 2 MMBtu/hr, as shown in Figure 59. The test conclusions were that:
• The primary had good light-off characteristics and was stable with low noise.
• Mixing in the primary appeared to be good and the hot exhaust gases spread out upon exiting the reactor.
• At higher firing rates, mixing improved and the flame was more active, which is desirable.
51

Figure 59: BBEST Burner Primary Flame
Source: Altex Technologies Inc
Burner head testing continued with secondary zone firing and increased total firing added to the test schedule. Altex performed a series of tests at varying total stoichiometric ratios (SRt), and collected emissions, temperature, and pressure data. The SRt value is a measure of the excess air level in the boiler. An SRt of 1.2 indicates an excess air level of 20percent (i.e. Excess air = 100*(SRt-1)) SRt is calculated based on oxygen percentage in the boiler exhaust, and all NOx and CO data are corrected to the boiler standard 3 percent O2. For the boiler sizes of interest, the Air Quality Management District (AQMD) boiler emissions limits are 400 or 50 ppm CO (for retrofit or new applications, respectively) and 9 ppm NOx. The Westin demonstration site was eventually issued a permit with a 100 ppm CO limit and a modified NOx limit that partially considered the two-source nature of this unique CHP solution. As shown in Figure 60, emissions results at 3:1 turndown satisfied the retrofit requirements in an SRt range of 1.25 - 1.50. At SRts from 1.25 to 1.5, the emissions results satisfied the site permit limits as well.
52

Figure 60: Preliminary BBEST Emissions
(SCAQMD retrofit emissions limits shown w/ dashed lines)
Source: Altex Technologies Inc
At this time, it was determined that the recently-upgraded gas supply to the facility could not support high-fire testing, and Pacific Gas and Electric was contacted to perform the necessary gas supply upgrades.
2.3 SCGT and Full System Testing Altex removed the combustor from the low-pressure test fixture, installed it in the Turbec microturbine, and successful light off was achieved. As shown in Figure 61, the combustor produced relatively stable operating conditions and speeds of the turbine. For these preliminary tests, generator output power was limited, and sinusoidal behavior of the fuel control was noted. Turbec was contacted and a list of action items was pursued to eliminate these oscillations.
53

Figure 61: Preliminary Turbine-Only Test Results
Source: Altex Technologies Inc
Once stable SCGT operation at high power levels was achieved, and the facility gas supply upgrades were completed, the team began testing in Combined Heat and Power mode. As shown in Figure 62, the SCGT power output was first regulated first to 80 kWe. After turbine operation was stable, the URNB controls lit and proved the pilot flame, and then lit and proved the primary (main) combustion zone flame. A stable flame was observed and facility instrumentation confirmed fuel-rich operation. Primary stoichiometric ratio was varied by decreasing the URNB's main fuel valve position, and fuel flow was confirmed using the facility gas meter. Fuel was decreased until a flame-out occurred, thus establishing the lean limit for the primary zone under these operating conditions. The SCGT power output was then set to 100 kW, and the URNB successfully relit, using the same procedure. This preliminary CHP-mode testing represented a significant milestone in the BBEST project. This test successfully demonstrated:
• Successful and sustained light-off of the burner head with turbine exhaust.
• CHP-mode operation at multiple power levels (of both SCGT and URNB).
• Transition from 5:1 turndown (SCGT only) to higher firing rates (SCGT+URNB).
• Stable turbine operation under varying burner head operating conditions.
54

Figure 62: Preliminary CHP-Mode Testing
Source: Altex Technologies Inc
Over the following months, Altex demonstrated CHP operation at higher firing rates, making successive refinements to various system components and tuning parameters to achieve the project goals. Final, testing efforts focused on control system advancements and emissions reductions, with the main focus on SCGT emissions.
One atmosphere pressure bench testing of the silo combustor had shown the combustor’s ability to reach sub-5 ppm NOx emissions requirements (ref. Figure 58). Initial testing at full pressure in the turbine had shown similar NOx emissions for initial operation, and low CO emissions at all times. However, NOx increased as the system and room reached stable and higher operating temperatures. As verified by modeling and analysis, this behavior indicated that the ratio of combustion air to dilution air needed tuning. Altex implemented and tested two successive improvements, with results shown in Figure 63.
55

Figure 63: Combustor Modification Results
Source: Altex Technologies Inc
The baseline condition produced a best result of 8.7 ppm NOx corrected to 15 percent O2. The combustor was then removed from the SCGT, and the air flow was adjusted by installing a specially-fabricated gasket. The combustor was reinstalled and retested, yielding a minimum of 4.9 ppm NOx. The combustor was removed, and another specially-fabricated gasket was installed. This configuration yielded 3.9 ppm NOx, thus matching the one atmosphere pressure test results. As shown, all configurations yielded <10 ppm CO, which satisfies AQMD requirements for both boiler burners and simple-cycle gas turbines.
At the end of this testing, the combustor was removed and disassembled. The changes tested using gasket modifications were made permanent through re-machining of the combustor housing. The combustor was re-assembled with full thickness gaskets, and retested, to verify the efficacy of the modifications. The previously-experienced results of 3.9 ppm NOx (@ 15 percent O2) were duplicated with the permanently-modified unit. Altex staff then removed the URNB burner head from the boiler and inspected major sub-systems. The burner was then sent to Altex’s fabrication partner for further inspection and final refinement. They returned the burner and Altex staff re-installed the URNB in the boiler, as shown in Figure 64, for final calibration, the results of which are shown in Table 5.
56

Figure 64: BBEST URNB Re-installation in the Altex Test Facility
Source: Altex Technologies Inc
57

Table 5: BEST Emissions Test Results
Burner Head-Only (back-up) Mode
Firing Rate O2 NOx CO
MMBtu/hr percent (dry) ppm (@ 3percent
O2) ppm (@ 3percent
O2)
5.7 4.0 8.9 35 7.1 3.3 8.7 17
8.1 4.3 8.9 19
Low-fire CHP Mode (SCGT-only) Firing Rate O2 NOx CO
MMBtu/hr percent (dry) ppm (@
15percent O2) ppm (@
15percent O2)
2.58 15.2 4.3 9.6
Mid- and High-fire CHP Mode Firing Rate O2 NOx CO
MMBtu/hr percent (dry) ppm (@ 3percent
O2) ppm (@ 3percent
O2)
4.3 11.5 14.8 32 5.0 9.4 14.8 32 5.7 7.9 14.2 14 7.3 4.3 13.0 50 9.1 3 9.8 50
Source: Altex Technologies Inc
The values in Table 5 represent stable operating conditions, and are good compromises between emissions, stability, and potential for robust modulation. Lower NOx values could be obtained through increases in FGR, at some sacrifice of CO performance, which may be permissible under some AQMD retrofit limits. The ratio of primary-to-total fuel can also be varied to balance NOx and CO in the field demonstration. Altex expected that results in the field would differ slightly from the laboratory testing, but the extensive characterization performed in the lab would later reduce field commissioning time. After emissions tuning was complete, several extended runs were performed (6-12+ hours) to verify modulating ability, and all relevant safety systems were verified. These safety interlocks and devices were re-checked again as part of the installation process at the demonstration site.
58

CHAPTER 3: Field Demonstration 3.1 Demonstration Site Selection The site selection process was a coordinated effort between Altex, CMC-E, Leva Energy, and AHM Associates. AHM Associates has supported CEC projects for CHP demonstrations for both Altex and CMCE, and Lou Brizzolara, president of AHM and an advisor to Leva Energy, provided a list of potential users of the technology. Throughout the project, he provided an important perspective on key site interests and participation requirements.
The principal factor in the site selection was support and interest from the host in participating in the demonstration of a new and unique technology. The team also evaluated:
• The potential energy and cost savings to the owner of the facility.
• The availability of a spare boiler, so thermal load would not be interrupted during the retrofit and startup.
• Ease of access to the facility for installation.
• A base electrical load demand sufficiently greater than the 100 kW generated so as to facilitate simple parallel grid interconnection.
• Willingness to provide match funds for the installation.
• Future access to the facility to document performance and energy savings.
In addition, the process was influenced by the commercial interests of Leva Energy—which will commercialize BBEST under the product name “Power Burner”—and the Southern California Gas Company (SCG), which supported BBEST technology as an important innovation in the field of small-scale distributed generation (DG).
From among the list provided by AHM, the team first considered the Lockheed Martin (LM) campus in Sunnyvale, CA. Leva Energy assumed a lead role in establishing negotiations with potential sites under the Altex subcontract and a meeting was held with LM representatives at the offices of San Jose Boiler Works in San Jose, CA. However, after several discussions with LM and its service organizations on the merits of the project, LM decided to pass on this opportunity.
Altex was then made aware of the Costa Mesa Westin Hotel as a potential site. This initial recommendation was made by SCG, which has an interest in demonstrating novel technologies in its territory. Representatives from Altex, CMCE, Leva, and SCG attended a meeting at the Westin in Cost Mesa, CA on February 17, 2011 with Joe Gurnari (Director of Engineering at the Westin Hotel), Henry Mak (Senior Technology Development Advisor at SCG) and Jesse Martinez (account Executive at SCG). Interest in the BBEST retrofit was in part associated with the NOx compliance requirements for this unit under South Coast Air Quality Management District (SCAQMD) rules. Preliminary agreements were reached with Mr. Gurnari with the
59

expressed desire by SCG to go ahead with this demonstration. The BBEST team presented a more formal proposal to the Westin management with an estimate of the return on investment (ROI). Final approval for the project was received from Host Properties, the holding company for the Westin, following review of the proposal.
The Westin’s existing boiler was a Bryan bent-tube packaged boiler with a rating of 10.5 MMBtu/hr firing capacity (250 BoHp). Figure 65 shows a manufacturer-supplied photo of one such unit. The Bryan boiler is one of two units at the site. The other unit is a smaller capacity 125 BoHp Unilux watertube, used primarily for backup and for excess capacity requirements. Figure 66 shows the front of the actual Bryan boiler. Installation of the BBEST technology required the complete replacement of all the equipment shown in light blue color.
Figure 65: Bryan Watertube Boiler
Source: Bryan Boiler Co.
60
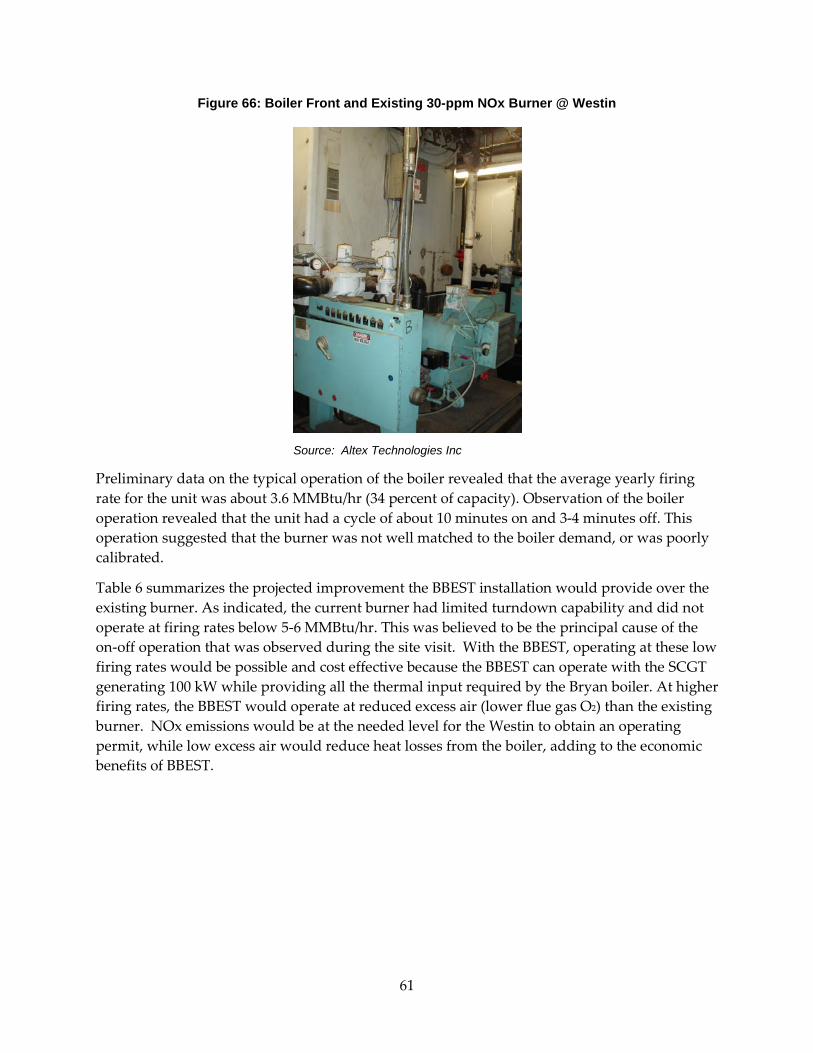
Figure 66: Boiler Front and Existing 30-ppm NOx Burner @ Westin
Source: Altex Technologies Inc
Preliminary data on the typical operation of the boiler revealed that the average yearly firing rate for the unit was about 3.6 MMBtu/hr (34 percent of capacity). Observation of the boiler operation revealed that the unit had a cycle of about 10 minutes on and 3-4 minutes off. This operation suggested that the burner was not well matched to the boiler demand, or was poorly calibrated.
Table 6 summarizes the projected improvement the BBEST installation would provide over the existing burner. As indicated, the current burner had limited turndown capability and did not operate at firing rates below 5-6 MMBtu/hr. This was believed to be the principal cause of the on-off operation that was observed during the site visit. With the BBEST, operating at these low firing rates would be possible and cost effective because the BBEST can operate with the SCGT generating 100 kW while providing all the thermal input required by the Bryan boiler. At higher firing rates, the BBEST would operate at reduced excess air (lower flue gas O2) than the existing burner. NOx emissions would be at the needed level for the Westin to obtain an operating permit, while low excess air would reduce heat losses from the boiler, adding to the economic benefits of BBEST.
61

Table 6: Predicted Improvements over Existing Burner – 8/11 Test
Firing Rate Existing Burner BBEST – Power Burner
Flue O2 (percent) NOx (lbs/hr) Flue O2 (percent) NOx (lbs/hr)
2 MMBtu/hr Could not Operate
Could not Operate 15.2% 0.038
6 MMBtu/hr 9.2% 0.055 7.5% 0.045
9 MMBtu/hr 5.2% 0.063 3.0% 0.045
Source: Altex Technologies Inc
Table 7 summarizes the savings estimated for the Westin using the BBEST instead of a more conventional low NOx, high excess air burner. The total annual savings for the Westin are estimated at $105,000, based on using the Bryan boiler as the base load unit, i.e., year around operation such that the SCGT always exports a net 100 kWe. The net savings are calculated by adding the electricity savings plus the boiler energy savings, minus the additional fuel cost.
Table 7: Energy and Environmental Savings
Per hour Yearly (thousands)
Power Generated, kW 100 876
Added fuel use, MMBtu/hr 0.42 3.68
Added fuel cost, $ $2.8 $24.3
Electricity savings, $ $13 $113.9
Boiler efficiency savings, $ $1.8 $15.77
Net savings, $ $12.0 $105.0
NOx reduction, lbs 0.038 0.33
Indirect carbon reduction, tons 0.018 0.16
Gas price at $6/MMBtu; Electricity price at $0.13/kWh; 8760 hrs/yr operation. CO2 emission reductions compared to central combined cycle power plant.
Source: Altex Technologies Inc
Because the selected host site is a hotel, it is subject to significant seasonal and hourly variations in steam demand coinciding with laundry, kitchen, and room occupancy. It is important for the CHP technology to be able to address this variation in steam demand, especially to match the high turndown requirement for the burner.
Figure 67 shows the average monthly and daily heat input to both boilers for the hotel during January, April, and July of 2011. As indicated, during any particular day, the thermal load can fall to as low as 1.9 MMBtu/hr in a summer month, whereas for the winter months the average
62

daily thermal load is only slightly higher. Therefore, the BBEST has to target a high turndown capability that allows firing rates as low as 1.9 MMBtu/hr, or even lower on any given hour. This is possible since the system can operate only the microturbine.
Figure 67: Westin Monthly Steam Demand
Source: Altex Technologies Inc
3.2 Field Test Planning, Permitting, and Installation Representatives from Altex, CMCE, and Leva Energy participated in several site inspections to provide critical input on the layout of the BBEST equipment, including auxiliary equipment such as the Turbec power electronics (PE) cabinet and voltage transformer from Turbec, the Hydrovane gas compressor and the FGR blower. Fuel gas piping to and from the gas compressor and flue gas ducting for the FGR blower were also included in the equipment layout evaluation.
With this information in hand, Altex prepared an equipment layout diagram illustrated in Figure 68. The proposed layout was discussed with the installer, contracted by Leva to perform all site modifications and install the equipment as specified by Altex. Input from the installer was used in making final changes to the layout, including location of the FGR blower and the gas compressor. The contractor led final reviews with Westin staff to ensure that remaining floor space was adequate for the normal operation, maintenance and supervision of the boiler room.
63

Figure 68: Planned System Layout
Source: Altex Technologies Inc
The SCAQMD’s Rule 1146 requires that boilers meet 9 ppm NOx limit, corrected to 3 percent O2 with CO emissions not to exceed 400 ppm for retrofits, or 50 ppm for new boiler installations. An initial Permit to Construct was issued by SCAQMD, based solely on Rule 1146. The SCAQMD NOx limit for simple cycle gas turbines is 9 ppm, corrected to 15 percent O2, which is equal to 27 ppm when corrected to 3 percent, but this was not considered in the original permit.
The project team felt that Rule 1146, as a boiler-only regulation, did not suit this new and novel technology because the BBEST is a CHP system that incorporates a SCGT that cogenerates power, as well as a burner, which no other low NOx burner includes. Specifically, the BBEST provides two useful outputs, power and heat, that if produced separately by conventional BACT-compliant technology would yield emissions that would be the addition of the two technologies.
Because conventional burner emissions are corrected to a dilution factor of 3 percent O2 at all boiler heat input rates, and because the concentration of O2 increases significantly as burner firing rate is reduced to low boiler load, the influence of this correction factor increases the
64

reported emission rate, making BBEST compliance as a boiler standard difficult at boiler loads lower than design capacity. As Figure 69 shows, at a boiler heat input of about 2 MMBtu/hr, only the SCGT is firing, and O2 in the boiler exhaust is 15 percent O2. Thus, 9 ppm NOx at 15 percent O2—which is the SCAQMD’s BACT limit for small gas turbine CHP—translates to a boiler stack level of 27 ppm (9 ppm x3). This limit would represent an acceptable, and BACT- supported emissions level for BBEST. However, the initial permit based on boiler burner BACT required 9 ppm NOx at 3 percent O2. If this were imposed on BBEST, it is likely that it would be challenged to show compliance, although the system easily meets the SCGT BACT. This highlights the importance of obtaining a separate and relevant BACT for this unique technology. However, an interim permit was needed to allow demonstration and the collection of data to support an Achieved in Practice BACT.
Figure 69: Effect of O2 Correction Factor on Reported Emissions
Source: Altex Technologies Inc
A meeting was held at the SCAQMD offices to better describe the technology to the permit administrators and highlight the rationale for an alternate permit level that is more consistent with the CHP configuration of BBEST and more in line with the laboratory-proven performance. This meeting was attended by Altex Technologies, Leva Energy, AHM Associated, and Joe Gurnari of the Westin. This meeting resulted in the issuance of a revised Permit with adjusted NOx limits.
At the low load condition, where only the SCGT is operating, the SCGT BACT limit is applied. At the higher load points, a combination of SCGT and boiler burner BACT limits are applied, using fuel consumption as a scaling factor. SCAQMD officials encouraged the BBEST project to submit a proposal for revised limits that would not violate existing BACT but would reflect the
65

unique operating modes of the novel technology. At firing rates over 8 MMBtu/hr, the AQMD maintained boiler limit of 9 ppm NOx @ 3 percent O2 was maintained, even though that does not accommodate the two-source nature of the unique BBEST technology.
A Simplified Interconnection Agreement was filed with SoCal Edison, to allow operation of the SCGT generator without net export to the grid from the facility. Staff made multiple visits to the Westin site to review installation details and plan for the demonstration. The boiler targeted for retrofit was installed in 1974, and required maintenance after such a long service life; this was performed prior to BBEST installation.
In early September 2012, Altex removed the BBEST system from the boiler in the Altex Test Facility and fitted into custom-built crating, as shown in Figure 70. The system was shipped to Southern California, where it was unloaded at the installation contractor’s facility, as shown in Figure 71, and delivered to the Westin demonstration site.
Figure 70: URNB During Crating at Altex
Source: Altex Technologies Inc
66

Figure 71: System Re-staging at Installation Contractor’s Facility
Source: Altex Technologies Inc
Once at the Westin, Altex and its contractors moved the individual components to the 17th floor of the hotel, and rigged them into the boiler room. Installation began immediately, and progressed through October and into November. Altex and Leva staff were on site throughout the installation. Following installation, a thorough safety system check-out was performed, to ensure compliance with National Fire Prevention Association (NFPA) guidelines, and to verify proper function of all critical system components. All tests were passed.
Various images of the system during and after installation are presented in Figures 72-76.
67

Figure 72: BBEST Turbine Enclosure During Installation at Westin Site
Source: Altex Technologies Inc
Figure 73: Completed Pilot, Ignition Transformer, and FGR Piping
Source: Altex Technologies Inc
68

Figure 74: Burner Control Cabinet Installation Complete
Source: Altex Technologies Inc
Figure 75: Boiler Room Entrance—PE at left of red doorframe, in hallway;
SCGT and burner control cabinet at right, inside the boiler room
Source: Altex Technologies Inc
69

Figure 76: Completed SCGT Controls and Power Output, from left to right:
SCE-compliant Intertie Relay; 480V transformer; SCGT Power Electronics
Source: Altex Technologies Inc
Upon request by the City of Costa Mesa, Leva contracted Underwriter’s Laboratories to perform a Field Evaluation of the BBEST installation. UL staff was on-site at the Westin for three days, spread over two separate trips, and were supported by Altex engineering staff. Together, UL and Altex reviewed component specifications, tested safety features, and assembled documentation of component compliance. After completion of the second and final visit, UL issued a “Field Evaluated Product” for the burner controls cabinet, as shown in Figure 77.
Leva contractors also installed the Grid Intertie Relay system (shown at left in Figure 76); this provides a redundant grid-monitoring function to ensure hotel power is of good quality. If the device detects any issues, it initiates a standard (non-emergency) SCGT shutdown, and provides visual notification to facility staff of the potential issue. This device is also UL-listed, thus providing UL-listed safety monitoring of the SCGT and the URNB.
70

Figure 77: UL Field Evaluated Product Sticker, applied to BBEST controls cabinet
Source: Altex Technologies Inc
In anticipation of commissioning tests, the hotel steam system was retrofitted with isolation valves and a steam vent, to allow sustained testing at desired firing rates without affecting hotel steam supply.
During December 2012, Altex performed full system testing, including a ten-day continuous test, where the BBEST system handled 100 percent of the facility steam demands (no venting). Test procedure details were submitted as part of the Task 10 report, and the results of primary importance are presented here. Hotel steam demand was so much less than burner capacity (ref. Figure 83), that even with the steam vent valve venting up to the maximum make-up water flow to the boiler, sustained testing at high fire was not possible. Subsequent testing showed that hotel steam demand could be satisfied with 7.3 MMBtu/hr, and calibration was possible at this load. Even though extensive high-fire calibration was not possible, the BBEST system appears to be easily capable of meeting the facility steam needs, while meeting the <8 MMBtu/hr SCAQMD permit limits.
3.3 Altex Field Test Data Initial tests showed that minimal changes were needed to the calibrations developed during the extensive testing in the Altex Test Facility. Figures 78 and 79 present the NOx and CO emissions, respectively, recorded over several days of testing. CMC-Engineering had recorded emissions from the Gordon-Piatt burner previously installed on the boiler, and those results are indicated by the “8/2/2011 Gordon-Piatt Burner” points in blue. The permitted NOx or CO limits for SCGT-only and SCGT+URNB are shown as dashed lines on the respective figures.
71

Figure 78: NOx Emissions at Westin Demonstration Site
Source: Altex Technologies Inc As shown in Figure 78, all NOx data points from the BBEST system fell below the permitted limits and indicate over 50 percent reduction in NOx emissions from the previous burner. The repeatability of the results over the course of several days testing indicates a robust control system and stable operation.
Figure 79: CO Emissions (corrected to 3 percent O2) at Westin Demonstration Site
Source: Altex Technologies Inc
72

As shown in Figure 79, all CO data points from the BBEST system fell below the permitted limit of 100 ppm. In this case, CO emissions were also lower than the previous burner. Since CO emissions are strongly influenced by the boiler furnace temperature and configuration, a reduction was not necessarily expected, especially since the previous burner was operating at <20 ppm CO.
After engineers established fuel and FGR settings, and observed acceptable emissions, they placed high priority to modulation and recycle ability, as these are key functions to meeting variable steam demand. The Nexus control system uses a boiler steam pressure sensor and a PID (Proportional-Integral-Derivative) controller to modulate URNB firing rate. Initial settings of the PID loop were able to maintain adequately-stable steam pressure, and further tuning of the PID and the timing of burner recycle events enabled even more-stable performance.
The Westin has two boilers, the other being a 5 MMBtu/hr Unilux equipped with a Powerflame matrix-style burner. During the retrofit activities, the Unilux supplied steam to the hotel, and Altex logged fuel flow to the Unilux, for comparison. Figure 80 presents this comparison of the two systems—Unilux+Powerflame and Bryan+BBEST. Both data sets were collected on the same day of the week, as facility demand is very dependent on the cyclical occupancy rate of the hotel.
Figure 80: Fuel Flow Comparison—BBEST (aka PB 100) vs. Matrix Burner (Powerflame)
Source: Altex Technologies Inc
73

The rate and range of modulation varies for both boiler/burner combinations, depending on time of day and hotel occupancy, but as Figure 80 shows, at this heat demand the BBEST system required less variation in fuel flow to maintain a stable steam pressure. According to Westin facility engineers, steam pressures between 60 and 115 psig are acceptable, so the 80-95 psig range with the BBEST system easily meets those requirements. The BBEST-equipped boiler was able to meet demand across all conditions encountered. The Unilux boiler was not equipped with a steam pressure sensor that could be connected to data acquisition equipment, but it also meets facility demand.
In Figure 80, the BBEST-equipped boiler shows a higher average fuel consumption, and this can be attributed to a combination of factors: cooler weather conditions between November and December, fuel consumption for electrical power generation in the SCGT, and the inherent inefficiency of the 250 BoHP Bryan boiler, which was installed in 1974, as compared to the 125 BoHP Unilux boiler, which was installed in 2012.
3.4 Third Party Emissions Test Results To provide third-party validation of test results, Altex cooperated with Southern California Gas’ EAC-Applied Technologies group to perform emissions and efficiency testing of the BBEST system. The testing was performed on December 13, and utilized two Testo 350 meters (one supplied by EAC-AT and another from SCG’s Industrial Service Technicians group; those data sets are indicated as “AT Data” and “IST Data”, respectively, in the graphs that follow.)
SoCal Gas also provided previous data from a 2010 test of the boiler, in which firing rates were designated as “Low”, “Medium” and “High”, though no specific fuel flow data was recorded during that test. For the December 13 BBEST tests, fuel flow data was recorded using Altex’s Sierra BoilerTrak meter. In the data presented below in Table 8, EAC-AT used the 2010 data for comparison, but the low/medium/high labels may not represent identical firing rates between 2010/2012 data sets. (In particular, examination of O2 percent and stack temperature data from the 2010 tests indicates that the “Low” firing rate was less than 4.2 MMBtu/hr.)
Table 8: Test Point Comparison
12/13/12 BBEST Operating Condition
12/13/12 Firing Rate (MMBtu/hr)
2010 Gordon-Piatt Operation Condition
2010 Gordon-Piatt Firing Rate (MMBtu/hr)
SCGT-only 2.5 N/A N/A SCGT+URNB 4.2 G-P Burner “Low” SCGT+URNB 5.2 G-P Burner “Medium” SCGT+URNB 6.3 G-P Burner “High”
Source: Altex Technologies Inc The following results were reported by EAC-AT in a Draft Report, and are repeated verbatim below as Figure 81. The SCG/EAC NOx results are consistent with those obtained by Altex. Measured CO emissions were higher than measured by Altex, and further tuning was
74

performed after the SCG test to maintain low CO. Regardless, the SCG CO data is still well under the permitted 100 ppm limit. As expected, boiler efficiency improved with BBEST.
Figure 81: SCG Test Report Excerpt—All Sourced from SCG-EAC Draft Report
Combustion Efficiency Chart below compares the combustion efficiency of the boiler. Average baseline data efficiency was 77.5% while recent test shows average efficiency of 76.9 and 76 % efficiency, for AT and IST data, respectively. It is observed that the highest efficiency occurs at higher firing rates (6.3 MMBTU/hr, AT data) with 79.8% efficiency as the maximum value.
Emissions Data The following charts are emission comparison [sic] of the three sets of data. NOx Emissions
75

In comparison to the baseline data, it is observed that the NOx emissions have decreased with the use of the Power Burner. This is consistent with Leva Energy’s claim of lower NOx emissions with the use of their Low-NOx burner. Only three levels of firing rates were available for baseline data (low, medium and high). As mentioned earlier, for comparison purposes, these three levels were compared against the last three firing rate values of the recent test. The NOx emissions decreased by as much as 70% with the use of the Power Burner.
CO Emissions
Source: Altex Technologies Inc
CO emissions increased/decreased depending on the firing rate. Overall, all CO concentrations are less than 90 ppm for all cases.
3.5 24-Hour Performance Demonstration After emissions testing was complete, and modulation/recyclability proven, Westin staff aided Altex in reconnecting the Bryan boiler to the hotel steam system. They closed the steam vent closed, and the Unilux boiler turned off. At this time, the BBEST system began a 24-hour/day demonstration that spanned ten days. The system was continuously attended by staff from Altex, CMC-Engineering, and Leva Energy, but operated automatically. Figure 82 summarizes the test results.
76

Figure 82: BBEST Demonstration Test Summary
Source: Altex Technologies Inc
The system operated continuously, with no unplanned shutdowns, throughout the test period. The only interruption was on December 11, 2012, to replace a facility gas meter for service, after which the system was restarted. Power output from the SCGT power electronics averaged 98.24 kW, exporting 2,000 kWh to the facility. Net power production (including turbine gas compressor consumption) was 90.5 kWe.
Data on boiler and BBEST operation was continuously acquired throughout testing, and two representative days’ data, from the beginning and end of the test period, are presented as Figures 83 and 84. As in other tests, the BBEST system met facility steam demand under all conditions, generated 100 +/- 5 kWe, all while emitting 50 percent or less NOx emissions than the previous burner.
77

Figure 83: 24 Hour Operation, December 5, 2012
Source: Altex Technologies Inc
Figure 84: 24 Hour Operation, December 12, 2012
Source: Altex Technologies Inc
78

At the completion of the 24 hour test, the Westin placed the Unilux boiler back on-line, and contacted the City of Costa Mesa to gain approval for full-time operation of the system. Altex and Leva supplied all required documentation to SoCal Edison for approval of the Simplified Interconnection Agreement, and UL reviewed the burner safety system and controls, granting Field Approved Product status.
Staff returned to the site in January and February to perform final check-outs, verification activities, and operator training, and continues to provide ongoing technical support and operator training.
79

CHAPTER 4: Commercialization Activities 4.1 Performance and Cost Evaluation Results As described above, today’s commercially available sub-9 ppm boiler burners use either high excess air or high Flue Gas Recirculation (FGR) to control NOx. Both approaches waste heat and electrical energy, causing increased operating costs and greenhouse gas emissions. BBEST operates at low O2 levels and with less FGR than competing technologies, while generating 100 kWe power. This will provide boiler owners with a quick payback on their low-NOx burner investment.
Most boiler owners in California meet NOx regulations by replacing their burners. The current technologies, which are usually grouped as “ULNB”, fall into two categories: Surface Air Burners (SAB) and Rapid Mix Burners (RMB). SAB use high levels of excess air and RMB use a combination of excess air and FGR. Table 9 outlines the key advantages of the BBEST system when compared to these competing systems.
Table 9: Ultra Low NOx Burner Comparisons
Surface RMB BBEST
Manufacturers ST Johnson, Alzeta, PowerFlame
John Zink (COEN/TODD)
Leva Energy
NOx (ppm) 9 9 9
Sample Capacities (MMBtu/hr)
5-50 30-50 5-50
Excess Air (percent) 70-80 20-25 15-20
FGR (percent) 0 35-40 0-25
Blower Size (kW) 4-37 6-45 0-18
Turndown 2-4 3-4 5-10
Energy Costs/Yr ($1,000’s)1
298-2,980 1,730-3,025 208-2,785
Payback2 (Years) N/A N/A 1-2
1 Operating Costs include fuel and electricity and is a measure of overall energy efficiency. Assumes 8,000 operating hours per year; $7 per MMBtu Natural Gas; $0.12 kW/hr electricity
Source: Leva Energy
As shown in Table 9, the excess air FGR for BBEST can be significantly less than that for competing SAB and RMB burner designs. This translates to less air/FGR pumping power needs, which reduces blower capital and operating costs, as highlighted by the difference in blower size. Also, as shown in the field demonstration, BBEST turndown is superior to alternatives,
80

providing more operational flexibility. Energy costs are lower with BBEST, but of most significance is the output of valuable electrical power. This leads to a payback of less than two years. Competing products offer no payback.
We calculated BBEST’s Levelized Cost of Energy (LCOE) over a ten-year period. Using $0.70/therm natural gas, the LCOE is $0.067/kWh, which is well below the average industrial and commercial electricity rates in California. This is primarily achieved by BBEST’s low $/kW cost and its extremely high efficiency (measured by a heat rate of 3800-4200 BTUs/kWh, depending on ambient conditions).
Leva staff completed an analysis of other Distributed Generation (DG) systems, and compared their Levelized Cost of Energy (LCOE) to BBEST, utilizing the National Renewable Energy Laboratory’s calculation method. The results are shown in Table 10.
Table 10: BBEST LCOE Analysis Inputs and Result
Parameter Units Value
Time Period Years 20
Discount Rate percent 10
Capital Cost $/kW 2650
Capacity Factor percent 95
Fixed O&M Cost $/kW-yr 41
Heat Rate Btu/kWh 3800
Fuel Cost $/MMBtu 6
BBEST LCOE $/kWh 0.067
Source: Leva Energy
We determined that the resultant BBEST LCOE of $0.067/kWh is superior to that of other Distributed Generation technologies, including conventional Combined Heat and Power, fuel cells, solar, and large gas turbines, as shown in Table 11.
81

Table 11: Comparison of LCOE for BBEST and Conventional CHP Systems
(1) Levelized Cost of Energy (LCOE) calculation uses $6.50 gas, full capital costs (before rebates), 20-year useful life, $0.41/kW-yr for O&M, 95percent capacity factor, and 3,812 Btu/kWh Heat Rate. Other rates are published and include rebates/incentives.
(2) CO2 emissions measured in tons per MW/hr equivalent (3) Footprint measured in sqft/kW.
Source: Leva Energy
Conventional MGT-based CHP packages with power generation less than 250 kWe consist principally of a recuperated MGT or a reciprocating engine equipped with a heat exchanger for generating hot water. The efficiency of these integrated CHP systems is typically limited to a maximum of 70 percent, because of the sensible heat available in the turbine exhaust gas (TEG). Their applications are also limited to commercial sites, where constant hot water is needed. In spite of these higher CHP-related fuel use efficiencies versus the grid, these MGT CHP packages have seen disappointing market penetration because of limited reliability, high installed cost, variable thermal load, and excessive maintenance. Manufacturers of conventional MGT-based CHP packages include Capstone Turbine and FlexEnergy.
Table 12 compares the turnkey $/kW cost of BBEST, conventional MGT-based CHP systems, fuel cells and solar PV, as calculated by Leva. Please note that the $/kW is an average sales price for the BBEST and is also based on estimated BBEST Year 1 volumes.
Table 12: Comparison of BBEST Cost per kW to Alternative DG
BBEST Fuel Cells Conventional CHP Solar PV
$/kW $2,950 $7,000 $3,500 $6,500
Source: Leva Energy
In these markets, both CHP and ULNB manufacturers struggle to make attractive margins. For example, Capstone Turbine Corporation reported an 8 percent gross margin for the first quarter of fiscal 2013. ULNB manufacturers, especially those producing SABs, operate at 20-25percent margins.
Leva performed a detailed Cost of Goods Sold (COGS) analysis, which confirmed that the system offers a payback period of less than two years for California businesses paying average natural gas prices of $7 per MMBtu and $0.12/kWh or higher for electricity. The average
82

commercial rate in California is $0.13/kWh, and the average industrial rate is $0.11/kWh, according to the Energy Information Administration (EIA), validating the analysis’ assumption for electrical cost.
Leva completed a Bill of Materials (BOM) analysis to determine the system’s projected average sales price, product gross margin and revenue. The BBEST product Bill of Materials (BOM) and Cost of Goods Sold (COGS) will continue to be refined by Leva in support of commercialization plans. As part of this evaluation and analysis, Leva requested new pricing information from GI&E, the supplier of the MGT, power electronics and cooling system. The RFQ required a deeper evaluation by Leva of the BBEST BOM and the components that will be purchased from GIE. The Leva results supported the conclusion that BBEST will be able to meet a two-year payback in California, as well as other key markets.
Table 13 provides Leva’s estimated commercial pricing and installation cost for the BBEST. The boiler capacities represent the BBEST addressable market. Pricing increases as burner capacity increases from 5 to 50 million Btu/hr is driven by higher cost to fabricate higher capacity burners.
Table 13: BBEST Pricing Projection
Boiler Capacity
(MMBtu/hr)
Estimated Commercial Price
Installation
Cost
5 to 9 $269,000 $28,000
10 to 17 $285,000 $30,000
18 to 30 $305,000 $35,000
31 to 40 $335,000 $42,000
41 to 50 $365,000 $50,000
Source: Leva Energy
To help potential test sites and commercial customers determine the financial value of BBEST to their business, Leva created a payback calculator. It outputs financial metrics such as Simple Payback, Net Present Value (NPV), and Internal Rate of Return (IRR), given key inputs such as the customer's electricity and gas rates, as shown in Table 14. The calculator also considers existing boiler efficiency and combustion air blower electrical consumption. This calculator was used by Leva to evaluate the Westin's financial benefits derived from installing and using BBEST. The results indicate that the demonstration site will realize a 0.47-year payback, a 303 percent IRR and a $675,000 NPV, based only on the installation costs. For a site that would pay full price for the system and installation, the payback would be 1.9 years, with a 43 percent IRR and $452,000 NPV. These are attractive returns versus alternative approaches.
83

Table 14: BBEST ROI Model Variables
Input Parameter Sample Value
Boiler Size (MMBtu/hr) 10
Existing Combustion Air Blower Motor (kW) 7.5
Discount Rate 10%
Fuel Cost ($/MMBtu) 7.00
Fuel Cost Escalation 3.0%
Electricity Price ($/kWh) 0.14
Electricity Price Escalation 1.0%
Finance Interest Rate 10.0%
Service/Maintenance Cost Escalation 3.5%
Generating Capacity, Net (kW) 100
Generating Capacity, Gross (kW) 108
Source: Leva Energy
BBEST competes against two classes of ULNB’s, as discussed above. As estimated by Leva, the turnkey price difference between the BBEST and a SAB or a RMB is 2.0x. Of course, neither SAB or RMB products offer valuable electrical power.
To understand buyers' motivations and to assess competitors' market segmentation strategies, Leva investigated competitive pricing for ultra-low NOx burners. Burner manufacturers frequently offer cost-add options to the base price of their burners, including a controls interface touch screen, variable frequency drives for the blowers, O2 trim, and/or new gas trains. These options are included in BBEST pricing, and when BBEST is compared to burners with similar content, the price differential is less significant. We have found that Ultra Low NOx SAB’s are the cheapest "fix" to meeting NOx regulations, but businesses pay for the decreased capital cost when they incur higher operating costs, via lower boiler efficiency, less turndown flexibility, much higher blower power, higher CO2, and surface matrix replacement costs. The boiler market is becoming more knowledgeable of these tradeoffs. For example, we have found that the AQMD’s are setting “Best Performance Standards” criteria for boilers; these criteria restrict excess air and FGR levels on new sources. These standards, when adopted, will prevent customers from using SAB’s and require them to consider alternate technologies, such as BBEST.
A financial analysis was conducted by Leva to evaluate an alternative business model in which the electricity that BBEST generates is sold, rather than selling the equipment to the customer. This model is commonly known as a Power Purchase Agreement (PPA). Since BBEST has the capability of generating electricity at a LCOE of $0.067/kWh and an average capital cost of $2500/kW, the PPA option creates a significant business opportunity.
84

For example, assume that 100,000 BBEST systems are financed at 7 percent cost of capital, costing $2.1 billion/year. In return, electricity is sold at 8 cents/kWh, yielding $6.9 billion in revenue. Assuming certain costs for managing the PPA model, the projected profit in this example is roughly $4.1 billion per year.
4.2 Commercialization Readiness Plan Pilot sites have been identified by Leva in five different market sectors. Each pilot site represents a broader market opportunity totaling $77 million. For example, after a successful pilot at one VA Hospital, the VA could roll out the BBEST to its other California hospitals. In parallel, BBEST business will be scaled through OEM partnerships, a referral program incentivizing burner/boiler service companies, and strategic partnerships with utilities.
In California, where targeted customers are required to lower their boiler NOx by 2015, we have found that customers proactively reach out to their boiler/burner manufacturer’s representatives to get product specifications, pricing, and delivery times. In these situations, customers historically wait until 2-3 months before the deadline before they make a purchase. Again, historically, these purchases are viewed as sunk costs. They’ve never offered a payback, other than meeting the AQMD regulations and avoiding hefty penalties/fines. The BBEST payback is a distinct advantage over the competition. This also presents a challenge because in most cases the BBEST will be twice the cost of the competing technology. Two approaches are being pursued to eliminate this potential obstacle:
1) Leva has formed a strategic partnership with Southern California Gas Company, and is working to include the BBEST on a special tariff program that would cover the capital costs of the equipment. The gas company would receive compensation for the energy saved based on the margin between the LCOE of the BBEST and the customer’s current cost for electricity. This program would allow Leva Energy to offer the BBEST at no capital cost to the customer.
2) In the second approach, the sales process would be staged to meet a customer’s budget cycle. Leva Energy would sell its ULNB separately from the MGT cabinet at a price close to the competition, with the condition that the customer would purchase the MGT cabinet as an “add on” during the following budget cycle. This sales tactic overcomes the capital expense issue and sets Leva up for future success by seeding the market with ULNBs that can be upgraded to BBEST. The sales forecast assumes that just over 10 percent of the market in California subject to new boiler regulations would purchase the BBEST.
Leva has begun building a network of California-based boiler/burner resellers, formed a strategic partnership with SoCalGas Company, and created a database of boilers managed by the AQMD’s (companies are obligated to register their boilers with the AQMD that has jurisdiction.) The network partners will be complemented with a small, but focused, direct sales force. Also, Leva plans to implement an OEM strategy with Superior Boiler Works to capture new boiler sales. The strategy will include a co-marketing plan and sales enablement/training.
85

In non-regulated markets, where customers are not forced to replace their burners to meet new air quality regulations, Leva has concluded that the BBEST will be sold based on its economic and environmental advantages over the competition. In these markets, companies that are implementing energy efficiency or sustainability initiatives are key to BBEST long-term success. Improving a company’s energy efficiency and implementing sustainable strategies are emerging trends. For example, the Westin is managed by Starwood Properties. Starwood is implementing an energy efficiency initiative to reduce energy consumption by 30 percent by 2020 for all of its hotels, regardless of regulation. The move towards energy efficiency is a significant advantage for rapid penetration of BBEST in not only the hotel industry, but others as well.
In the first year of commercialization, Leva Energy will implement a marketing and sales strategy that can move BBEST into new regional markets as sales grow. Most regions share similar characteristics to California where BBEST sales will initially focus. For example, a channel of burner/boiler resellers exists in every regional market has been identified. Leva will also build tight relationships with downstream gas suppliers, like the partnership with SoCalGas Company, to benefit from programs that promote energy efficiency, fuel switching (i.e. oil/coal to natural gas), as well as other sales/marketing strategies such as seminars hosted by the utilities, third-party programs that provide funding for energy efficiency retrofits, and any rebate programs that offer incentives for CHP.
From a technical standpoint, Altex engineers have concluded that the power electronics (PE) and integrated burner control system will be based on a PE supplied by GI&E, integrated with the BBEST’s burner controls. The burner controls include the proven Fireye-brand Nexus Burner Management System, as well as customized electronics required to simultaneously control the MGT and the burner as a complete system. The integrated controls were developed by engineers at Altex and assembled in an enclosed free-standing cabinet, as shown in Figure 81. The system is accessed via an advanced touch-screen user-interface. These controls will prescribe the key operating conditions necessary for constant electrical power output while delivering variable boiler thermal loads as demanded by the user, all under ASME, UL, and ANSI safety regulations. The integration of this cabinet with the PE cabinet will reduce the required floor space in the boiler room, and reduce cost.
The ULN burner was fabricated by Altex suppliers from standard gauge stainless steel sheet, various sizes of stainless steel tubing, cast refractory material, and conventional gasket and fitting types. The complete burner can be manufactured by an experienced fabricator in California. Manufacturing of the supporting components, such as the combustion air blower, igniter, flame scanner, gas pressure regulators, and control valves require the least demanding manufacturing and supply challenges. These are all either readily available or can fabricated to specifications by local contractors. Existing suppliers to the BBEST project, such as Fireye, South Bend Controls, and Eclipse can also supply parts for the commercial version of BBEST, thus reducing the need for redesign or re-sourcing.
86

4.3 Technology Transfer Activities To promote the technical and economic benefits of the BBEST, Leva, Altex, and CMC-Engineering staff made presentations to various potential customers, investors, partners, and industry representatives. These presentations included—depending on location and audience—Powerpoint slides, conference calls, tours of the Altex Test Facility, and/or tours of the Westin Costa Mesa. Many of these meetings were followed up with analysis by Leva of potential site applications. In total, 126 meetings and other formal activities were performed, with attendance of over 500 interested people.
Altex Technologies provided technical data, tour support, and technical drawings and renderings of the system. CMC-Engineering provided technical assistance and presented data related to the prior CEC-supported demonstration project at Hitachi Data Systems in San Jose, CA. Lou Brizzolara of AHM Associates attended meetings, provided industry contacts, and served in a consulting role.
Industry events offered the opportunity for Leva to network with potential customers and partners, gather feedback on the BBEST technology from industry experts, validate key product and market requirements, and learn of new market trends that could either support or hinder the market adoption of the BBEST technology. The following is a list of industry conferences, tradeshows, and annual meetings Leva Energy attended during the project:
Table 15: Conferences Attended in Support of Technology Transfer
Source: Leva Energy
Initially, Leva’s objective in meeting with potential customers (see Table 16) was to locate a host site for the BBEST technology. After securing the Westin as the host site for the project, efforts continued to build interest among food processors, hotels, government institutions, and manufacturers to adopt the BBEST technology. Leva hopes these contacts will translate into an order pipeline to launch the BBEST as a commercial product.
87

Table 16: Customer Meetings Held in Support of Technology Transfer
Source: Leva Energy
In addition to building interest among potential customers, Leva built a network of partners who could sell, support/service, supply, interconnect, and/or finance the BBEST technology. Over the course of the project, Leva met with many companies (see Table 17) that continue to be interested in assisting Leva to commercializing the BBEST technology. Leva discussions with these entities are on-going, and will continue after the conclusion of the BBEST project.
88
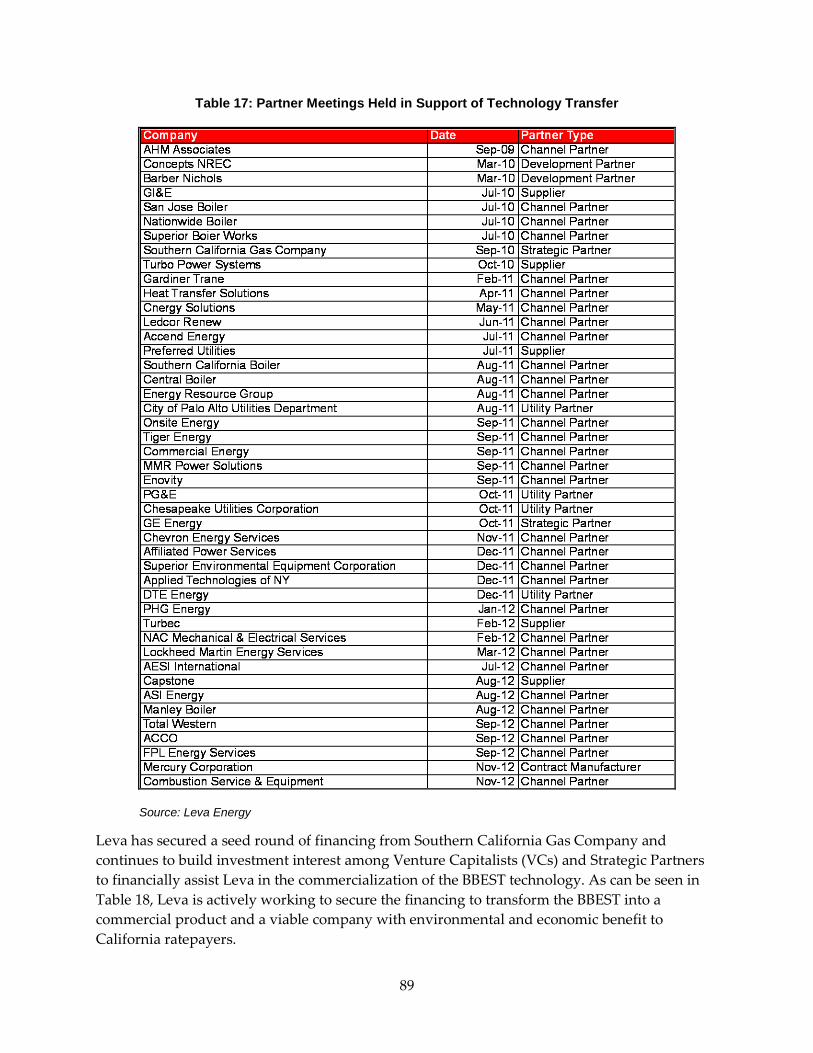
Table 17: Partner Meetings Held in Support of Technology Transfer
Source: Leva Energy
Leva has secured a seed round of financing from Southern California Gas Company and continues to build investment interest among Venture Capitalists (VCs) and Strategic Partners to financially assist Leva in the commercialization of the BBEST technology. As can be seen in Table 18, Leva is actively working to secure the financing to transform the BBEST into a commercial product and a viable company with environmental and economic benefit to California ratepayers.
89

Table 18: Investment Meetings Held in Support of Technology Transfer
Source: Leva Energy
To support the various customer, partner and industry meetings Leva attended, several presentations were created to communicate the value, technical findings, and potential of the BBEST technology. Examples of the customer, partner and investor presentations shared with the aforementioned companies were submitted to the Energy Commission in support of the Task 12 deliverables.
Leva Energy, with the support of Altex Technologies and CMC-Engineering, continues to build on the research and development completed under this project to commercialize the BBEST
90

technology. The opportunity is very real to see commercial units sold as a result of this project, and has been aided by the support of the California Energy Commission, especially under the funds provided under this task.
Going forward, Leva Energy plans to secure its Series-A investment round. The money raised will further the commercialization of the technology and enable Leva to hire key engineers, sales and service professionals. The pipeline of interested customers is greater than 40 potential sites, most of which are located in California and serviced by Investor Owned Utilities.
4.4 Production Readiness Leva Energy was been formed to market and produce the BBEST system, which will be marketed as the Power Burner 100. For production, the prototype methods used in BBEST will be refined to reduce cost and eliminate part-to-part variability. Costs will decrease as quantities increase, but projections for market penetration and sales growth do not predict that thousands of systems will be produced annually in the first three years of BBEST sales. Therefore, the near-term focus will be on manufacturing methods intended for annual volumes in the hundreds, likely with lot orders in 20 – 50 unit quantities. This volume and time frame allows for some tooling purchases, but does not justify expenditures in major turbine modifications or customized control systems. After sales have increased, more-permanent tooling can be justified.
Leva anticipates buying major components and sub-systems from key strategic suppliers, thus leveraging the suppliers’ existing manufacturing and quality systems. Final assembly and check-out will be performed at Leva. Testing facilities will be maintained, in the short term, at Altex. This plan will allow a decreased time-to-market, as compared to fully in-sourced manufacturing. As part of this out-sourcing strategy, all drawings (~300) used for prototype production will be updated for production use, with appropriate tolerances, inspection criteria, and change blocks added.
The MGT, silo combustor, and Power Electronics (PE), are intended to be universal across a product line addressing 5-20 MMBtu/hr boilers. This will allow decreased inventory storage costs at Leva and faster realization of volume pricing discounts. To address variability in boiler capacities, the following components will vary with boiler size:
• URNB burner head
• Combustion Air Blower
• FGR Blower (in markets requiring <30 ppm NOx)
• Integration Component (likely two sizes to cover 5-12 and 12-20 MMBtu/hr)
• Fuel Control Valves
This variety of sizes is consistent with industry practice. Table 19 presents two benchmark product lines—one a conventional burner with FGR (Cleaver Brooks, as described previously), and the other a SAB-type burner (Powerflame.)
91

Table 19: Sizing Variation of Other Low-NOx Burners
Cleaver Brooks PowerFlame--Nova Plus
Capacity Capacity BH Diameter Blower Power
Element Length Blower Power
MMBtu/hr BoHP in hp in hp
5.25 125 19 5 32 5
6.3 150 19 7.5 37.5 7.5
7.35 175 19 10 41.5 7.5
8.4 200 22 15 41.5 10
10.5 250 22 15 51.5 10
12.6 300 22 20 51.5 15
14.7 350 27.5 25 51.5 15
16.8 400 31.5 30 46 15
21 500 31.5 40 46 20
Source: Altex Technologies Inc
As Table 19 demonstrates, competing burners use a different combination of blower and mechanical geometry for almost every boiler capacity. It will be a production goal for the BBEST system to reduce this complexity, but it is acceptable in the industry.
Table 13 provided estimated commercial pricing and installation cost for the BBEST. The boiler capacities represent the entire BBEST addressable market, though the first three tiers represent the near-term focus. To achieve these estimated commercial prices, the prototype system must be refined, and the proper documentation and quality processes implemented. The following implementation plan details those recommended actions, including critical processes, equipment, facilities, resources, and support systems, as well as internal and supplier manufacturing facility needs. The estimated cost savings are expressed as the potential decrease in unit costs, as compared to the first unit.
Turbec Turbine
Summary:
The Turbec microturbine is a proven device with a track record of reliability and durability. In the initial years of production, minimal changes will be performed to this key component, to avoid extensive durability testing. To meet the packaging requirements of the boiler room environment, the engine must be mounted in a different position than in the original Turbec CHP package. For the first BBEST system, Turbec disassembled and re-oriented the generator to ensure proper oil drainage in the new orientation. The current compressor outlet location
92

increases complexity of the SCGT enclosure, but Turbec has confirmed that the system can be assembled with the compressor outlet in a more-convenient location.
Recommended Actions:
1. Assemble engine with compressor housing and generator at the optimum orientation for installation in the Power Burner.
1. Add two dowel pins (one round, one diamond) to the silo combustor mounting face for repeatable location of the combustor.
Critical processes, equipment, facilities, resources, and support systems: Update Turbec assembly tools and instructions. Complete performance testing of new compressor orientation, and compare airflow vs. speed to a standard recuperated engine.
Internal and supplier manufacturing facilities changes: The engine test stand at Turbec will need to be modified to accommodate the new compressor orientation.
Estimated cost savings/unit: Less than $20/unit, or slight increase, due to added dowel pins. Cost savings due to the new compressor outlet will be realized in enclosure costs and reduced assembly labor in mounting and servicing the silo combustor.
Estimated tooling cost: Not yet quoted. <$50K expected.
Turbec Power Electronics
Summary:
The Turbec PE is a proven device with a track record of reliability and durability. However, it includes several components not required for the Power Burner, and was designed to export 400V, 50 Hz power. For BBEST, it was re-programmed to produce 60 Hz electricity, and a separate conversion kit—essentially, a 480V-400V transformer—was purchased from GI&E. A simplified PE will be designed to produce 480V power, and be certified by Underwriter’s Laboratory (UL).
Recommended Actions:
1. Remove isolation transformer from PE design (not required by US code) 2. Remove gas compressor VFD from PE (not used with Hydrovane fixed-speed gas
compressor) 3. Change PE design to produce 480 V, 60 Hz, including any updates required to meet
voltage and UL listing requirements 4. Update signage and placards to meet US codes 5. Acquire UL certification of updated PE
93

6. Create work instructions, inspection criteria, and quality control process for the manufacturing process at PE supplier
Critical processes, equipment, facilities, resources, and support systems: The redesign efforts will be monitored by Leva electrical engineering staff. Multiple new or changed components will be needed in the PE, and these changes should be led by the PE manufacturer (EEI) and checked by Leva. Testing at EEI will need to be performed prior to UL certification, and support of the certification will be needed from EEI and Leva. Elimination of two high-power transformers and the Intertie Relay system represent the greatest area for cost reduction in BBEST.
Internal and supplier manufacturing facilities changes: To be determined by EEI, Turbec, and Leva
Estimated cost savings/unit: $40-60K (including reduced site installation costs)
Estimated tooling cost: Not yet quoted
Silo Combustor
Summary:
The emissions performance of the Altex-designed silo combustor is key to achieving low burner emissions under SCGT-only and SCGT+URNB operating conditions. Continuing refinement of airflow and mixing may enable even lower emissions, but will have minimal effect on cost or manufacturability. The combustor used at the demonstration site includes two flanges and four adjustment sleeves not required in the production version. After the design has been modified, part count will be reduced by five machined components, two gaskets, and twelve fasteners. Two locating holes will be added to the MGT mounting flange to ensure repeatable installation. Simple welding and leak test fixtures will also be designed and tested to reduce fabrication time. The combustor will be manufactured by an outside supplier, and it is advisable for the SCGT to be delivered to Leva as a tested assembly with the combustor already installed.
Recommended Actions:
1. Eliminate unnecessary flanges and adjustable features from prototype design 2. Add locating holes 3. Create welding and leak test fixtures 4. Create work instructions, inspection criteria, and quality control processes
Critical processes, equipment, facilities, resources, and support systems: Any potential fabricators will need experience and training in forming and welding the high-nickel alloys used in the combustor, and will need to adhere to quality-control processes appropriate to low-volume production
94

Internal and supplier manufacturing facilities changes: Implement fixtures and ensure quality control practices are enforced
Estimated cost savings/unit: $4-8K (mostly from increased production quantities of sheet metal and machined components)
Estimated tooling cost: <$10K
Ultra-Reduced NOx Burner Head
Summary:
The URNB will be made in 3-5 sizes to cover the 5-20 MMBtu/hr boiler capacity range (the BBEST version shown in Figure 3 is designed for 10 MMbtu/hr thermal input). Production volume increases will have a slower effect on URNB cost than other system elements, since the quantity of each burner capacity will be a portion of total Power Burner production quantity. Some burner components, such as secondary fuel injectors, burner inlet flanges, and pilot/scanner mounting flanges will be common across the product line and will benefit quickly from increased production volumes. The removable secondary fuel manifolds used in the first BBEST are not required for the production version and may be eliminated.
Minimizing dissimilar material welds and ensuring high reliability under variable engineering development conditions was a priority in the original BBEST burner, and, generally speaking, this URNB will have a higher material cost than other low NOx burners, due to the alloys required for durability in the presence of hot MGT exhaust. However, it may be possible to choose lower-cost alloys in some areas of the burner which would still yield good performance. It may also be possible to replace the primary zone refractory and stainless-steel shell with a high-nickel alloy shell, though modeling and testing would be required to validate this design change. Net material cost reduction would be minimal, but it would reduce manufacturing time and cost.
Recommended Actions:
1. Replace external fuel manifolds with welded manifolds 2. Investigate and test material changes 3. Create welding and leak test fixtures 4. Create work instructions, inspection criteria, and quality control processes
Critical processes, equipment, facilities, resources, and support systems: Any potential fabricators will need experience and training in forming and welding the stainless steel and high-nickel alloys
95

used in some areas of the burner, and will need to adhere to quality-control processes appropriate to low-volume production.
Internal and supplier manufacturing facilities changes: Implement fixtures and ensure quality control practices are enforced.
Estimated cost savings/unit: $8-15K
Estimated tooling cost: <$10K; Testing of material change would add additional cost, depending on the scope of the changes
Integration component
Summary:
The integration component mates the MGT to the URNB, provides an inlet for combustion air and locates the MGT exhaust thermocouples. In the case of the BBEST 10 MMBtu/hr capacity, the integration component also contains an eductor which converts the flow energy of the MGT into pumping work to draw additional combustion air into the URNB without use of the combustion air blower. This eduction feature is not necessary for all capacities of the Power Burner, but does provide flow and mixing benefits to all capacities. The ideal combustion air inlet size will vary with combustion air requirements, but for manufacturing simplicity, a compromise of two or three sizes will likely cover the 5-20 MMBtu/hr range. Modifications for production will be minimal for the integration component.
Critical processes, equipment, facilities, resources, and support systems: Any potential fabricators will need to adhere to quality-control processes appropriate to low-volume production.
Internal and supplier manufacturing facilities changes: Implement fixtures and ensure quality control practices are enforced
Estimated cost savings/unit: $800-2,000, due to volume increases
Estimated tooling cost: <$3,000
MGT Enclosure
Summary:
The MGT enclosure (shown in Figure 85) contains the SCGT and its supporting systems. It also provides thermal and acoustic insulation, and routes power and signal wires to and from the control systems. This subsystem also includes the high-precision stainless steel components necessary to mate with the turbine exhaust outlet and direct flow into the integration component. Altex and Leva sent drawing packages and RFQ’s to multiple potential fabricators, and two quotations have been received, reflecting substantial price reductions due to increased
96

production volumes and a design freeze. The re-oriented compressor housing will also reduce cost by simplifying the cabinet frame/floor design and reducing the skilled labor currently required to fabricate the compressor outlet tubing.
Recommended Actions:
1. Redesign frame/floor interface and compressor outlet tubing based on re-oriented compressor housing ($1500-2000 savings)
2. Create improved drawing package and realize savings from increased production volumes ($8-10K savings)/frame
3. Investigate alternative powder coat types ($100 savings) 4. Create welding and checking fixtures, standard work instructions, inspection criteria,
and quality control processes Critical processes, equipment, facilities, resources, and support systems: Any potential fabricators will need experience with welding stainless steel alloys, and will need to manage multiple subcontractors (e.g. sheet metal, machining, and coating) or have a vertically-integrated manufacturing operation.
Internal and supplier manufacturing facilities changes: Implement fixtures and ensure quality control practices are enforced
Estimated cost savings/unit: $10-12K
Estimated tooling cost: $10-30K
97

Figure 85: Turbine Enclosure, as Installed on a 250 BoHP Firetube Boiler
Source: Altex Technologies Inc
Electronics, controls, and wiring
Summary:
The main system control is the Fireye Nexus 6100. This NFPA/ASME-compliant device monitors all safety interlocks, and, in conjunction with the boiler pressure (or temperature) sensors, commands turbine start/stop actions. The Nexus, blower VFD’s and various switches, relays, lights, and terminal blocks are housed in a NEMA-rated enclosure (shown in Figure 80). Several changes or outsourcing activities could reduce the cost of this system, but have not been investigated as part of this task. Possible improvements are shown as the recommended actions.
Recommended Actions:
1. Revise and finalize wiring diagrams in standard format and create panel layout drawings
2. Reduce number of fuel control valves on higher-capacity burners (>15 MMbtu/hr) 3. Create standard wiring harnesses for intra-enclosure routes, and outsource harness
production (current practice is single-wire, point-to-point) 4. Use lower-current-draw CANBus servos to eliminate need for CANBus amplifier 5. Investigate integration of PE and burner control cabinet into one cabinet 6. Create PE-to-control cabinet harness with one end terminated in the PE
98

7. Obtain OEM pricing on electronic components currently sourced through retail outlets 8. Create click-clack/functional-test stand(s) to verify assembly quality prior to connection
to full system
Critical processes, equipment, facilities, resources, and support systems: Verification of safety system function should be carried out prior to shipment, and again in the field. Any supplier will need to provide field support and quality assurance of sourced parts. The design will need to be frozen and UL approval gained for the production electronics.
Internal and supplier manufacturing facilities changes: Implement test stand at any supplier of sub-assemblies or full control panels.
Estimated cost savings/unit: Not yet quantified
Estimated tooling cost: Not yet quantified
99

Chapter 5: Project Financial Summary The project will be completed on-time and on-budget at the end of March 2013. The beginning of the project experienced major challenges, due to changes in the national economy and two key suppliers. Between the writing of the proposal and the execution of the contract, the intended microturbine supplier was sold and the product line was removed from the market; the intended burner subcontractor also declined to participate in the project. Leva Energy was added in place of the burner manufacturer, and the workload of the various tasks was re-distributed amongst the new team, with Altex accepting greater technical responsibility. The resultant spending rate lagged the projected rate, as shown in Figure 86, but caught up as efforts recovered. The project spending rate is shown below, through the end of the January reporting period.
Altex also made major investments in facility upgrades, and provided greater-than-planned technical support to the build, test, and field demonstration in BBEST. This resulted in a match funds contribution of $981,000, or 204 percent of the contractual requirement.
Figure 86: Project Spending Rate
Source: Altex Technologies Inc
100

Chapter 6: Conclusions The project successfully demonstrated BBEST both in the lab and in the field. The unit is operational on a 10 MMBtu/hr boiler at the Costa Mesa Westin Hotel, generating steam and electricity for the customer. Leva Energy is actively working to secure financing to advance BBEST into the commercially-viable Power Burner 100. The Project Objectives from Table 1 are restated here, with performance to them noted:
Table 20: Project Objectives and Performance
• Lower overall firetube boiler emissions to meet emissions limits in all CA regions
o In the Westin installation, NOx and CO decreased by 50 percent after the existing boiler burner was replaced with BBEST, as shown in Figures 84 and 85.
o The Altex-modified Turbec microturbine met SCAQMD NOx and CO emissions requirements, as shown at the low-fire point in Figures 84 and 85.
o Leva Energy will pursue an Achieved-in-Practice BACT with SCAQMD to create a category for this unique technology. The integrated BBEST system has been shown capable of achieving a BACT equal to the separate boiler and SCGT BACT’s currently in place.
• Allow boiler operation at low excess air (2-3 percent stack O2) under both full and part load conditions, to minimize sensible (dry gas) heat losses in stack and reduce fuel costs
o As shown in Table 5, low O2 operation was achieved in CHP and BHO-only modes.
o Third-party testing by the Southern California Gas Company (SCG) verified boiler efficiency increase at part and full load conditions, as shown in Figure 87.
• Reduce incremental cost of power generation to <$700/Kilowatt (kW), and provide payback of 1.5-2 years for most 100kWe installations
o Leva’s detailed analysis confirmed a two year payback, as described in Section 4.1.
• Minimize incremental operating/maintenance costs of power generation by reaching equivalent power conversion efficiencies of above 90 percent, within a reliable, compact package
o The compact BBEST package was able to fit in the very restrictive Westin boiler room. Other facilities visited as part of technology transfer activities are less challenging. During the ten day test, there were no shut-downs due to the BBEST system, and the system continues to operate
101

o Power conversion efficiency did not reach 90 percent, due to the high boiler room air temperatures at the Westin. Lab testing with 70 F air (10 degrees above ISO standard) resulted in >100 kWe net output. Westin boiler room temperatures are routinely over 85 F, thus decreasing average system net output to 91 kWe. This decrease in power adds only a few months to BBEST payback, or can be easily remedied in most facilities by installation of a fresh air duct to the system (which the Westin plans to do)
• Achieve overall CHP efficiencies of 82 percent, by improving boiler-burner operation, especially at part loads
o The Bryan boiler at Westin is 38 years old, and operated at 76 percent efficiency, as measured by SCG in 2011. After installation of BBEST, the efficiency increased by two to three percentage points at medium and high fire points (as documented in Figure 87), and turndown was greatly improved. For a newer boiler, with 80 percent baseline efficiency, the two to three percentage point increase would meet the project objective of 82 percent.
• Improve SCGT reliability and reduce cost by eliminating recuperator and using low temperature and low NOx combustor
o SCGT operation with the Altex-designed combustor is reliable and produces NOx emissions 50 percent less than allowed by SCAQMD SCGT regulations.
102

Appendix A: Efficiency and Heat Rate Calculation Methods
To evaluate the long term performance of the BBEST, various efficiencies and heat rates will be measured over the following year. This activity will document:
• CHP efficiency and boiler efficiency
• Heat Rate (required for electrical generation cost calculations)
• The operational flexibility and reliability of the system
Efficiency Calculations All input and output streams of the boiler and MGT must be measured or accurately
calculated. The inputs are: natural gas (to MGT and URNB), boiler feedwater, and electrical power consumed by the combustion air blower, FGR blower, and MGT gas compressor. The outputs are: MGT net electrical power output (in kW, net of all power conversion and parasitic losses) and boiler steam flow. Flue gas losses will also be measured, and shell losses will be estimated. To quantify these process and energy flows, the instrumentation so denoted in Appendix A will remain on-site after commissioning is complete, and will be augmented by a feedwater flow meter, and a thermocouple or RTD inserted into the boiler steam header, as provided by SoCal Gas.
Energy efficiency for the CHP system is calculated based on ASME Power Test Code PTC 4.1 using either the heat output/heat input or by quantifying heat losses. For the CHP system, the heat input is defined as the total fuel intake of the boiler and microturbine. The output is then the steam generation of the boiler plus the electrical generation of the microturbine. Therefore, CHP efficiency (ε) is defined as:
Where Qsteam is the energy of the steam; QFeedwater is the energy in the boiler feedwater; QMTG is the energy output of the microturbine (3,412*kWe); Qboilerfuel is the energy from the fuel burned in the URNB, QMTGfuel is the heat from fuel burned in the MGT, and Qelec is the electrical energy consumed by the supporting systems
Energy losses parasitic loads from the CHP system include:
• Latent and sensible heat losses from the boiler stack
• Radiative losses of the boiler (defined by ASME PTC 4.1)
• Gas compressor power requirements (approximately 4 kWe)
A-1

• Power electronics losses
• Radiative losses from microturbine enclosure
The boiler efficiency can be calculated in one of two ways:
1.) Boiler Efficiency by heat output/heat input method ASME PTC 4.1:
Where Hs= enthalpy of the steam (Btu/hr), HFW – enthalpy of the feedwater (Btu/hr), and FFBoiler = boiler fuel use (Btu/hr)
2.) Boiler Efficiency by heat loss method ASME PTC 4.1:
Where HSH is the sensible heat loss in the stack; HLH is the latent heat loss in the stack; and HR is the radiation losses from the boiler, which can be estimated or provided by the boiler manufacturer.
Heat Rate Calculation The heat rate for the MGT must be calculated to determine the energy delivered to the boiler (for which credit is taken as part of the overall CHP system), and to determine the energy used for electrical generation (which then allows calculation of electrical generation costs.) A sample calculation is provided below, using data from the Westin testing; values are corrected to a standard reference condition of 60° F. O2 baseline (from Testo analyzer): 20.9percent NG fuel flow (Sierra BoilerTrak): 2502 scfh (108 lb/hr) Exhaust O2 percent: 15.1percent (measured with eductor inlet blocked) Turbine Outlet Temp: 1193 F (645 C) Room Air Temp: 85 F Cp of MGT exhaust: 0.275 Btu/lb-R PE Net Power Output: 101.5 kW Gas Compressor Consumption: 6.5 kW FGR Blower Consumption: 1.25 kW Energy Content of Fuel (assumed): 1015 Btu/scf
A-2