bond market development and economic growth: experience of
TRANSCRIPT

Bond Market Development and Economic Growth:
Experience of East Asian Economies
By
Diksha Mahara
Submitted to Central European University
Department of Economics and Business
In partial fulfillment of the requirements for the degree of Master of Arts in Economic Policy in Global Markets
Supervisor: Professor Paul Lacourbe
Budapest, Hungary
2018
CE
UeT
DC
olle
ctio
n

i
I, the undersigned, Diksha Mahara, candidate for the MA degree in Economic Policy in Global Markets, declare herewith that the present thesis is exclusively my own work, based on my research and only such external information as properly credited in notes and bibliography. I declare that no unidentified and illegitimate use was made of the work of others, and no part of the thesis infringes on any person’s or institution’s copyright. I also declare that no part of the thesis has been submitted in this form to any other institution of higher education for an academic degree.
Budapest, 4 June 2018
__________________________ Signature
CE
UeT
DC
olle
ctio
n
ii
Abstract
Prior to Asian financial crisis of 1997, East Asian economies grew at a remarkable speed with
industry-led development strategy yet with little scope of capital market development.
Experience of Asian crisis shaped the regional cooperation to build structure for long term
capital markets, which led to strong tailwinds of policy structures through ASEAN Plus Three
(APT) to promote bond financing. In this regard, this study uses Autoregression model, first
difference of panel regression and granger causality to i) determine the direction of causality
between bond market development and economic growth ii) analyze the effect of bond market
development on economic growth for ten East Asian economies for the period of 2004-2016.
Two categories of bond market size are used to determine bond market development, namely
local currency bond market and foreign currency bond market to explore the bond market
development. The result shows that while bond market has positive and significant effect on
economic growth in the regional economies, it was also discovered that the causality flows
from economic growth to bond market development. It is recommended that with continued
development of capital markets, economic growth could continue in same path while at the
same time, economic growth policies should bring greater emphasis to capital market
deepening for strengthening symbiotic relationship between bond markets and growth of the
region.
Keywords: Bond market development; Economic growth, East Asia, ASEAN Plus three
CE
UeT
DC
olle
ctio
n

iii
Acknowledgements
I would like to thank my supervisor Professor Paul Lacourbe for his valuable advice and
continued assistance for the whole process of thesis writing. I would also like to express my
gratitude to my supportive CEU friends for their helpful comments and motivation to carry out
my thesis project. Last but not the least, my sincerest thanks to my family for their immense
love and belief in me and my endeavors.
CE
UeT
DC
olle
ctio
n

iv
Table of Contents Introduction .............................................................................................................................. 1
1. Literature Review ............................................................................................................ 4
1.1. Theoretical aspects ...............................................................................................................4
1.2. Empirical Review .................................................................................................................7
1.3. Regional review on ASEAN regionalism and bond market ...........................................11
2. Research Methodology .................................................................................................. 13
2.1. Data ....................................................................................................................................13
2.2. Empirical Model Specification ..........................................................................................17
3. Empirical Results and Analysis .................................................................................... 20
3.1. Unit root test .......................................................................................................................20
3.2. Panel Cointegration test.....................................................................................................21
3.3. Panel Regression in First Differences ...............................................................................22
3.4. Granger Causality Test ......................................................................................................28
4. Discussion of results ....................................................................................................... 30
Limitations of models and suggestion for further research ........................................................31
5. Concluding remarks and policy recommendations .................................................... 34
Appendix ................................................................................................................................. 37
List of References ................................................................................................................... 41
CE
UeT
DC
olle
ctio
n

v
List of Figures and Tables
Figure 1 Trend of Total local currency bond size ................................................................... 15
Figure 2 Trend of Total foreign currency bond size ............................................................... 15
Table 1 Variable Description .................................................................................................. 13
Table 2 Variable Descriptive Statistics ................................................................................... 16
Table 3 Panel Unit Root Test .................................................................................................. 20
Table 4 Kao Residual Cointegration Test ............................................................................... 21
Table 5 Johansen Fisher panel cointegration test .................................................................... 21
Table 6 First Difference with lagged effects of CBM of Eq. (1) ............................................ 23
Table 7 Cumulative coefficient of △CBM ............................................................................. 24
Table 8 Regression result for Eq. (2) ...................................................................................... 25
Table 9 Regression result for Eq. (2) for Panel A and B ........................................................ 26
Table 10 Regression result for Panel A and B, with △TFB and △TLB ............................... 27
Table 11 Result of Pairwise Granger Causality Test .............................................................. 28
CE
UeT
DC
olle
ctio
n

vi
List of abbreviations
ASEAN: Association of Southeast Asian Nations
APT: ASEAN Plus Three
GMM: Generalized Method of Moments
ABMI: Asian Bond Markets Initiative
PCA: Principal Component Analysis
LS: Least Squares
AR: Autoregression
IPS: Im–Pesaran–Shin (unit root test)
ADF: Augmented Dickey–Fuller
PP: Phillips-Perron
AIC: Akaike Information Criterion
SC: Schwarz (Information) Criterion
VECM: Vector Error Correction Model
VAR: Vector Autoregression
CE
UeT
DC
olle
ctio
n

1
Introduction
Prior to Asian financial crisis of 1997, East Asian economies grew at a remarkable speed with
the policy measures of adopting technologies from the advanced countries for growing
industrial sectors. This industry-led development strategy promoted by trade openness led to
emergence of the region as one of the fastest growing markets during the period where each of
the major markets like Malaysia, Thailand, Singapore, Korea and Indonesia, all on average
grew at a growth rate of around 7%, giving them the name “East Asian Tigers1” . During the
period, respective markets also underwent financial liberalisation which was till then largely
dominated by bank loans and minimum or no scope of long term capital market.
When the financial crisis of 1997 struck, over dependence on foreign currencies through bank
borrowings aggregated problems of currency mismatch, contributing to financial contagion.
Over reliance on bank financing whilst having inconsistency in capital account policies has
been condemned as one of the major shortcomings of financial liberalisation of East Asian
market during the period.
Since the financial crisis of 1997, a stronger sense of regionalism emerged among the regional
markets, with the primary aim to establish closer partnership to strengthen the financial grounds
in terms of international monetary market. This regionalism gave rise to to strong tailwinds
promoting policies for capital market deepening through bond financing. Bond market
1 Four original East Asian Tigers were south Korea, Taiwan, HK, and Singapore
CE
UeT
DC
olle
ctio
n

2
development helps to diversify securitization as well as support markets in terms of long term
capital requirements.
One of the cornerstones of Asian regionalism is the Association of Southeast Asian Nations2
(ASEAN) which initially invovled ten East Asian countries as its members which later
convened into ASEAN Plus Three3 (APT) framework, with addition of China, Japan and South
Korea as its three added members. With fresh sore from Asian crisis of 1997, APT was sought
as an institution to undertake financial governance within the region, correct the mistakes of
the broad economic policies of early 1990s and support the process of financial deepening.
This paper aims to explore a relationship bond market and economic growth since the advent
of policies that promote bond market development in East Asian economies. Based on the
broader concepts of theoritical literatures that have proposed different hypothesis on the type
of relationship between components of financial market and economic growth, this paper
assumes an existence of some form of relationship between economic growth and bond market,
as one of the important subcomponents of financial markets. There are some literatures by
(Said, 2012), Fink et al., (2006), Pradhan et al., (2016), Ocbio et al., (2016) that have explored
similar problem. Major claim of most of these papers have been positive effect of bond market
development on economic growth and presence of causality flowing from either one of these
components to another.
2 ASEAN Member countries: Malaysia, Thailand, Singapore, Korea, Indonesia, Vietnam, Brunei, Cambodia, Laos and Myanmar 3 ASEAN Plus Three (APT) Also written as ASEAN+3
CE
UeT
DC
olle
ctio
n

3
The objectives of this paper are: i) to find what type of impact bond market development has
had on economic growth for East Asian market ii) to determine what type of causal relationship
exists between economic growth and bond market development. To be more specific, the
objective of impact of one component on another tries to answer if increase in bond market
development is associated with increase in economic growth, what is the magnitude of that
association and if that association shows causal relationship.
The structure of this paper is as following: chapter 1 reviews the theoretical aspects of
relationship between financial market development and economic growth and discusses the
existing empirical evidence on relationship between bond market development and economic
growth. Furthermore, it reviews ASEAN regionalism and status of bond market structure in
the region. Chapter 2 outlines the empirical methodology used to test the relationship between
bond market and economic growth, followed by Chapter 3 which presents the results for
different models. Chapter 4 provides discussion of the results and limitations of empirical
models and suggestions for further research. Lastly, Chapter 5 presents conclusion and
proposes policy suggestions.
CE
UeT
DC
olle
ctio
n

4
1. Literature Review
1.1. Theoretical aspects
Financial globalization has changed the face of global income distribution since the dawn of
third wave of globalization starting from 1990s. One of the hallmark features of financial
globalisation has been financialization which Epstein (2005) explains as a process led by
increasing role of financial system in bringing operational changes in domestic and
international markets that has transformed motives of every economic agent. For this very
reason, market economic system becomes a hub for financial system to undertake every
economic transaction which enables financial development contribute to economic growth
either through positive or negative processes.
There have been particularly four possible hypotheses that describe a causal tie between
financial market and real sectors: 1) Supply-leading 2) Demanding-following 3) Feedback 4)
Neutrality. These hypotheses have been tested for overall financial sectors as well as its sub-
components, one being bond market.
Supply leading hypothesis argues that a unidirectional relationship is present from financial
market development to economic growth. Contrary to this, Demand-following hypothesis
points out that real economy drives the growth of financial sectors in unidirectional manner,
hence financial market development is endogenously determined by economic growth.
Thirdly, feedback hypothesis rather shows a bidirectional relationship between financial market
development and economic growth, where each factors are considered indispensable to
contribute for growth of another. Lastly, neutrality hypothesis argues that there is no causality
CE
UeT
DC
olle
ctio
n

5
running from any direction, rather each financial market development and economic growth
are independent of one another (Pradhan et al., 2015).
Earliest arguments in favor of this hypothesis is presented by Shaw (1973) where the author
supports the financial liberalisation as a cornderstone to stabilising economic growth in real
sector while financial repression is argued to only fraustrate economy through excessive
government intervention. Supporting supply-leading hypothesis, study by Agbetsiafa (2004)
on 6 countries from Sub-Saharan Africa for the period of 1963-2001 shows that economies
with better financial system will have smooth progress of economic growth through the means
of advancing savings, liquidity and reduced risks, all of which will contribute positively to real
sector growth.
Drawing a nexus between capital market and economic growth, Coskun et al., (2017) test for
the nature of relationship between capital market sub-components and economic growth, with
sub-components4 including mutual funds, pension funds, corporate bonds and stock markets.
The result shows a positive effect, long run cointegration and unidirectional causality flowing
from capital market development to economic growth, therefore supporting supply-leading
hypothesis.
Demetriades & Andrianova (2004) document several empirical literatures which demonstrate
the importance of institutional factors such as financial liberalisation, repressions, government
control of banking systems and political economic factors that affect financial development
4 Sub-components capital market—mutual funds, pension funds, corporate bonds and stock markets in Coskun et al., (2017) are formed into a composite index using principal component analysis (PCA)
CE
UeT
DC
olle
ctio
n

6
and economic growth. Following the same line of thought, Law et. al (2015) utilizes panel
cointegration and granger causality test to test for long run relationships between globalisation,
institutional reforms and financial development among 8 Asian countries, namely China,
Indonesia, Japan, Malaysia, the Philippines, Singapore, South Korea and Thailand from 1984-
2008. Granger causality test shows that there is a causality flowing from globalisation to
institutional reforms and financial development, particularly private sector credit and stock
market capitalization which causes economic growth.
To test for evidence of supply-leading hypothesis in developing economies, Adeyeye et al.,
(2015) tested for relationship between economic growth and financial development, using
Nigeria as a focal country from the period 1981 to 2013. Paper demonstrates mixed results,
with weak presence of supply leading hypothesis arguably due to presence of government
intervention and low financial intermediation, whilst demand-following hypothesis dominating
the result by economic growth having greater influence on financial sector deepening, credit to
private sector and financial institutional credit provision. Hence, this study shows a feedback
relationship with presence of bi-directional causality between the explored variables.
Bond market development, like any other financial sector development has been measured
based on four important indicators—size, access, efficiency and stability. As size indicator,
which uses proxy of ratio of bond market to GDP of the market has been commonly used by
multiple studies which is why this study utlisies same indicator to represent the bond market
development via the variable Composite Bond Market5 (The World Bank, 2006).
5 see Chapter 3:CBM- composite of TFB and TLB
CE
UeT
DC
olle
ctio
n

7
1.2. Empirical Review
With the Asian Financial crisis of 1997, Asian economies learnt harsh lessons on the need to
have long term financing as an alternative to foreign currency denominated money market
loans. In their paper, Eichengreen & Luengnaruemitchai (2004) answer the question of why
bond market is not well developed in Asian economies on the grounds of institutional
underpinnings such as crony capitalism, corruption and low bureaucratic qualities, in addition
to structural and financial underpinnings through dominance of banking sectors, such as
domestic credit by banking sector a resulting in poor bond market development.
In the same line of thought, Bhattacharyay (2013) explores the determinants of bond financing
for ten regional economies used for this study. The paper finds that size of economy (GDP,
Current US$), stage of economic development (GDPPC, PPP) and variability of interest rates
have positive impact on total bond financing, openness of economy has positive impact on
corporate bonds and size of banking system has positive impact on government bond financing.
Following the supply-leading hypothesis, Pradhan et al., (2016) demonstrate causal link
between bond market development and economic growth while considering four
macroeconomic covariates namely—inflation rate, real effective exchange rate, real interest
rate, and trade openness; using the technique of panel Vector autoregressive (VAR) and
granger causality. The paper explores this relation amongst 35 countries from the period of
1993-2011 and confirms the long run causality from bond market development and
macroeconomic variables to economic growth.
For the case of South Africa, Kapingura & Makhetha-Kosi (2014) draw a relationship between
bond market capitalization and economic growth from the period 1995-2012. Also using
CE
UeT
DC
olle
ctio
n

8
granger causality test, paper tests for the presence of bi-directional relationship between the
variables. The results show dominance of supply-leading characteristics in the relations yet
with weaker presence of demand-following hypothesis. This nevertheless supports feedback
hypothesis for the given economy.
Likewise, showing a mixed result of supply leading and demand following hypothesis, Pradhan
et al., (2015) investigated the relationship between bond market development and economic
growth amongst G-20 countries and found different results for causality amongst different
countries. The authors form a composite index using PCA, a technique that I have used in this
paper too, out of (four) categories of bond market size for—Domestic debt securities and
International Debt securities. Country specific heterogeneity is argued for difference in results6
between different countries, difference in the stage of development and stage of individual
securities market could be factored into that heterogeneity. The empirical result of the paper
shows the presence of long run and short run direction of causality between the bond market
and economic growth. In the same line, Panizza & Presbitero (2014) demonstrate rather
inconclusive evidence of presence of causality from public debt to economic growth in 17
OECD advanced economies as a sample.
Fink et al., (2006) utilize granger causality technique to ascertain the positive relationship
between net issue on different types of bonds and economic growth for short-run, instead of
6 Country specific results show—Mexico and Japan showed no granger causality between growth and domestic public debt, Turkey showed no causality between growth and international private debt and France had no causality result between growth and international public debt in the study of Pradhan et al., (2015)
CE
UeT
DC
olle
ctio
n

9
long run relationship. The studied countries7 include Belgium, Denmark, Germany, Finland,
France, Italy, the Netherlands, Norway, Austria, Portugal, Sweden, Switzerland, Spain, the
United Kingdom, the USA, and Japan for the period of 1994 to 2003. The empirical result finds
causality running from economic growth to net issuance of public bonds while causality
running from corporate bond and financial institutional bonds issuance to economic growth.
Gomez-Puig & Rivero (2015) focuses on the relationship between public debt (sovereign debt)
and economic growth amongst 11 EMU countries, utilizing granger causality approach and
using structural diagnostics test of break point, to test for bi-directional causality between the
stated variables from the period of 1980 to 2013. The paper shows a mixed result with the
influence of break-point which occurs between 2007 and 2009 for this study; with positive
granger causality between changes in sovereign debt and growth until the breakpoint of 2009,
while negative granger causality between the variables that there is no negative causality. The
policy analysis of the paper posits the importance of fiscal balance for economies of Italy,
Greece and Spain with the history of sovereign debt crisis as higher pubic debt does not
contribute to economic growth and there could be underlying effects of quality of public debt
to determine the relationship.
Ocbio et al., (2016) carried out the relationship study between bond market development and
economic growth for Nigeria from the period of 1982-2013 using generalized method of
moments (GMM) in addition to granger causality. While the paper demonstrates positive
7 Fink et al., (2006) uses quarterly data with time series analysis and cross country analysis.
CE
UeT
DC
olle
ctio
n
10
impact of financial market components, such as bond market size, credit to private sector and
equity market size, granger causality showed no result of causality between the main variables
under study. The paper argues that infancy state of bond market of the economy could be
responsible for this result.
Using similar technique of GMM, Thumrongvit et al., (2013) showed how government and
corporate bonds respectively contribute positively to economic growth, when simultaneous
expansion of other financial structures in terms of size and efficiency. The paper utlisies stock
market development and banking sector credit to economy as important confounders to check
for relationship between bond market development and economic growth.
CE
UeT
DC
olle
ctio
n

11
1.3. Regional review on ASEAN regionalism and bond market
Considering the speed and magnitude of the contagion during the Asian crisis of 1997, it is
highly likely that stronger policies of financial regionalism could help the countries establish
closer partnership to strengthen the financial grounds in terms of international monetary
market.
One of the cornerstones of Asian regionalism is ASEAN Plus Three (APT) framework which
involves ten members of ASEAN plus China, Japan and South Korea. APT was sought as an
institution to undertake financial governance within the region, correct the mistakes of the
neoliberalism policies of early 1990s and support the process of financial deepening (ADB,
2008).
Furthermore, Asian Bond Markets Initiative (ABMI) became one of the important steps within
APT framework to speed through financial governance in the region. Major objective under
this initiative was to promote issuance of local currency bonds and improve regulatory
framwork for strengthening bond market development. Dent (2004) explains that with regions’
huge potential to amass domestic saving and reserves, bond market would provide opportunity
for diversification of currencies. By institutionalising bond market, these emerging economies
have gained momentum of growth of long term funding in their domestic currencies.
Sukcharoensin (2018) points out strategic positions of bond market structures among ASEAN-
5 markets which includes Malaysia, Philippines, Thailand, Singapore and Indonesia. The paper
shows that Malaysia, Singapore and Thailand are in leading terms through aggressive growth
strategy with promising financial stability through bond markets; while Philippines remains in
conservative position with economy not drawing a significant benefit from bond market and
CE
UeT
DC
olle
ctio
n

12
Indonesian bond market showing unattractive and unstable conditions for the same. The paper
argues, for a well developed regional bond markets, these heterogeneity of strategic positions
should be eliminated and more competitiveness should be adopted.
Presence of positive and significant impact of ASEAN policies such as ABMI on bond market
development is empirically shown by Mizen & Tsoukas (2013). The paper controls for firm
specific characteristics and general bond market characteristics to assess the impact of policy
tools under ASEAN Bond Market Initiative which contribute to the bond market development.
The results also show that firm specific characters such as ability to influence investors
compliments the policy tools to improve the state of bond market.
CE
UeT
DC
olle
ctio
n
13
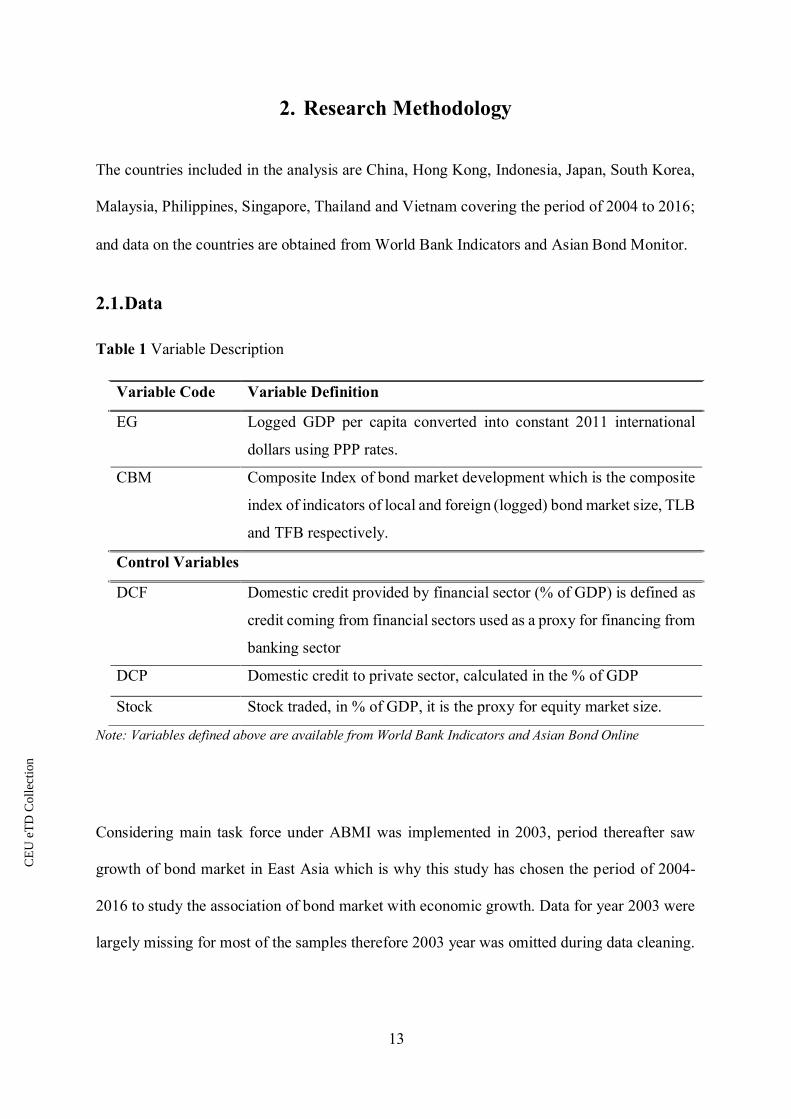
2. Research Methodology
The countries included in the analysis are China, Hong Kong, Indonesia, Japan, South Korea,
Malaysia, Philippines, Singapore, Thailand and Vietnam covering the period of 2004 to 2016;
and data on the countries are obtained from World Bank Indicators and Asian Bond Monitor.
2.1. Data
Table 1 Variable Description
Note: Variables defined above are available from World Bank Indicators and Asian Bond Online
Considering main task force under ABMI was implemented in 2003, period thereafter saw
growth of bond market in East Asia which is why this study has chosen the period of 2004-
2016 to study the association of bond market with economic growth. Data for year 2003 were
largely missing for most of the samples therefore 2003 year was omitted during data cleaning.
Variable Code Variable Definition
EG Logged GDP per capita converted into constant 2011 international
dollars using PPP rates.
CBM Composite Index of bond market development which is the composite
index of indicators of local and foreign (logged) bond market size, TLB
and TFB respectively.
Control Variables
DCF
Domestic credit provided by financial sector (% of GDP) is defined as
credit coming from financial sectors used as a proxy for financing from
banking sector
DCP Domestic credit to private sector, calculated in the % of GDP
Stock Stock traded, in % of GDP, it is the proxy for equity market size.
CE
UeT
DC
olle
ctio
n

14
The variables used in this paper are GDP per capita, (variable: EG), bond market development
(variable: BMD), and other control variables8 domestic credit from financial sector (variable:
DCF), Domestic credit to private sector (variable: DCP), Stock market size (variable: Stock).
Economic growth variable, which is the dependent variable for the regression, is in the natural
log form of GDP per capita measured in constant international USD using PPP formula.
Using the technique of (Pradhan et al., 2016) this paper utilizes Principal Component Analysis
(PCA)9 to form a composite index (variable: CBM)10 representing our proxy for (independent
variable) bond market development is represented by bond market size11 which includes total
local currency denominated bond size (variable: TLB) and total foreign currency denominated
bonds (variable: TFB), are in absolute amount. The trend of TLB and TFB are yearly trend
represented by respective Fig 1 and 2. (Note: A separate regression relationship between TLB,
TFB and EG will be carried out to check for their individual effect on EG variable.)
8 Additional control variables have been used to check for “good-fit” model, but due to higher value of on Schwarz Criterion and Akaike Info criteria, they have not been used in the main model. 9 PCA technique forms a new variable in the form of components, through linear combinations of set of variables which is formed in to factor score to be used as a interpretational observation. Abdi & Williams(2010) explain it provides an important information through compressing only important infromation, and simplifying the dataset. 10 Formulation of Composite Bond Index with PCA is depicted on Appendix 1 11. ADB (2017) explains bond market size in terms of total bond obligations, issued by government, financial and corporate sectors. The CBM index is formed with the use of total local currency denominated bond size and total foreign currency denominated bond size.
CE
UeT
DC
olle
ctio
n

15
Figure 1 Trend of Total local currency bond size for sample countries
Source: Author’s computation
Figure 2 Trend of Total foreign currency bond size for sample countries
Source: Author’s computation
CE
UeT
DC
olle
ctio
n

16
Considering results of Bhattacharyay (2013), Eichengreen & Luengnaruemitchai (2004) which
have utilized financing by banking sector and equity market size as important determinants of
bond market development, this paper utilizes confounding variables—Domestic credit
provided by financial sector (DCF) which is deposits made by financial corporation and
banking systems into the various sectors of the market; this variable includes the credit in the
form of bank deposits and monetary deposits made by other financial corporations including
insurance, pension funds and FX companies.
Likewise, another control variable Stock market size (Variable: Stock), as a proxy of equity
market size which is an important measure of financial market development. Domestic credit
to private sector (Variable: DCP) is the financial credit in the % of GDP coming from the
financial systems which could include monetary authorities and banking systems which the
private sector has to repay. Third variable under consideration is and can have considerable
influence in determining the development of bond market through possibility of scale economy
which is also discussed by Bhattacharyay (2013). Table 2 provides the descriptive statistics of
all the variables used in this study.
Table 2 Variable Descriptive Statistics
Variable Obs Mean Std. Dev. Min Max EG 125 9.94 0.78 8.30 11.31
CBM 125 0.11 0.84 -2.75 1.86 DCF 125 136.9 77.6 34.2 345.7 DCP 125 111.03 49.32 23.1 233.2 Stock 125 115.6 164.1 3.54 952.67
Source: Author’s computation
CE
UeT
DC
olle
ctio
n

17
2.2. Empirical Model Specification
The relationship between variables defined above are modelled into four stepwise tests for the
purpose of analysis. Firstly, a set of tests for stationarity in the panel data are run through unit
root tests, followed by cointegration test to check the presence of long run equilibrium
relationship between the variables used in the specified model. A regression with first
difference and lagged effect is also carried out to determine possible relationship that is
expected to be present amongst the variables, followed by granger causality test to determine
the direction of causality between the variables.
2.2.1. Regression with First difference in Panel data
Regression with first difference using the method of Least Squares(LS) intends to see if an
increase in bond market development is associated with an increase in economic growth and
what would be the magnitude of that association, hence the effect of bond market development
on economic growth.
To test the effect of bond market development on economic growth, we utilize first difference
with lagged effects. Firstly, using the first difference in this case allows us to override the
problem associated with autocorrelation and secondly helps to uncover the long run
association/effect amongst the variables. A basic relationship12 for this step is defined by the
equation below:
12 Extended model with addition of TradeOpenness and Inflation is tabulated and explained on Appendix 2. Note: Model selection with defined explanatory variables is done based on Schwarz Criterion and Akaike Info criteria. In addition to Stock market size, DCP and DCF as other explanatory variables, Inflation and Openness to trade have been used to form the model (table and explanation attached on Appendix)
CE
UeT
DC
olle
ctio
n

18
𝐄[∆𝐄𝐆𝐢𝐭| ∆𝐂𝐁𝐌𝐢𝐭 , ∆𝐂𝐁𝐌𝐢(𝐭−𝟐) . . ∆𝐂𝐁𝐌𝐢(𝐭−𝟔)]=βo + β1△CBM+ β2 △CBM i(t-2) + β3△CBM i(t-4) + β4△CBM i(t-
6)+β5△DCFit+β6△Stockit+β7△DCPit…………………………………………………………………….Eq. (1)
Secondly, yet another important Autoregression (AR) model specifications, implicit model
specified below is to be estimated as Eq. (2)
△EG = βo + β1△EG (t-1) + β2 △CBM+ β3△DCF + β4 △Stock + β5△DCP………………………………….. Eq. (2)
2.2.2. Granger Causality Test
Granger causality test runs with the basic assumption: if y is granger caused by x, past values
of x can forecast future values of y. According to the explanation by Demetriades &
Andrianova (2004),
“granger causality is grounded on a basic premise that if one variable(X) predicts
another(Y), it does not necessarily imply it is sole cause for it rather there could be
another variable(Z) which might be the true cause of both X and Y but because X has
shorter response link to Z, which makes it an indicator of presence of Y”. (p. 42-43)
As the LS method would not define the direction of causality, using granger causality test could
ascertain the causal relationship between the definitive variables. For the estimation of
relationships between finance and growth components, granger causality test is considered as
an important tool amongst economic literatures according to Levine (2005).
Granger causality model, also used by Pradhan et al., (2016), Fink et al., (2006), Hoffmann et
al., (2005), Awe (2012), shows the direction of causality rather than presence of causal
relationship between economic growth and bond market size index, with control variables
CE
UeT
DC
olle
ctio
n

19
used—DCF, Stock, DCP each of which have been important determinants of bond market
development.
Much simplified version of equations of AR framework are as following:
𝐆𝐃𝐏𝐭 = ∑ 𝛃𝐣 𝐂𝐁𝐌𝐭−𝐣 𝐤𝐣=𝟏 + ∑ 𝛒𝐣 𝐆𝐃𝐏𝐭−𝐣
𝐤𝐣=𝟏 …………………………………………...Eq. (3)
𝐂𝐁𝐌𝐭 = ∑ 𝛃𝐣 𝐆𝐃𝐏𝐭−𝐣 𝐤𝐣=𝟏 + ∑ 𝛒𝐣 𝐂𝐁𝐌𝐭−𝐣
𝐤𝐣=𝟏 …………………………………….……Eq. (4)
CE
UeT
DC
olle
ctio
n

20
3. Empirical Results and Analysis 3.1. Unit root test
Theoretically, unit root test is used to identify presence of stationarity amongst the variables.
The null hypothesis of this test assumes presence of unit roots and non-stationarity amongst
the series, hence H0. Hoang & Mcnown (2006) contend that Im–Pesaran–Shin (IPS) and Fisher-
type (ADF13 and PP14) tests are best suitable for unbalanced data types which is why the
variables are tested using these two tests. Tests find the presence of unit roots under the level
conditions of the variables but stationary at the first difference depicted with unit root inference
as I (1), as depicted on the Table 3.
Table 3 Panel Unit Root Test
H0= Series contains unit roots H1= Series is stationary Variable in their first difference
P-value
Fisher-Type Test Im, Pesaran and Shin W-stat
Unit Root Inference ADF PP
EG 0.76 0.00 0.80 - △EG 0.00 0.00 0.00 I(1) CBM 0.90 0.11 0.93 -
△CBM 0.01 0.001 0.000 I(1) DCF 0.99 0.99 0.99 -
△DCF 0.00 0.00 0.00 I(1) DCP 0.73 0.52 0.96 -
△DCP 0.00 0.00 0.00 I(1) Stock 0.03 0.01 0.01 -
△Stock 0.00 0.00 0.00 I(1) Source: Author’s computation
13 ADF: Augmented Dickey–Fuller unit root test
14 PP: Phillips-Perron (PP) unit root test
CE
UeT
DC
olle
ctio
n

21
3.2. Panel Cointegration test
Panel data cointegration test is used as a next step to determine the presence of long run
equilibrium relationship between the variables. Results of both Kao Residual cointegration test
and Johansen Fisher Panel cointegration test, show that the null hypothesis of no cointegration
can be rejected at the 5% level of significance. This demonstrates that the variables used in the
model observes long run relationship amongst the variables. This further supports the next step
to ascertain type of relationship these variables have amongst them through regression in the
next section.
Table 4 Kao Residual Cointegration Test
Kao residual test ADF: Augmented Dickey-Fuller Test Equation
t-Stat Prob
EG, CBM, DCF, DCP Stock -3.73 0.001
Null Hypothesis: No cointegration Trend Assumption: No deterministic trend
Source: Author’s computation
From Table 4 of Kao Residual cointegration test we can reject the null hypothesis of non
cointegration with 5% level of significance with the P-value of 0.001, which gives us a strong
evidence of long run relationship between variables.
Table 5 Johansen Fisher panel cointegration test
No. of CEs Fisher Stat (from trace test)
Prob Fisher stat (max eigen test)
Prob
None 12.48 0.8217 12.48 0.000 At most 1 80.61 0.000 80.61 0.000 At most 2 2371 0.000 2371 0.000
Null Hypothesis: No cointegration Source: Author’s computation
From Table 5 of Johansen Fisher cointegration test, both trace and max-eigen test show high
level of significance of 5% level of confidence at most 2 variables with P-value 0.00, which
also gives the evidence of long run relationship.
CE
UeT
DC
olle
ctio
n

22
3.3. Panel Regression in First Differences
This section covers the results of regression models specified by Eq. (1) and Eq. (2). While our
large results are focused on the entire region (Panel A), covering ten countries, some separate
regressions are run to test for narrow markets such as ASEAN-515 and Plus-316, henceforth
known as Panel B, in order to show more diversified results, which is why a four different part
of regression results are depicted below:
3.3.1. Result of panel regression for Eq. (1) for the entire region (Panel A)
A change in size of bond market in a particular year would affect the economic growth in the
subsequent years which is estimation of regressions with lags within CBM (bond market
development) variable becomes impetus, regression model specification is shown by Eq. (1)17.
The Table 6 shows the result with FD, 2, 4 and 6 lags, along with the other explanatory
variables.
15 ASEAN-5: Malaysia, Thailand, Philippines, Singapore and Indonesia.
16 Plus-3 China, Japan and Republic of Korea
17 E[∆EGit| ∆CBMit , ∆CBMi(t−2) . . ∆CBMi(t−6)]=βo + β1△CBM+ β2 △CBM i(t-2) + β3△CBM i(t-4) + β4△CBM i(t-
6) + β5∆DCFit + β6 ∆Stockit + β7∆DCPit…………….Eq. (1)
Part A: Result of panel regression for Eq. (1) for the entire region (Panel A)
Part B: Result of panel regression for Eq. (2) for the entire region (Panel A)
Part C: Result of panel regression for Eq. (2) for the ASEAN-5 and Plus-3 (Panel B)
Part D: Result of panel regression with TLB, TFB and EG for the ASEAN-5 and Plus-3
(Panel B)
CE
UeT
DC
olle
ctio
n

23
Table 6 First Difference with lagged effects of CBM of Eq. (1)
△EG 1 2 3 4 Cons t-stat
0.029** 8.76
0.024** 5.53
0.017** 3.51
0.014** 3.88
△CBM t-stat
0.103** 3.74
0.102** 3.62
0.101** 2.87
0.08** 2.81
△CBM lag 2 t-stat
0.057* 1.99
0.039 1.03
0.01 0.19
△CBM lag 4 t-stat
0.077* 2.7
0.065* 3.02
△CBM lag 6 t-stat
0.082* 3.30
△DCF t-stat
-0.0018** -3.09
-0.0021* -3.64
-0.003** -4.6
-0.001 -1.30
△Stock t-stat
0.0001 1.37
0.00004 1.16
0.00003 0.6
0.0001*** 1.93
△DCP t-stat
0.0016* 1.97
0.0022* 2.64
0.003 4.24
0.0011*** 1.83
Adj- R2 0.214 0.26 0.34 0.38 N 114 95 75 56 Schwarz Criterion Akaike Info Criterion
-4.18 -4.30
-4.14 -4.30
-4.26 -4.47
-5.16 -5.50
Period 2005-2016 2006-2016 2009-2016 2011-2016
*P<0.05 **P<0.01 ***P<0.1
Output after running for white standard errors Source: Author’s computation
According to the result of column (1) from Table 6, in years when bond market size increased
by 1% more, economic growth increased by 0.11% more on average. The constant for this
relation is 0.03, which shows that economic growth grew by 0.03% on average when bond
market size remained the same. Result also shows that coefficient of △CBM is statistically
significant at 1% level.
Column 2, 3 and 4, in Table 6 depict the result of regressions as we add 2, 4 and 6 lags of CBM
respectively, which simultaneously reduces the number of observations and periods under
CE
UeT
DC
olle
ctio
n

24
consideration. Considering the six lag effect in column (4), economic growth increases by
0.08% more on average when bond market increases by 1% more; average increase in
economic growth is 0.01% two years later, 0.065% after 4 years and 0.08% after 6 years.
Extended model of this specification with lagged effects of CBM on economic growth, with
additional control of Trade openness and inflation variables are explained on Appendix 1.
Table 7 Cumulative coefficient of △CBM
△EG 1 2 3 4 Cumulative coefficient of △CBM
0.109 0.159 0.217 0.237
No of lags 0 2 4 6
R2 0.214 0.26 0.34 0.38 N 114 95 75 56
Cumulative coefficient, Table 7 on △CBM is 0.237% after addition of all coefficients of
△CBM, which means comparing countries and years with 1% increase in bond market size,
increases economic growth by 0.24% more on average after 6 years, when and where bond
market size increases by 1% more. The R2 also considerably improves as the number of lags
are increased, with highest at 0.38 in model with six lags of △CBM, which shows that 38% of
variations in economic growth are expressed by variables used.
3.3.2. Result of panel regression for Eq. (2) for the entire region (Panel A)
In addition to model with lagged effect of main independent variable △CBM, using lagged
dependent variable as a part of regressor forms a dynamic relationship within the model and
supports the claim on long run association, both Achen (2001), Luke & Kelly (2005) point out
arguments on the same ground. This AR model when dependent variable becomes independent
CE
UeT
DC
olle
ctio
n

25
variable in the lag form, hence forms a dynamic model. The result of the model is explained
below:
Table 8 Regression result for Eq. (2)
Number of obs 105 Periods included 11 Prob > F 0.0000 R-squared 0.307 Adj R-squared 0.272 Root MSE 0.0268 White diagonal standard errors and Covariance (d.f. corrected) △EG Coef. (White) Std.
Err. t P>|t|
cons 0.021** 0.006 3.48 0.000 △EG(t-1) 0.261* 0.134 1.95 0.054 △CBM 0.084** 0.025 3.26 0.002 △DCF -0.002* 0.0006 -2.51 0.013 △Stock 0.0001 0.00003 1.37 0.17 △DCP 0.0014 0.00090 1.60 0.11 Schwarz Criterion -4.20 Akaike Info Criterion -4.34
*P<0.05 **P<0.01 ***P<0.1 Source: Author’s computation
According to the result of Table 8, which follows the regression result of Eq. (2), in years when
bond market size increased by 1% more, economic growth increased by 0.084% more, on
average, controlling for one-year lagged economic growth, △DCF, △stock and △DCP. The
constant for this relation is 0.021, which shows that economic growth grew by 0.021% on
average when bond market size remained the same. The R2 for this model is 0.27. Extended
model of this specification with effects of △CBM on economic growth, with additional control
of Trade openness and inflation variables are explained on Appendix 2.
CE
UeT
DC
olle
ctio
n

26
3.3.3. Result of panel regression for Eq. (2) for the ASEAN-5 and Plus-3
Furthermore, a separate regression for Eq. (2) is run, as shown by Table 9, to account for
difference in the bond market structure with a new Panel B specified to show the estimation
for ASEAN-5 and Plus-3 countries to get more heterogeneous insight. While Panel A, is the
same as Table 8. Plus-3 includes China, Japan and Republic of Korea while ASEAN-5
includes, namely Malaysia, Thailand, Philippines, Singapore and Indonesia.
Table 9 Regression result for Eq. (2) for Panel A and B
*P<0.05 **P<0.01 ***P<0.1
a Period: 11, no. of observations: 105 | b Period: 11, no. of observations: 55 | c Period: 11, no. of observations: 33 Source: Author’s computation
According to the result from Panel B for ASEAN-5, in years when bond market size increased
by 1% more, economic growth increased by 0.07% more on average, controlling for one-year
lagged economic growth, △DCF, △Stock and △DCP. The coefficient for this category is
significant at 10% level of confidence. This effect demonstrates that higher issuance of bond
has contributed to growth in the region.
For the Plus-3 as a region, there is a positive but insignificant effect of bond market size
increase on economic growth. This shows that the general pattern represented by the data,
Country Constant △EG(t-1) △CBM △DCF △Stock △DCP R2
PANEL Aa
Coef t-stat
0.021** 3.48
0.261* 1.95
0.084** 3.26
-0.002* -2.51
0.0001 1.37
0.0014* 1.60
0.27
PANEL B ASEAN-5b Coef
t-stat 0.03** 4.06
-0.07 -0.45
0.07 1.53
-0.003* -2.30
0.001* 2.52
0.002 1.22
0.24
Plus-3c Coef t-stat
0.01 1.10
0.66** 3.68
0.06*** 1.6
-0.001 -1.47
0..00005 0.85
0.001 0.48
0.62
CE
UeT
DC
olle
ctio
n

27
economic growth is in the confidence interval with a 90% certainty, for the markets that have
growth in bond market size by 1% more, on average.
3.3.4. Result of panel regression for Eq. (2) for the ASEAN -5 and Plus-3
Table 10 shows the effect of total local currency bond market size (TLB) and total foreign
currency bond market size (TFB) on economic growth are tested through FD regression for
both the panels. For all the panels (and respective regions), both local currency bond market
size and foreign currency bond market size contribute positively and significantly but effect of
local currency bond size is seen higher than foreign currency bonds for all panels. This
indicates that policy programs run to promote local currency bond markets in ASEAN region
has come in effective form to translate to economic growth.
Table 10 Regression result for Panel A and B, with △TFB and △TLB
*P<0.05 **P<0.01 ***P<0.1 a Period: 12, no. of observations: 114 | b Period: 12, no. of observations: 60 | c Period: 12, no. of observations: 36
Country Constant
△TFB △TLB △Control R2
PANEL Aa Coef.
t-stat 0.017**
4.82 0.06** 4.02
0.12** 5.48
Yes 0.37
PANEL B ASEAN-5b
Coef. t-stat
0.02** 4.25
0.05*** 1.85
0.07* 2.33
Yes 0.31
Plus-3c Coef. t-stat
0.008 1.58
0.11** 3.55
0.20* 5.75
Yes 0.66
CE
UeT
DC
olle
ctio
n

28
3.4. Granger Causality Test
This test indicates the direction of causal relationship between two variables X and Y, with
hypothesis defined in following ways:
H0=X does not granger cause Y
H1=X granger causes Y
Hence to reject H0 at 5% level of significance, p value should be less than or equal to 0.05
(calculated Degree of freedom in appendix 4). As the non-stationary variables will present
spurious results, VAR model is conducted using variables at their stationarity attained through
first difference. In order to determine the best lag length for the causality model, lag order
selection criterion is chosen based on Akaike Information Criterion (AIC) and Schwarz
Information Criterion (SC) (See Appendix 5), hence lag length of 6 has been chosen for the
study, which brings down the number of observation to 56.
Table 11 Result of Pairwise Granger Causality Test
Null Hypothesis Obs F-stat
Prob Decision Type of causality
CBM does not Granger cause EG EG does not Granger cause CBM
56 0.96 2.81
0.47 0.021
Accept Reject
No causality Unidirectional
DCF does not Granger cause EG EG does not Granger cause DCF
56 2.40 2.90
0.044 0.020
Reject Reject
Bidirectional Bidirectional
DCP does not Granger cause EG EG does not Granger cause DCP
56 2.72 2.94
0.024 0.017
Reject Reject
Bidirectional Bidirectional
Stock does not Granger cause EG EG does not Granger cause Stock
56 1.20 0.26
0.33 0.95
Accept Accept
No causality No causality
DCF does not Granger cause CBM CBM does not Granger cause DCF
56 1.19 0.93
0.33 0.48
Accept Reject
No causality Unidirectional
DCP does not Granger cause CBM CBM does not Granger cause DCP
56 1.71 0.72
0.14 0.63
Accept Accept
No causality No causality
Stock does not Granger cause CBM CBM does not Granger cause Stock
56 0.63 4.16
0.70 0.002
Accept Reject
No causality Unidirectional
DCP does not Granger cause DCF DCF does not Granger cause DCP
56 5.47 4.58
0.000 0.001
Reject Reject
Bidirectional Bidirectional
Stock does not Granger cause DCF DCF does not Granger cause Stock
56 4.01 1.72
0.003 0.140
Reject Accept
Unidirectional No causality
Stock does not Granger cause DCP DCP does not Granger cause Stock
56 3.40 2.83
0.008 0.021
Reject Reject
Bidirectional Bidirectional
Source: Eviews output
CE
UeT
DC
olle
ctio
n

29
The result from Table 9 shows a unidirectional causality running from economic growth to
bond market development, while bi-directional causality runs between economic growth and
domestic credit to private sector, as well as economic growth and domestic credit from
financial sectors. Additionally, a unidirectional causality runs from bond market development
to domestic credit from financial sectors and Stock. This presents that economic growth has
greater predictive power for bond market development for the region studied.
CE
UeT
DC
olle
ctio
n

30
4. Discussion of results The result from different model specifications demonstrate statistically strong association
between yearly changes in bond market development and subsequent changes in economic
growth, controlling for three different variables.
With the results from Part A model, considering the lagged effects of Bond market
development with first difference, we understand that an increase in bond market size produces
positive and significant increase in economic growth, referring to Table 6. The second dynamic
model also supports this result with positive and significant relationship; with 1% increase in
economic growth on previous year would lead to 0.26% increase in economic growth for the
current year in the overall sample. But considering ASEAN-5 and Plus-3 separately, we get
interesting result (Table 9). For the case of ASEAN-5, result is negative and insignificant for
relationship between lagged economic growth and current economic growth.
Furthermore, controlling for stock market size, credit to private sectors and proxy for banking
sector, both bond markets—total local currency bond market and total foreign currency bond
markets have positive and significant in ASEAN-5, Plus-3 and aggregate sample economies,
Local currency denominated bond market tends to have greater effect on economic growth
compared to foreign denominated bonds, reflecting the success of ASEAN Bond Market
Initiatives (ABMI) on contributing positively and significantly on economic growth of the
region.
Amongst all variables for financial indicator, domestic credit from financial sector, hence
proxy variable for banking sector shows negative and highly significant relationship with the
economic growth. This would be representation of effect a 1% change in size of domestic
financial institutions, particularly credit from banking sector has on economic growth, with
CE
UeT
DC
olle
ctio
n

31
approximately 0.002% reduction in economic growth, on average, when controlled for all other
variables. This result could be in line with paper by Felman, et al., (2011) where authors claim
large share of domestic investor base for ASEAN economies still come from domestic financial
intermediaries, banking sectors and mutual sectors particularly. This could have been an
impediment for financial market deepening, and development of bond market particularly as
expansion of investors base for bond market is affected by over exposure to money market.
The granger causality result shows interesting turns on the direction of causality flow, where
stock market granger causes domestic credit to private sector, domestic credit to private sector
granger causes economic growth, economic growth granger causes bond market development
and bond market granger causes stock market development. This implies that whilst also
considering growth of bond market through economic growth, stock market should be
deepened through bond market development to promote economic growth.
Limitations of models and suggestion for further research
The result thus produced are based on the analysis of ten East Asian economies, all of which
are the members of ASEAN+3 (APT). Although the region has been fast in its growth prospect,
not all economies have same speed for economic growth or financial development. Japan,
China and South Korea belong to different growth paradigm, primarily considering their
political economic structures, models of capitalism and development models.
Vietnam is amongst the lowest among ten economies used in this study in terms of bond market
size which is still growing. Brunei, Cambodia, Laos and Myanmar have been omitted from this
examination due to very poor data on bond market size. Additionally, due to missing variables
for the case of Vietnam, dropping of variables reduced number of years, which prohibits
CE
UeT
DC
olle
ctio
n

32
estimation for 12 periods. Although Panel B accounts for more narrowed down samples,
replicating same models for individual country would give us more country-specific result.
Furthermore, the paper only estimates composite bond market index based on local currency
denominated bonds and foreign currency denominated bonds and has not considered
International bonds. Primary reason for this was unavailability of data for balanced time
periods for all markets considered. International bond size for some markets are really low
compared to the rest, which would have become a problem with the estimation. The bond
market size used in this study gives more edge to domestic bond market rather than overall
bond market size, which could be an area for further research.
Another important area for further research would be independent study on the progress of
corporate bond market and government bond markets, which have been growing in different
proportions, and not in much satisfactory manner in the case of ASEAN+3. This study uses
only size indicator of bond market development which limits its capacity to cover secondary
characteristics of bond market development, such as liquidity aspects. Further scope to find the
relationship between economic growth and bond market development on the grounds of cost
of capital, ease of obtaining capital, yield components remains.
For more advanced take on finding the causality relationship, much superior tests in
comparison to granger causality should be considered such as Toda Yamamoto used by Coskun
et al., (2017), Vector Error Correction Model (VECM), Vector Autoregression (VAR).
Considering granger causality only shows the direction of causation instead of true cause, there
could always be potential estimation bias.
CE
UeT
DC
olle
ctio
n

33
Finally, issue of endogeneity could be our concern when it comes to reverse causality between
economic growth and bond market development which has not been explored here. Alternative
model such as Generalized Method of Moments which employs instrumental variable for
treatment, as employed in papers by Ocbio et al., (2016) and Thumrongvit et al., (2013) could
give us deeper insight into the problem.
CE
UeT
DC
olle
ctio
n

34
5. Concluding remarks and policy recommendations
The main purpose of this study has been to find the nexus between bond market development
and economic growth in East Asian economies or more specifically selected countries of
ASEAN+3. This study has used ten important markets from the region for the period of 2004-
2016. In order to determine the relationship in this subject, this paper has utilized cointegration
test, panel regression with first difference technique with different model specifications,
including lagged regressions and AR models and granger causality test. These models have
been tested for all sample as well as subsamples for more robustness check. The subsamples
of ASEAN-5 and China, Japan and South Korea (Plus3) were formed based on the level of
bond market development of markets included in each subsample.
The paper has considered local currency bond market and foreign currency bond market size
respectively as a composite indicator of domestic bond market and relations have been derived
both for composite index and two bond market size separately. The main results from different
specifications of regression shows presence of positive and significant effect of composite bond
market development on economic growth of the region, with existence of long run relationship
present between variables studied.
Considering impact of capital market on economic growth, both bond market composite index
and equity market shows positive influence on economic growth which means the region can
accrue more benefits through capital market deepening for the growth of real sectors.
Interestingly, result of granger causality shows the direction of causality from economic growth
to bond market development which also demonstrates that economy’s economic growth
potential is rudimentary for financial market development.
CE
UeT
DC
olle
ctio
n

35
This result is in line with many researches which support demand-following hypothesis where
economic growth is responsible for causing financial growth. Credit to good economic progress
of economics of this region goes to lessons these markets could timely derive since financial
contagion of 1997 which drew attention to improving macroeconomic stability, financial
liberalisation and regional as well as global openness. East Asian growth paradigm, which
initially emerged with trade openness, could give credit to the strength of regionalism which
has in the recent years translated to cooperation for financial development. In this respect,
results of this paper demonstrates how region has followed that development path with
causality directed from economic growth to bond market growth, while at the same time, bond
market development having positive effect on economic growth in return.
These results lead us to exploring important policy implications for further growth of the East
Asian market. Firstly, East Asia still has huge potential to amass long term funds through
corporate sector bond market, yet government bond market dominates the market. But bigger
size of government bond markets for both local currency and foreign currency denominated
bonds should not be considered as an impediment. Improvements in the scope and issuance of
government bonds could be a steppingstone for improving liquidity as well as conducting
investment activities in different areas of development. Local currency debt market can see its
growth when the government debt management system stands out as credible agent of change.
Stability of interest rates and more importantly a liberalised interest rate regime is important
for market oriented growth for bond market or overall capital market development in this
regard. Liberalisation of interest rate should be promoted along with a close regulatory watch
as it would promote true market prices and work in accordance to demand and supply of market
CE
UeT
DC
olle
ctio
n

36
capital. In addition to this, it would also encourage growing investors base with more credit
flowing into private and public sectors.
Furthermore, bond financing for regional infrastructural projects would particularly be
important streamline to promote issuance of domestic bond market. PWC (2017) report points
out that growth in infrastructural spending is expected to grow by 7.8% on average amongst
Singapore, Vietnam, Thailand, Philippines, Malaysia and Indonesia till 2025. This void in
infrastructure development could be supplanted by bond issuance, which will contribute to
economic development as well as bond market development simultaneously.
Another important policy framework should be built on agenda of growing investors base—at
domestic, regional and international domain. Improving investors base relies in both
macroeconomic and microeconomic features of the economy. While macroprudential policies
that control fluctuations of exchange rate regime and interest rates safeguards economy from
sudden changes in financial market conditions, firm-level conditions such as innovation,
profitability and growth prospects determine growth potential of investors base for both local
currency debt and foreign currency debt. East Asian region should promote stability of political
economy, institutional qualities by reducing corruption, cronyism, all of which will build on
investors’ trust in the domestic and regional market.
To conclude, empirical findings of this study finds positive nexus between financial market
development and economic growth and signals higher economic growth potential with further
advancement of size of bond markets. Investigation on other parameters of bond market
development such as efficiency, stability and accessibility and their relationship with economic
growth of this region requires further investigation.
CE
UeT
DC
olle
ctio
n

37
Appendix
Appendix 1 Formulation of Principal Component analysis
A basic Stata code for Principal Component analysis is run using two variables TLB and TFB
which then forms two components, where component with eigenvalue more than 1 is chosen,
and in our case, Component 1 has 1.69 eigenvalue with proportion of 0.85. This way two
different variables are summarized through few factors which are supposed to capture variation
in data through 85%. Note: PCA comes with its set of limitations
PCs EigenValue Difference Proportion Cumulative Component 1 1.69 1.39 0.85 0.85 Component 2 0.30 - 0.15 1
PCs Component 1 Component 2 TLB 0.71 0.70 TFB 0.7 -0.70
CE
UeT
DC
olle
ctio
n

38
Appendix 2 Extension of Eq. (1) with addition of Trade Openness and Inflation
△EG 1 2 3 4 Cons 0.03** 0.024** 0.021** 0.014** △CBM 0.09** 0.09** 0.068* 0.076** △CBM lag 2 0.055*** 0.06*** 0.011 △CBM lag 4 0.085* 0.065* △CBM lag 6 0.079* △DCF -0.0013** -0.0018* -0.002** -0.0007 △Stock 0.0001 0.00004 0.00006 0.00005 △DCP 0.001* 0.0018* 0.002 0.0011 △Open 0.0004 0.0003 0.001** 0.0002 △Inflation 0.001 0.0011 0.001* -0.0001 Adj- R2 0.23 0.27 0.46 0.36 N 114 95 75 56 Schwarz Criterion Akaike Info Criterion
-4.14 -4.31
-4.08 -4.30
-4.37 -4.64
-5.03 -5.40
Period 2005-2016 2006-2016 2009-2016 2010-2016
According to the result of column (1) from Appendix 2, in years when bond market size
increased by 1% more, economic growth increased by 0.09% more on average. The constant
for this relation is 0.03, which shows that economic growth grew by 0.03% on average when
bond market size remained the same. Result also shows that coefficient of △CBM is
statistically significant at 5% level.
This relation has been drawn including Trade Openness and Inflation as control variables, in
order to check if controlling for these variables would lead to any changes in our new
specification. Although the coefficient on main independent variable △CBM remains largely
same in this table and Table 6, this paper opts to choose specification of Table 6 due to better
value on Schwarz Criterion and Akaike Info Criterion, for every models in column 1,2,3 and
4.
CE
UeT
DC
olle
ctio
n

39
Appendix 3 Extension of Eq. (2) with addition of Trade Openness and Inflation
Number of obs 105 Periods included 11 Prob > F 0.0000 R-squared 0.34 Adj R-squared 0.30 Root MSE 0.0264 △EG Coef. Std. Err. t P>|t|
cons 0.021** 0.0044 4.95 0.000 △EG(t-1) 0.260** 0.086 3.04 0.003 △CBM 0.081** 0.027 3.02 0.002 △DCF -0.0011** 0.0005 -1.98 0.004 △Stock 0.00005 0.00003 1.66 0.15 △DCP 0.001* .000697 1.12 0.05 △Open 0.0003 0.0002 1.67 0.09 △Inflation 0.001 0.001 1.34 0.18 Schwarz Criterion -4.15 Akaike Info Criterion -4.35
Compared to the result of Table 8, result of Appendix 3 shows regression result of Eq. (2) but
adding two more control variables for Trade openness (△Open) and Inflation (△Inflation).
The result shows that in years when bond market size increased by 1% more, economic growth
increased by 0.081% more, on average, controlling for one-year lagged economic growth,
△DCF, △stock, △DCP, △Open and △Inflation. Coefficients for this result is very close to
that on Table 8, yet this paper opts the model without controlling for Openness and Inflation,
because value on Schwarz Criterion and Akaike Info Criterion for Table 8 is better
specification, hence better fit model.
CE
UeT
DC
olle
ctio
n

40
Appendix 4 Autoregression lag order selection criteria
Appendix 5 Degree of freedom
Calculating the degree of freedom,
Degree of freedom(df) for F-tab= (V1, V2)
V1=K-1=5-1=4 | V2=n-k=56-5=51
F tab at (4,51) df is 2.55~2.6
CE
UeT
DC
olle
ctio
n

41
List of References Bhattacharyay, B. N. (2013). Determinants of bond market development in Asia. Journal of
Asian Economics, 24 , 124–137.
Abdi , H., & Williams, L. J. (2010). Principal component analysis. Wiley Interdisciplinary Reviews: Computational Statistics, 433-439.
Achen, C. H. (2001). Why Lagged Dependent Variables can supress teh explainatory power of other independent variables. University of Michigan, Department of Political Science and Institute for Social Research. MI: University of Michigan.
ADB. (2008). Asian Bond Online News and Publications. Retrieved from ASEAN+3 New ABMI Roadmap: https://asianbondsonline.adb.org/publications/adb/2008/abmi_roadmap.pdf
ADB. (2015). Domestic Bond Market in Asia. Asian Development Bank, Asian Development Bank. The World Bank Grooup.
ADB. (2017, Dec). Size of LCY Bond Market in % of GDP. (A. D. Bank, Producer) Retrieved from AsianBondsOnline web portal : https://asianbondsonline.adb.org/regional/data/bondmarket.php?code=LCY_in_GDP_Local
Adeyeye, P. O., Fapetu, O., Aluko, O. A., & Migiro, S. O. (2015). Does Supply-Leading Hypothesis hold in a Developing Economy? A Nigerian Focus. Procedia Economics and Finance 30 (2015) 30 – 37.
Agbetsiafa, D. (2004). The Finance Growth Nexus: Evidence From Sub-Saharan Africa. Savings and Development, 28, 271-288.
Awe, O. O. (2012). On pairwise granger causality modelling and econometric analysis of selected economic indicators. Retrieved from Interstat statjournals. net/YEAR/2012/articles/1208002. pdf, pages 1–17, 2012.
Coskun, Y., Seven, U., & Ertugrul, H. M. (2017). Capital market and economic growth nexus: Evidence from Turkey. Central Bank Review , 17, 19-29.
CE
UeT
DC
olle
ctio
n

42
Demetriades, P., & Andrianova, S. (2004). Fiinance and Growth: What we know and What we need to know. In C. A. Goodhart, Financial Development and Economic Growth (pp. 38-63). England: Palgrave Macmillan.
Demetriades, P., & Andrianova, S. (n.d.). Fiinance and Growth: What we know and What we need to know. In C. A. Goodhart, Financial Development and Economic Growth (pp. 38-63). England: Palgrave Macmillan.
Dent, C. M. (2004). Taiwan and the New Regional Political Economy of East Asia. First European Association of Taiwan Studies Conference. London: SOAS.
Eichengreen, B., & Luengnaruemitchai, P. (2004). Why Doesn’t Asia Have Bigger Bond Markets? Working Paper 10576, National Bureau Of Economic Research. 1050 Massachusetts Avenue, Cambridge, MA.
Felman, J., Gray, S., Goswami, M., Jobst, A., Pradhan, M., Peiris, S., & Seneviratne, D. (2011). ASEAN5 Bond Market Development: Where Does it Stand? Where is it Going? IMF Working Paper.
Fink , G., Haiss, P., Kirchner, H., & Moser, U. (2006). Financing through Bond Issues and the Nexus with Economic Growth. 11th International Conference on Macroeconomic Analysis and International Finance. Vienna: Europe Institute.
Fink, G. H. (2007, December 5). Financing through bond issues and the nexus with economic growth. Paper presented at the 11th international conference on macroeconomic analysis and international finance, Vienna. Vienna.
Gomez-Puig, M., & Rivero, S. S. (2015). On the bi-directional causal relationship between public debt and economic growth in EMU countries. Universitat de Barcelona, Research Institute of Applied Economics. Barcelona: Research Institute of Applied Economics.
Harvie, C., & Lee, H.-H. (2002). New Regionalism in East Asia: How Does It Relate to the East Asian Economic Development Model? University of Wollongong, Department of Economics. University of Wollongong.
Hoang, N. T., & Mcnown, R. F. (2006). Panel Data Unit Roots Tests Using Various Estimation Methods. Journal of Economic Literature (JEL).
CE
UeT
DC
olle
ctio
n

43
Hoffmann, R., Ging, L. C., Ramasamy, B., & Yeung, M. (2005). FDI and Pollution: a Granger Causality Test using Panel Data. Journal of Economic Literature (JEL).
Kapingura, F., & Makhetha-Kosi, P. (2014). The Causal Relationship between the Bond Market Development and Economic Growth in Africa: Case Study of South Africa1. Mediterranean Journal of Social Sciences.
Levine, R. (2005). Finance and Growth: Theory and Evidence. In P. Aghion, & S. N. Durlauf, Handbook of Economic Growth (Vol. 4). Amsterdam: Elsevier, 2005-2014.
Luke, K., & Kelly, N. J. (2005). Dynamic Models for Dynamic Theories: The Ins and Outs of Lagged Dependent Variables. Political Analysis.
Mizen, P., & Tsoukas, S. (2013, March 04). What promotes greater use of the corporate bond market? A study of the issuance behaviour of firms in Asia. Retrieved from Oxford Economic Papers: https://academic.oup.com/oep/article/66/1/227/2362652
Ocbio, C., Njogo, B., & Nwankwo, E. (2016). Bond Market Development and Economic Growth in Nigeria (1982-2014). A Gmm Approach. Research Journal of Finance and Accounting, 7(8).
Panizza, U., & Presbitero, A. F. (2014). Public debt and economic growth: Is there a causal effect? Journal of Macroeconomics, 41, 21-41.
Pradhan, R. P., Arvin, M. B., Bennett, S. E., Nair, M., & Hall, J. H. (2016, June). Bond Market Development, Economic Growth and Other Macroeconomic Determinants: Panel VAR Evidence. Japanese Association of Financial Economics and Engineering, 23(2), 175-201.
Pradhan, R. P., Zaki, D. B., Maradana, R. P., Dash, S., Jayakumar, M., & Chatterjee, D. (2015). Bond market development and economic growth: The G-20 experience. Tekhne.
PWC. (2017). Understanding infrastructure opportunities in ASEAN. Retrieved from Research & insights: https://www.pwc.com/sg/en/publications/cpi-mas-infrastructure-opporuntities-in-asean.html
Said, R. M. (2012). East Asian Bond Markets and Economic Growth. International Proceedings of Economics Development and Research.
CE
UeT
DC
olle
ctio
n

44
Shaw, E. S. (1973). Financial Deepening in Economic Development. New York : Oxford University Press.
Sukcharoensin, S. (2018). Strategic Position of Bond Markets in ASEAN-5: Challenges and Directions for Development. DLSU Business & Economic Review.
The World Bank. (2006). Financial Sector Development Indicators. Retrieved from Bond market development indicators: http://siteresources.worldbank.org/INTTOPACCFINSER/Resources/Bndind.pdf
Thumrongvit, P., Kim, Y., & Pyun, C. S. (2013). Linking the missing market: The effect of bond markets on economic growth. International Review of Economics and Finance.
CE
UeT
DC
olle
ctio
n