bond markets and banks in inter-war japansticerd.lse.ac.uk/dps/is/is521.pdf · bond markets and...
TRANSCRIPT
BOND MARKETS AND BANKS IN INTER-WAR JAPAN
Makoto Kasuya, Professor of Business History, Faculty of Economics, University of Tokyo
The Suntory Centre
Suntory and Toyota International Centres for Economics and Related Disciplines
Discussion Paper Houghton Street No. IS/07/521 London WC2A 2AE August 2007 Tel: 020-7955-6699
Preface
A symposium was held in the Michio Morishima Room at STICERD in March 2007. This paper by Makoto Kasuya was one of two papers presented at this symposium, and we are grateful to Professor Kasuya for allowing the paper to appear as a discussion paper. August 2007
Abstract
Issues of bonds increased in inter-war Japan, the main investors in bonds being banks because demand for loans declined in this period. Banks that were more tolerant of risks (that is, whose capital ratio was higher) made a larger amount of loans, which were riskier than bonds. While national bonds were traded actively in secondary markets, local bonds, corporate bonds, and bank debentures were not traded actively during this period. After the formation of cartels of banks and securities firms for bond underwriting and trading during the Great Depression, bond trading in secondary markets diminished, except for national bonds. Keywords: Japanese banks, bond markets, inter-war period, the Great Depression, national bonds, corporate bonds, cartels, capital
© Makoto Kasuya. All rights reserved. Short sections of text, not to exceed two paragraphs, may be quoted without explicit permission provided that full credit, including © notice, is given to the source.
Bond Markets and Banks in Inter-war Japan
Makoto Kasuya
Introduction During and soon after the First World War, Japan experienced an economic boom and an
increase in overall price levels. After the financial panic of 1920, however, prices plunged and
the Japanese economy remained sluggish during the 1920s. Moreover, the Great Kanto
Earthquake struck the Tokyo region and caused great suffering. Owing to these difficulties,
banks ran up considerable debts and saw big runs on several occasions.1 The Showa
Financial Crisis of 1927 was the largest of such runs, and forty-five banks closed.2 In addition
to these general economic circumstances, some institutional factors in the banking industry
are thought to have contributed to the problems. Firstly, it was common practice in inter-war
Japan for directors of industrial firms to assume directorships of banks, and the resultant
symbiotic relationships led to banks extending large loans to related industrial firms, many of
which were not repaid.3 Secondly, since because of a significant increase in deposits during
the First World War, capital ratio to total assets declined, leading to severe agency problems
in banking. And thirdly, although banks had become dependent on short-term deposits, their
lending became more long term, because the sluggish economic conditions meant that loans
to agriculture became a fixture, while those to industrial firms could not readily be recovered.
In this way, Japanese banks faced an increased maturity mismatch.4
The main source of external funds for large non-financial firms at this time was the issue of
stocks. Bank loans were usually short-term (about 60 to 90 days) and often rolled over; they
were a source of industrial firms’ working funds. The debt owed to the banks by large firms
was in most cases less than their share capital. Corporate bond issues, however, increased
rapidly after 1924 and became the main source of external funds for large firms in the late
1920s, before declining in the 1930s. The reasons for the dominance of bond issues were as
follows. Firstly, because of plunging stock prices in 1920 and the sluggish recovery in the
following decade, firms found it difficult to issue new shares. Secondly, the electric power and
railway industries needed considerable long-term funding to develop significantly following the
War, much of the investment towards which was raised on bond markets by corporations in
those industries. Moreover, while the Commercial Code allowed companies to issue bonds up
to the amount of their paid-up capital, a 1927 revision of the Electric Power Companies Law
permitted companies in the electric power industry to issue bonds up to twice their paid-up
capital. The amount of corporate bonds issued between 1925 and 1935 was thus almost as
large as that of national bonds, and twice as large as that of either local bonds or bank
debentures. However, due to increasing hostilities with China in 1936, the trend of corporate
bonds was reversed, and a surge in national bond issues saw the amount of national bonds
become several times larger than the amounts of each of the other three kinds of bonds.5
Most banks held only a small amount of stock and, regarding stocks as risky, rarely
underwrote them. Instead of purchasing stocks, financial institutions such as banks, trust
companies, and insurance companies purchased more than half of the bonds issued in the
inter-war period. As a result of bond purchases, the securities held by ordinary banks
increased from 15 per cent of their total assets in 1925 to 27 per cent in 1936. Many banks
accumulated huge amounts of bad debt, but the more successful institutions survived the
crisis by investing in bonds.6 The trend of heavy investment in bonds is a trait common to all
inter-war banking, although the same motives may be not be shared by each operator. For
example, in the United Kingdom, when faced with declining demand for advances after 1932,
the banks increased their bond holdings (especially government bonds).7 The same
investment could also be seen in the United States, where banks faced massive bank runs;
they sought to increase their investments in both cash reserves and government bonds.8
As large amounts of bonds were issued, bond transactions in secondary markets naturally
increased. National bonds had been listed on the Tokyo Stock Exchange (TSE) since its
establishment in 1878, but the transaction volume had been minor except between 1878 and
1884. In order to promote bond transactions, in 1920 the government separated national bond
brokers from the general brokers who mainly engaged in stock futures transactions, resulting
in bond trading increasing on the TSE. Margin buying and selling of national bonds began on
the TSE in 1925. Local bonds, bank debentures, and corporate bonds were listed only on the
cash market, and the amounts involved in their transactions were much smaller than those for
national bonds. In the 1930s transactions in the four kinds of bonds, especially those of
national bonds, increased rapidly on the TSE. The amount of bonds traded over the counter
by securities firms is assumed to have been several times greater than that of bonds traded
on the TSE, even in the 1930s, although the amount of over-the-counter transactions is
unclear.9

This paper aims to shed light on banks’ bond holding and trading in inter-war Japan. In the
section that follows, I analyse why banks, which were principal investors in bonds, bought
bonds instead of making loans. I then examine how banks dealt in bonds, and primarily
whether or not they tended to buy and hold newly issued bonds until their redemption dates. If
they did buy new issues and hold them until redemption, we must conclude that secondary
markets for bonds were thin and bonds were highly illiquid assets for banks. If, on the other
hand, banks did not usually buy newly issued bonds and hold them until their redemption, it
means that secondary markets were thick, bonds liquid, and that banks adapted their
portfolios to financial market conditions for higher yields or lower risk. I then go on to examine
whether there was a change in banks’ bond trading during the inter-war period, before
summarizing the above considerations and identifying the factors affecting banks’ bond
trading.
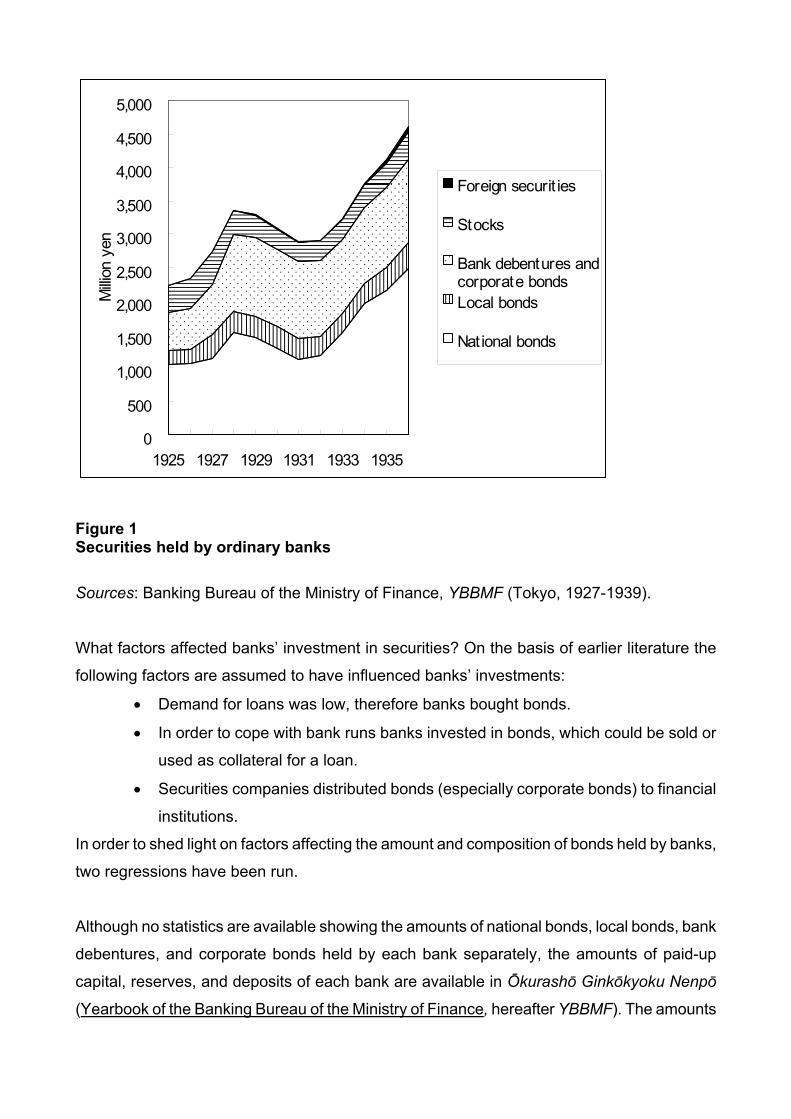
Banks’ Motives for Holding Bonds The amount of deposits in ordinary banks in Japan increased slightly after 1925 and peaked
at 9.3 billion yen in 1928. In 1931, during the Great Depression, this figure declined to 8.3
billion yen, after which it increased. The amount of loans by ordinary banks declined between
1926 and 1934 (from ¥9.2bn in 1926 to ¥6.3bn in 1934), but aside from a slight decrease
between 1929 and 1931 the amount of securities they held increased greatly in this period
(¥2.2bn in 1926 and ¥3.9bn in 1934). In 1925 one-half of securities held by ordinary banks
were national bonds, one-quarter were bank debentures and corporate bonds, one-fifth were
stocks, and one-tenth were local bonds (Figure 1). The amount of bank debentures and
corporate bonds owned by ordinary banks increased significantly between 1925 and 1928,
and that of national bonds decreased between 1929 and 1931. Therefore, the ratio of bank
debentures and corporate bonds to the total amount of securities increased until 1931. After
1932, however, the amount of national bonds increased rapidly. On the other hand the ratio of
local bonds was stable, while the ratio of stocks continued to decline during the same period.
0
500
1,000
1,500
2,000
2,500
3,000
3,500
4,000
4,500
5,000
1925 1927 1929 1931 1933 1935
Milli
on y
en
Foreign securit ies
Stocks
Bank debentures andcorporate bondsLocal bonds
National bonds
Figure 1 Securities held by ordinary banks
Sources: Banking Bureau of the Ministry of Finance, YBBMF (Tokyo, 1927-1939).
What factors affected banks’ investment in securities? On the basis of earlier literature the
following factors are assumed to have influenced banks’ investments:
• Demand for loans was low, therefore banks bought bonds.
• In order to cope with bank runs banks invested in bonds, which could be sold or
used as collateral for a loan.
• Securities companies distributed bonds (especially corporate bonds) to financial
institutions.
In order to shed light on factors affecting the amount and composition of bonds held by banks,
two regressions have been run.
Although no statistics are available showing the amounts of national bonds, local bonds, bank
debentures, and corporate bonds held by each bank separately, the amounts of paid-up
capital, reserves, and deposits of each bank are available in Ōkurashō Ginkōkyoku Nenpō
(Yearbook of the Banking Bureau of the Ministry of Finance, hereafter YBBMF). The amounts
of paid-up capital, reserves, and deposits of ordinary banks were summed up by prefecture.
Moreover, YBBMF also provides figures for the total amount of national bonds, total amount of
local bonds, and total amount of bank debentures and corporate bonds held by ordinary banks
in each prefecture,10 the average rate of six-month term deposits, and the average rate of
advances on promissory notes (the normal form of loan) in each prefecture. Regression
analyses are done on the basis of figures by prefecture for the years 1928, 1932, and 1936.11
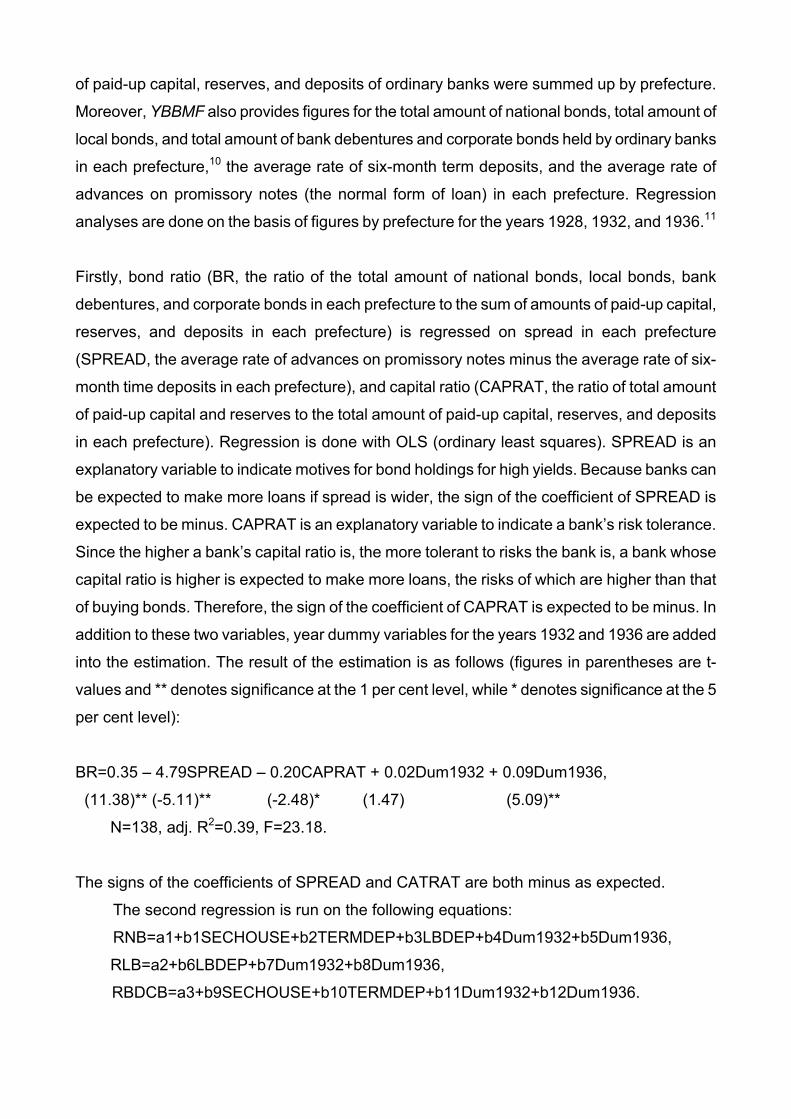
Firstly, bond ratio (BR, the ratio of the total amount of national bonds, local bonds, bank
debentures, and corporate bonds in each prefecture to the sum of amounts of paid-up capital,
reserves, and deposits in each prefecture) is regressed on spread in each prefecture
(SPREAD, the average rate of advances on promissory notes minus the average rate of six-
month time deposits in each prefecture), and capital ratio (CAPRAT, the ratio of total amount
of paid-up capital and reserves to the total amount of paid-up capital, reserves, and deposits
in each prefecture). Regression is done with OLS (ordinary least squares). SPREAD is an
explanatory variable to indicate motives for bond holdings for high yields. Because banks can
be expected to make more loans if spread is wider, the sign of the coefficient of SPREAD is
expected to be minus. CAPRAT is an explanatory variable to indicate a bank’s risk tolerance.
Since the higher a bank’s capital ratio is, the more tolerant to risks the bank is, a bank whose
capital ratio is higher is expected to make more loans, the risks of which are higher than that
of buying bonds. Therefore, the sign of the coefficient of CAPRAT is expected to be minus. In
addition to these two variables, year dummy variables for the years 1932 and 1936 are added
into the estimation. The result of the estimation is as follows (figures in parentheses are t-
values and ** denotes significance at the 1 per cent level, while * denotes significance at the 5
per cent level):
BR=0.35 – 4.79SPREAD – 0.20CAPRAT + 0.02Dum1932 + 0.09Dum1936,
(11.38)** (-5.11)** (-2.48)* (1.47) (5.09)**
N=138, adj. R2=0.39, F=23.18.
The signs of the coefficients of SPREAD and CATRAT are both minus as expected.
The second regression is run on the following equations:
RNB=a1+b1SECHOUSE+b2TERMDEP+b3LBDEP+b4Dum1932+b5Dum1936,
RLB=a2+b6LBDEP+b7Dum1932+b8Dum1936,
RBDCB=a3+b9SECHOUSE+b10TERMDEP+b11Dum1932+b12Dum1936.
RNB indicates the ratio of national bonds, RLB the ratio of local bonds, and RBDCB the ratio
of the sum of bank debentures and corporate bonds, respectively, in each prefecture to the
total amount of national bonds, local bonds, bank debentures, and corporate bonds in each
prefecture. SECHOUSE is a dummy variable, which equals 1 if one or more offices of the
three major securities firms (Nomura Securities Co., Yamaichi Securities Co., and Nikko
Securities Co.) existed in each prefecture, and otherwise equals 0. LBDEP indicates the ratio
of the outstanding amount of local bonds issued by a prefecture and cities and towns in the
prefecture and publicly subscribed or underwritten by nongovernmental institutions, to the
amount of deposits of ordinary banks in the prefecture. As large amounts of local bonds were
directly bought and held by the Deposit Bureau of the Ministry of Finance (DBMF), these
bonds are excluded from the outstanding amount. TERMDEP denotes the ratio of term
deposits to total deposits of ordinary banks in each prefecture. Year dummy variables of 1932
and 1936 are also added.
Because these equations are share equations (RNB+RLB+RBDCB=1), estimation is done
with SUR (seemingly unrelated regressions) and the sum of the coefficients of the same
variables equals zero. SECHOUSE indicates the effects of transaction costs on bank bond
holdings. For securities, which were more easily bought through institutions other than
securities houses, the coefficient of SECHOUSE is expected to be minus. LBDEP is added to
verify whether banks tended to hold bonds issued by local bodies where they were located,
and the sign of its coefficient is expected to be plus. TERMDEP is an explanatory variable that
indicates motives for holding bonds with an eye to deposit payments, and the sign of its
coefficient is expected to be minus if a category of bonds (for example, national bonds) is held
as reserves for payments of deposits.

Table 1 Factors affecting selection of bonds held by banks
RNB RLB RBDCB
Intercept 0.75 0.07 0.18
(11.09)** (6.27)** (2.69)**
SECHOUSE -0.07 0.07
(-2.30)* (2.29)*
TERMDEP -0.25 0.25
(-2.23)* (2.23)*
LBDEP -0.24 0.24
(-6.37)** (6.44)**
DUM1932 -0.06 -0.02 0.09
(-1.92) (-1.33) (2.74)**
DUM1936 0.08 -0.02 -0.06
(2.33)* (-1.35) (-1.83)
Adj. R2 0.15 0.22 0.15
Note: Figures in parentheses are t-values; ** denotes significance at 1 per cent level, * at 5
per cent level.
Sources: Banking Bureau of the Ministry of Finance, YBBMF (Tokyo, 1929, 1933, and 1937).
The result of the second estimation is shown in Table 1. The coefficient of SECHOUSE is
significant and positive for RBDCB and negative for RNB. This result implies that bank
purchasing of bank debentures and corporate bonds was heavily dependent on the activities
of securities companies, while banks were able to purchase national bonds more easily
through various intermediate institutions. The coefficient of TERMDEP is significant and
negative for RNB and positive for RDBCB. This result implies that national bonds were held by
banks as means of reserves for outstanding claims and that bank debentures and corporate
bonds were better loan substitutes for banks than national bonds. The coefficient of LBDEP is
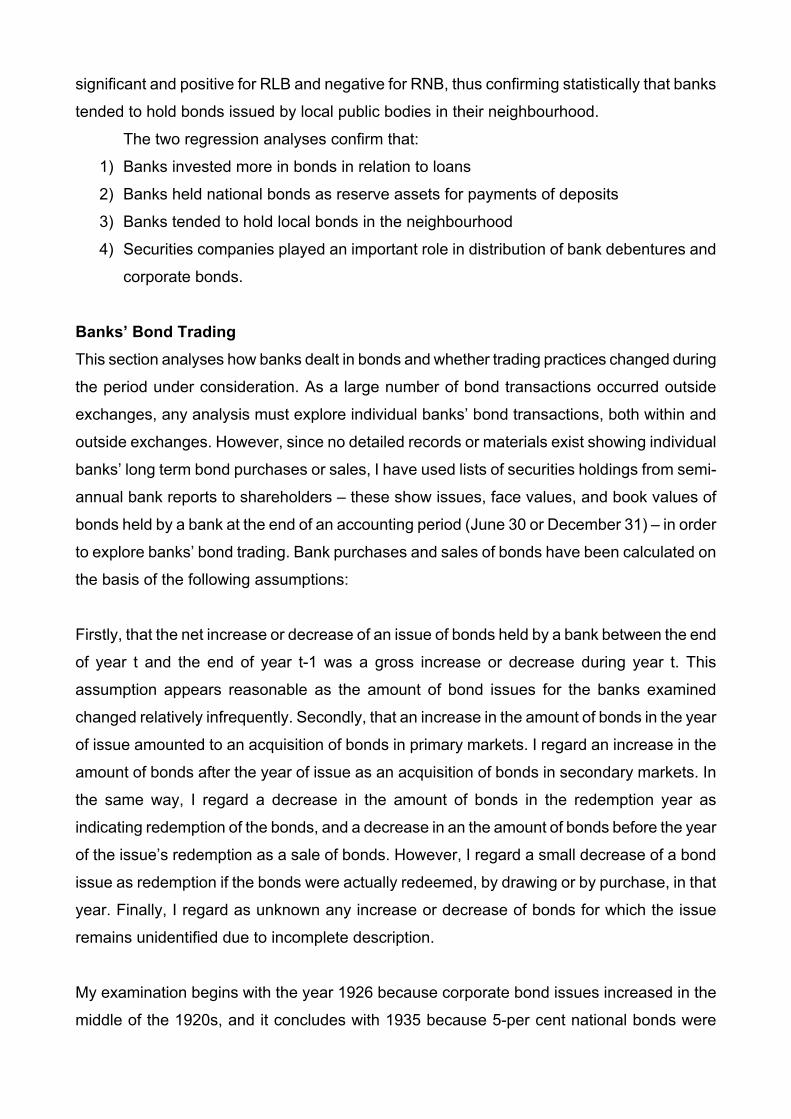
significant and positive for RLB and negative for RNB, thus confirming statistically that banks
tended to hold bonds issued by local public bodies in their neighbourhood.
The two regression analyses confirm that:
1) Banks invested more in bonds in relation to loans
2) Banks held national bonds as reserve assets for payments of deposits
3) Banks tended to hold local bonds in the neighbourhood
4) Securities companies played an important role in distribution of bank debentures and
corporate bonds.
Banks’ Bond Trading This section analyses how banks dealt in bonds and whether trading practices changed during
the period under consideration. As a large number of bond transactions occurred outside
exchanges, any analysis must explore individual banks’ bond transactions, both within and
outside exchanges. However, since no detailed records or materials exist showing individual
banks’ long term bond purchases or sales, I have used lists of securities holdings from semi-
annual bank reports to shareholders – these show issues, face values, and book values of
bonds held by a bank at the end of an accounting period (June 30 or December 31) – in order
to explore banks’ bond trading. Bank purchases and sales of bonds have been calculated on
the basis of the following assumptions:
Firstly, that the net increase or decrease of an issue of bonds held by a bank between the end
of year t and the end of year t-1 was a gross increase or decrease during year t. This
assumption appears reasonable as the amount of bond issues for the banks examined
changed relatively infrequently. Secondly, that an increase in the amount of bonds in the year
of issue amounted to an acquisition of bonds in primary markets. I regard an increase in the
amount of bonds after the year of issue as an acquisition of bonds in secondary markets. In
the same way, I regard a decrease in the amount of bonds in the redemption year as
indicating redemption of the bonds, and a decrease in an the amount of bonds before the year
of the issue’s redemption as a sale of bonds. However, I regard a small decrease of a bond
issue as redemption if the bonds were actually redeemed, by drawing or by purchase, in that
year. Finally, I regard as unknown any increase or decrease of bonds for which the issue
remains unidentified due to incomplete description.
My examination begins with the year 1926 because corporate bond issues increased in the
middle of the 1920s, and it concludes with 1935 because 5-per cent national bonds were
rolled over into 3.5-per cent bonds in 1936, causing a significant rise in redemptions of
national bonds. In addition, financial market controls commenced in 1937 as a result of
hostilities with China. The focus is on bond trading at four banks (Mitsubishi Bank, Aichi Bank,
Hyakujū Bank, Akita Bank) during this period for three reasons. Firstly, listings of the
securities of these four banks are available; this is unusual, because ordinary banks were not
required to list securities in their semi-annual reports. Secondly, these banks held large
numbers of bonds. I assume that banks holding large numbers of bonds also held numerous
bond issues. These banks, accordingly, are adequate for this analysis, as I would expect
increases and decreases in bonds to be recorded for multiple years. Thirdly, the number of
mergers and acquisitions carried out by these banks is small. If a bank merged with (or
acquired the operations of) another bank, we would be unable to identify the increase of an
issue of bonds in the merger year as an increase by purchase in (primary or secondary)
markets because the merger itself may have caused the increase. I regard such an increase
as ‘unknown’, except for issues of bonds in the year of the merger (which I regard as obtained
in primary markets). Consequently, banks that conducted few mergers and acquisitions are
preferred for the purpose of this study. The selected four banks meet the latter two conditions,
as shown in Table 2. Aichi Bank was located in central Japan, Hyakujū Bank in western
Japan, and Akita Bank in northern Japan; thus these banks, often called regional banks,
represent a geographical spread of Japanese banks.
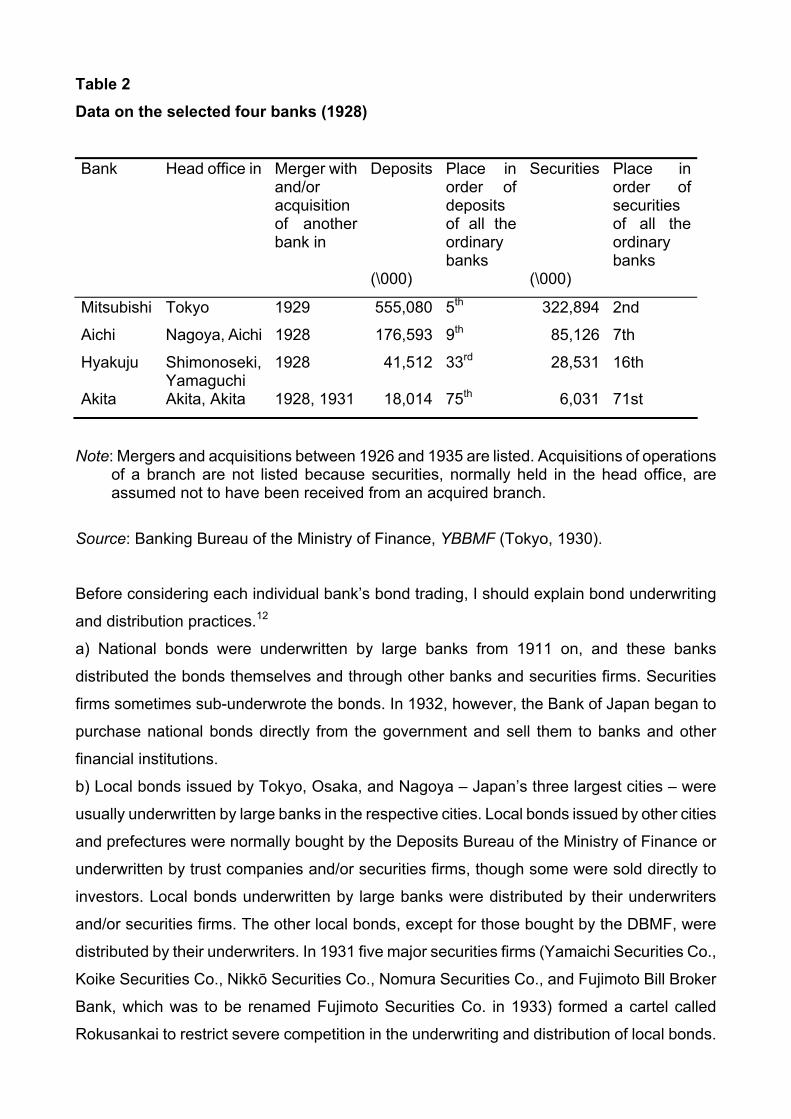
Table 2 Data on the selected four banks (1928)
Bank
Head office in Deposits Securities
Merger with and/or acquisition of another bank in
Place in order of deposits of all the ordinary banks
Place in order of securities of all the ordinary banks
(\000) (\000)
Mitsubishi Tokyo 1929 555,080 5th 322,894 2nd
Aichi Nagoya, Aichi 1928 176,593 9th 85,126 7th
Hyakuju Shimonoseki, Yamaguchi
1928 41,512 33rd 28,531 16th
Akita Akita, Akita 1928, 1931 18,014 75th 6,031 71st
Note: Mergers and acquisitions between 1926 and 1935 are listed. Acquisitions of operations of a branch are not listed because securities, normally held in the head office, are assumed not to have been received from an acquired branch.
Source: Banking Bureau of the Ministry of Finance, YBBMF (Tokyo, 1930).
Before considering each individual bank’s bond trading, I should explain bond underwriting
and distribution practices.12
a) National bonds were underwritten by large banks from 1911 on, and these banks
distributed the bonds themselves and through other banks and securities firms. Securities
firms sometimes sub-underwrote the bonds. In 1932, however, the Bank of Japan began to
purchase national bonds directly from the government and sell them to banks and other
financial institutions.
b) Local bonds issued by Tokyo, Osaka, and Nagoya – Japan’s three largest cities – were
usually underwritten by large banks in the respective cities. Local bonds issued by other cities
and prefectures were normally bought by the Deposits Bureau of the Ministry of Finance or
underwritten by trust companies and/or securities firms, though some were sold directly to
investors. Local bonds underwritten by large banks were distributed by their underwriters
and/or securities firms. The other local bonds, except for those bought by the DBMF, were
distributed by their underwriters. In 1931 five major securities firms (Yamaichi Securities Co.,
Koike Securities Co., Nikkō Securities Co., Nomura Securities Co., and Fujimoto Bill Broker
Bank, which was to be renamed Fujimoto Securities Co. in 1933) formed a cartel called
Rokusankai to restrict severe competition in the underwriting and distribution of local bonds.
c) Bank debentures were issued by special banks that were allowed to issue bonds by their
acts. Bank debentures were directly sold to investors or underwritten and distributed by trust
companies and/or securities firms.
d) First-class corporate bonds were underwritten by large banks and large trust companies,
which distributed them themselves and/or through securities firms. Second-class corporate
bonds were underwritten and distributed by securities firms, with some also being sold directly
to investors.13 In the 1920s large banks often were the sole underwriters of corporate bonds.
In 1933 large banks, trust companies, and insurance companies in Tokyo reached an
agreement on bond issuance. They declared that they would give preference to, and
exclusively underwrite, secured bonds issued by firms that had established sinking funds.
After this agreement, large banks and trust companies typically formed a syndicate to
underwrite each separate issuance of corporate bonds, while the five large securities firms,
which had formed a cartel for local bonds, now jointly sub-underwrote corporate bonds. Banks
and other financial institutions participated in the issuance of bonds and worked more co-
operatively after the Great Depression than in the 1920s. Mitsubishi Bank underwrote the third
largest amount of corporate bonds (\786m) between 1920 and 1939, with the Industrial Bank
of Japan first (\1,469m) and Mitsui Bank second (\1,285m).14 On the other hand, the three
regional banks underwrote few bonds: the amount of corporate bonds underwritten by Aichi
Bank in the same period was ¥77m, Hyakujū Bank’s was ¥2m, and Akita Bank’s was ¥1m.
Consequently, Mitsubishi Bank’s role as an underwriter will be considered as well as its role
as an investor.
Let us begin with Mitsubishi Bank. In 1929 it acquired the business of Morimura Bank, which
had deposits and securities at the time of purchase worth ¥29m and ¥9m in cash respectively,
and it opened four offices in Tokyo.15 Its deposits had increased rapidly in 1927 as money
withdrawn from medium- or small-sized banks during the Showa Financial Crisis flowed into
the Bank.16 Loans, however, did not increase as much as deposits. On the other hand, the
amount of securities increased faster than that of loans and exceeded the latter in 1927.
Figure 2 shows the amount of securities held by the Bank; the ratio of bank debentures and
corporate bonds to total securities holdings was high, as compared with the average
composition of securities held by ordinary banks shown in Figure 1, while the same ratio for
national bonds was low except for 1936.

0
50
100
150
200
250
300
350
400
450
1925 1927 1929 1931 1933 1935
Milli
on y
en
Stocks
Bank debentures andcorporate bondsLocal Bonds
National bonds
Figure 2 Securities held by Mitsubishi Bank
Sources: Mitsubishi Bank, Semi-annual Reports (Tokyo, 1925-1936).
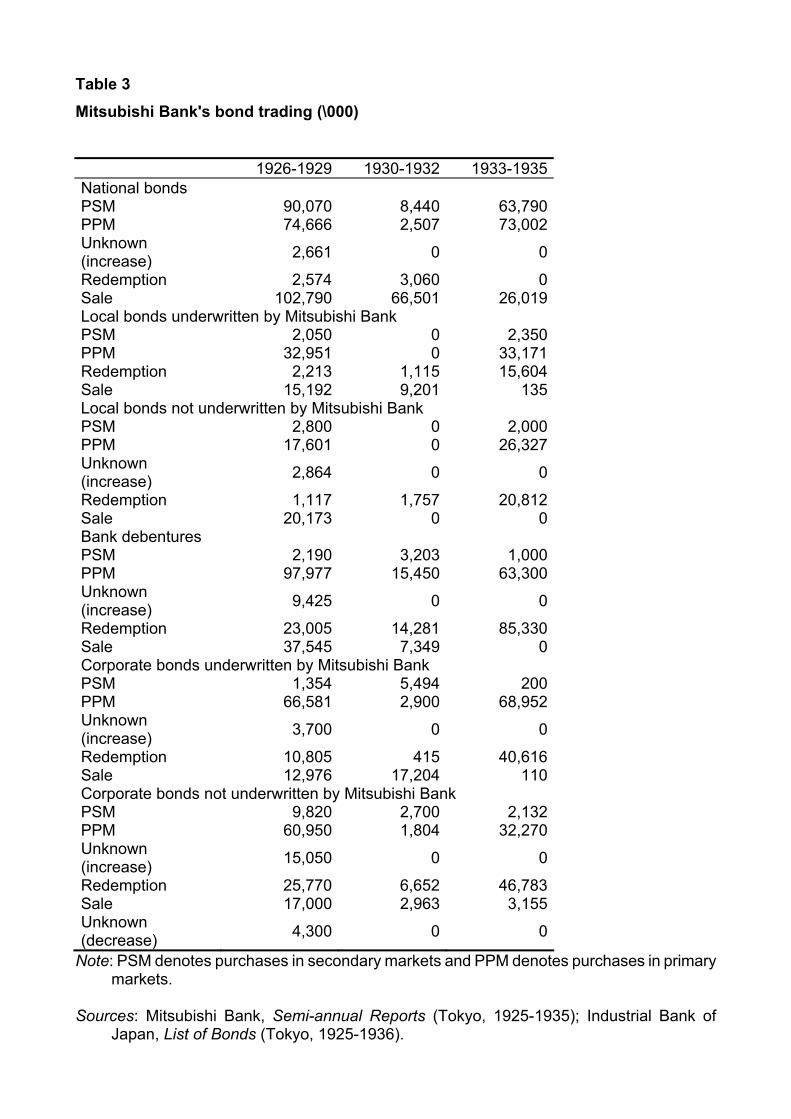
Table 3 Mitsubishi Bank's bond trading (\000)
1926-1929 1930-1932 1933-1935National bonds PSM 90,070 8,440 63,790 PPM 74,666 2,507 73,002 Unknown (increase) 2,661 0 0
Redemption 2,574 3,060 0 Sale 102,790 66,501 26,019 Local bonds underwritten by Mitsubishi Bank PSM 2,050 0 2,350 PPM 32,951 0 33,171 Redemption 2,213 1,115 15,604 Sale 15,192 9,201 135 Local bonds not underwritten by Mitsubishi Bank PSM 2,800 0 2,000 PPM 17,601 0 26,327 Unknown (increase) 2,864 0 0
Redemption 1,117 1,757 20,812 Sale 20,173 0 0 Bank debentures PSM 2,190 3,203 1,000 PPM 97,977 15,450 63,300 Unknown (increase) 9,425 0 0
Redemption 23,005 14,281 85,330 Sale 37,545 7,349 0 Corporate bonds underwritten by Mitsubishi Bank PSM 1,354 5,494 200 PPM 66,581 2,900 68,952 Unknown (increase) 3,700 0 0
Redemption 10,805 415 40,616 Sale 12,976 17,204 110 Corporate bonds not underwritten by Mitsubishi Bank PSM 9,820 2,700 2,132 PPM 60,950 1,804 32,270 Unknown (increase) 15,050 0 0
Redemption 25,770 6,652 46,783 Sale 17,000 2,963 3,155 Unknown (decrease) 4,300 0 0
Note: PSM denotes purchases in secondary markets and PPM denotes purchases in primary markets.
Sources: Mitsubishi Bank, Semi-annual Reports (Tokyo, 1925-1935); Industrial Bank of
Japan, List of Bonds (Tokyo, 1925-1936).
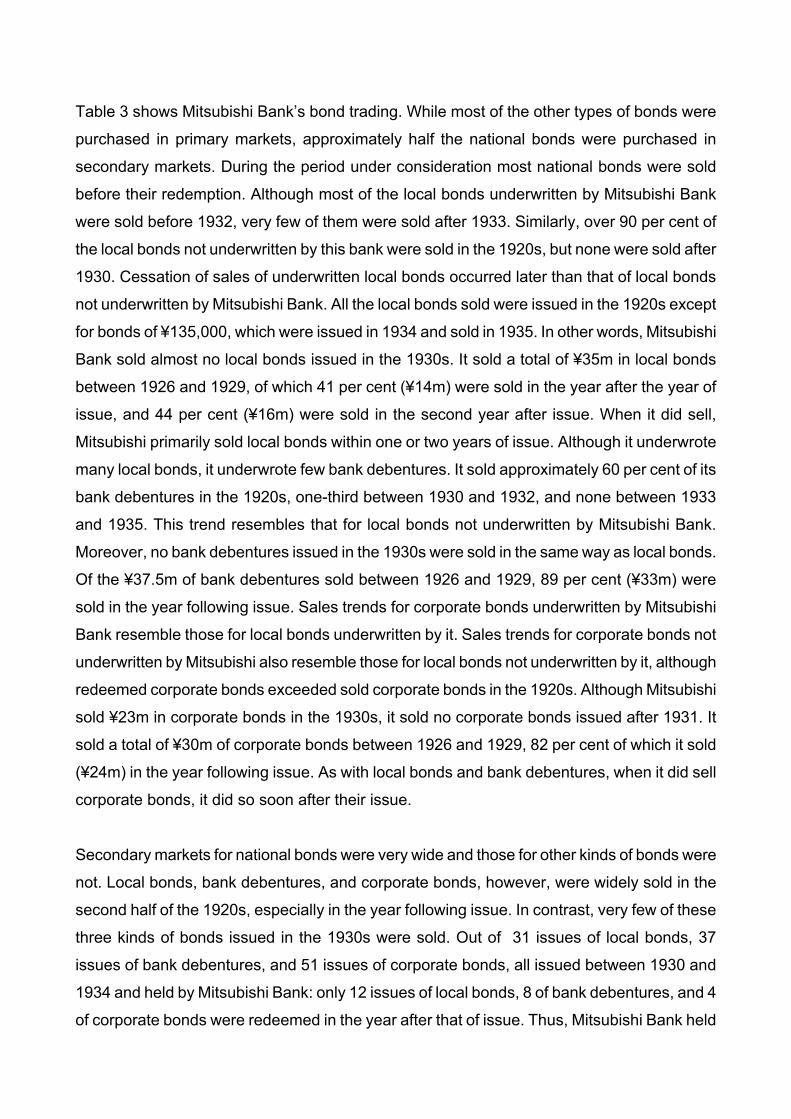
Table 3 shows Mitsubishi Bank’s bond trading. While most of the other types of bonds were
purchased in primary markets, approximately half the national bonds were purchased in
secondary markets. During the period under consideration most national bonds were sold
before their redemption. Although most of the local bonds underwritten by Mitsubishi Bank
were sold before 1932, very few of them were sold after 1933. Similarly, over 90 per cent of
the local bonds not underwritten by this bank were sold in the 1920s, but none were sold after
1930. Cessation of sales of underwritten local bonds occurred later than that of local bonds
not underwritten by Mitsubishi Bank. All the local bonds sold were issued in the 1920s except
for bonds of ¥135,000, which were issued in 1934 and sold in 1935. In other words, Mitsubishi
Bank sold almost no local bonds issued in the 1930s. It sold a total of ¥35m in local bonds
between 1926 and 1929, of which 41 per cent (¥14m) were sold in the year after the year of
issue, and 44 per cent (¥16m) were sold in the second year after issue. When it did sell,
Mitsubishi primarily sold local bonds within one or two years of issue. Although it underwrote
many local bonds, it underwrote few bank debentures. It sold approximately 60 per cent of its
bank debentures in the 1920s, one-third between 1930 and 1932, and none between 1933
and 1935. This trend resembles that for local bonds not underwritten by Mitsubishi Bank.
Moreover, no bank debentures issued in the 1930s were sold in the same way as local bonds.
Of the ¥37.5m of bank debentures sold between 1926 and 1929, 89 per cent (¥33m) were
sold in the year following issue. Sales trends for corporate bonds underwritten by Mitsubishi
Bank resemble those for local bonds underwritten by it. Sales trends for corporate bonds not
underwritten by Mitsubishi also resemble those for local bonds not underwritten by it, although
redeemed corporate bonds exceeded sold corporate bonds in the 1920s. Although Mitsubishi
sold ¥23m in corporate bonds in the 1930s, it sold no corporate bonds issued after 1931. It
sold a total of ¥30m of corporate bonds between 1926 and 1929, 82 per cent of which it sold
(¥24m) in the year following issue. As with local bonds and bank debentures, when it did sell
corporate bonds, it did so soon after their issue.
Secondary markets for national bonds were very wide and those for other kinds of bonds were
not. Local bonds, bank debentures, and corporate bonds, however, were widely sold in the
second half of the 1920s, especially in the year following issue. In contrast, very few of these
three kinds of bonds issued in the 1930s were sold. Out of 31 issues of local bonds, 37
issues of bank debentures, and 51 issues of corporate bonds, all issued between 1930 and
1934 and held by Mitsubishi Bank: only 12 issues of local bonds, 8 of bank debentures, and 4
of corporate bonds were redeemed in the year after that of issue. Thus, Mitsubishi Bank held

numerous bond issues between 1933 and 1935 that it could have sold, but did not. The facts
examined here suggest that market conditions for these three kinds of bonds changed
significantly after the Great Depression.
Next let us examine Aichi Bank, most of whose offices were in Aichi Prefecture. In 1928 it
acquired the operations of Fukada Bank in Tokyo, which held deposits and securities worth
¥2m and ¥1m in cash, respectively, and opened two branches in Tokyo.17 Although they not
increasing as rapidly in 1927 as those of Mitsubishi Bank, Aichi Bank’s deposits increased
steadily until June 1929. The amount of securities it held increased with the increase in
deposits, while the amount of loans peaked in June 1926. During the Great Depression
deposits decreased, and in the first half of 1932 they declined sharply with a run on banks in
and around Nagoya (the amount of deposits peaked at ¥180m in June 1929 and bottomed at
¥114m in June 1932). After this bank run, Aichi Bank’s deposits increased steadily once again
and surpassed the 1929 peak in the first half of 1938. The amount of loans continued to
decline after the bank run and began to increase in the second half of 1935. Compared with
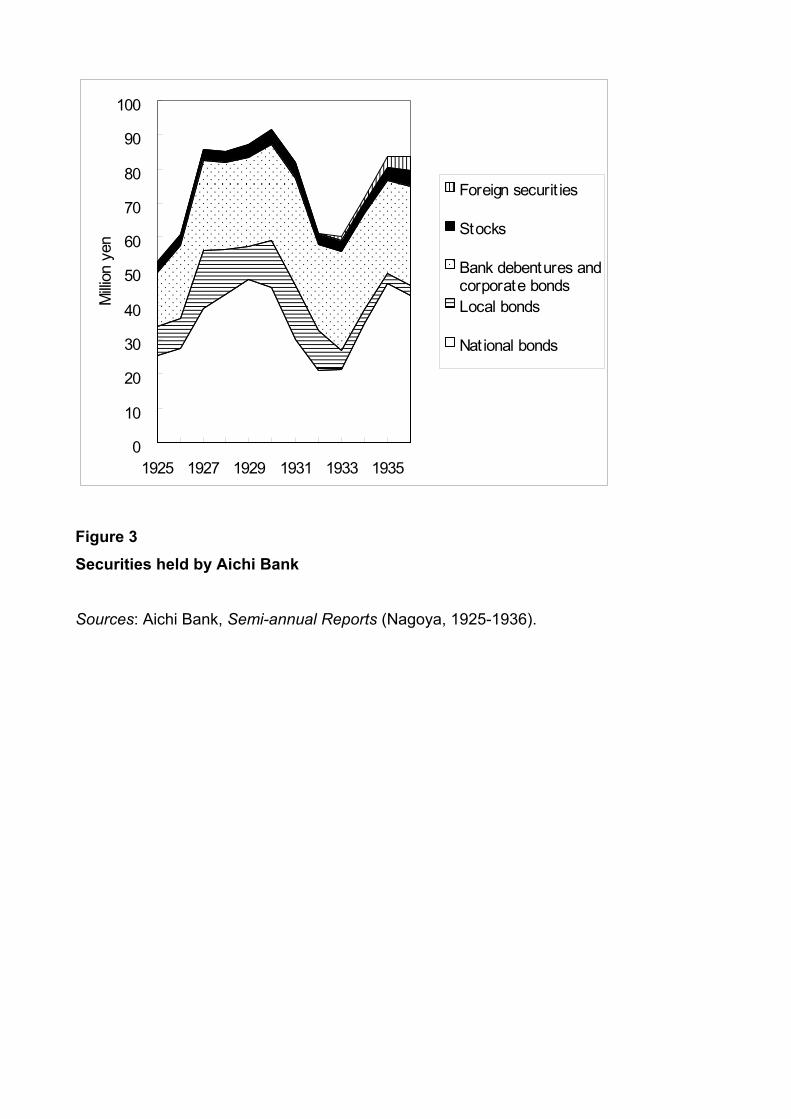
the average composition of securities of ordinary banks, Aichi Bank held few stocks but many
local bonds, bank debentures, and corporate bonds in 1925 (Figure 3). Because the amount
of national bonds increased significantly in 1927 and 1928, the ratio of national bonds to the
total amount of securities increased as well. During the Great Depression and the bank run,
the bank’s holdings of national bonds and local bonds decreased. When deposits increased
after 1933, only the amount of national bonds increased, while that of local bonds remained
small. The amount of bank debentures and corporate bonds increased between 1925 and
1927 and then levelled off.
0
10
20
30
40
50
60
70
80
90
100
1925 1927 1929 1931 1933 1935
Milli
on y
en
Foreign securit ies
Stocks
Bank debentures andcorporate bondsLocal bonds
National bonds
Figure 3 Securities held by Aichi Bank
Sources: Aichi Bank, Semi-annual Reports (Nagoya, 1925-1936).
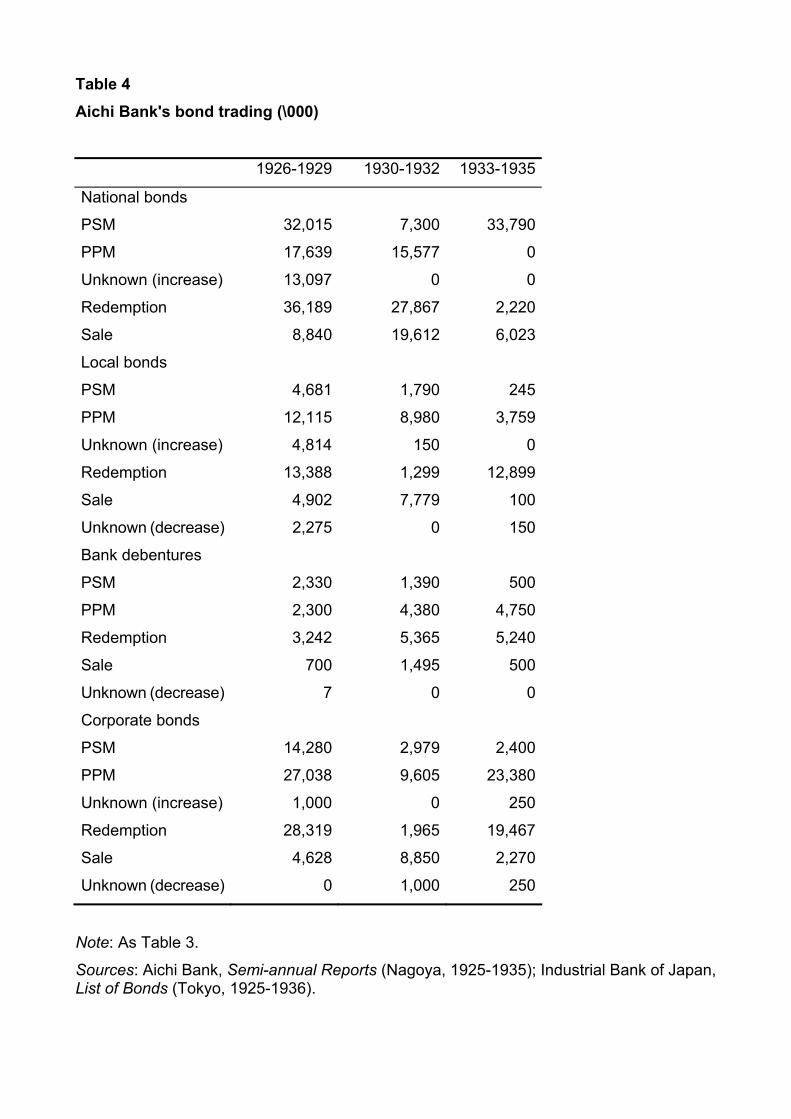
Table 4 Aichi Bank's bond trading (\000)
1926-1929 1930-1932 1933-1935
National bonds
PSM 32,015 7,300 33,790
PPM 17,639 15,577 0
Unknown (increase) 13,097 0 0
Redemption 36,189 27,867 2,220
Sale 8,840 19,612 6,023
Local bonds
PSM 4,681 1,790 245
PPM 12,115 8,980 3,759
Unknown (increase) 4,814 150 0
Redemption 13,388 1,299 12,899
Sale 4,902 7,779 100
Unknown (decrease) 2,275 0 150
Bank debentures
PSM 2,330 1,390 500
PPM 2,300 4,380 4,750
Redemption 3,242 5,365 5,240
Sale 700 1,495 500
Unknown (decrease) 7 0 0
Corporate bonds
PSM 14,280 2,979 2,400
PPM 27,038 9,605 23,380
Unknown (increase) 1,000 0 250
Redemption 28,319 1,965 19,467
Sale 4,628 8,850 2,270
Unknown (decrease) 0 1,000 250
Note: As Table 3.
Sources: Aichi Bank, Semi-annual Reports (Nagoya, 1925-1935); Industrial Bank of Japan, List of Bonds (Tokyo, 1925-1936).
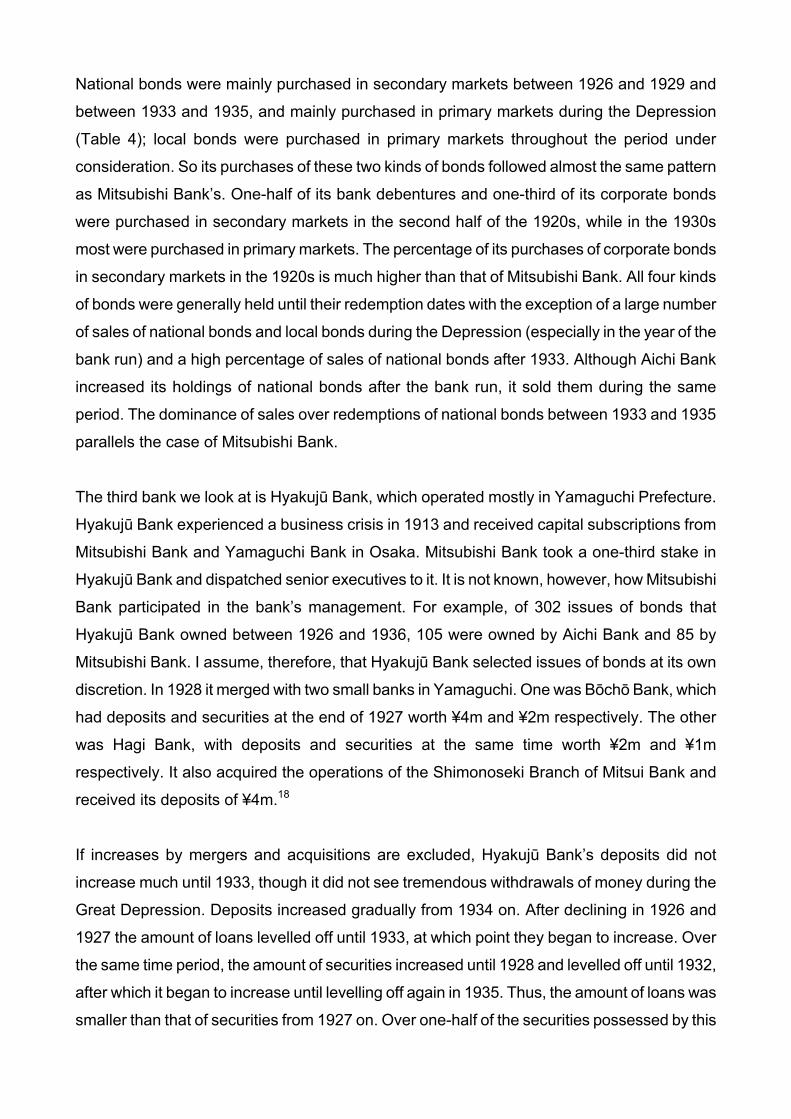
National bonds were mainly purchased in secondary markets between 1926 and 1929 and
between 1933 and 1935, and mainly purchased in primary markets during the Depression
(Table 4); local bonds were purchased in primary markets throughout the period under
consideration. So its purchases of these two kinds of bonds followed almost the same pattern
as Mitsubishi Bank’s. One-half of its bank debentures and one-third of its corporate bonds
were purchased in secondary markets in the second half of the 1920s, while in the 1930s
most were purchased in primary markets. The percentage of its purchases of corporate bonds
in secondary markets in the 1920s is much higher than that of Mitsubishi Bank. All four kinds
of bonds were generally held until their redemption dates with the exception of a large number
of sales of national bonds and local bonds during the Depression (especially in the year of the
bank run) and a high percentage of sales of national bonds after 1933. Although Aichi Bank
increased its holdings of national bonds after the bank run, it sold them during the same
period. The dominance of sales over redemptions of national bonds between 1933 and 1935
parallels the case of Mitsubishi Bank.
The third bank we look at is Hyakujū Bank, which operated mostly in Yamaguchi Prefecture.
Hyakujū Bank experienced a business crisis in 1913 and received capital subscriptions from
Mitsubishi Bank and Yamaguchi Bank in Osaka. Mitsubishi Bank took a one-third stake in
Hyakujū Bank and dispatched senior executives to it. It is not known, however, how Mitsubishi
Bank participated in the bank’s management. For example, of 302 issues of bonds that
Hyakujū Bank owned between 1926 and 1936, 105 were owned by Aichi Bank and 85 by
Mitsubishi Bank. I assume, therefore, that Hyakujū Bank selected issues of bonds at its own
discretion. In 1928 it merged with two small banks in Yamaguchi. One was Bōchō Bank, which
had deposits and securities at the end of 1927 worth ¥4m and ¥2m respectively. The other
was Hagi Bank, with deposits and securities at the same time worth ¥2m and ¥1m
respectively. It also acquired the operations of the Shimonoseki Branch of Mitsui Bank and
received its deposits of ¥4m.18
If increases by mergers and acquisitions are excluded, Hyakujū Bank’s deposits did not
increase much until 1933, though it did not see tremendous withdrawals of money during the
Great Depression. Deposits increased gradually from 1934 on. After declining in 1926 and
1927 the amount of loans levelled off until 1933, at which point they began to increase. Over
the same time period, the amount of securities increased until 1928 and levelled off until 1932,
after which it began to increase until levelling off again in 1935. Thus, the amount of loans was
smaller than that of securities from 1927 on. Over one-half of the securities possessed by this

bank were bank debentures and corporate bonds, and the ratio of national bonds to the total
amount of securities was less than one-fourth (Figure 4). This composition is very different
from the average composition of ordinary banks. In some of Hyakujū Bank’s semi-annual
reports in the second half of the 1920s, management states that the bank could not find
customers to lend money to and had no other option than to purchase bonds. These
statements support the findings of our first section.
0
5
10
15
20
25
30
35
40
45
1925 1927 1929 1931 1933 1935
Milli
on y
en
Stocks
Bank debentures andcorporate bondsLocal bonds
National bonds
Figure 4 Securities held by Hyakuju Bank
Sources: Hyakuju Bank, Semi-annual Reports (Shimonoseki, 1925-1936).
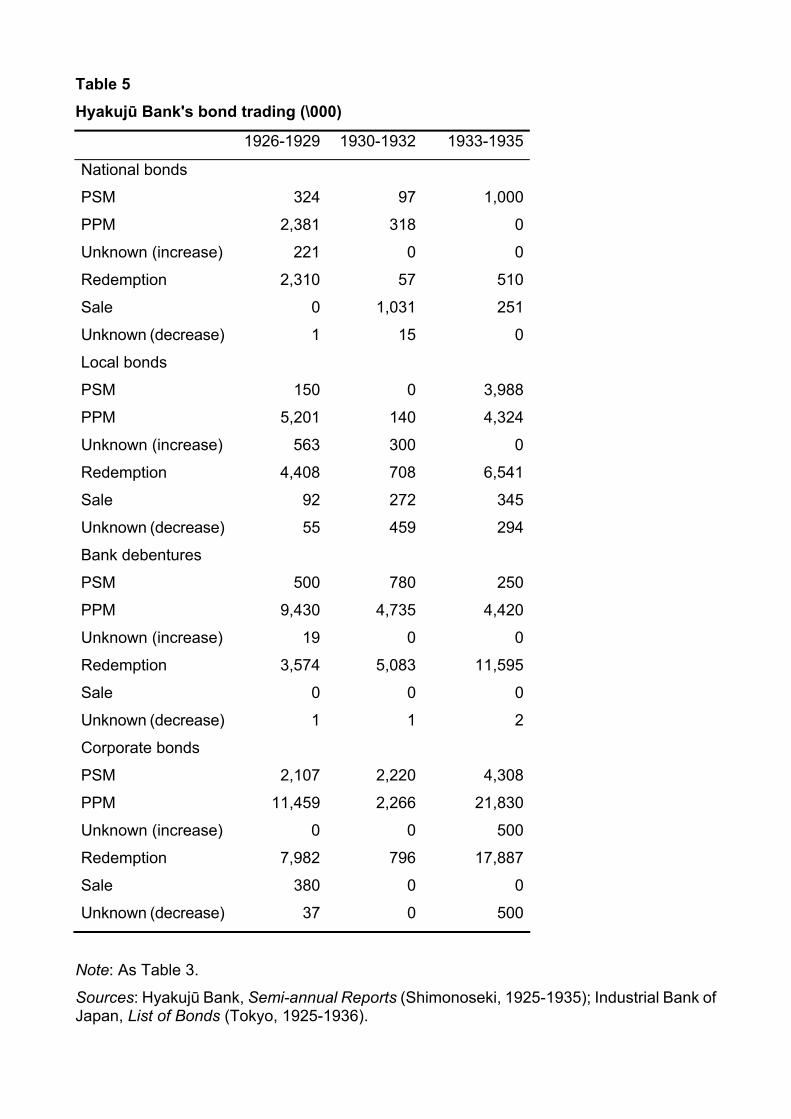
Table 5 Hyakujū Bank's bond trading (\000)
1926-1929 1930-1932 1933-1935
National bonds
PSM 324 97 1,000
PPM 2,381 318 0
Unknown (increase) 221 0 0
Redemption 2,310 57 510
Sale 0 1,031 251
Unknown (decrease) 1 15 0
Local bonds
PSM 150 0 3,988
PPM 5,201 140 4,324
Unknown (increase) 563 300 0
Redemption 4,408 708 6,541
Sale 92 272 345
Unknown (decrease) 55 459 294
Bank debentures
PSM 500 780 250
PPM 9,430 4,735 4,420
Unknown (increase) 19 0 0
Redemption 3,574 5,083 11,595
Sale 0 0 0
Unknown (decrease) 1 1 2
Corporate bonds
PSM 2,107 2,220 4,308
PPM 11,459 2,266 21,830
Unknown (increase) 0 0 500
Redemption 7,982 796 17,887
Sale 380 0 0
Unknown (decrease) 37 0 500
Note: As Table 3.
Sources: Hyakujū Bank, Semi-annual Reports (Shimonoseki, 1925-1935); Industrial Bank of Japan, List of Bonds (Tokyo, 1925-1936).

Hyakujū Bank’s bond trading was different from Aichi Bank’s in two respects (Table 5). Firstly,
it sold only \251,000 worth of national bonds between 1933 and 1935, whereas Aichi Bank
sold a large amount of national bonds. Secondly, it acquired local bonds, bank debentures,
and corporate bonds mainly in primary markets even in the 1920s, whereas Aichi Bank
purchased in both primary and secondary markets. Having said that, there are similarities
between the operations of the two banks: they both bought national bonds in secondary
markets between 1933 and 1935, and then held bonds other than national bonds until
redemption. They invested in newly issued bonds and continued to own them until their
redemption dates, except for a high ratio of national bond sales between 1930 and 1932.
Lastly, we look at Akita Bank, most of whose offices were in Akita Prefecture. In 1928 it
merged with Senhoku Bank, which had deposits and securities at the end of 1927 worth ¥2m
and ¥0.2m respectively, and acquired the operations of Ikeda Bank, with deposits and
securities at the same time of only ¥0.3m and ¥0.02m respectively. In 1931 it acquired the
deposits and loans of Noshiro Bank, with deposits at the end of 1930 worth ¥1m.19 After the
merger and acquisition in 1928 the amount of this bank’s deposits increased quickly. In 1931
many banks in Akita Prefecture saw mass bank withdrawals, but the run did not spread to
Akita Bank. Its deposits stagnated during the Great Depression, but increased steadily from
1932. During the period from 1929 to 1934 the amount of loans declined, levelled off in
1935,20 and began to increase in 1936. In contrast, a reduction in 1932 aside, the amount of
securities increased until 1935. As a result, the amount of securities exceeded that of loans in
1933. Akita Bank stated in several of its semi-annual reports that it had surplus funds and
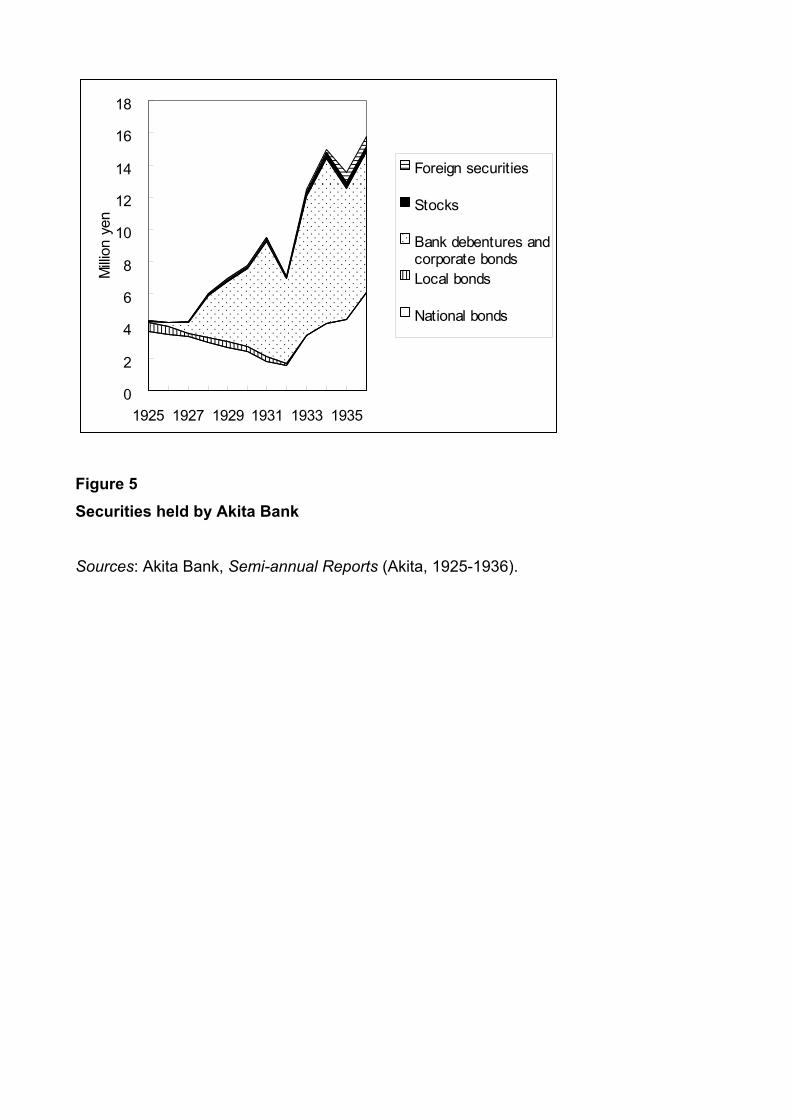
invested them in bonds. In 1925 more than 80 per cent of securities possessed by this bank
were national bonds (Figure 5), but this number continued to decline as the amount of bank
debentures and corporate bonds increased, so that by 1932 three quarters of the securities it
held were bank debentures and corporate bonds—a composition similar to that of Hyakuju
Bank. After 1933 the ratio of national bonds increased and reached 38 per cent in 1936, which
is lower than the average ratio of ordinary banks. Akita Bank possessed few local bonds and
stocks.
0
2
4
6
8
10
12
14
16
18
1925 1927 1929 1931 1933 1935
Milli
on y
en
Foreign securities
Stocks
Bank debentures andcorporate bondsLocal bonds
National bonds
Figure 5 Securities held by Akita Bank
Sources: Akita Bank, Semi-annual Reports (Akita, 1925-1936).

Table 6 Akita Bank’s bond trading (\000)
1926-29 1930-32 1933-35
National bonds
PSM 544 15 500
PPM 1,135 32 3,000
Unknown (increase) 176 0 0
Redemption 1,296 109 85
Sale 1,545 1,179 451
Local bonds
PSM 0 0 0
PPM 180 0 5
Unknown (increase) 77 0 0
Redemption 445 141 66
Sale 40 75 0
Unknown (decrease) 0 0 77
Bank debentures
PSM 700 0 0
PPM 480 260 550
Unknown (increase) 17 0 0
Redemption 90 77 1,377
Sale 0 0 0
Corporate bonds
PSM 610 2,435 2,950
PPM 1,115 542 9,775
Unknown (increase) 1,400 0 0
Redemption 242 1,517 9,070
Sale 280 0 0
Note: As Table 3.
Sources: Akita Bank, Semi-annual Reports (Akita, 1925-1935); Industrial Bank of Japan, List of Bonds (Tokyo, 1925-1936).
Like Hyakujū Bank, Akita Bank bought national bonds through the primary market in the
1920s and also bought few national bonds during the Great Depression (Table 6). Although
Aichi Bank and Hyakujū Bank bought them through secondary markets after 1933, Akita Bank
continued to buy them through primary markets. It bought bank debentures and corporate
bonds through secondary markets as well as primary markets in the 1920s, and its ratio of
such purchases in secondary markets, like Aichi Bank’s, declined from 1933, whereas
Hyakujū Bank’s increased slightly. The ratio of sold national bonds to redeemed national
bonds is higher than for the other three kinds of bonds (as with Aichi Bank and Hyakujū Bank),
but Akita’s ratio of sold national bonds in the 1920s is the highest of the three regional banks.
It tended to retain its local bonds, bank debentures, and corporate bonds until redemption,
though in the 1920s it sold more corporate bonds than it redeemed.
Concluding Remarks The main investors in corporate bonds in the inter-war period were financial institutions, and in
prefectures where demand for money was lower banks bought more bonds, as is evident in
the cases of Hyakujū Bank and Akita Bank. In the 1920s large banks like Mitsubishi Bank and
Aichi Bank purchased national bonds in secondary markets, but after the Great Depression
medium-sized banks like Hyakujū Bank came to utilise secondary markets for buying national
bonds. In the 1920s only Mitsubishi Bank sold national bonds on a large scale. Akita Bank
sold more national bonds than it redeemed in the 1920s, as did Aichi Bank after the Great
Depression. The period 1930-1932 was a stage of transition in the purchasing and selling of
national bonds. The three regional banks were distant from Tokyo, so presumably they dealt
in national bonds outside the TSE, with over-the-counter transactions developing throughout
Japan. Mitsubishi Bank sold large amounts of local bonds, bank debentures, and corporate
bonds in the 1920s, but very few in the 1930s. Although the three regional banks purchased
these three kinds of bonds mainly in primary markets, Aichi Bank and Akita Bank bought them
in secondary markets more actively in the 1920s than after the Great Depression. The three
regional banks sold few bonds other than national bonds during the period under
consideration, and over-the-counter transactions of these three kinds of bonds probably did
not develop in the 1930s.
There are three factors affecting both the inactivity of secondary markets for these three kinds
of bonds in comparison with national bonds, and the 1933 - 35 decrease in the purchasing of
these three kinds of bonds by investors like Aichi Bank and Akita Bank from underwriters like
Mitsubishi Bank. Firstly, the credibility of these bonds depends upon the issuer, while maturity,
coupon rates, and redemption dates vary from issue to issue. Thus when an investor intends
to sell them before the redemption date it is harder to find buyers for an issue of these bonds
than it may be with national bonds. Hence, trading of these kinds of bonds is generally less
active than that of national bonds (and even in the case of national bonds a few benchmark
bonds are traded actively but the others are not). Secondly, issues of re-funding bonds
increased, and such re-funding bonds sold well in the middle of the 1930s. Moreover, many
holders of redeemed bonds were able to apply for newly issued bonds in exchange for
redeemed ones. Thus, compared with the second half of the 1920s, after the Great
Depression underwriters like Mitsubishi Bank could sell them more easily in the year of issue
(and were not compelled to sell bonds in the year following issue). Finally, after the agreement
in 1933, the banks formed syndicates to underwrite corporate bonds after the agreement in
1933, a significant departure from the 1920s; after the formation of Rokusankai in 1931,
securities firms also formed underwriting syndicates for local bonds and sub-underwriting
syndicates for corporate bonds, and the practice became more widespread than in the
preceding decade.21 As bonds came to be underwritten and distributed co-operatively,
underwriters were left holding few underwritten bonds other than what they had decided to
add to their portfolio in advance.

Acknowledgements Financial assistance from the Japan Society for the Promotion of Science (Historical and
Institutional Analysis of the Capital Market in Japan: Comparing with Advanced and
Developing Countries, Creative Scientific Research Project 2003-2007) is gratefully
acknowledged. The author is grateful to Stefano Battilossi, Leslie Hannah, Janet Hunter,
Masanao Itoh, Takashi Nanjo, Kiyoshi Nikami, Ian Nish, Tetsuji Okazaki, Catherine Schenk,
Masato Shizume, Edmund R. Skrzypczak, Kazuo Wada, and participants of seminars held at
The University of Tokyo and the London School of Economics and Political Science for their
helpful comments. All errors are, of course, the author’s.
Notes 1 For more on Japanese banking, see Goldsmith, The Financial Development of Japan; Tamaki, Japanese Banking; Hoshi and Kashyap, Corporate Financing and Governance in Japan. 2 Yabushita and Inoue, “The Stability of the Japanese Banking System.” 3 Kato, Honpō ginkō-shi ron; Okazaki, Sawada, and Yokoyama, “Measuring the Extent and Implications of Director Interlocking.” 4 Teranishi, Evolution of the Economic System in Japan, 136-142. 5 Shimura, Nihon shihon shijō bunseki, 279-334; Shimura, ed., Nihon kōshasai shijō shi, 37-79. 6 Asajima, “Ryōtaisenkan ni okeru chihō ginkō no yūkashōken shoyū”; Ishii and Sugiyama, eds., Kin’yū kiki to chihō ginkō. 7 Ross, “Bank Advances and Industrial Production”; Capie and Collins, Have the Banks Failed British Industry?, 44-59. 8 Friedman and Schwartz, A Monetary History of the United States, 449-462; Calomiris and Wilson, “Bank Capital and Portfolio Management.” Calomiris and Wilson emphasize that banks decreased loans in order to reduce depositor risk as banks’ capital issuance costs increased during the Great Depression. 9 Shimura, ed., Nihon kōshasai shijō-shi, 74-75. 10 The amounts of national bonds, local bonds, and bank debentures and corporate bonds of a branch in Prefecture A of Bank X, whose head office existed in Prefecture B, were in YBBMF included in the amounts of national bonds, local bonds, bank debentures, and corporate bonds, respectively, of Prefecture A. In contrast, the amounts of paid-up capital, reserves, and deposits were summed up by banks in YBBMF and summed up by prefectures by the author. Thus, the basis of summation of figures for paid-up capital, reserves, and deposits is different from that for the four kinds of bonds. But since a bank normally held securities at its head office, the gap between the two summation bases does not cause serious problems for our analysis. 11 Because Okinawa is far removed from the other prefectures, it is excluded from the regressions. 12 Kasuya, “Securities Markets and a Securities Company.” 13 For the underwriting capabilities of banks and securities companies, see Konishi, “Bond Underwriting by Banks”; idem, “Bond Underwriting Syndicates.” 14 Kikkawa, “Senkanki no shasai hakkō to nanadai kin’yū keitō.” 15 Mitsubishi Ginkō-shi Hensan Iinkai, Mitsubishi Ginkō-shi, 196-214. 16 Okazaki, “Showa Kin’yū Kyōko to Mitsubishi Ginkō.”

17 Osawa, Aichi Ginkō yonjūrokunen-shi, 217-265. 18 Yamaguchi Ginkō, Yamaguchi Ginkō-shi, 344-407. 19 Akita Ginkō, Akita Ginkō hachijunen-shi, 377-397. 20 Akita Bank, like other banks that had suffered as a result of large amounts of long-term loans secured by property, requested the government-related Japan Hypothec Bank to take over its debts, which the latter did. For loans secured by property, see Nanjo, “Developments in Land Prices and Bank Lending in Interwar Japan.” 21 Yamaichi Shōken, Yamaichi Shōken-shi, 725.
References Aichi Bank. Eigyō hōkokusho (Semi-annual Reports). Nagoya: Aichi Bank, 1925-1936. Akita Bank. Eigyō hōkokusho (Semi-annual Reports). Akita: Akita Bank, 1925-1936.
. Akita Ginkō hachijūnen-shi (Eighty-year History of Akita Bank). Akita: Akita Bank, 1959.
Asajima, Shōichi. “Ryōtaisenkan ni okeru chihō ginkō no yūkashōken shoyū” (Regional
Banks’ Securities Holdings in the Inter-war Period). Chiho Kin’yu-shi Kenkyu, no. 9 (1978): 22-62.
Banking Bureau of the Ministry of Finance. Ōkurashō Ginkōkyoku nenpō (Yearbook of the
Banking Bureau of the Ministry of Finance, YBBMF). Tokyo: Banking Bureau of the Ministry of Finance, 1925-1939.
Calomiris, Charles W., and Berry Wilson. “Bank Capital and Portfolio Management: The
1930s ‘Capital Crunch’ and the Scramble to Shed Risk.” Journal of Business 77, no. 3 (2004): 421-455.
Capie, Forrest, and Michael Collins. Have the Banks Failed British Industry? London: Institute
of Economic Affairs, 1992. Friedman, Milton, and Anna J. Schwartz. A Monetary History of the United States, 1867-1960.
Princeton: Princeton University Press, 1963. Goldsmith, Raymond W. The Financial Development of Japan, 1868-1977. New Haven, CT:
Yale University Press, 1983. Hyakujū Bank. Eigyō hōkokusho (Semi-annual Reports). Shimonoseki: Hyakujū Bank, 1925-
1936. Hoshi, Takeo, and Anil Kashyap. Corporate Financing and Governance in Japan: The Road
to the Future. Cambridge, MA: MIT Press, 2001. Industrial Bank of Japan. Zenkoku kōshasai meisaihyō (List of Bonds in Japan). Tokyo:
Industrial Bank of Japan, 1925-1936. Ishii, Kanji, and Kazuo Sugiyama, eds. Kin’yū kiki to chihō ginkō: senkanki no bunseki
(Regional Banks in Financial Crisis: An Analysis of the Inter-war Period). Tokyo: University of Tokyo Press, 2001.
Kasuya, Makoto. “Securities Markets and a Securities Company in Interwar Japan: The Case
of Yamaichi.” In Coping with Crisis: International Financial Institutions in the Interwar Period, edited by Makoto Kasuya. Oxford: Oxford University Press, 2003: 200-226.
Katō, Toshihiko. Honpō ginkō-shi ron (Analysis of Japanese Banks). Tokyo: University of
Tokyo Press, 1957. Kikkawa, Takeo. “Senkanki no shasai hakkō to nanadai kin’yū keitō” (Bond Issuance and
Seven Large Financial Groups in the Inter-war Period). Shoken Kenkyu, no. 69 (1983): 89-143.

Konishi, Masaru. “Bond Underwriting by Banks and Conflicts of Interest: Evidence from Japan
during the Pre-war Period.” Journal of Banking & Finance 26 (2002): 767-793. . “Bond Underwriting Syndicates Organized by Commercial Banks: Evidence from Prewar Japan.” Journal of Japanese & International Economies 19 (2005): 303-321.
Mitsubishi Bank. Eigyō hōkokusho (Semi-annual Reports). Tokyo: Mitsubishi Bank, 1925-
1936. Mitsubishi Ginkō-shi Hensan Iinkai (Editorial Committee for the History of Mitsubishi Bank).
Mitsubishi Ginkō-shi (History of Mitsubishi Bank). Tokyo: Mitsubishi Bank, 1954. Nanjo, Takashi. “Developments in Land Prices and Bank Lending in Interwar Japan: Effects of
the Real Estate Finance Problem on the Banking Industry.” Monetary and Economic Studies 20, no. 3 (2002): 117-142.
Okazaki, Tetsuji. “Showa Kin’yū Kyōko to Mitsubishi Ginkō” (The Showa Financial Crisis and
Mitsubishi Bank). Mitsubishi Shiryokan Ronshu, no. 5 (2004): 133-153. , Michiru Sawada, and Kazuki Yokoyama. “Measuring the Extent and Implications of
Director Interlocking in the Pre-war Japanese Banking Industry.” Journal of Economic History 65, no. 4 (2005): 1082-1115.
Osawa, Kichigoro. Aichi Ginkō yonjūrokunen-shi (Forty-six-year History of Aichi Bank).
Nagoya: Tokai Bank, 1944. Ross, Duncan M. “Bank Advances and Industrial Production in the United Kingdom during the
Inter-war Years: A Red Herring?” In European Industry and Banking between the Wars: A Review of Bank-Industry Relations, edited by Phillip L. Cottrell, Håkan Lindgren, and Alice Teichova. Leicester: Leicester University Press, 1992: 183-201.
Shimura, Kaichi. Nihon shihon shijō bunseki (Analysis of Japanese Securities Markets).
Tokyo: University of Tokyo Press, 1969. , ed. Nihon kōshasai shijō-shi (History of Japanese Bond Markets). Tokyo: University
of Tokyo Press, 1980. Tamaki, Norio. Japanese Banking: A History, 1859-1959. Cambridge: Cambridge University
Press, 1995. Teranishi, Juro. Evolution of the Economic System in Japan. Cheltenham: Edward Elgar,
2005. Yabushita, Shiro, and Atsushi Inoue. “The Stability of the Japanese Banking System: A
Historical Perspective.” Journal of Japanese & International Economies 7, no. 4 (1993): 387-407.
Yamaguchi Bank. Yamaguchi Ginkō-shi (History of Yamaguchi Bank). Shimonoseki:
Yamaguchi Bank, 1968.

Yamaichi Securities Co. Yamaichi Shōken-shi (History of Yamaichi Securities). Tokyo: Yamaichi Securities, 1958.