bond proceeds investment strategies & arbitrage considerations · bond proceeds investment...
TRANSCRIPT
© PFM 1
Bond Proceeds Investment Strategies & Arbitrage Considerations2017 CDFA Advanced Bond Finance WebCourse
PFM Asset Management LLC
One Keystone PlazaSuite 300Harrisburg, PA 17101
717.232.2723pfm.com
Michael Steinbrook and Gray LepleyPresented By:
September 2017
© PFM 2
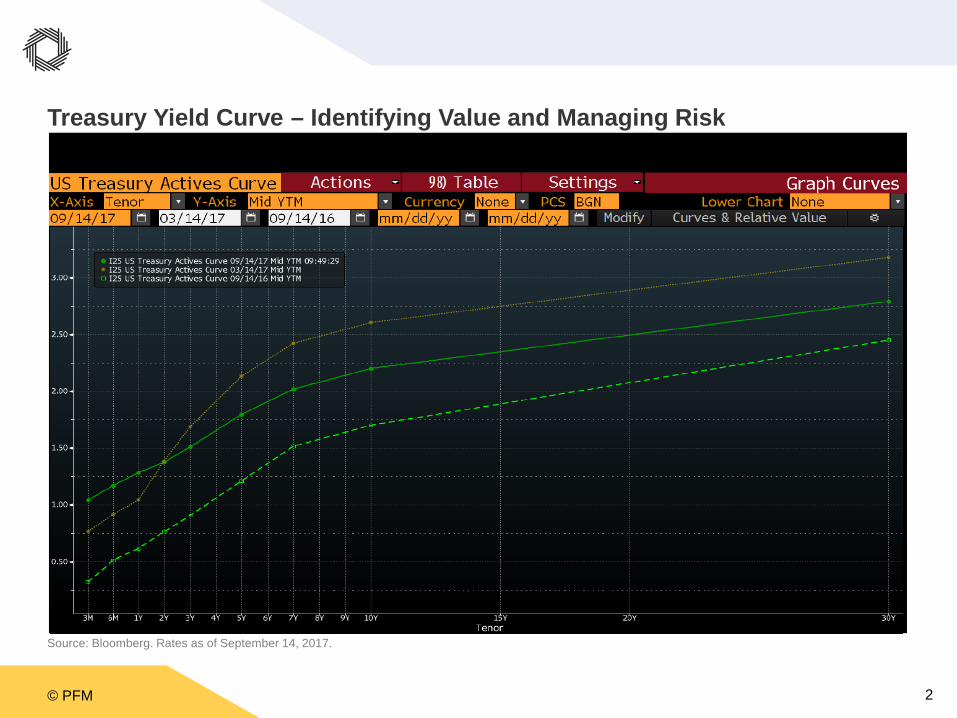
Treasury Yield Curve – Identifying Value and Managing Risk
Source: Bloomberg. Rates as of September 14, 2017.
© PFM 3
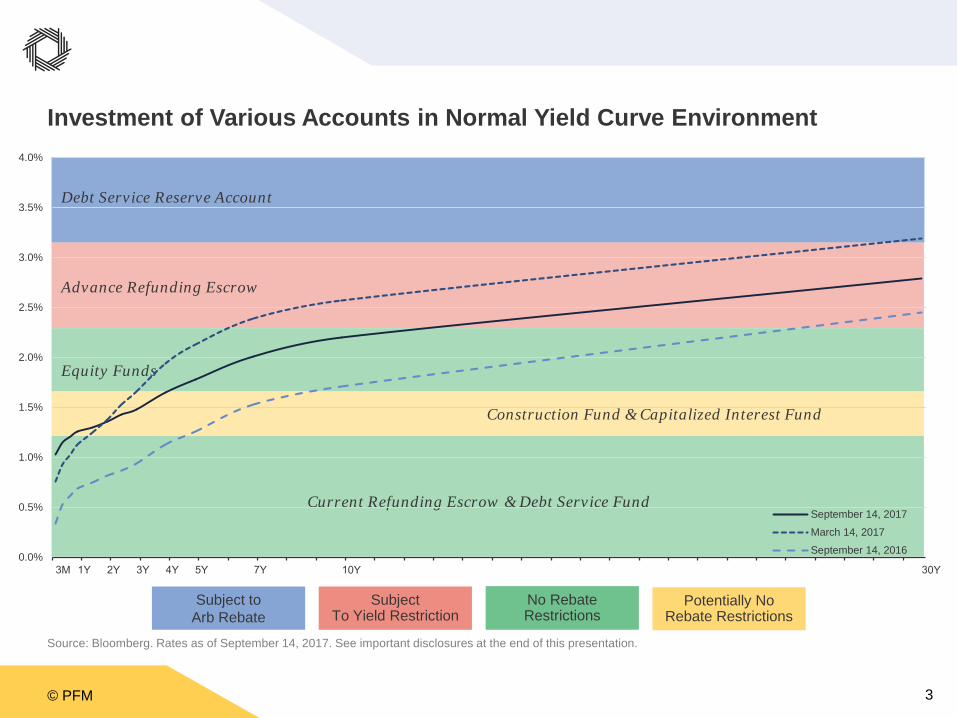
Investment of Various Accounts in Normal Yield Curve Environment
Source: Bloomberg. Rates as of September 14, 2017. See important disclosures at the end of this presentation.
Debt Service Reserve Account
Advance Refunding Escrow
Current Refunding Escrow & Debt Service Fund
Construction Fund & Capitalized Interest Fund
Subject to Arb Rebate
Subject To Yield Restriction
No Rebate Restrictions
Potentially No Rebate Restrictions
Equity Funds
0.0%
0.5%
1.0%
1.5%
2.0%
2.5%
3.0%
3.5%
4.0%
September 14, 2017March 14, 2017September 14, 2016
© PFM 4
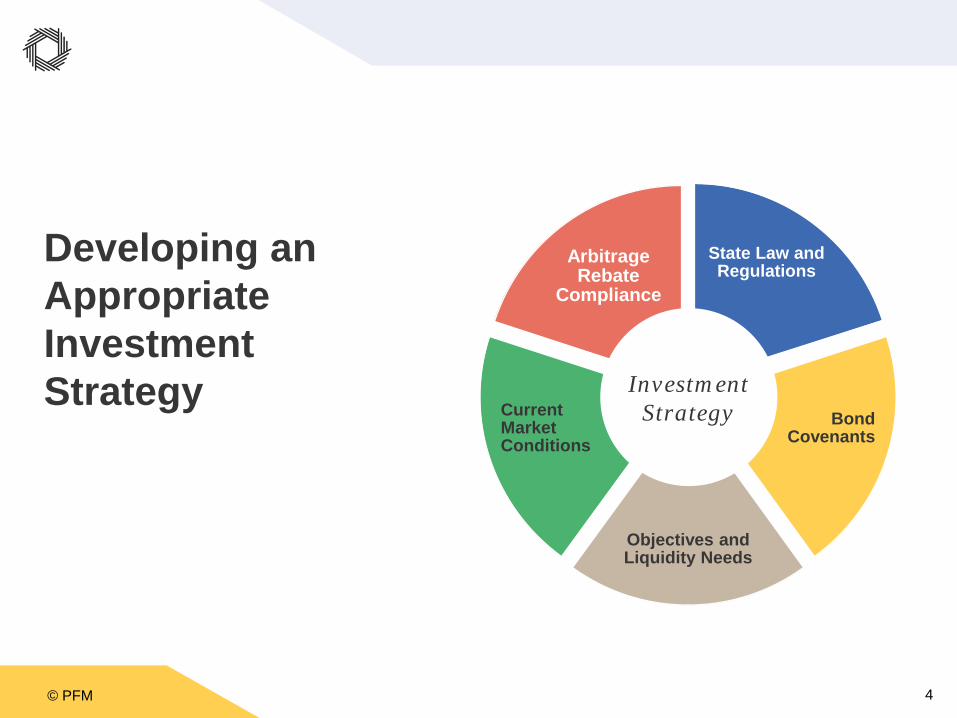
Developing an Appropriate Investment Strategy
Monitoring and Reporting
State Law and Regulations
Bond Covenants
Objectives and Liquidity Needs
Current Market Conditions
Arbitrage Rebate
Compliance
Investment Strategy
© PFM 5
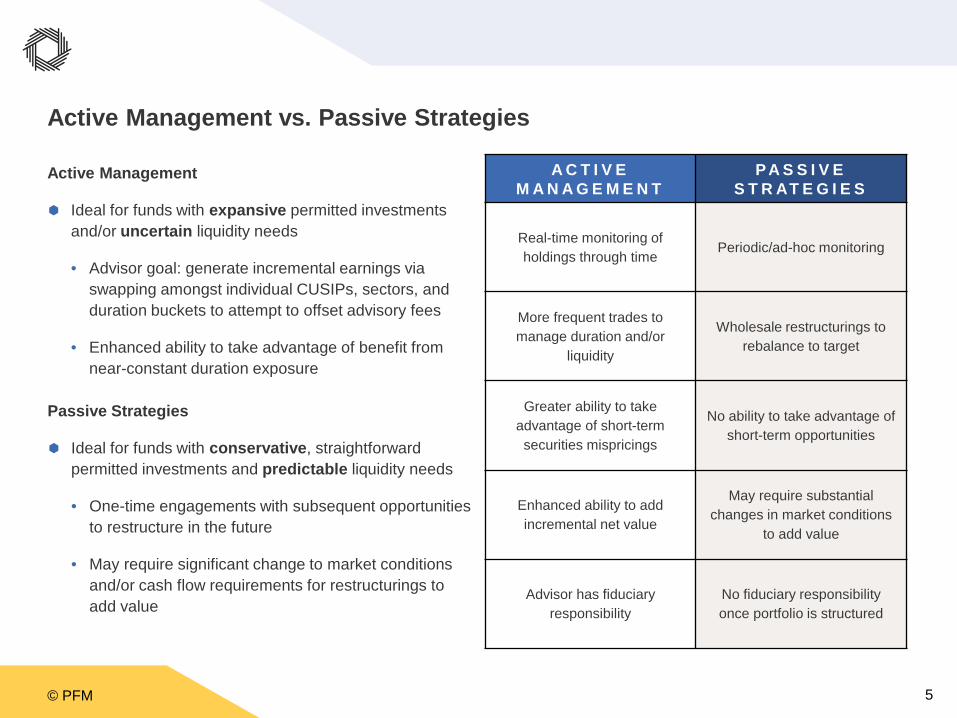
Active Management vs. Passive Strategies
Active Management
Ideal for funds with expansive permitted investments and/or uncertain liquidity needs
• Advisor goal: generate incremental earnings via swapping amongst individual CUSIPs, sectors, and duration buckets to attempt to offset advisory fees
• Enhanced ability to take advantage of benefit from near-constant duration exposure
Passive Strategies
Ideal for funds with conservative, straightforward permitted investments and predictable liquidity needs
• One-time engagements with subsequent opportunities to restructure in the future
• May require significant change to market conditions and/or cash flow requirements for restructurings to add value
A C T I V E M A N A G E M E N T
P A S S I V E S T R AT E G I E S
Real-time monitoring of holdings through time Periodic/ad-hoc monitoring
More frequent trades to manage duration and/or
liquidity
Wholesale restructurings to rebalance to target
Greater ability to take advantage of short-term securities mispricings
No ability to take advantage of short-term opportunities
Enhanced ability to add incremental net value
May require substantial changes in market conditions
to add value
Advisor has fiduciary responsibility
No fiduciary responsibility once portfolio is structured
© PFM 6
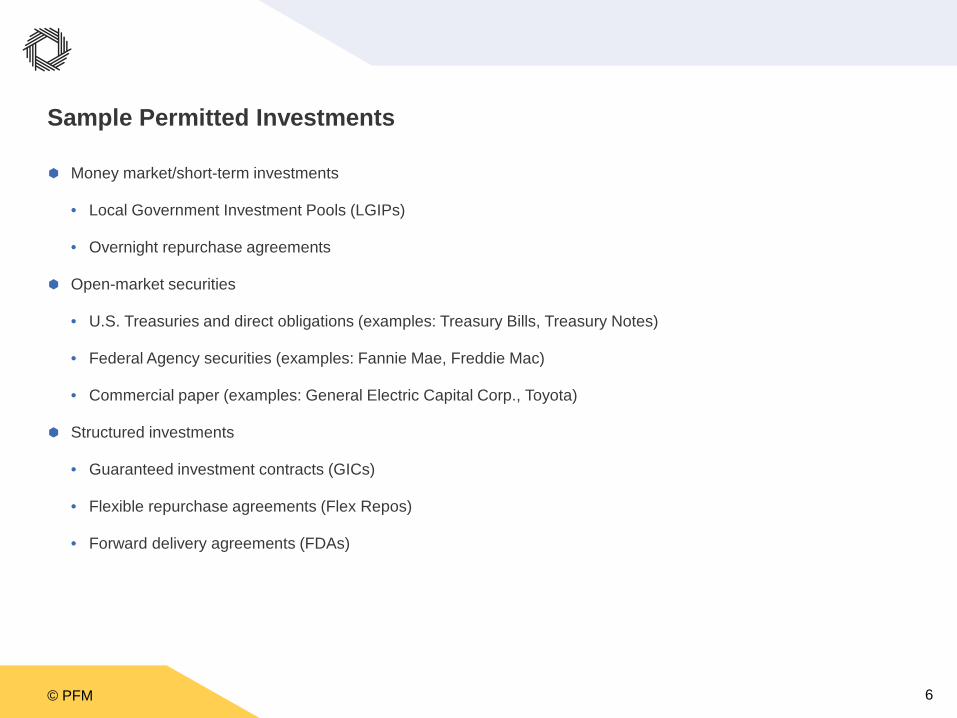
Sample Permitted Investments
Money market/short-term investments
• Local Government Investment Pools (LGIPs)
• Overnight repurchase agreements
Open-market securities
• U.S. Treasuries and direct obligations (examples: Treasury Bills, Treasury Notes)
• Federal Agency securities (examples: Fannie Mae, Freddie Mac)
• Commercial paper (examples: General Electric Capital Corp., Toyota)
Structured investments
• Guaranteed investment contracts (GICs)
• Flexible repurchase agreements (Flex Repos)
• Forward delivery agreements (FDAs)

© PFM 7
Project and Cap-I Funds
© PFM 8
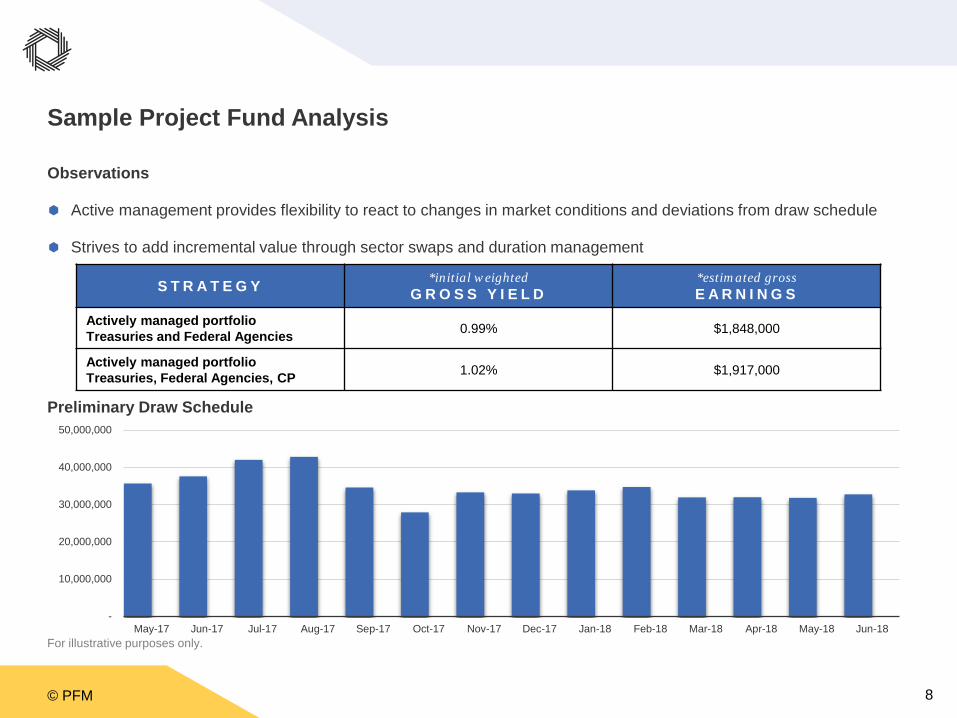
Sample Project Fund Analysis
Observations
Active management provides flexibility to react to changes in market conditions and deviations from draw schedule
Strives to add incremental value through sector swaps and duration management
For illustrative purposes only.
-
10,000,000
20,000,000
30,000,000
40,000,000
50,000,000
May-17 Jun-17 Jul-17 Aug-17 Sep-17 Oct-17 Nov-17 Dec-17 Jan-18 Feb-18 Mar-18 Apr-18 May-18 Jun-18
S T R A T E G Y *initial weightedG R O S S Y I E L D
*estimated grossE A R N I N G S
Actively managed portfolioTreasuries and Federal Agencies 0.99% $1,848,000
Actively managed portfolioTreasuries, Federal Agencies, CP 1.02% $1,917,000
Preliminary Draw Schedule
© PFM 9
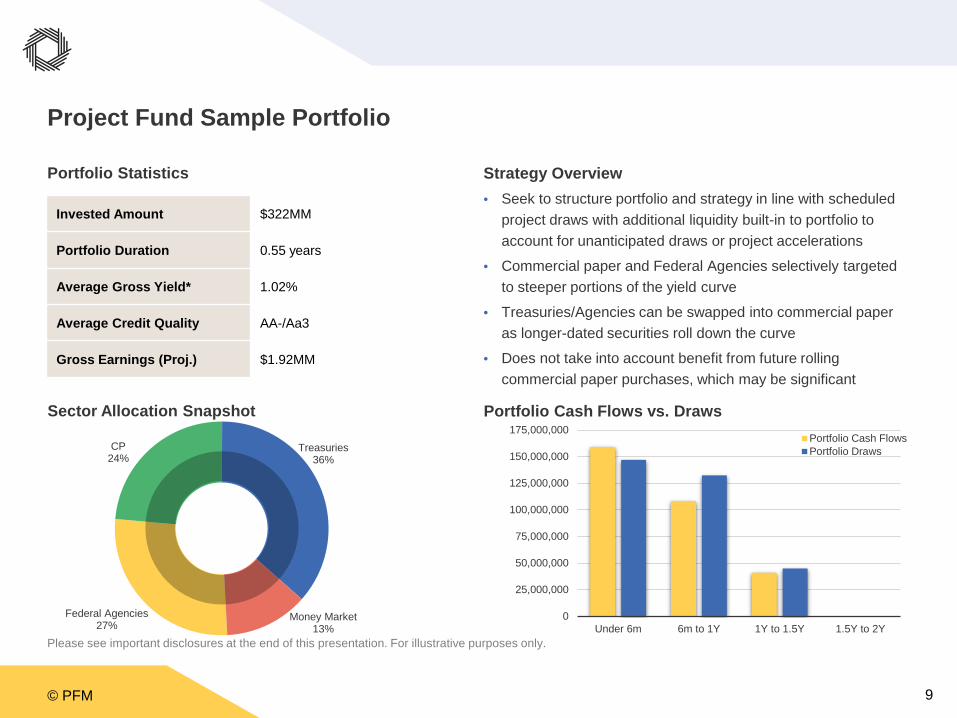
Project Fund Sample Portfolio
Portfolio Statistics
Please see important disclosures at the end of this presentation. For illustrative purposes only.
Sector Allocation Snapshot
Strategy Overview• Seek to structure portfolio and strategy in line with scheduled
project draws with additional liquidity built-in to portfolio to account for unanticipated draws or project accelerations
• Commercial paper and Federal Agencies selectively targeted to steeper portions of the yield curve
• Treasuries/Agencies can be swapped into commercial paper as longer-dated securities roll down the curve
• Does not take into account benefit from future rolling commercial paper purchases, which may be significant
Portfolio Cash Flows vs. Draws
Invested Amount $322MM
Portfolio Duration 0.55 years
Average Gross Yield* 1.02%
Average Credit Quality AA-/Aa3
Gross Earnings (Proj.) $1.92MM
0
25,000,000
50,000,000
75,000,000
100,000,000
125,000,000
150,000,000
175,000,000
Under 6m 6m to 1Y 1Y to 1.5Y 1.5Y to 2Y
Portfolio Cash FlowsPortfolio Draws
Federal Agencies27%
CP24%
Treasuries36%
Money Market13%
© PFM 10
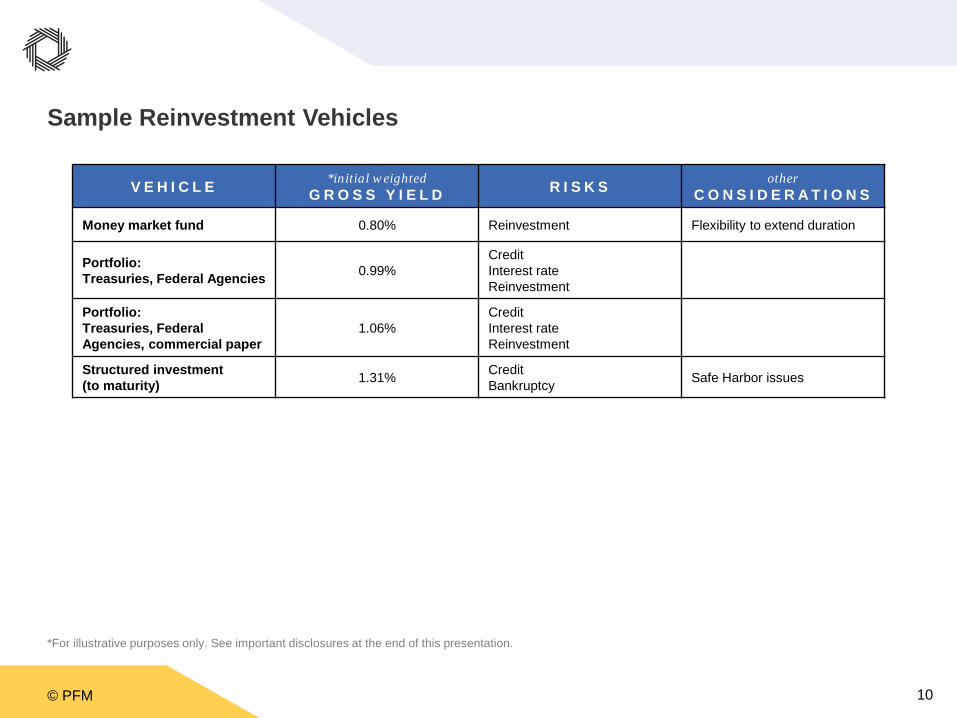
Sample Reinvestment Vehicles
*For illustrative purposes only. See important disclosures at the end of this presentation.
V E H I C L E *initial weightedG R O S S Y I E L D R I S K S other
C O N S I D E R A T I O N S
Money market fund 0.80% Reinvestment Flexibility to extend duration
Portfolio:Treasuries, Federal Agencies 0.99%
CreditInterest rateReinvestment
Portfolio:Treasuries, Federal Agencies, commercial paper
1.06%CreditInterest rateReinvestment
Structured investment(to maturity) 1.31% Credit
Bankruptcy Safe Harbor issues

© PFM 11
Reserve Funds
© PFM 12
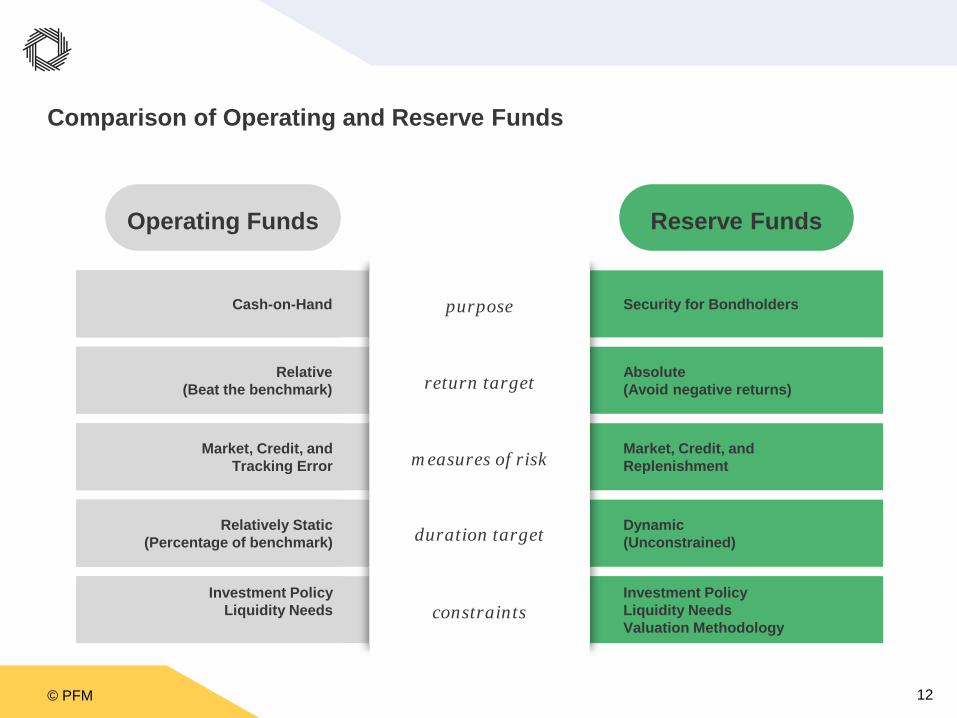
Comparison of Operating and Reserve Funds
Operating Funds Reserve Funds
Security for BondholdersCash-on-Hand
Absolute(Avoid negative returns)
Market, Credit, andReplenishment
Dynamic(Unconstrained)
Investment PolicyLiquidity NeedsValuation Methodology
Relative(Beat the benchmark)
Market, Credit, andTracking Error
Relatively Static(Percentage of benchmark)
Investment PolicyLiquidity Needs
return target
measures of risk
duration target
constraints
purpose
© PFM 13
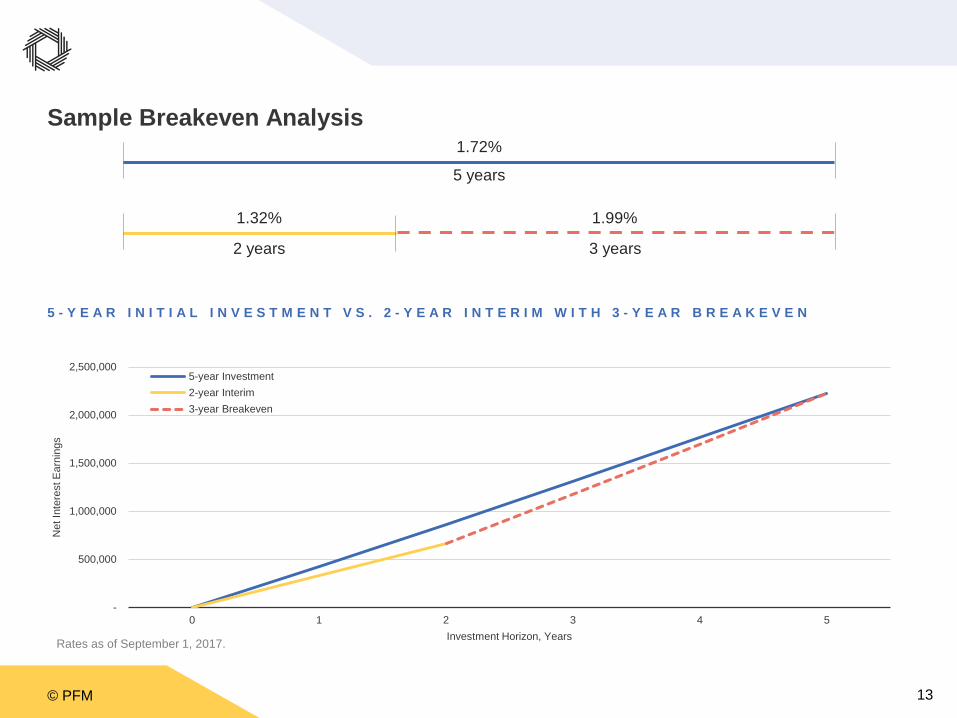
Sample Breakeven Analysis
Rates as of September 1, 2017.
5 years
2 years 3 years
1.72%
1.32% 1.99%
5 - Y E A R I N I T I A L I N V E S T M E N T V S . 2 - Y E A R I N T E R I M W I T H 3 - Y E A R B R E A K E V E N
-
500,000
1,000,000
1,500,000
2,000,000
2,500,000
0 1 2 3 4 5
Net
Inte
rest
Ear
ning
s
Investment Horizon, Years
5-year Investment2-year Interim3-year Breakeven
© PFM 14
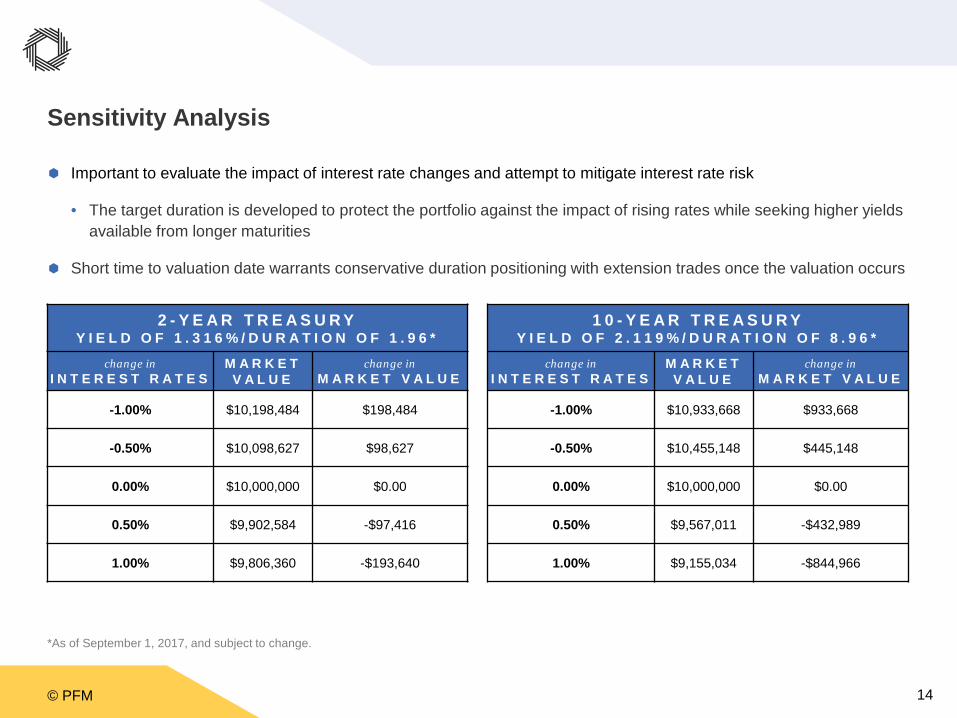
Sensitivity Analysis
Important to evaluate the impact of interest rate changes and attempt to mitigate interest rate risk
• The target duration is developed to protect the portfolio against the impact of rising rates while seeking higher yields available from longer maturities
Short time to valuation date warrants conservative duration positioning with extension trades once the valuation occurs
*As of September 1, 2017, and subject to change.
2 - Y E A R T R E A S U R YY I E L D O F 1 . 3 1 6 % / D U R A T I O N O F 1 . 9 6 *
change inI N T E R E S T R A T E S
M A R K E TV A L U E
change inM A R K E T V A L U E
-1.00% $10,198,484 $198,484
-0.50% $10,098,627 $98,627
0.00% $10,000,000 $0.00
0.50% $9,902,584 -$97,416
1.00% $9,806,360 -$193,640
1 0 - Y E A R T R E A S U R YY I E L D O F 2 . 1 1 9 % / D U R A T I O N O F 8 . 9 6 *
change inI N T E R E S T R A T E S
M A R K E TV A L U E
change inM A R K E T V A L U E
-1.00% $10,933,668 $933,668
-0.50% $10,455,148 $445,148
0.00% $10,000,000 $0.00
0.50% $9,567,011 -$432,989
1.00% $9,155,034 -$844,966

© PFM 15
Arbitrage and Tax Considerations
© PFM 16
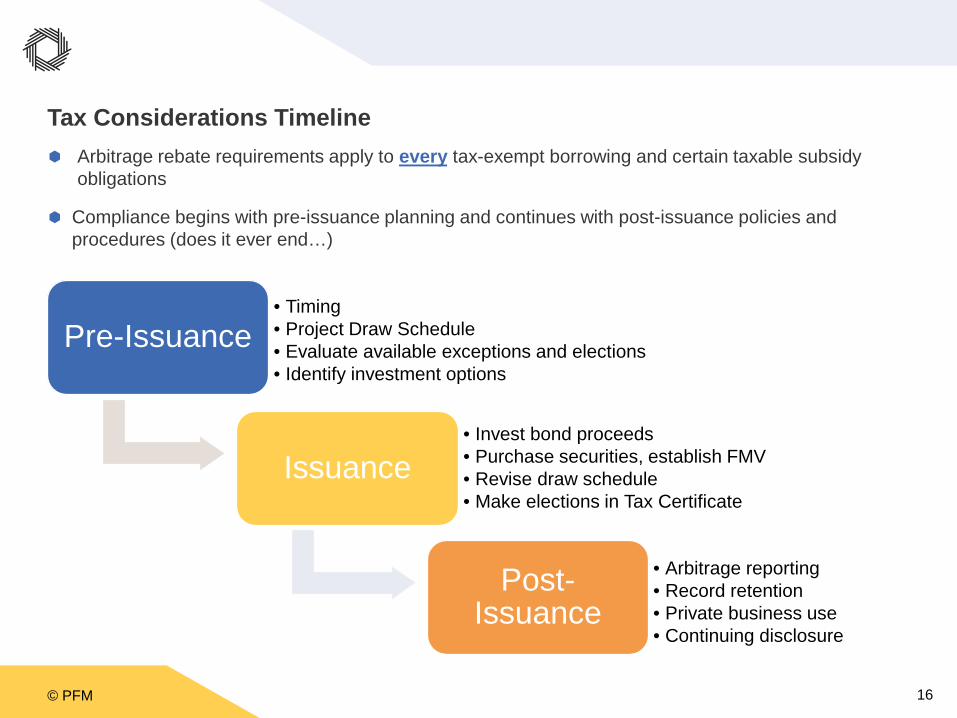
Tax Considerations Timeline Arbitrage rebate requirements apply to every tax-exempt borrowing and certain taxable subsidy
obligations
Compliance begins with pre-issuance planning and continues with post-issuance policies and procedures (does it ever end…)
Pre-Issuance• Timing• Project Draw Schedule• Evaluate available exceptions and elections• Identify investment options
Issuance• Invest bond proceeds• Purchase securities, establish FMV• Revise draw schedule• Make elections in Tax Certificate
Post-Issuance
• Arbitrage reporting• Record retention• Private business use• Continuing disclosure
© PFM 17
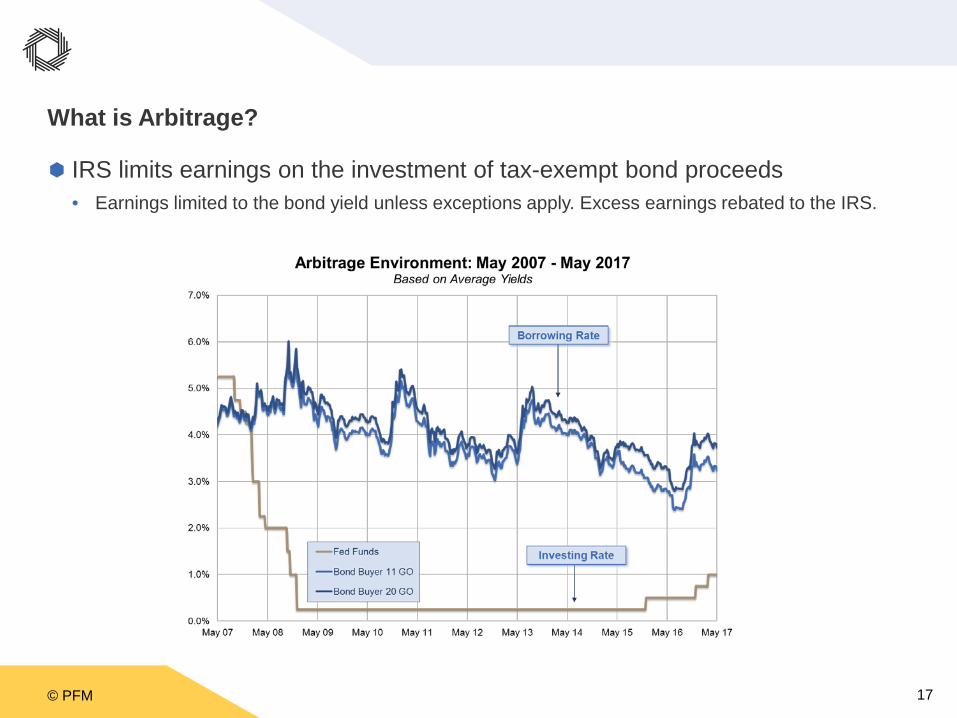
What is Arbitrage?
IRS limits earnings on the investment of tax-exempt bond proceeds• Earnings limited to the bond yield unless exceptions apply. Excess earnings rebated to the IRS.
© PFM 18
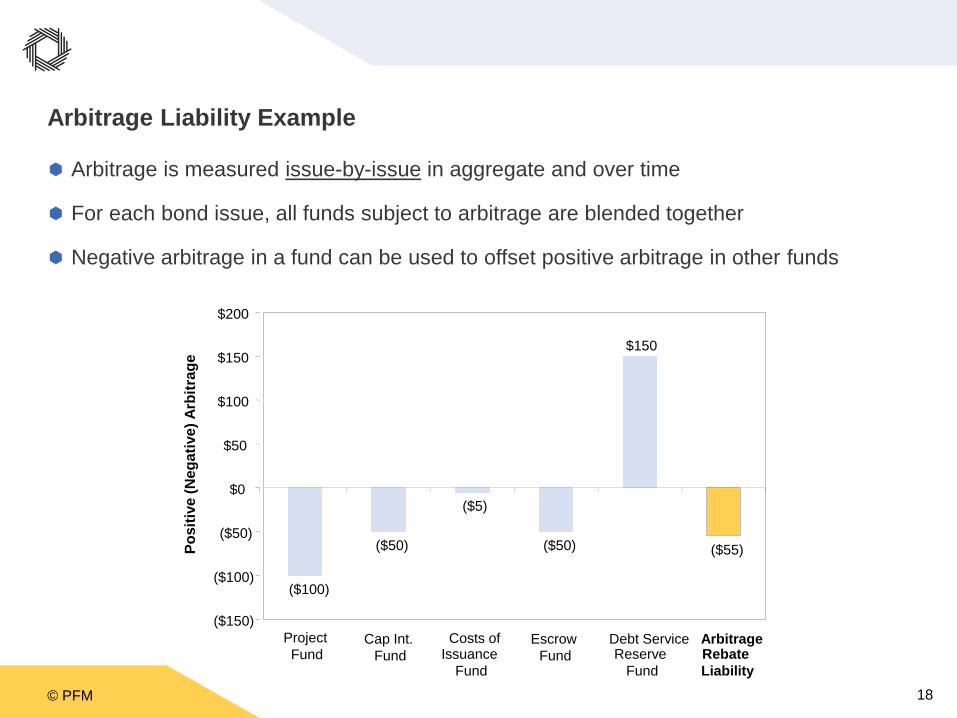
Arbitrage Liability Example
Arbitrage is measured issue-by-issue in aggregate and over time
For each bond issue, all funds subject to arbitrage are blended together
Negative arbitrage in a fund can be used to offset positive arbitrage in other funds
($100)
($50)
($5)
($50)
$150
($55)
($150)
($100)
($50)
$0
$50
$100
$150
$200
Project Fund
Cap Int. Fund
Costs ofIssuance
Fund
Escrow Fund
Debt ServiceReserve
Fund
ArbitrageRebate Liability
Posi
tive
(Neg
ativ
e) A
rbitr
age
© PFM 19
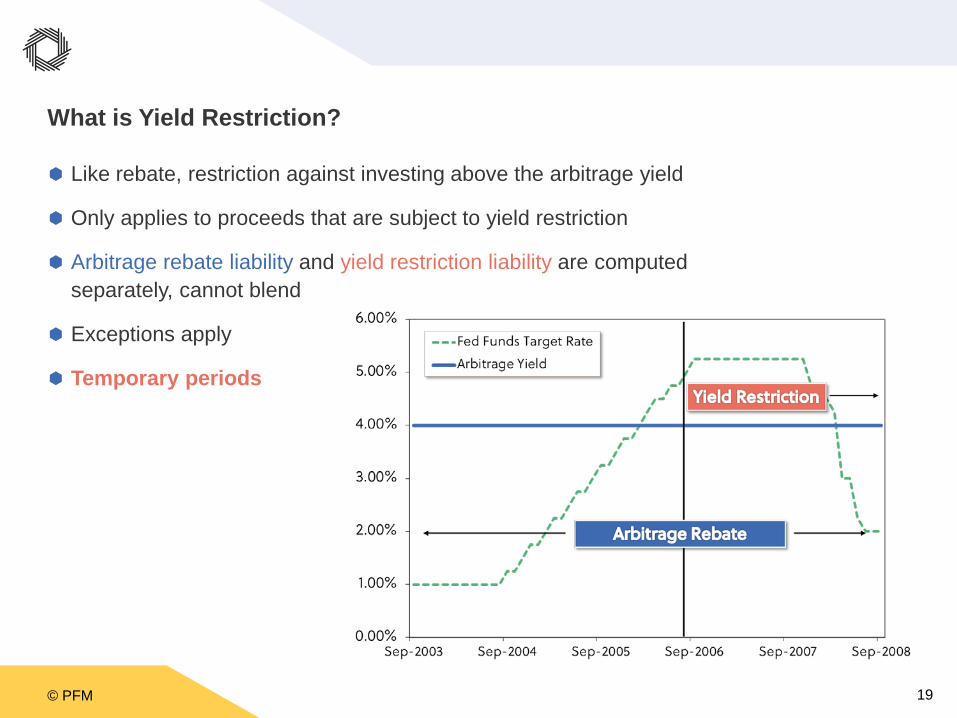
What is Yield Restriction?
Like rebate, restriction against investing above the arbitrage yield
Only applies to proceeds that are subject to yield restriction
Arbitrage rebate liability and yield restriction liability are computed separately, cannot blend
Exceptions apply
Temporary periods
© PFM 20
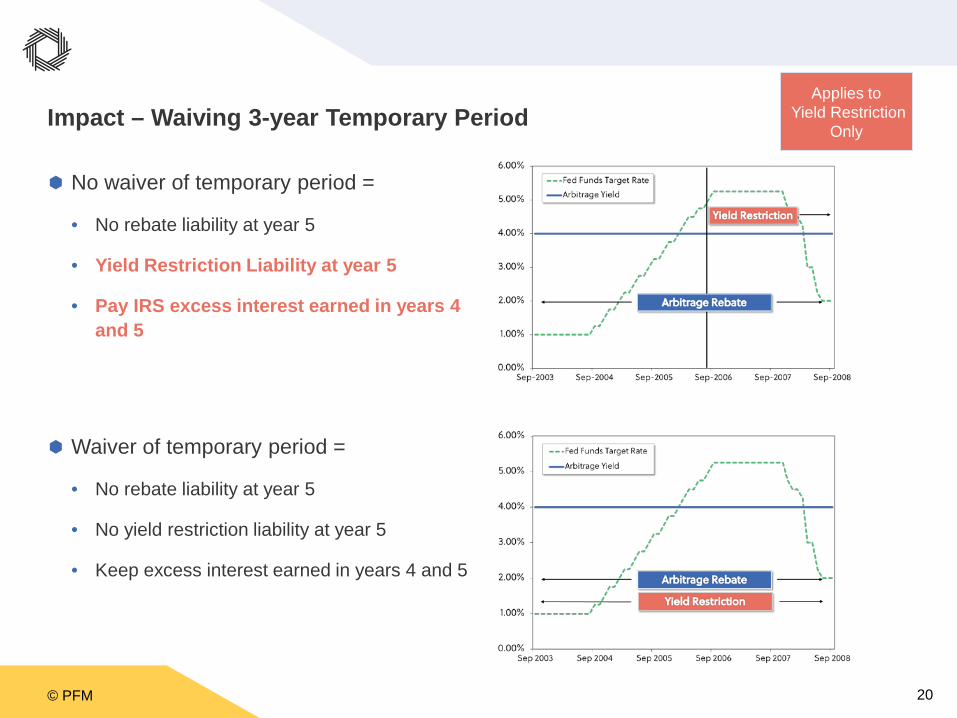
Impact – Waiving 3-year Temporary Period
No waiver of temporary period =
• No rebate liability at year 5
• Yield Restriction Liability at year 5
• Pay IRS excess interest earned in years 4 and 5
Waiver of temporary period =
• No rebate liability at year 5
• No yield restriction liability at year 5
• Keep excess interest earned in years 4 and 5
Applies toYield Restriction
Only
© PFM 21
Valuation of Investments
Value of investments determined one of three ways:
1. Plain Par
• Investment originally purchased at a price between 98 and 102
• Valued at par (100) plus accrued interest
2. Present Value (fixed rate investment)
• Accreted value based on original YTM, plus accrued interest
3. Fair Market Value (any investment)
• Utilize a pricing source (Bloomberg, IDC, bank/trustee, etc.)
• FMV price plus accrued interest
© PFM 22
Investment Valuation – Example
Debt Service Reserve Fund• Bonds issued on 8/31/2012
• Arbitrage yield – 3.50%
• DSRF deposit of $1,020,000
• DSRF invested in $1M of 3.50% coupon U.S. T-Notes due 8/15/2022
• Purchase price @ 101-24 (101.75) / 3.29% Yield on 8/31/2012
• 1st 5th-Year Rebate Calculation Date – 8/31/2017
• Fair Market Value Yield of U.S. T-Notes on 8/31/2017 – 1.80%
Note – issuers may also have an annual fair market value requirement for financial reporting purposes and/or for DSRF sizing
© PFM 23
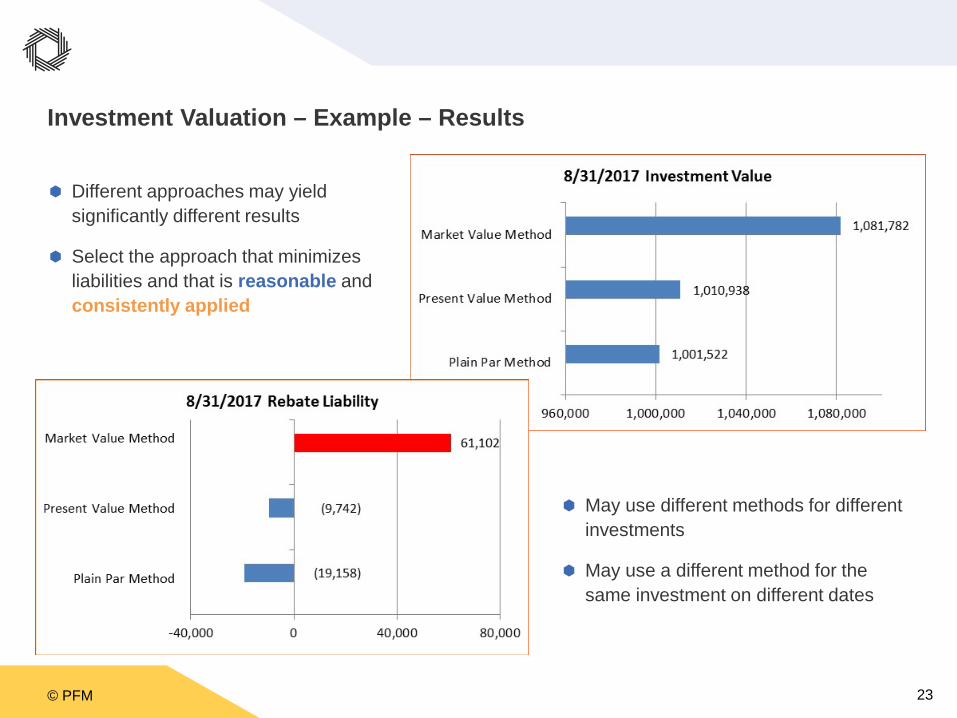
Investment Valuation – Example – Results
Different approaches may yield significantly different results
Select the approach that minimizes liabilities and that is reasonable and consistently applied
May use different methods for different investments
May use a different method for the same investment on different dates
© PFM 24
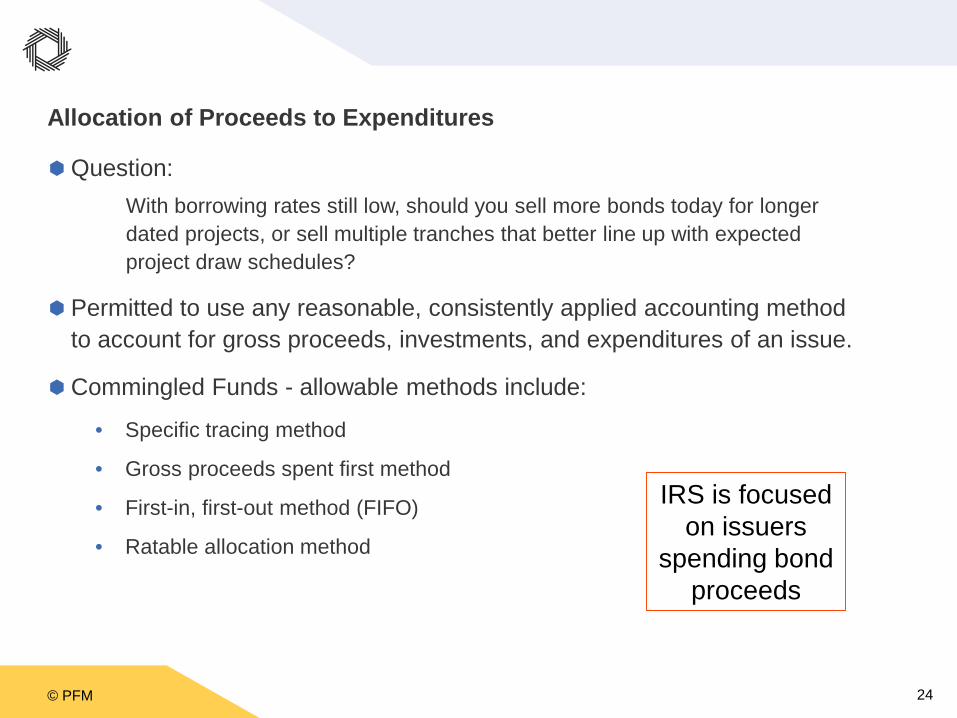
Allocation of Proceeds to Expenditures
Question:With borrowing rates still low, should you sell more bonds today for longer dated projects, or sell multiple tranches that better line up with expected project draw schedules?
Permitted to use any reasonable, consistently applied accounting method to account for gross proceeds, investments, and expenditures of an issue.
Commingled Funds - allowable methods include:
• Specific tracing method
• Gross proceeds spent first method
• First-in, first-out method (FIFO)
• Ratable allocation method
IRS is focused on issuers
spending bond proceeds
© PFM 25
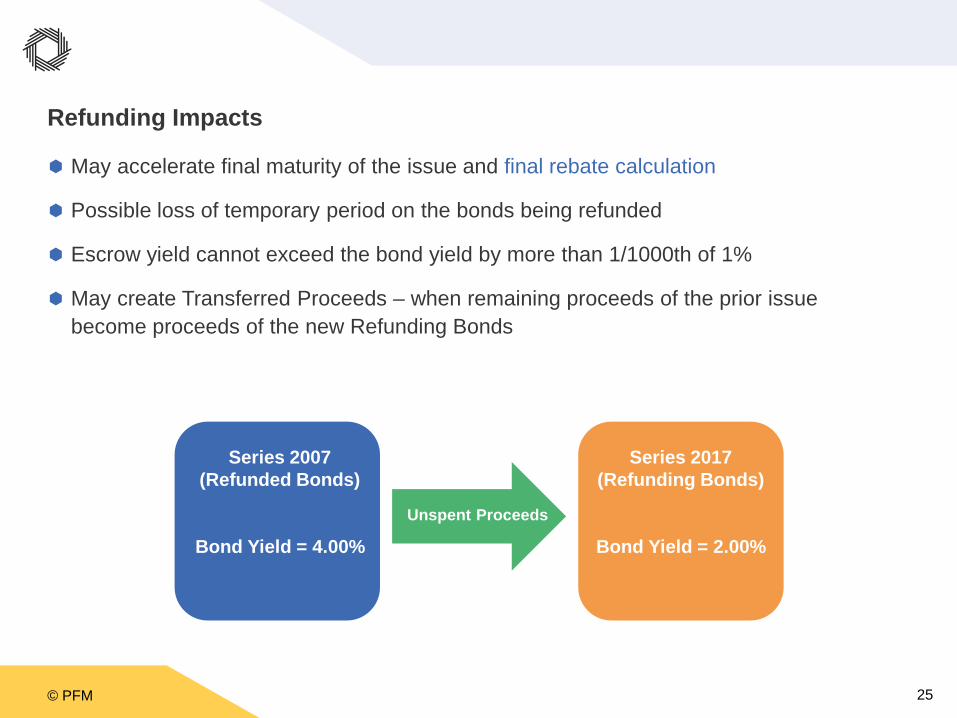
Refunding Impacts
May accelerate final maturity of the issue and final rebate calculation
Possible loss of temporary period on the bonds being refunded
Escrow yield cannot exceed the bond yield by more than 1/1000th of 1%
May create Transferred Proceeds – when remaining proceeds of the prior issue become proceeds of the new Refunding Bonds
Series 2007(Refunded Bonds)
Bond Yield = 4.00%
Series 2017(Refunding Bonds)
Bond Yield = 2.00%Unspent Proceeds
© PFM 26
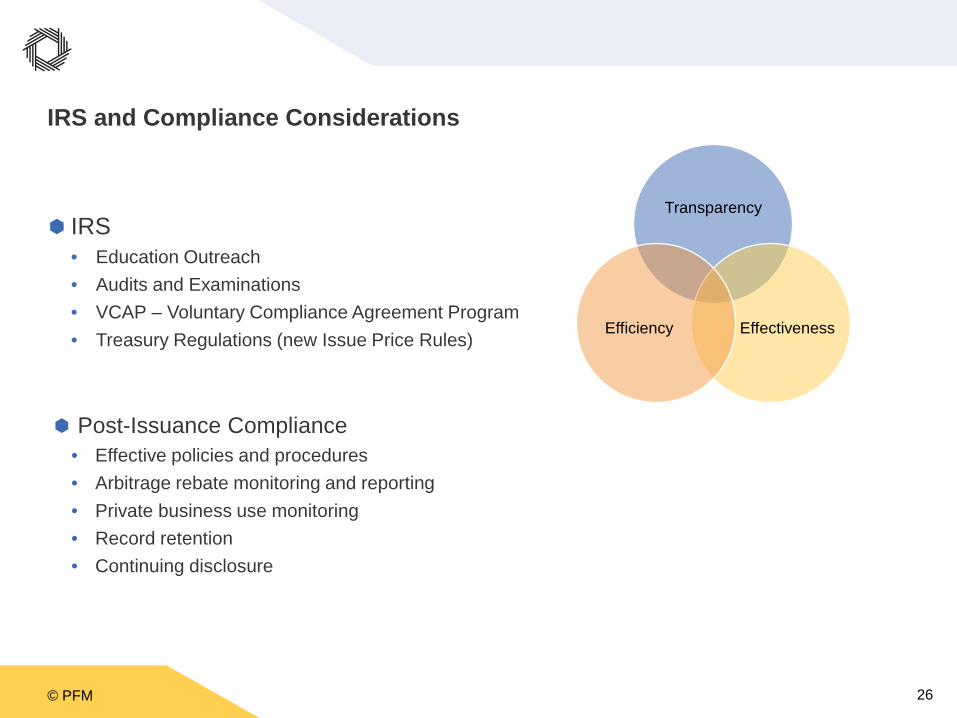
IRS and Compliance Considerations
IRS• Education Outreach• Audits and Examinations• VCAP – Voluntary Compliance Agreement Program• Treasury Regulations (new Issue Price Rules)
Post-Issuance Compliance• Effective policies and procedures• Arbitrage rebate monitoring and reporting• Private business use monitoring• Record retention• Continuing disclosure
Transparency
EffectivenessEfficiency

© PFM 27
Questions?
© PFM 28
Disclaimers
Investment Advisory Services
PFM is the marketing name for a group of affiliated companies providing a range of services. All services are provided through separate agreements with each company. This material is for general information purposes only and is not intended to provide specific advice or a specific recommendation.
Investment advisory services are provided by PFM Asset Management LLC which is registered with the Securities and Exchange Commission under the Investment Advisers Act of 1940. The information contained is not an offer to purchase or sell any securities. Applicable regulatory information is available upon request.
For more information regarding PFM’s services or entities, please visit www.pfm.com.
This material is only intended for institutional and/or sophisticated professional investors. It is for informational purposes only and should not be relied upon to make an investment decision, as it was prepared without regard to any specific objectives or financial circumstances. It should not be construed as an offer to purchase/sell any investment. Any investment or strategy referenced may involve significant risks, including but not limited to risk of loss, illiquidity, unavailability within all jurisdictions, and may not be suitable for all investors. To the extent permitted by applicable law, no member of the PFM Group, or any officer, employee or associate accepts any liability whatsoever for any direct or consequential loss arising from any use of this material, including for negligence. This material is not intended for distribution to or use by, any person in a jurisdiction where delivery would be contrary to applicable law or regulation, or it is subject to any contractual restriction. No further distribution is permissible without prior consent.
Case study details were provided at your request. You should note the details provided are based on factual information from actual projects that PFMAM completed. It has been provided for general information purposes only and is not intended to provide specific advice or a specific recommendation. The results of individual projects will vary significantly depending upon the size and structure of each fund, permitted investments, prevailing market conditions at the time of the structuring and procurement process, and other events or circumstances beyond the control of PFMAM.
Past performance does not necessarily reflect and is not a guaranty of future results. The information contained in this presentation is not an offer to purchase or sell any securities.
The views expressed within this material constitute the perspective and judgment of PFM Asset Management LLC at the time of distribution and are subject to change. Any forecast, projection, or prediction of the market, the economy, economic trends, and equity or fixed-income markets are based upon current options as of the date of issue, and are also subject to change. Opinions and data presented are not necessarily indicative of future event or expected performance. Information contained herein is based on data obtained from recognized statistical services issuer reports or communications, or other sources believed to be reliable. No representation is made as to its accuracy or completeness.
To ensure compliance with U.S. Treasury Regulations governing tax practice, we inform you that any U.S. federal tax advice contained in this communication, including any attachments, is not intended or written to be used, and cannot be used, for the purpose of (i) avoiding any penalties under U.S federal tax law, or (ii) promoting, marketing, or recommending to another party any transaction or matter addressed herein. PFM Asset Management LLC cannot provide legal advice, and appropriate professionals should be consulted if such issues are involved. PFM Asset Management LLC is registered with the SEC under the Investment Advisers Act of 1940. A copy of our Form ADV, Parts 2A & 2B is available upon request.

© PFM 29
Thank You