book 1: concept, principles and practice · designing water supply and sanitation projects to meet...
TRANSCRIPT

Designing water supply and sanitation projectsto meet demand in rural and peri-urban communities
Book 1:Concept, Principles and Practice


Designing water supply
and sanitation projects
to meet demand in rural and
peri-urban communities
Book 1.
Paul Deverill, Simon Bibby,Alison Wedgwood & Ian Smout
Water, Engineering and Development CentreLoughborough University
2002
Concept, Principlesand Practice

iv
Water, Engineering and Development CentreLoughborough University
LeicestershireLE11 3TU UK
© WEDC, Loughborough University, 2002
Any part of this publication, including the illustrations (except items takenfrom other publications where the authors do not hold copyright) may be copied,reproduced or adapted to meet local needs, without permission from the author/s
or publisher, provided the parts reproduced are distributed free, or at cost andnot for commercial ends, and the source is fully acknowledged as given below.
Please send copies of any materials in which text or illustrations have been used toWEDC Publications at the address given above.
A reference copy of this publication is also available online at:http://www.lboro.ac.uk/wedc/projects/d4d.htm
Deverill P., Bibby S., Wedgwood A. & Smout I. (2002)Designing water supply and sanitation projects to meet demand
in rural and peri-urban communitiesBook 1: Concept, Principles and PracticeWEDC, Loughborough University, UK.
ISBN Paperback 1 84380 006 3
This document is an output from a project funded by the UKDepartment for International Development (DFID)
for the benefit of low-income countries.The views expressed are not necessarily those of DFID or the other organisations who
contributed to the development of these guidelines.
Designed and produced at WEDC
Printed by John Price & Sons

v
Cover photographs:Top left: Partners in Development cc (South Africa)
Top right: John Holmes/WaterAid (Nepal)Bottom left: Sohrab Baghri/WEDC
Bottom right: Partners in Development cc (South Africa)

vi
Acknowledgements
The financial support of the Department for International Development of the BritishGovernment is gratefully acknowledged. The authors would also like to thank the many
organisations and individuals that have contributed to the development of these guidelines,without whose interest and participation this work could not have been undertaken.
South AfricaThe Mvula Trust
Department of Water Affairs and Forestry, Pretoria
Partners in Development cc, Pietermaritzburg
Watsup Development, Johannesburg
IndiaUNICEF WES; New Delhi, Orissa and Madhya Pradesh
Rural Water Supply and Sanitation Department, Ganjam District, Orissa
United Artists Association, Ganjam District, Orissa
Mike Webster, Water and Sanitation Programme, New Delhi
NepalNepal Water for Health (NEWAH)
Department of Water Supply and Sewerage, Kathmandu
Rural Water Supply and Sanitation Fund Development Board, Kathmandu
UNICEF WES, Kathmandu
Gurkha Welfare Scheme, Pokhara
Self Reliant Drinking Water Support Programme, Pokhara
Rural Water Supply and Sanitation Support Program, Butwal
Lumanti, Kathmandu
Greg Whiteside
TanzaniaOxfam (GB); Dar es Salaam and Shinyanga
WaterAid; Dar es Salaam and Dodoma
Concern Worldwide, Dar es Salaam
WAMMA, Dodoma
Finally, the authors wish to acknowledge Kevin Sansom and Sue Coates for their inputs
and suggestions, and the patience and skills of Glenda McMahon of the
WEDC Publications Office.

vii
Who should read this booklet?
This book has been specifically written for practitioners responsible forimplementing water supply and sanitation projects in rural and peri-urbanareas.
Practitioners include engineers and technical staff, social facilitators,financial and gender specialists and project managers, with different rolesand responsibilities within the project framework. In order to be able to use�demand�, it is essential that individuals work as in a multidisciplinary team- together with the communities involved. The concept of meeting demanddoes not belong to any particular profession.
How to use this booklet
The objective of this book is to develop an understanding of what is a fairlycomplex issue. As far as possible, jargon has been avoided. The glossaryhelps explain some of the terminology used.
The information provided in Part II also includes a number of practicaltools and checklists. These can be extracted and adapted to enhance anexisting strategy, taking into account the local situation and the capacityavailable.

viii
Contents
Who should read this booklet? viiHow to use this booklet viiAbbreviations x
Part I - Concept and Principles 1Summary 2
1. Background 5
2. Perceptions of demand 72.1 Demand as a technical design parameter 72.2 Demand and willingness to pay 82.3 Demand as an expression of a human right 92.4 Defining demand 112.5 Stimulating demand 12
3. Meeting demand 153.1 Factors which determine demand 153.2 Providing users with choice 183.3 The need for effective communication 19
4. Demand assessment 214.1 Investigating coping strategies 214.2 Demonstrations of demand 224.3 User participation in option development 254.4 Contingent valuation 25
5. Additional factors to consider 27
6. Principles of meeting demand 29
Part II - Practice 31Summary 32
7. The project process 357.1 The special case of sanitation 367.2 Packaging water supply, sanitation and hygiene 40

ix
8. Preparing a project strategy 418.1 Investigating the enabling environment 438.2 Assessing likely demand 458.3 Seasonality 498.4 Communications 518.5 Reviewing potential options 518.6 Obtaining donor approval 53
9. Selecting where and when to work 55
10. Developing a community plan 6110.1 Defining the problem 6210.2 Identifying potential options 7810.3 Developing potential options into real options 8010.4 Costing, pricing and subsidies 99
11. Implementing a community plan 11911.1 Presenting and agreeing options 12011.2 Using demonstrations of demand 12111.3 Preparing management for its future role 126
12. Operation 13512.1 Principles of community based M&E 13512.2 Demand related indicators for managers 13612.3 Types of M&E tools 13912.4 Concluding points 140
13. Implications for engineers 14113.1 Introduction 14113.2 The engineer’s role 14113.3 Providing users with options 14413.4 Summary: knowledge, skills and attitudes 148
References 153
Glossary 157
Annex A: Table of annuity factors 165Annex B: Community monitoring forms 167Annex C: Suggested reference books for engineers 171

x
Abbreviations
AF Annuity factor
CVM Contingent valuation methodology (see glossary).
DFID Department for International Development (UK)
DWAF Department for Water Affairs and Forestry (South Africa)
ERM Environmental Resources Management Ltd (UK)
GTZ Gesellschaft für Technische Zusammenarbeit(German Federal aid agency)
IIED International Institute for the Environment andDevelopment (UK)
M&E Monitoring and evaluation
NEWAH Nepal Water for Health
NGO Non Governmental Organisation
O&M Operation and maintenance
pcd per capita day (per person per day)
PHAST Participatory Hygiene and Sanitation Transformation(see glossary)
PREPP Participation, Ranking, Experience, Perceptions andPartnership (see glossary)
SL Sustainable Livelihoods
SWOC Strengths, weaknesses, opportunities and constraints
UNICEF WES United Nations Children’s Fund/Water and EnvironmentalSanitation Programme
VIP Ventilated Improved Pit Latrine
WEDC Water, Engineering and Development Centre (UK)
WHO World Health Organisation
WSSCC Water Supply and Sanitation Collaborative Council

1
PART I : CONCEPTS AND PRINCIPLES
Part I:Concept and Principles
�The freedom to make and continue making choices isperhaps the greatest single index of well being�
Opening line of Professor Tom Kirkwood�s 4th Reith Lecture,25th April 2001
Designing water supply and sanitation projectsto meet demand in rural and peri-urban communities

2
DESIGNING TO MEET DEMAND
Concept and Principles: Summary
The principal lesson from the International Drinking Water and Sanitation Decadewas that progress and continuing success depend most on responding to con-sumer demand1. Other evaluations have concluded that water supply and sanita-tion systems that have not met demand have problems of under-use, poor main-tenance and poor cost recovery.
Despite the considerable achievements of the water supply and sanitation sector,a change in strategy is needed to improve the use and sustainability of the serv-ices provided - one that recognises the fundamental importance of user demand.
Defining demand
In these guidelines, demand is defined as an informed expression of desire for aparticular service, assessed by the investments people are prepared to make,over the lifetime of the service, to receive and sustain it. These investments mayconsist of financial and economic resources as well as the time and interest thatusers are prepared to commit.
The definition enables demand to be used as a practical tool to guide projectdesign. It is important to understand what this implies:
! People should make key decisions about the services they are to receive.To do this, they must be informed about the complications of the choicesthey make.
! Demand reflects individual perceptions and priorities, many of which areexpressed at household level. To meet demand, projects need to focus onhouseholds as well as communities, taking into account the different de-mands of men and women.
! Meeting the demand of some users for higher levels of service may resultin others being deprived. This may discriminate against those less able toarticulate their demands unless precautions are taken.
! The poorest people in society have very limited access to the resourcesthat could be used to indicate demand. What little they have may be fullycommitted as part of a day to day survival strategy. A welfare approachmay still be needed to ensure the most vulnerable in a community are notexcluded.

3
PART I : CONCEPTS AND PRINCIPLES
These points reinforce the importance of using a number of appropriate indicatorsto measure demand at different stages of the project process.
Meeting demand
Demand is met by enabling people to choose their preferred service from a rangeof feasible options. Collective decision making is required when individual choiceis not practical. The final form the service takes will often emerge through nego-tiation, reflecting social, technical, environmental, financial and institutional con-straints.
For project staff, a key challenge is to identify, develop, cost, test and communi-cate feasible options which have the potential to meet demand. This process isguided by demand assessment, for which a variety of techniques can be used.
In some cases, demand must be stimulated before it can be responded to. Thissituation is often encountered when sanitation improvements are being consid-ered. Such situations pose a number of challenges to project staff. Modifyingpeople�s perceptions requires very different skills to those needed to implement awater supply project, and can also take a great deal of time.
In practical terms, hidden or latent demand may be stimulated by promotingoptions with characteristics that people find desirable, at a price they are willingto pay. The technique, is known as social marketing.
Enhancing an existing approach
It is recommended that the demand �factor� is incorporated into an existing ap-proach, improving its impact and sustainability. The extent that this can be donelargely depends on the capacity and resources available and the project�s policy,institutional and legal environment. Nevertheless, in most cases there is consid-erable potential for an implementing organisation to develop an appropriate, de-mand responsive project strategy. The eight guiding principles of meeting demandthat conclude Part I provide a framework for change.
1: Cairncross (1992)

4
DESIGNING TO MEET DEMAND

5
PART I : CONCEPTS AND PRINCIPLES
1. Background
The principal lesson from the International Drinking Water and SanitationDecade, according to Cairncross (1992), was that “progress and continuingsuccess depend most on responding to consumer demand”. Other evaluationshave concluded that water and sanitation systems that have not met demandhave problems of under use, poor maintenance and poor cost recovery.
Such findings have resulted in the emergence of a number of demand respon-sive or demand driven approaches. Whilst these are now being implementedand, in some cases, scaled up, it is too early to say how effective they will be interms of their longer-term impact and sustainability.
Meanwhile, differing opinions of what demand is, and how it can be ex-pressed and assessed, have fuelled a largely ideological debate. Attention hasbeen rightly focused on the potentially negative impact that demand respon-sive approaches may have on those least able to express their demands.
Irrespective of this legitimate concern, one fact is clear. After several decadesof consolidated development effort and billions of dollars of investment inwater supply and sanitation, a great deal remains to be done (see Box 1.1).Despite the considerable achievements in both practice and policy in thewater supply and sanitation sector, more is needed to improve the sustainabilityand use of the services being provided.
Demand for water supply and sanitation should be seen in this context. Firstof all, we need to understand what we mean by "demand". This is particularlyrelevant when one considers that the majority of those without access toimproved water supplies and sanitation are the poor who may find it difficultto voice their demand.

6
DESIGNING TO MEET DEMAND
Box 1.1. The global situation: water supplyand sanitation
�At the beginning of 2000 one-sixth (1.1 billion people) of the world�s populationwas without access to improved water supply and two-fifths (2.4 billion people)lacked access to improved sanitation. The majority of these people live in Asiaand Africa. Fewer than one-half of all Asians have access to improved sanitationand two out of five Africans lack improved water supply.
Moreover, rural services still lag far behind urban services. Sanitation coverage inrural areas, for example, is less than half that in urban settings, even though 80%of those lacking adequate sanitation (2 billion people) live in rural areas � some1.3 billion in China and India alone.
These figures are all the more shocking because they reflect the results of atleast twenty years of concerted effort and publicity to improve coverage�.
WHO (2000)

7
PART I : CONCEPTS AND PRINCIPLES
2. Perceptions of demand
The concept of being able to respond to user demand is made more compli-cated by the differing perceptions of what is meant by demand. These tend toreflect the profession and ideology of the person concerned.
2.1 Demand as a technical design parameter
Many engineers and technicians use ‘demand’, or more specifically waterdemand, to describe the quantity and quality of water that users consume orare expected to consume. This is associated with the level of service to beprovided.
Water demand is an important technical design parameter. It can be measured(for an existing water supply) or calculated using local data or, more typically,established norms and standards. Such calculations also take into account thenumber and type of users to be served, the anticipated population growth rateand the expected life span of the infrastructure being provided. It is alsoimportant to take into account the seasonal influence on water demand. Thiscan be considerable, especially in rural areas where water is used to supportpeople's livelihoods.
Level of service or service?
The term level of service (or service level) is used to describe the quality of theservice being provided to users. This is often associated with physical infrastruc-ture, for example, a communal tap, a yard tap, or an in-house private connec-tion.
The word service has a more general significance, as it not only takes into ac-count service levels, but also how these are managed and sustained.

8
DESIGNING TO MEET DEMAND
The influence price has on consumption is often not considered by technicalstaff, other than by applying an assumed rule which suggests that users areable to afford between 3% and 5% of their income to sustain a basic service.Apart from the difficulties of establishing household income and the fact thatit may vary significantly from household to household, the rule has beendiscredited1.
In practice, the impact and sustainability of a water supply scheme may becompromised because actual consumption is significantly more (or less) thanthe anticipated water demand. For example, people may want to use water fora variety of productive uses. This may lead to communal standpipes being'upgraded' with hosepipes. In other cases, households may switch to tradi-tional supplies when water is widely available.
2.2 Demand and willingness to pay
Used in an economic sense, demand has a very different significance, beingequated with a person’s willingness to pay for a specified good or service.Demand expressed in this way is often termed effective demand. Although theword ‘pay’ could refer to any financial or economic contribution, in practice itis usually equated with a cash payment.
This interpretation of demand implies that improved water supply and sanita-tion services are economic goods. Certainly, with some exceptions, govern-ments in the developing world cannot afford to provide or sustain water andsanitation services without economic support. At the same time, there isstrong evidence that many people are prepared to make significant economiccontributions to receive services and service levels they desire.
By reflecting how people value an improved service, willingness to pay is amore reliable measure of demand than one based on an assumed level ofaffordability. Furthermore, various techniques have been developed to meas-ure willingness to pay, associated with the presentation of a number ofoptions. These facilitate its use as a practical design tool.
1 See for example World Bank (1993). This shows that the proportion of income users spend on water varies
considerably depending on local perceptions and circumstances. The research concludes that income is only one of
many determinants of demand.

9
PART I : CONCEPTS AND PRINCIPLES
In spite of these arguments, there are legitimate concerns that such an ap-proach may marginalise those least able to express their demands in the wayor ways required - poor households and women in particular. Such groups areoften unable to participate in decision making and influence the options onoffer. At the same time, they may lack access to, or control over, the financialor economic resources used to measure their demand. It is these sections ofsociety that remain largely unreached by most development projects.
2.3 Demand as an expression of a human right
Many of these issues are reflected in the rights based approach to develop-ment. The international human rights framework includes the right to astandard of living adequate for health and well-being2, something that isimplicit in the Millenium Development Goals3. This can only be achievedwith access to safe water, adequate sanitation and an awareness of the associ-ated health and hygiene issues.
It is debatable whether basic rights such as access to safe water and sanitationshould be paid for by government (financed through some form of crosssubsidy or taxation) or paid for by the individual concerned. Exceptionally,the Government of South Africa is now committed to provide free basicwater4 to all its citizens.
By way of contrast, the principles endorsed at the 1992 International Confer-ence on Water and the Environment in Dublin require that affordable waterand sanitation services be provided as a human right5.
2 The 1948 United Nations Universal Declaration of Human Rights refers to ‘an adequate standard of living’,
although the term ‘adequate’ is undefined.
3 Millenium Development Goals relating to water supply include halving the proportion of people who do not have
access to affordable safe water by 2015.
4 In South Africa, ‘basic’ refers to supplying each household with 6,000 litres of potable water per month from taps
located within 200m of the dwelling. This is equivalent to 25 litres per capita day (pcd) for a family of eight. In
practice, the extension of this policy to some rural areas is requiring a rethink of the 6,000 litre/200 metre standard,
which is not always achievable.
5 A summary of the Dublin Statement and its four guiding principles agreed at the International Conference on
Water and the Environment in January 1992 can be found at http://www.dfid.gov.uk/.

10
DESIGNING TO MEET DEMAND
Since Dublin, the human rights agenda has advanced. Whilst access to basicservices remains a fundamental concern, attention is now focused on how thiscan be achieved and in particular, how poor people can be engaged indevelopment processes which affect their lives.
The human rights policy developed by the Department for InternationalDevelopment (DFID) is based on three cross-cutting principles:
Participation: enabling people to realise their rights to participate in, andaccess information relating to, the decision making processes that affect theirlives.
Inclusion: building socially inclusive societies, based on the values of equal-ity and non-discrimination, through development which promotes all humanrights for all people.
Fulfilling obligation: strengthening institutions and policies which ensurethat obligations to protect and promote the realisation of all human rights arefulfilled by states and other duty bearers.
DFID (2000)
In this context, it is important to note that human rights include the right tocontinuous improvements to living conditions and livelihood (Hausermann,1999). Water and sanitation projects should be designed accordingly, under-lining the importance of upgradable levels of service.
Whether associated with meeting basic needs or providing opportunities forself-development, the rights based view of demand emphasises the impor-
The 4th Dublin principle
�Water has an economic value in all its competing uses and should be seen as aneconomic good. However, it is recognised that within this principle, it is vital torecognise the basic right of all human beings to have access to clean water andsanitation at an affordable price�

11
PART I : CONCEPTS AND PRINCIPLES
tance of ensuring that people are not treated as passive beneficiaries but aregiven a central role in decision making about the services and service levelsthey require.
2.4 Defining demand
Technical, economic and rights based views of demand are all valid in theirspecific context, but their use by different professionals involved in the sameproject can cause confusion. An unambiguous definition of demand is neededif the concept of designing to meet demand is to have any practical meaning.The definition used should satisfy a number of criteria:
! It should reflect how people value improved services rather than being basedon external assumptions.
! It should stress the importance of users taking key decisions about the serv-ices and service levels they require.
! It should be applicable to vulnerable groups and individuals, above all, thepoor and women who are often excluded from decision making.
! It should be practical, with expressions of demand being used as a tool toguide project design.
The investments used to assess demand may consist of natural, economic,financial, human and social resources. Examples include the time and com-mitment used to plan, develop and sustain a water supply or sanitation project.Three additional points need emphasising:
What is demand?
In these guidelines, 'demand' is defined as an informed expression of desire for aparticular service, assessed by the investments people are prepared to make,over the lifetime of the service, to receive and sustain it.

12
DESIGNING TO MEET DEMAND
! People must be informed of the characteristics of the services or facilitiesbeing offered and the implications of their choice. The latter includes allthe inputs needed to receive and sustain a service.
! Meeting the demand of some users for higher levels of service may result inothers being deprived. This could easily discriminate against those less ableto articulate their demands unless specific precautions are taken.
! The poorest people in society have very limited access to the various re-sources that could be used to indicate demand. At the same time, what littlethey have may be fully committed as part of a day to day survival strategy.In such cases, it may be inappropriate for project staff to rely only on indi-cators of demand in the way described. A welfare approach may still beneeded to ensure that the most vulnerable in a community are not excluded.
These points reinforce the fact that demand has important poverty and genderimplications, factors which in practice are all too easily overlooked. Projectstaff must ensure that they are using indicators of demand that are appropriatefor all the users concerned. Emphasis must be placed on establishing who is atrisk of being marginalised. The poorest members of a community may need alocally appropriate, carefully targeted subsidy.
2.5 Stimulating demand
In Section, 1 it was pointed out that more people lack access to hygienicsanitation than remain without a safe, affordable water supply. Fundamentally,demand for sanitation may be weak because the perceived benefits of theimprovements being offered do not compensate for the perceived costs.
The same may also apply if water quality is an issue. In some cases, peoplemay prefer to use a contaminated water source for convenience, financial,cultural or aesthetic reasons. Demand for a safer water supply may need to bestimulated before users value it above a more risky alternative.
Stimulating demand involves developing and promoting options which em-body the characteristics that people find most desirable, at a price they are

13
PART I : CONCEPTS AND PRINCIPLES
willing to pay (a technique known as social marketing). Even so, a traditionalpractice or perception, may take years to change. More often than not, people'sbehaviour is modified over a period of time by their increasing exposure to thebenefits of using an improved service. Further details of demand stimulationare provided in the following box.

14
DESIGNING TO MEET DEMAND
Latent demand:
Demand that is not initially evident but revealed after people become awareof the potential benefits of an improved service. The improvements offeredshould reflect local (rather than external) perceptions of what is desirableand affordable.
Demand stimulation can be achieved by social marketing, a strategy that drawson conventional marketing techniques, albeit without an overriding profit motive.The strategy emphasises promoting the characteristics of a service that peoplefind most attractive, at a price they are willing to pay. In the case of sanitation,these characteristics may include privacy, security, convenience, status and com-fort, as well as potential health benefits. There is a risk that hygiene could be-come uncoupled from sanitation by pursuing such a strategy, and an appropriatehygiene promotion strategy would also be needed.
Demand stimulation involves changes in perception and behaviour, and this needstime to take hold. Once stimulated, demand can take off. For project managers,the challenge is how to devise a sustainable supply mechanism that can meetlatent demand that is revealed in the future, long after project staff have left thescene.
Demand stimulation
In some cases, demand for sanitation or water supply may be weak or non-existent because the perceived benefits of whatever is being offered are out-weighed by the investments needed to receive and sustain it.
! In practice, perceptions may be poorly informed, or biased by the poorperformance of past schemes or organisations.
! Alternatively, whatever is being offered is not based on people�sperceptions of what is desirable.
In either case, demand for improved services may exist, but only in a hidden orlatent form. The issue is how to unlock or stimulate latent demand.

15
PART I : CONCEPTS AND PRINCIPLES
Men tend to dominate household decision-making. Project staff have toensure that the demands of women are not overlooked as a result. This maymean establishing alternative mechanisms for women to articulate their de-mand.
3. Meeting demand
3.1 Factors which determine demand
Demand for water supply and sanitation is determined by a range of factors(see Figure 3.1), shaped by individual priorities and perceptions. Many indi-vidual demands are expressed at household level. Demand responsive projectsshould therefore focus on households. Inevitably, solutions may have to benegotiated at community or neighbourhood level, implying the need forcollective decision making and skilled negotiation.
Figure 3.1. Main determinants of demand
User Related
Livelihood strategy
Security of tenurePhysical security
Economic securityIncome
Opportunity cost of timeEducation level
Gender
Service Level Related
Desirable characteristics(attributes) of the
facilities being offered
Perceptions of relativecosts
Performance
Relationship to production
Price
Upgradability
Service Related
Perceptions of service andsuppliers
Sense of ownership
Accountability &transparency
The form any contributiontakes
How and whencontributions are made
Demand" " "

16
DESIGNING TO MEET DEMAND
Of the factors identified in Figure 3.1, three in particular require furtherelaboration:
1. Service level and priceIt is sometimes assumed that users will automatically want the cheapest levelof service on offer. In fact, there is strong evidence that suggests that manypeople want - and are willing to pay for - higher levels of service.
For example, many people in peri-urban areas may opt to buy water fromvendors rather than queue at a standpipe, possibly because this gives themtime to engage in economic activities, or simply to reduce the drudgery andburden associated with fetching water. Similarly, in rural areas, some familiesliving in homes made of traditional materials prefer to save up for a toilet witha cement block superstructure, rather than choosing a more affordable alterna-tive.
2. GenderThe demands of men and women are rarely the same. Men and women oftenvalue the benefits of water and sanitation very differently, reflecting theirspecific roles and interests. In many cases, it is women who make the associ-ated investment rather than men.
For example, in some cultures ‘voluntary labour’ and local materials are oftensupplied by women. Many women also pay for water with their own earnings,particularly if water is sold by the container at water points. Despite this, manystudies have focused on investigating demand expressed by heads of house-holds - usually adult males. Projects should reflect the demands of men andwomen, taking into account gender differences and the difficulties that womenface in making their voices heard.
Parallel to the social and economic gender differences, the service levelsoffered should also reflect the different physical requirements of men, womenand children. For further details see WEDC (forthcoming).
3. Relationship to productionImpact studies such as those undertaken by WaterAid (2001) have reinforcedthe important relationship between demand and the productive use of water. Ifwater is provided in a form in which it can be used productively, for example,

17
PART I : CONCEPTS AND PRINCIPLES
to irrigate a kitchen garden, water livestock or manufacture building blocks,demand is likely to be higher.
The relationship between demand and production can be reinforced by thetime savings associated with improved access to water. These provide the timeto undertake such activities - as long as sufficient water is available. Clearly,environmental and other constraints must be taken into account, whilst projectstaff must ensure that women are not over-burdened as a result.
The importance of linking people, their economic activities and their environ-ment is reflected in what is known as the sustainable livelihoods (SL) ap-proach. This is summarised in the following box.
Demand and the sustainable livelihoods approach
A livelihood can be seen as the capacity, assets (a combination of social, human,financial, natural and physical resources) and activities needed to support a par-ticular way of living.
The sustainable livelihoods (SL) approach uses this conceptual model as a frame-work to guide interventions. These are designed to have the greatest possibleimpact on poverty reduction, providing people with increased opportunities. Somemeasures focus on improving an asset base, reducing people�s vulnerability tounexpected events, seasonal problems and longer term trends. The influence ofother measures is less direct, focusing, for example, on policy change.
Using demand to guide project design can complement a SL approach, espe-cially if policies support the provision of services for productive as well as health-related uses. For example, improved access to water can result in significanttime-savings. The time saved, often by women, can be used productively - as canthe water itself. Sanitation improvements, coupled with appropriate changes inhygiene behaviour, may reduce people�s vulnerability to the impact of diarrhoealdisease.
Studies such as those conducted by WaterAid (2001) have also shown that time-savings and better sanitation result in stronger family bonds. In the livelihoodssense, strong social networks are also considered a resource. In summary, inter-ventions are likely to support the livelihoods framework if they genuinely reflectpeople�s demands.

18
DESIGNING TO MEET DEMAND
3.2 Providing users with choice
Demand is met by enabling users to decide the type and form of service theyare to receive. To achieve this, a number of potential options need to beidentified and developed. These should reflect user perceptions and priorities,taking into account opportunities and constraints. This is shown schematicallyin Figure 3.2.
Relating demand to a service (rather than a level of service) has importantconsequences. Individually, users should be able to choose the level of servicethey desire and are prepared to sustain. Collectively, users should also be ableto determine how resources are allocated, how a service is to be managed, andhow contributions are to be made.
Financialconstraints
Technicalfactors
Environmentalfactors
Policies, plansand legislation
Social andcultural norms
Perceptionsand priorities
POTENTIALOPTIONS
Institutionalcapacity
Figure 3.2. Factors to consider when identifying potential options.Adapted from IRC (1997)

19
PART I : CONCEPTS AND PRINCIPLES
Once user preferences are known, these can be reflected in the project design.In practice it may be difficult or impossible to satisfy every choice, and adegree of consensus and compromise is inevitable.
3.3 The need for effective communication
Effective communication between users and project staff is vital if demand isto be met. For decision making to be meaningful, all users must be informedof the characteristics of each option and the broader implications of theirchoice. More generally, communities need to know how to contact organisa-tions responsible for implementing projects. This can be a particular problemin remote rural areas.
For their part, project staff must be able to identify and measure appropriateexpressions of demand. The final design may have to be negotiated, balancinguser demands with what is technically feasible, environmentally sustainable,institutionally supportable and economically justified.
Perceptions of being able to communicate easily with households, individu-ally and collectively, may be optimistic. Many people find it difficult toparticipate: the poor often have to work long hours away from home, whilstwomen can be culturally inhibited from attending meetings or expressing theirviews. The poor are also the least likely to have the confidence to comeforward and articulate their demand.
Skilled facilitation is therefore required (as well as additional time) to seek outthe disadvantaged and ensure their inclusion. Engineers must be willing andable to become involved in a constructive dialogue with users. This involvesan exchange of technical ideas and concepts, adopting an advisory rather thanan instructive role. For this reason, most engineers would benefit from train-ing in the use of participatory techniques. Equally, social facilitators may needa basic understanding of technical issues.

20
DESIGNING TO MEET DEMAND

21
PART I : CONCEPTS AND PRINCIPLES
4. Demand assessment
Having defined demand and considered how it can be met through theidentification and development of an appropriate selection of options, it isimportant to consider how demand can be assessed. A number of techniquescan be used:
! Investigating people’s coping strategies.
! Demonstrations of demand.
! User participation in option development.
! Contingent valuation (this may only be useful for larger projects in peri-urban areas).
Whichever method is used, demand is difficult to assess and may change overthe course of a project. It is therefore good practice to use a number oftechniques to confirm demand.
4.1 Investigating coping strategies
Demand can be predicted by investigating people’s coping strategies relatedto water supply and sanitation. These have been developed by communities,households and individuals to sustain or improve a livelihood. The informa-tion obtained, supported by data from primary and secondary sources, can beused to develop a demand responsive project strategy.
Such an investigation can take the form of a detailed socio-economic survey,in which case it is known as a revealed preference study. Coping strategies canalso be assessed rather less formally, using a number of participatory tech-niques as well as field observations to obtain an overview of likely demandacross a wide area.
In either case, the following information could help predict future demand forimproved services:

22
DESIGNING TO MEET DEMAND
! The amount of time spent fetching water; the volume used, its quality, andwhere and how it is used.
! The type and size of any associated investment, who is making it and howit is made.
! Evidence of community meetings to consider how to sustain or improve anexisting water supply.
! Efforts made, individually or collectively, to maintain or upgrade an exist-ing water supply (this includes unauthorised connections and investmentsin water storage.
! Efforts made to dispose of (or otherwise manage) excreta. This may bedemonstrated by one or two households rather than by the community as awhole. Such ‘positive deviance’ provides project staff with clues as to whatmay be successful.
! Efforts made to improve the household and public environment, for exam-ple, by keeping the area around the home clear of rubbish.
! Expenditure on health, related to the treatment of illnesses associated withinadequate sanitation.
For further details on the use of coping studies to assess demand, see Section8.2.1 in Part II of this booklet.
4.2 Demonstrations of demand
The contributions people make in return for receiving a service provideproject staff with a useful series of demand-based indicators that can be usedto keep a demand responsive project on track. Some examples, used by ourresearch collaborators, are shown in Table 4.1.

23
PART I : CONCEPTS AND PRINCIPLES
Demonstrations of demand can be used by project staff to indicate howeffective the service options being offered will be in terms of meeting commu-nity, household and individual demands. In this respect, it is important toidentify those groups and individuals who are not demonstrating their de-mand, and investigate why this is the case.
Linking contributions with demand
Contributions of cash, time and materials can only be considered as demonstra-tions of demand if they are clearly linked with the service and service levels beingprovided. People have to understand why contributions are needed and how theywill be used.

24
DESIGNING TO MEET DEMAND
Table 4.1. Demonstrations of demand used during the project process
Stage in project process
Project selection
Planning
Appraisal
Implementation
Operation
Demonstration of demand
Application form completed and signed
Community meetings held
Village clean up campaign
Water and/or sanitation committeeappointed
Bank account opened
Focus groups formed and sustained
Participation in baseline data collection
Community action plan prepared
Cash or other contributions made6
Demand tested by users selecting theirpreferred options, knowing the implicationsof their choice.
Contract signed between community,implementing organisation and localgovernment
Contributions of cash, materials, time andlabour linked to specific services andservice levels
Maintenance contributions collected
Upgrading and extending levels of service
6 At this stage of the project, a cash contribution can also be used to indicate a community's ability to organise and
collect payments.

25
PART I : CONCEPTS AND PRINCIPLES
7 A bidding game is designed to establish the maximum an individual is prepared to pay for a specified service. A
number of prices are suggested in turn and the respondent asked whether or not he or she would be prepared to pay
these until the limit is found. This is not as simple as it sounds. There are many factors which may lead people to
give misleading results. For further details see Wedgwood & Sansom (2001).
4.3 User participation in option development
One of the most effective ways to ensure that demand is met is to involve usersin option identification and development. In effect, demand is being continu-ously assessed and responded to as an integral part of the design process.
In order to achieve this in practice, appropriate mechanisms are required thatenable users to participate. For example, representatives of different focusgroups could be appointed to act as a ‘design board’. This is quite differentfrom the idea of a local committee taking managerial decisions; communitymanagement may be one of several management options. For further informa-tion about user participation in option development, including a number ofpractical tools and examples, see Section 10.3.
4.4 Contingent valuation
The last way of assessing demand to be considered is known as contingentvaluation. This involves a range of options being described to users, eitherindividually in the form of a one-to-one interview, or collectively as part of afocus group discussion. Users are then asked to state what they would bewilling to pay in order to receive a particular service. To facilitate this process,those participating may be presented with a range of prices in the form of abidding game7.
Reflecting the importance of linking contributions with the delivery of serv-ices, the quality of the indicators used to demonstrate demand has to bemonitored. For example, in the case of a cash contribution, some householdsmay be forced into making payments by a powerful elite. Alternatively, anunscrupulous contractor could provide all the funds required in return for thepromise of a lucrative contract.

26
DESIGNING TO MEET DEMAND
The prices suggested must reflect the costs of supplying or sustaining anoption. Estimating this can be quite difficult especially if the cost of an optiondepends in part on its popularity.
Contingent valuation8 is often associated with a comprehensive householdsurvey and individual interviews. The results are then processed using statisti-cal methods to identify and rule out bias. Not surprisingly, this process isexpensive and its use in peri-urban and rural areas is somewhat limited.
Recently a number of techniques have been developed combining elements ofcontingent valuation and participatory development. These are less robuststatistically but more practical and affordable to implement. An example isdescribed later on in Section 10.4.2.
8 Contingent valuation is described as such because people are asked to value a number of options that do not at the
time exist. Their response depends on (or is contingent on) these options being delivered as they are described.

27
PART I : CONCEPTS AND PRINCIPLES
5. Additional factors to consider
As previously emphasised, using demand as a tool to design projects haslimitations, many of which concern the potential marginalisation of those lessable to express their demands. A number of other considerations should also betaken into account, some of which are listed below.
! Demand can be influenced by politicians, for example, by promising freewater. Willingness to pay is sometimes negated by a politically based un-willingness to charge.
! The local policy, institutional and legal environment may reflect supply drivenrather than demand driven priorities.
! People may have unrealistic expectations of the level of service they canafford, or may feel that they are entitled to a free service.
! The impact of past experience (for example, concerning the use of one tech-nology) may skew demand in a particular direction.
! Technologies are often associated with economies of scale. Offering a mixof technologies to satisfy demand for different service levels can result inthe least popular becoming unaffordable.
! Water may be required for a variety of purposes. Many water supply projectsfocus on its provision for domestic use only.
! Users may not put much weight on the potential health risks of consumingunsafe water when selecting an option.
! Very poor people will continue to need subsidies. Subsidies will have to becarefully targeted in order that they complement, rather than distort, de-mand.
! Participatory approaches and collective decision making may be dominatedby an elite, in order to favour their interests.
! Demand can change considerably as the population changes and circum-stances and perceptions are altered.
! Options can be very limited, for example in a water-scarce rural area. Insuch cases, decision making about service levels may be limited to siting asingle well or handpump.

28
DESIGNING TO MEET DEMAND
Together, these points make the process of meeting demand complicated andcan add significantly to the time and resources needed to plan and implementa project.
Ultimately donors, policy makers and project staff must decide the extent towhich they can be demand responsive, balancing improved impact andsustainability with the limited capacity, resources and time available. Intro-ducing the demand concept incrementally, and learning from and refining theapproach used, is probably the most effective way forward for many imple-menting organisations. For further details, see Book 2 of these guidelines,Additional Notes for Policy Makers and Planners.

29
PART I : CONCEPTS AND PRINCIPLES
Principles of meeting demand
1. An effective project communication strategy is devised which enablesproject staff to engage with communities, households and individuals.
2. Systems for individual and collective decision-making are established andused.
3. Appropriate indicators of demand are identified and used to assessdemand.
4. Options are identified, developed and priced which:- Are based on user priorities and perceptions of value.- Are socially and culturally acceptable.- Reflect supply costs.- Reflect local and regional development policies and plans.- Are environmentally, technically and financially feasible.
5. People are enabled to make an informed choice of:- How they can participate in a project.- Service level options.- How services are to be allocated, managed and maintained.- How contributions are to be made and managed.
6. Specific provision is made to ensure that all groups and individuals withina community can participate in the process. This ensures that vulnerablepeople such as women and the poor are included and that their demandsare reflected in the services provided.
7. If necessary, demand should be stimulated by promoting the potentialbenefits of the options being offered, ensuring that these options reflectuser perceptions.
8. Facilities are designed and management systems are established whichare capable of responding to future changes in demand.
6. Principles of meeting demand
The points discussed in the previous sections are reflected in a set of eightprinciples. These should help project staff design practical, locally appropri-ate strategies that are also poverty and gender sensitive.

30
DESIGNING TO MEET DEMAND
Within this framework, it is shown how appropriate options which are capable ofmeeting demand can be identified, developed, priced, tested and offered.
The limitations of using demand to guide project design are highlighted in orderthat the concept can be used effectively. Various techniques that can improve theparticipation of vulnerable communities, groups and individuals in decision mak-ing are described. There is however no demand-responsive blueprint. It is up tothose implementing projects to develop an appropriate response, taking into ac-count the local context and their own capacity.
What next?
Part II of these guidelines introduces a typical project cycle. This is �unwound� inorder to form the step-by-step process of development experienced by usersrather than project staff or donors. At each stage it is demonstrated how demandcan be used as a practical design tool to improve the impact and sustainability ofthe services provided.
↓
↓
↓
↓
↓
Key
Prep: Preparing a projectstrategy
Sel: Selecting a communitysub-project
Plan: Developing acommunity plan
App: Appraisal
Imp: Implementation
Op: Operation,maintenance &management
PREP
SEL
PLAN
APP
IMP
↓OP

31
PART I I : PRACTICE
Designing water supply and sanitation projectsto meet demand in rural and peri-urban communities
Part II:Practice
Street drainage in a village in Ganjam District, Orissa.Villagers decided to route the channel between the trees rather than cut them down.
Uni
cef W
ES

32
DESIGNING TO MEET DEMAND
Practice: Summary
In Part II, the conventional project cycle is �unwound� to produce the sequence ofevents that those living in a community experience. At each stage, it is demon-strated how expressions of demand can be used as a tool to guide the projecttowards a more sustainable outcome and services which are used.
Designing for demand therefore concerns the entire project process. It is not justabout the design and delivery of infrastructure. What happens after implementa-tion is critically important for sustainability. Management systems, cost recovery,maintenance and how to upgrade and extend services must be addressed and assuch are fundamental components of the project�s overall design.
↓
↓
↓
↓
↓
Key
Prep: Preparing a projectstrategy
Sel: Selecting a communitysub-project
Plan: Developing acommunity plan
App: Appraisal
Imp: Implementation
Op: Operation,maintenance andmanagement
PREP
SEL
PLAN
APP
IMP
↓OP

33
PART I I : PRACTICE
In Part I of this booklet, demand has been defined as: an informed expression ofdesire for a particular service, measured by the investments people are preparedto make to receive and sustain it. Now Part II demonstrates how project staff canwork with demand to:
! Guide the development of a project strategy.! Help identify which individuals, households and communities are
at risk of exclusion.! Help prioritise communities for development activity.! Appraise a community plan.! Develop a range of options.! Help a local management organisation to sustain the facilities
provided.
In particular, Part II describes how project staff can identify, develop, cost, priceand offer appropriate options which are capable of meeting the demands of allusers.
The engineer�s role
The final section of these guidelines considers the implications of designing tomeet demand, focusing on project engineers. Engineers have traditionally de-rived much of their authority from the technical decisions they make and theimportance of infrastructure. A demand responsive approach can challenge thisstate of affairs. This last section clarifies the engineer�s role, and shows how, forengineers willing to engage with the people they serve, the process can be stimu-lating, challenging and highly rewarding.

34
DESIGNING TO MEET DEMAND
Principles of meeting demand
1. An effective project communication strategy is devised whichenables project staff to engage with communities, householdsand individuals.
2. Systems for individual and collective decision-making areestablished and used.
3. Appropriate indicators of demand are identified and used toassess demand.
4. Options are identified, developed and priced which:! Are based on user priorities and perceptions of value.! Are socially and culturally acceptable.! Reflect supply costs.! Reflect local and regional development policies and plans.! Are environmentally, technically and financially feasible.
5. People are enabled to make an informed choice of:! How they can participate in a project.! Service level options.! How services are to be allocated, managed and
maintained.! How contributions are to be made and managed.
6. Specific provision is made to ensure that all groups andindividuals within a community can participate in the process. Thisensures that vulnerable people such as women and the poor areincluded and that their demands are reflected in the services provided.
7. If necessary, demand should be stimulated by promoting thepotential benefits of the options being offered, ensuring that theseoptions reflect user perceptions.
8. Facilities are designed and management systems are establishedwhich are capable of responding to future changes in demand.

35
PART I I : PRACTICE
7. The project process
For planners, funders and project managers, the project cycle provides a usefulbasis on which to design and implement strategies and programmes (seeFigure 7.1). The continuous sequence reflects an external point of view thatwould not be recognisable to the users themselves.
Figure 7.1: A general project cycle similar to that used by DFID(adapted from WELL, 1998). The 'project' may consist of a number of
sub-projects, each associated with a particular community,explaining the need for selection.
Prep Sel
Plan
App
ImpOp
Eval
Next
Prep: Preparation of projectstrategy
Sel: Community Selection
Plan: Community levelplanning
App: Appraisal of communitylevel plan
Imp: Implementation
Op: Operation, maintenance& management
Eval: Evaluation
Next: Next communitysub-project
KEY

36
DESIGNING TO MEET DEMAND
The terminology used to describe each stage in the project cycle varies fromorganisation to organisation. In these guidelines, the term 'preparation' refersto activities associated with the development of a project strategy. Selection isonly relevant if one has to prioritise on a number of sub-projects.
The emphasis of many externally funded projects tends to encourage imple-menting organisations to view service delivery in terms of the time-boundsupply of infrastructure or other investments. As a result, most emphasis is puton implementation and the construction of infrastructure.
The aim of using a demand based approach is to improve the impact andsustainability of the services provided. This implies that the focus should shiftfrom the donor agency to the users' perspective, and from implementation tooperation9. With this in mind, it is useful to 'unwind' the project cycle, in orderto see things from a user perspective.
Designing to meet demand influences what is undertaken at each stage of theresulting linear process. This is summarised in Figure 7.2.
7.1 The special case of sanitation
The characteristics of sanitation - in particular, domestic sanitation, and watersupply are very different. For example:
! Sanitation is usually a household issue affecting families and individualsrather than communities. In this respect it is a private good. This is re-flected in the allocation of responsibilities in terms of acquiring and main-taining facilities.
! Sanitation practices and related behaviours are often long established, re-flecting cultural and social values to a greater extent than water supply.
9 In the case of sanitation, 'operation' would include the scaling up of service delivery in response to increasing
demand, after project staff have left the area.

37
PART I I : PRACTICE
! Demand for improved sanitation facilities is often weak or non-existentand must be stimulated before it can be responded to. This cannot be aone-off activity. It requires exposure, understanding and behavioural changeover a period of time which often exceeds the project’s timeframe.
As a result, sanitation requires a sustainable supply mechanism that cancontinue to stimulate demand, facilitate the acquisition of latrines by house-holds and promote appropriate hygiene behaviours after the project team hasleft the scene. This is reflected in Figure 7.3, which shows the project processfrom a sanitation perspective.

38
DESIGNING TO MEET DEMAND
Prep
Sel
Plan
App
Imp
Op
Strategy preparation: The project strategy may be informed by an initialassessment of likely demand for service improvements. It should alsoreflect the capacity of the implementing organisation and other keystakeholders to be demand responsive.
Selection: Projects are often made up of a number of sub-projects, eachof which may be associated with a particular community. Resourcesusually dictate that sub-projects are prioritised. Demand can be used asone selection factor.
Planning: Once a community has been selected, options need to beidentified, developed and costed. Willingness to pay for options may betested using demand assessment. Household contributions can be setaccordingly.
Appraisal: Appraisal of the community plan should involve users as wellas the project's funder. This provides the opportunity to ensure that thereis support for the proposed activities as well as demand for the optionsbeing offered.
Implementation: Appropriate demonstrations of demand may be usedby project staff during the implementation phase, indicating whether ornot demand is likely to be met. There are also key opportunities todevelop the capacity of local managers to continue to respond to demandonce the services provided are in use.
Operation, maintenance and management: In terms of sustainability andimpact, this is the most important phase. By this time, managementsystems should have been established that are capable of responding todemand. Local monitoring systems can use demand based indicators toensure that services are being used and sustained.
The project process
Figure 7.2. Summary of the project process

39
PART I I : PRACTICE
Prep
Sel
Plan
App
Imp
Op
Strategy preparation: Institutional responsibilities for sanitation are oftenconfused and may need to be clarified. An initial field assessment caninvestigate existing practices and behaviours and establish what is sociallyand culturally acceptable.
Selection: Rather than use demand for sanitation as a selection factor, itmay be more useful to consider the existing water supply situation. Many of the potential benefits of sanitation and hygiene practices will only berealisable if sufficient water is available.
Planning: Perceptions, priorities and practices need to be assessed inorder to identify and develop the key messages used to stimulate demandand to promote hygiene. Flexible supply mechanisms with the capacityto respond to increasing demand should also be investigated.
Appraisal: It is important to assess how project staff plan to stimulate andrespond to demand for sanitation and promote appropriate behaviouralchanges.
Implementation: Demand can be stimulated by communicating thebenefits of sanitation and explaining how people can access thesebenefits. The presence of latrines in a community can also be animportant demand stimulus.
Operation: Demand for sanitation continues to be stimulated by exposureand is responded to by the supply mechanism developed during theimplementation phase. This process is likely to require mentoring and othersupport.
Additional factors to consider: sanitation
Figure 7.3. Sanitation additional factors to consider

40
DESIGNING TO MEET DEMAND
7.2 Packaging water supply, sanitation and hygiene
Integrating water supply, sanitation and hygiene promotion into a single‘package’ is often justified on impact and efficiency grounds. However, thereis strong evidence that when this is done, sanitation and hygiene are oftenneglected in favour of water supply. Similarly, hygiene is often neglected instand-alone sanitation projects (Leblanc, 2001).
There is no single reason why this is the case. Certainly, the skills required forsanitation and hygiene differ significantly from those needed by water supply,and may not be available. This reflects that whilst water supply is oftenperceived by users as a community issue, sanitation and hygiene are perceivedas individual or household concerns. Furthermore, demand for sanitation isoften weak and needs to be stimulated. As a result, the skills required bypractitioners are social rather than technical.
The issue of demand introduces further challenges to implementing a packageapproach. This is because the project team is expected to carry out three verydifferent tasks in a limited time frame:
! Respond to existing demand (usually associated with water supply).
! Identify and promote appropriate hygiene behaviour change.
! Stimulate demand (in particular, for sanitation).
Evidence from South East Asia suggests that a sanitation programme may takeeight or more years to implement (Mukherjee, 2001). This reflects the timerequired by people to change or adapt long established practices and percep-tions. Many families only decide to improve their sanitation facilities afterthey have seen the benefits being realised by a neighbour or relation who hasone. Inevitably, take up can be slow.
There is a clear risk that project staff and users themselves focus on respond-ing to demand for improved water supplies. Time and resources (both humanand financial) have to be reserved for each of the three activities listed above.Alternatively, water, sanitation and hygiene interventions can be co-ordinatedbut implemented as separate, co-ordinated projects.

41
PART I I : PRACTICE
8. Preparing a project strategy
In many respects, the first step in the project process is one of the mostimportant as it is then that key relationships are forged, responsibilities agreedand a project's aims, objectives and strategy defined. These may be difficult tochange at a later stage. At this stage, project staff undertake a number ofactivities. These are likely to include:
! Agreeing overall project objectives, major activities and outputs.
! Defining overall geographical boundaries for the project area.
! Establishing key institutional linkages, roles and responsibilities.
! Designing activities for each objective, estimating the resources required.
! Establishing the basis for a project management system.
! Identifying and training project staff.
! Agreeing, and if necessary testing the methodologies to be used with projectpartners and stakeholders.
Adapted from Ockelford and Reed (2000).
Such activities should lead to the development of an effective project strategy.However, in order to be effective, this strategy should also reflect demand forimproved services, as well as any major constraints that may limit the abilityof project staff to respond in return.
In this respect, three important measures can be used that can help project staffdevelop an effective demand-based strategy and build their own capacity (andthat of their partners) to respond at the same time. These are:
PREP SEL PLAN APP IMP OP

42
DESIGNING TO MEET DEMAND
1. A detailed investigation of the project's policy, legislative and institutionalenvironment, specifically focusing on the opportunities and constraints re-lated to the demands of users.
2. An initial assessment of demand for service improvements. This may in-volve an investigation of people's coping strategies or, in some cases, theuse of contingent valuation.
3. A review of potential technical, management and contribution related op-tions that may be applicable to the local situation.
Whatever is planned at this stage should take into account the risk of not beingable to proceed with a project or sub-project. In particular, the impact ofraising unrealisable expectations can be very detrimental to a community.Care has also to be taken to balance the quality of the information needed withthe resources required and the risk that the resulting strategy may not beapproved. An overview is needed rather than detail.
Undertaking the measures mentioned exposes project staff and partners to theconcept of demand, strengthening their capacity to be responsive later on inthe project process. Each measure will now be looked at in more detail.
Overview rather than detail
If a project consists of a number of sub-projects (often each of these is associ-ated with a community), it is important to get an overview rather than detailedinformation. This is because the detailed findings from one location may not betransferable to another. Assessing demand using a relatively expensive and loca-tion-specific contingent valuation technique (see Section 8.2.2) should only beundertaken when project staff are confident that work is going to start in thecommunity involved.

43
PART I I : PRACTICE
8.1 Investigating the enabling environment
A project strategy should reflect its 'external' environment, which is made upof policies, legislation and institutions. Together these can have a profoundinfluence (both in terms of opportunities and constraints) on the extent thatexpressions of demand can be used to guide project design.
Whilst some investigations may involve a review of existing data, it is alsoimportant to establish a constructive dialogue with the key stakeholdersinvolved. This provides the opportunity to introduce the project, clarify itsaims and objectives, develop a working relationship and discuss points ofconcern in more detail.
Table 8.1 identifies some of the key issues that could be investigated. Thetable is not exhaustive and may include issues that are not always relevant.

44
DESIGNING TO MEET DEMAND
Table 8.1. Factors to consider when investigating the enabling environment
Issue
Policy
Possible points to be investigated
! What are the local, regional and national priorities andplans related to service provision and water resourcemanagement? Does the proposed project comply?
! Do selection criteria exist to prioritise communities orhouseholds for water supply and sanitation improve-ments? Who selects sub-projects?
! For what purposes may water be provided?
! What is understood by sanitation? Does the word includebroader aspects of environmental sanitation,such as refuse disposal and drainage?
! Are basic service levels for water and sanitation defined?If so, how? Are certain types of technology favoured orproscribed?
! Are institutional responsibilities for service provision andsupport defined? For example, what role could the localprivate sector play in the longer-term delivery of sanita-tion?
! Are contribution levels (towards capital, recurrent andreplacement costs) defined? If so, how?
! What is the current policy on subsidies? Are rules rigid,or is there scope for flexibility and targeting?
! What is the policy on cost limits? How much scope forflexibility is there?
! Are funds available to start up savings and creditschemes designed to make services more affordable?
! What are the technical specifications, norms or stand-ards, applying to:- Infrastructure design and levels of service?- Water quality and quantity?- Ground-water contamination?
! Is the local management organisation authorised topropose, implement and operate projects, form con-tracts, make by-laws, set tariffs and collect payments?
! How effective is the water or sanitation committeeregistration process?
! Is local government mandated to support serviceprovision?
! What is the actual capacity of local government, theprivate sector and non-governmental organisations toplan, implement and sustain projects?
Legislation
Institutional

45
PART I I : PRACTICE
8.2 Assessing likely demand
Assessing likely demand for improved water supply and sanitation services isan important part of formulating a demand responsive project strategy. De-pending on the circumstances, two techniques could be used: an investigationof people's coping strategies and contingent valuation.
8.2.1 Investigating coping strategies
Many water supply and sanitation projects encompass large, diversepopulations, living in a number of communities. These could be rural settle-ments or in the case of a peri-urban area, individual streets or wards. At thisstage, project staff are unlikely to know exactly where they are going to startwork, or even how communities are going to be prioritised.
In these circumstances what is needed is an overview. This should capture thesocial, cultural, economic and physical conditions present throughout theproject area, identifying the coping strategies, knowledge and skills of thepopulation.
The information required can be obtained by direct observation or a detailedsurvey. The latter is sometimes called a revealed preference survey and is anestablished socio-economic technique. The design, piloting and analysis of asurvey is however relatively complex, requiring specialist advice. Neither arethe detailed results obtained transferable from one community to another.
What is a coping strategy?
A behaviour or practice employed by people to maintain or improve an existinglifestyle or livelihood. A study of coping strategies can reveal useful informationabout people's perceptions, priorities and demand for improved services, withoutbuilding excessive expectations.

46
DESIGNING TO MEET DEMAND
Like contingent valuation, it is probably only worthwhile in densely populatedareas and where project staff are confident that the results will be used10. Bycomparison, field observations of coping strategies can cover more ground,raise fewer expectations and still produce good results, especially if supportedby a number of small group discussions and semi-structured interviews.Secondary data could be used to plan the field assessment. Care has to betaken to include a cross section of communities, households or individuals,ensuring that vulnerable groups have not been excluded. The following typeof information could be collected.
Water supply! The amount of time and effort spent fetching water; the quantity used, the
quality preferred and why; and what water is used for.
! Efforts made at household or community level to maintain or improve ex-isting services, including evidence of economic investments being made,upgrading (see below) and organisation (for example, meetings held to con-sider possible improvements).
! The presence of unauthorised connections to an existing piped water sup-ply.
! Evidence of a local welfare system or safety net that helps ensure a degreeof equity in terms of access to water.
Sanitation! Efforts made to improve existing sanitation practices, for example, digging
pits, keeping latrines clean, digging new pits when required and disposingof children's faeces.
! Efforts made to improve environmental sanitation in its wider sense, forexample, keeping the area around the home clear of domestic animals andrubbish.
! Efforts made to improve health, especially that of infants and children. Thisis also related to hygiene promotion.
10 For further information about planning and conducting a revealed preference survey, and the use of surveys in
general, see MacGranahan et al (1997).

47
PART I I : PRACTICE
! The resources, including financial resources, used to treat illness associ-ated with poor sanitation.
General! Economic status of households as communities, possibly based on locally
developed indicators and participatory assessment.
! Details of indigenous decision-making or contribution systems. This maynot be directly related to water supply or sanitation.
! The existence of traditional networks - often a starting point for under-standing exclusion and ensuring inclusion.
! Details of relevant skills and expertise available in the area. Indigenousskills (and the use of local materials or construction techniques) are oftenoverlooked by project staff.
! The existence and capacity of the small-scale private sector to play a role inservice delivery.
Measuring ability to pay
Some projects attempt to estimate demand by measuring people's ability to pay.Rather than establish household income, this may be done by using a number ofsubstitute or proxy indicators which are easier to assess. For example, physicalassets such as a tin roof or a television set may imply a certain standard of living.This is then associated with demand for a particular service level.
In practice it is difficult to assess demand in this way because it makes criticalassumptions about how people value improved services.
Nevertheless, developing an understanding of people's economic status is im-portant for the design of poverty-sensitive strategies. One example illustratinghow this can be done is described in Box 10.9. in Section 10.4.4.

48
DESIGNING TO MEET DEMAND
In terms of developing an effective project strategy, the results from aninvestigation of coping strategies could be used in a number of ways:
! To establish the general characteristics of services (and service levels) thatpeople seem to prefer and why. This may have important implications forstaff training and selection.
! To identify a lack of demand, explore why it is weak, and establish thefocus of measures designed to stimulate demand.
! To establish the type of contribution that people may be willing and able tomake and identify opportunities for cross subsidy.
! To identify the degree and nature of social differentiation that occurs acrossthe project area.
! To identify possible management, contribution and service delivery op-tions.
! To identify appropriate communication channels and media that can beused to initiate a dialogue with potential users.
8.2.2 Contingent valuation
Another technique which could be used to assess likely demand is known ascontingent valuation, in which potential options are described to a sample ofusers. People are then asked to say how much they would be willing to pay11,selecting their response from a range of prices. The process takes the form ofa structured interview between a householder and a trained enumerator.
11 In this context, the word pay does not necessarily mean 'with cash' but may refer to any economic contribution.
What is contingent valuation?
A demand assessment technique based on describing a number of service op-tions to potential users and asking how much they would be willing to pay toreceive or sustain them.

49
PART I I : PRACTICE
At this stage in the project process, contingent valuation has limited applica-tion. The technique normally requires a degree of expertise above that re-quired by a revealed preference survey (see Section 8.2.1). This makes itrelatively expensive. At the same time, the detailed results obtained may notbe transferable to other communities. Finally, contingent valuation can onlybe used if:
! Project staff have established a range of feasible options which are likely tocapture demand.
! Project staff can provide users with a good estimate of how much theseoptions will cost.
In some cases, this information may be available - for example, this may bethe case in a town where the existing piped water supply is to be extended intoa previously 'unserved' ward12. In most peri-urban and rural areas, however,demand assessment based on a more general study of people's copying strate-gies will be the better choice. Contingent valuation can also be used toconfirm demand for fully developed options later on in a project. This isdescribed in Section 10.4.2.
8.3 Seasonality
People's priorities, preferences and their demand often depends on the seasonor time of year, especially in rural areas. A useful tool that can be used toinvestigate this relationship is called the social calendar. This is based on theparticipatory development of a graphical chart or timeline in which activitiesare described for each season. One example, extracted from GTZ's handbookon gender sensitive participatory approaches (GTZ, 1995) is shown in Figure8.1. This shows the different tasks undertaken by men and women.
Seasonal and gender sensitive information of this sort can be used to plan howto implement a project. This has been done by the Rural Water Supply andSanitation Fund Development Board in Nepal: its three-year implementationcycle is designed to fit the availability of resources in the Himalayan foothills.Communities are encouraged to adapt the implementation framework pro-
12 For an example demonstrating the use of contingent valuation in Lugazi, Uganda, see the report by Whittington
et al (1998).

50
DESIGNING TO MEET DEMAND
vided to suit their unique circumstances. This is particularly important forlatrine construction which is often confined to a particular season. This isreflected in Figure 8.1, which suggests that men and women may have moretime to undertake such tasks between planting and harvesting their crops. Thisshould be continued by follow up discussions.
Figure 8.1. An example of a seasonal calendar (source: GTZ, 1995).
This information can be used to develop an implementation strategy.The calendar shows the seasonal workload for both men and women.Collecting water was seen as a domestic activity and has not beenshown in this chart.

51
PART I I : PRACTICE
8.4 Communications
Visiting the field at this stage is essential to develop an effective projectcommunication strategy that facilitates dialogue between users and projectstaff. This is critically important if expressions of demand are to be used lateron in the project. At the very least, project staff should be aware of all thecommunities located within the project area, where they are and how to reachthem physically. It is especially important to identify smaller, informal orremote settlements that may not feature in secondary data.
The various socio-economic groups that exist within communities should alsobe identified, together with appropriate opportunities for dialogue. The lattershould build on existing practices, such as people's attendance at a regularmarket, a mobile clinic or a pension day. Project staff should ensure thatopportunities are identified which enable them to communicate with allsectors of the community, including women and the poor.
8.5 Reviewing potential options
Other than investigating the enabling environment and conducting an initialassessment of demand, the third demand related measure associated withproject preparation is an option review. It is recommended at this stagebecause it may be very difficult to undertake once detailed planning hasstarted in terms of time and resources required.
The concept of providing people with an appropriate and environmentallysustainable choice of options is central to meeting demand. Our research hasshown that few project staff have the breadth of knowledge or experience tobe able to offer these options. It therefore makes sense to build the capacity ofthe implementing organisation before detailed planning starts.
To initiate this process, project staff must be aware of the characteristics of awide range of technical, management and financial options. This is not simplya question of 'knowing the technology' as described, for example, in a watersupply textbook. Project staff should know the basic characteristics that arelikely to influence people's decisions; the various inputs required to use andsustain an option; and the wider implications for the environment and otherpeople living in the area.

52
DESIGNING TO MEET DEMAND
Project staff can be encouraged to develop their own set of 'option fact sheets'.These can be based on data obtained during a field assessment and, ifnecessary, a resulting review of potential options. The process itself buildscapacity and can provide the project team with a valuable resource.
An example of this comes from the Kalahandi Water and DevelopmentProject in Orissa, undertaken by Save the Children Fund UK (Box 8.1). In thiscase the information collected was limited to technical options, but it providedthe project team with the knowledge and skills to offer people a choice ofservice levels.
Box 8.1. The Kalahandi Water andDevelopment Project - technical review
The Kalahandi Water and Development Project, supported by Save the ChildrenFund (UK), was originally designed as a poverty focused but largely supply drivenproject. One of its objectives was to improve access to safe water in some of themost remote areas in the District.
The project focus was initially on boreholes and hand pumps, but this did notreflect the practical, financial and institutional difficulties of sustaining these op-tions. Following a rapid appraisal conducted in 80 villages, it became evidentthat the local population faced a range of problems. This led to a review oftechnical options.
The aim of the review was to develop a portfolio of generic solutions that couldbe developed locally. Protected wells, filter wells, hand pumps, rain-water har-vesting, borehole rehabilitation, drilling techniques and in-house treatment op-tions were all investigated. Visits were made to adjoining districts and states,whilst additional work focused on determining capital and recurrent costs. Thefinal document became a valuable source of information for the activities thatfollowed.
In retrospect, what was missing was insight into people's priorities, perceptionsand coping strategies. This reinforces the point that a technical review cannot becompleted in isolation but must be based on a basic knowledge of demand, interms of people's preferences and the type of contribution they may be willing tomake in return.

53
PART I I : PRACTICE
8.6 Obtaining donor approval
The completion of a project strategy provides an early opportunity for a donoror an intermediary to review a project proposal and confirm or withdraw itssupport. This approval should not be confused with the later appraisal of adetailed community plan, which may involve users demonstrating their sup-port for the proposed activities and how they are to be implemented. Thefollowing table gives some idea of the demand-related criteria that could beused by a donor to review a project strategy.

54
DESIGNING TO MEET DEMAND
Table 8.2. Possible demand based criteria for donor approval
Factor
Information
Capacity
Partnerships
Objectives andtime-frame
Communications
Inclusion
Risks
Quality
Key Issues
Is the proposal informed by initial indications of demandfor improved services, for example, based on a study ofcoping strategies?
Does the implementing organisation have the capacityto use demand effectively and identify, develop and of-fer service options capable of meeting user demand?
Do project staff have the skills, resources and time tostimulate demand if it is weak?
Which indicators of demand will be used and when arethey to be used?
Have partnerships been established which will enabledemand to be met or managed in the future once im-plementation is completed?
Are objectives compatible with existing priorities andpolicies? Are they achievable within the stated timeframe, taking into account the need for capacity build-ing and need for users to make key decisions and anyneed to stimulate demand?
Is there a project communication strategy based on theneed to initiate and maintain a dialogue with all users?
Have specific arrangements been made to identify andtarget marginalised groups and ensure their inclusion inthe project process?
Have risks been identified and assessed, and how willthey be shared?
How will the quality of the project's process, includingfacilitated decision-making, be measured and main-tained?

55
PART I I : PRACTICE
9. Selecting where and when to work
As previously mentioned, many projects involve a number of communities,each one of which may be associated with a sub-project. Limited resources,and the need to develop the capacity of the project team and its partners, mayresult in the project being implemented in phases. In this case, work has to beprioritised and communities selected. One of the criteria that could be used isdemand.
In some cases, project staff are not responsible for prioritising sub-projectsand selecting communities. For example, the decision may already have beenmade by local government. Alternatively, the project may involve only onecommunity. Even in these circumstances, project staff should understand howactivities could be proiritised, taking into account demand.
If expressions of demand are to be used to select communities or householdsin this way, it is important to recognise five potential problems:
1. Expressions of demand are only reliable if people have been informed ofthe implications of participating in a project. This requires that informationis made accessible to all decision-makers.
2. Demand may be tempered by the fact that the credibility of the project teamis untested and that the benefits may not be realised for several years. Pastexperience of poor water supply and sanitation projects may reduce de-mand in some communities.
3. Communities and households must have the opportunity to express whetheror not they want to participate in a project. This may be difficult to arrangein remote areas or if people lack literacy skills.
4. Initial expressions of demand are more likely to come from those with in-fluence or better access to information, and may not represent collectivedemand. They may also hide tensions within the community.
PREP SEL PLAN APP IMP OP

56
DESIGNING TO MEET DEMAND
5. If demand is to be used in this way, the selection process itself must betransparent to avoid accusations of bias that could seriously undermine thecredibility of a project team.
Despite these points, expressions of demand remain an important factor inselecting where to work and should not be overlooked. Three practical meas-ures can be taken to ensure that expressions of demand are effective and theseare described below.
1. Develop a project communication strategyA project communication strategy should be developed and put into effect.This could be based on the results of investigations undertaken during projectpreparation. The strategy should be based on initiating and sustaining aneffective dialogue with all potential users.
The most effective communication strategies may use several 'channels'and methods, reflecting the diversity of individuals and households foundin every community. Specific measures may be needed to reach the mostremote areas and marginalised groups within communities. Special effortmay be needed to reach women, who are often socially or culturally ex-cluded from receiving information and decision-making.
2. Ensure transparencyIt is necessary to be completely transparent about the selection process. Thecriteria to be used for selection should be agreed by project stakeholders,including legitimate representatives of the communities in the project area.
3. Identify appropriate indicators of demandIndicators of demand for project selection should be identified during projectpreparation. The following could be used:
! Observations of people's coping strategies, including the indicators ofdemand described in Section 8.2.1.
! The completion and return of an application form which specificallyrequires those completing it to interact with individuals and households.
! The completion of a basic village map, showing the distribution ofhouseholds and other features.

57
PART I I : PRACTICE
! The establishment of a project fund, possibly taking the form of asavings account in a local bank. Relatively small amounts of cash couldbe used to pay for all or part of a feasibility study.
! A village or street sanitation campaign, in which people dispose of domestic rubbish, clear drainage ditches and repair damaged water orsanitation facilities. This could be used as a demonstration of demandfor improved environmental sanitation and serve as an indicator ofcollective organisation.
All but the first of these points may require a degree of facilitation or capacitybuilding, and arrangements have to be made to provide this. Mvula Trust'sselection criteria (Mvula Trust, 1996) includes the formation of water orsanitation committees. In practice this was often completed without peoplerealising what was expected of each member. At the very least, this experiencereinforces the need for an effective project communication strategy.
Project staff may be disappointed if expressions of demand are less thananticipated. Whilst this can suggest a problem with the project's communica-tion strategy, it may also be the result of people having other priorities. Weakdemand may also result from the poor performance of development projects inthe area.
Demand is not the only factor that can be used to select projects. Dependingon the context, other criteria should also be considered:
! Frequently, selection has to fit in with external priorities, for example, thoseof local government or those implicit in a regional development plan.
! Expressions of demand may be balanced by an external assessment of peo-ple's needs for essential services. This could be based on the informationsupplied in a project application form. It would be wise to investigate whichcommunities are not expressing demand and why.
! Selection has to take into account the skills and resources available to planand implement water supply and sanitation improvements. This delay work-ing in 'difficult' areas until project staff are more familiar with their rolesand responsibilities.

58
DESIGNING TO MEET DEMAND
! It may be necessary to pre-select certain communities in order to pilot ap-proaches or technologies that the project team is not familiar with.
! It is often wise to start working in an area where success is more likely toreinforce the credibility of the process and the project team itself.
Ultimately, the best selection strategy is one that has emerged after consider-ing all these factors and how they relate to the local context. An example of aselection strategy reflecting many of these points is described in Box 9.1.

59
PART I I : PRACTICE
Box 9.1. User participation in project selection
The Rural Drinking Water Supply and Sanitation Project, supported by the Gov-ernment of Kenya and the Netherlands, started in Nyanza Province in 1983. Nowat the end of its current phase, project staff have investigated ways to improveproject selection. This has resulted in the development of a new approach. Theapproach has still to be tested, but it illustrates a number of important points.
During the preparation phase, a project's overall boundaries would be agreed incollaboration with government departments and other stakeholders. The size ofthe area would be constrained by the capacity of the project, but could include30 to 40 villages.
Two representatives from every village (a man and a woman) would be invited toa two day workshop in a central location. This would be timed to coincide with theperiod after the harvest when people are more likely to be available, avoidingreligious festivals or cultural events. The project's rules and methodology wouldbe carefully explained, including the criteria for village selection.
The representatives would then receive training in order to be able to complete aproject proposal form. This would require the collection of household data as wellas information about water sources and the village's health status. This suggeststhat the representatives selected would have to be literate, a possible constraintin many rural areas. Post boxes would be established in convenient locations tofacilitate the collection of the forms by an agreed date.
Expressions of demand (indicated by a completed application form) would bebalanced with other considerations based on the information received. In thiscase, no cash contribution would be required.
Before this approach could be implemented, it would be necessary to check thatsome villages are not being excluded because the invitation does not reach them,or it cannot be understood. It would also be useful to investigate which villagesdid not submit an application form and why.
Toot (2000)

60
DESIGNING TO MEET DEMAND

61
PART I I : PRACTICE
10. Developing a community plan
The next stage in the project process is to develop a community plan that setsout the activities to be undertaken at community level. This does not onlyinvolve the production of a detailed technical design. Management and contri-bution systems must also be developed that will later be used to implement aproject and sustain it, once the project team withdraws.
The key point is to involve users in making informed decisions that willdetermine the type of service and facilities they receive. The process itself canbe summarised in the form of a simple flow chart:
PREP SEL PLAN APP IMP OP
Figure 10.1. The planning process
Define problem,objectives and constraints
Identify potential options
Develop, cost, test andprice options
Output: detailedplan with fully
developed and pricedoptions

62
DESIGNING TO MEET DEMAND
If demand is to be reflected in the resulting plan, a constructive dialogue has tobe maintained between users and project staff. Above all, this requires aconducive atmosphere based on mutual understanding and trust, and a pro-active approach to involving women and the poor in the planning process.
10.1 Defining the problem
Before appropriate options with the potential to meet demand are identified,project staff must understand why improved services are wanted in the firstplace. Local objectives have to be established.
This process is not always as 'bottom-up' as it sounds. It is often the case thatpeople must be informed of the potential opportunities and associated benefitsthat could result. Achieving this, without imposing an external view or poten-tial solution can be difficult. An exposure visit to a completed project, with'delegates' discussing the impact of the interventions made with the hostingcommunity, is one possibility.
At this stage it is important that project staff do not confuse objectives withsolutions. People often have a wealth of untapped information and ideas.However, they are rarely familiar with the full range of potential options orlimiting factors. Problems can be defined, however, by facilitating people toanalyse their own situation.
Among the various tools that can be used to do this, the following areparticularly useful: focus groups, participatory mapping, problem trees, ob-jective trees and attribute ranking.
10.1.1 Using focus groups
However uniform they may seem from the outside, most communities have acomplex structure, made up of groups identified by factors such as gender,age, religion, wealth, ethnicity, clan and caste. Each group may have its own

63
PART I I : PRACTICE
set of perceptions and priorities. The structure of a community may berevealed using a number of techniques, triangulating the results14 to ensurethat no group is excluded.
To ensure that the decisions made reflect the interests of all users, focusgroups can be formed, their composition based on the results of previousinvestigations (and quite possibly participatory mapping as well). This canencourage the participation of people who may lack the confidence or cred-ibility to discuss issues in a wider forum.
Focus groups are only as effective as the quality of their facilitation. Thetendency for discussions to be dominated by one or two people, or led in acertain direction by a facilitator, must be checked. At some stage it will benecessary and desirable to bring different opinions together and achieve adegree of consensus. Focus groups can help achieve this by reinforcing theconfidence and credibility of individuals to participate in decision-making.
What is a focus group?
A small group of people made up of individuals sharing similar social, cultural oreconomic status, brought together with a facilitator to explore a particular issue.An example may be a group of women from a particular caste.
The use of focus groups enables perceptions and priorities to be explored in aninformal, confidence building environment, with less risk that the process is domi-nated by an elite.
In some cases it is possible to use a group that already exists in a community,rather than attempt to establish something new, as long as this is appropriatelyconstituted.
14 This means cross checking the results of one exercise with others to identify and rule out bias. Triangulation is an
important principle used to validate the results of an investigation.

64
DESIGNING TO MEET DEMAND
10.1.2 Participatory mapping
One of the more useful and adaptable tools that can be used by socialfacilitators (and indirectly by engineers) is a participatory map - a map ormodel representing a community, whether this is a rural settlement or anumber of streets in a peri-urban area, often including the surrounding neigh-bourhood. The map is created by a number of people using materials andtechniques with which they are familiar.
Participatory mapping can help identify marginalised households and in par-ticular the 'invisible' poor who may not otherwise be identified as projectstakeholders at all. Informal settlements, low caste hamlets and individualhouseholds may be particularly vulnerable because they have little or no voiceto express their demand (see Box 10.1).
To identify the poorest of the poor, a social facilitator may have to probedeeply, combining a number of participatory techniques to ensure they are notbeing excluded.
Box 10.1. Exclusion of a low caste hamlet in MadhyaPradesh, India
Banjaridhana is a hamlet of 56 low caste (harijan) households, situated within akilometre of Sohapur, a larger and wealthier village. Many harijan work in fieldsowned by Sohapur residents, and Banjaridhana is administratively and politicallypart of Sohapur.
Banjaridhana was inadvertently excluded from a poverty focused water and sani-tation project in Sohapur. UNICEF staff monitoring the project were unaware ofthe existence of the hamlet until an innocent question was asked by a harijanduring a community meeting. The NGO implementing the project knew of thehamlet, but was keen to focus activities in Sohapur, where tangible results couldbe achieved more quickly.
Deverill and Wedgwood (2001)

65
PART I I : PRACTICE
Another use for maps of this sort could be to identify or clarify existingfacilities and practices. For example, traditional water points, defaecationareas, rubbish pits and households with pit latrines can all be identified. Suchfeatures can be used to initiate dialogue. This can help establish a commonunderstanding of the situation within a community. The quality of this dia-logue is as important as the map itself. As with focus groups, engineers canderive a wealth of information from mapping exercises and need to involvethemselves either directly or indirectly.
An example of a village map is shown in Figure 10.2. This is taken from apaper on participatory mapping by Neela Mukherjee (1992), published in anIIED publication on the Applications of Wealth Ranking (IIED, 1992). Themap in Figure 10.2 details field boundaries and irrigation wells, suggesting amale point of view. In practice, a map drawn by women may be very differentfrom that drawn by men, reflecting different priorities and perceptions. It isimportant to understand both male and female perceptions, reinforcing theusefulness of gender-segregated focus groups.
The mappers have also ranked households in terms of wealth, using criteriathey defined themselves. The poorest households included those headed bywidows with few assets, no land, no regular source of income, and not enoughto eat throughout the year. Better off groups had more land and fewer depend-ants. Those in the more wealthy groups were also able to benefit from officialincome generating projects.

66
DESIGNING TO MEET DEMAND
If surveys focus on the area within a community's boundaries, informationabout neighbouring communities, surrounding resources and communicationroutes is not revealed and is therefore not discussed. Peripheral informationof this type may be very important. For example it can help identify:
! Out-of-village areas used for refuse or excreta disposal by certain sectionsof the community.
! Additional water sources (and their ownership).
! The location of 'downstream' users dependent on water supplies within thevillage.
Figure 10.2. Village map of Berapal, Midnapore District, West Bengal.For details and references see text.

67
PART I I : PRACTICE
! The location of a school or clinic that could be incorporated within theproject boundary.
! Marginalised communities, such as the harijan community described in Box10.1.
! The possibilities for a multi-village scheme that may benefit from econo-mies of scale.
10.1.3 Problem trees
The third participatory tool to be described is designed to identify problems(as perceived by a community), rank these in terms of their importance, andinvestigate how they are related. Represented graphically, the result of thisexercise is called a problem tree, reflecting its branched appearance.
The creation of a problem tree needs careful facilitation in order to keep itssize manageable. It is equally important that the facilitator does not lead theexercise, by concentrating on a particular issue when those participating haveother concerns.
The use of focus groups to build their own problem trees can help a trainedfacilitator understand the diversity of opinion within a community. Sharedconcerns can also be identified and a mutually acceptable solution estab-lished.
Putting it togetherThe process of creating a problem tree is relatively simple. A group of people,typically six to twelve, is to record the problems they face on card or othermaterial. Symbols can be agreed if people cannot write. The results are thensorted, with similar problems being grouped together. The causes and effectsof each problem are then discussed. This can lead to additional cards beingadded and some being discarded. Finally, the problem cards are arranged toshow their interrelationships.

68
DESIGNING TO MEET DEMAND
When the group is happy with the result and agree that it represents theircollective perceptions, the cards are stuck down and lines drawn to show thelinks between them. An example of a problem tree is shown in Figure 10.3.
Figure 10.3. Example of a problem tree
LACK OF ECONOMICOPPORTUNITIES
Not enough capital toinvest in production
Not enough waterfor productive use
No access toaffordable credit
Not enough timefor productive work
Too much timefetching water
Queues at waterpoints
Cattle take priority
Village full of garbageand drains blocked
Unreliable water
Unsafewater supplies
Cattle and peoplepollute village
Too much timecollecting firewood
Sick children withdiarrhoea and malaria
High expenditure onmedical treatment

69
PART I I : PRACTICE
10.1.4 Objective trees
It is a relatively simple exercise to transform a problem statement into anobjective, simply by rewording or rephrasing it. In the same way, a problemtree can be transformed into an objective tree15.
This transformation can be a very useful exercise. Firstly, it links the problemspeople face with the decisions they will make. Involving people in decision-making is only likely to be effective if those decisions are felt to be relevant.Secondly, it can help project staff appreciate the breadth of activities that needto be undertaken to achieve a significant impact. Lastly, the exercise high-lights the constraints that all projects face and introduces a certain amount ofreality into the process - it is unlikely that every objective can be addressed.
An example of an objective tree is shown in Figure 10.4. This is based on thepreceding problem tree. The shaded objectives are those which have not beenincorporated into a water and sanitation project. It is important to note thatboth problem and objective trees require a high standard of facilitation,ensuring that people have sufficient information to link cause and effect.
Figures 10.3 and 10.4 reflect water supply, sanitation and hygiene. Logicsuggests that interventions should be integrated. This can be achieved in twoways. Separate ‘stand alone’ water, sanitation and hygiene initiatives could beplanned together and their implementation co-ordinated. Alternatively, two orall of these components could be packaged into a single project. One fre-quently encountered problem associated with packages of this sort is thathygiene and sanitation are seen as ‘bolt-on components’ and are frequentlymarginalised. For more details, see Section 7.2.
15 An alternative way of building an objective tree is described in Toolkits, published by Save the Children Fund. For
further details see Gosling and Matthews (1995).

70
DESIGNING TO MEET DEMAND
Figure 10.4. Example of an objective tree.This is based on the problem tree shown in Figure 10.3.
In this case, the shaded boxes shown fall outside the project's remit.
IMPROVE ECONOMICOPPORTUNITIES
Increase amount ofcapital for investment
Develop new watersources and improvewater use efficiency
Providing saving and credit scheme
Increase time forproductive work
Reduce watercollection time
Increase number ofwater points
Provide alternativewater supplies for cattle
Clean up village andrestore drains
Increase amount ofwater available
Improve water quality
Prevent cows enteringvillage
Encourage peopleto use toilets
Grow more firewood Reduce incidence ofdiarrhoea and malaria
Reduce expenditure onmedical treatment

71
PART I I : PRACTICE
10.1.5 Attribute ranking
So far, the tools described concern problems and objectives. The desiredcharacteristics (or attributes) of a service or a related facility have still notbeen clearly identified. It is important that this is done, because householddemand is largely dependent on this factor.
One way of achieving this is by attribute ranking. Participants are encouragedto first identify and discuss the attributes of an improved service or facility.Dialogue can be initiated by introducing a wide range of characteristics, eachrepresented on a card. These are then discussed and sorted into three piles -'desirable', 'undesirable' and 'unsure'. If necessary, participants can suggestnew cards.
The final ranking is then scored to judge their relative importance, using asimple technique such as pocket chart voting16. The exercise can be mademore sophisticated (and more complicated) by getting participants to score anexisting facility first. An example is shown in Figure 10.5. In practice,symbols rather than words could be used to describe each attribute.
16 Pocket chart voting is a technique in which participants can express a preference by placing a marker (such as a
bean) in a pocket associated with a particular attribute.

72
DESIGNING TO MEET DEMAND
Figure 10.5. Attribute ranking for household sanitation.The boxes on the right show the results of pocket chart voting.
Each participant can place up to two markers in each box.Gender differences are revealed by using different coloured markers.
Safe for all familyespecially children to use
Close to house to beconvenient at night
Toilet should be easy toclean without much water
Toilet should be able tobe upgraded to flush toilet
Toilet should look goodfor guests and for weddings
Separate toilets shouldbe provided for men

73
PART I I : PRACTICE
In conjunction with the other tools described, attribute ranking providesproject staff with sufficient detail to identify potential options which are likelyto meet demand. This is the subject of the following section. First, however, itis necessary to consider how demand for sanitation can be stimulated.
Stimulating demand for sanitation
So far in this booklet, sanitation has been treated in much the same way aswater supply. However, whereas demand for improved water supply is often veryapparent (the main issue being how to respond to it), demand for sanitationoften seems to be weak or even non-existent.
The following four pages explain:
! Why does demand for sanitation often seem weak?
! What does stimulating demand mean in practice?
! PHAST � a method of developing the link between health, hygiene andsanitation.
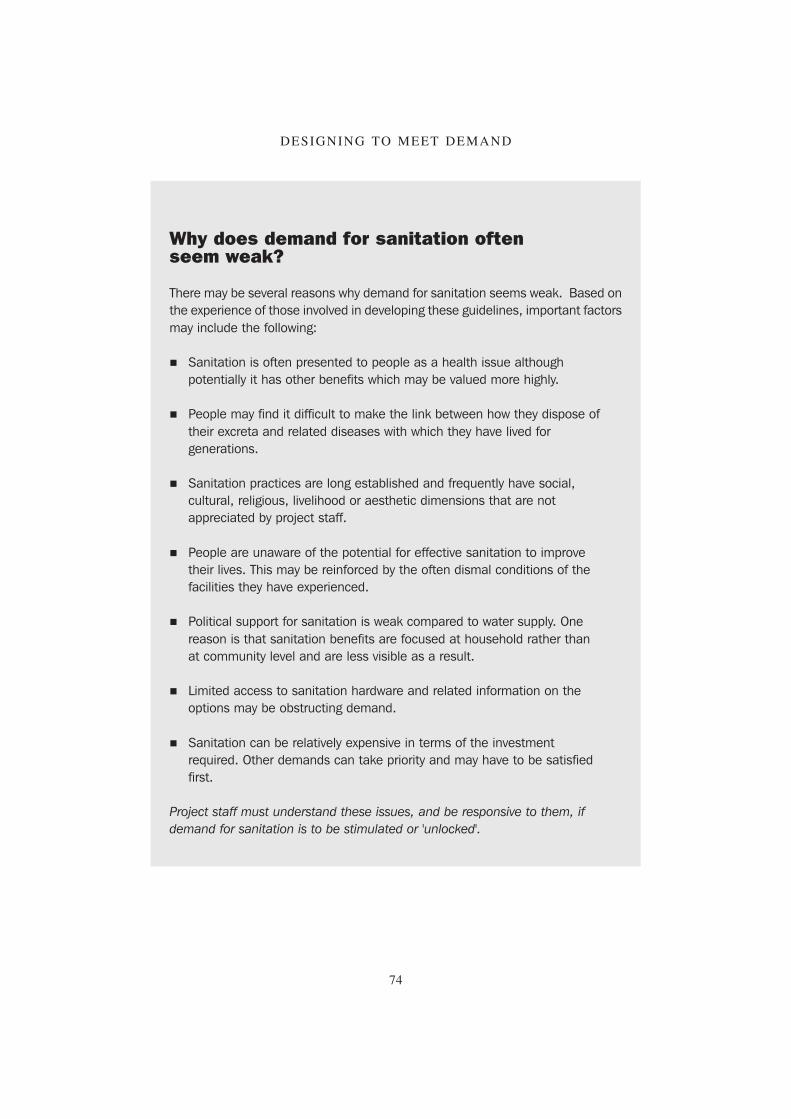
74
DESIGNING TO MEET DEMAND
Why does demand for sanitation oftenseem weak?
There may be several reasons why demand for sanitation seems weak. Based onthe experience of those involved in developing these guidelines, important factorsmay include the following:
! Sanitation is often presented to people as a health issue althoughpotentially it has other benefits which may be valued more highly.
! People may find it difficult to make the link between how they dispose oftheir excreta and related diseases with which they have lived forgenerations.
! Sanitation practices are long established and frequently have social,cultural, religious, livelihood or aesthetic dimensions that are notappreciated by project staff.
! People are unaware of the potential for effective sanitation to improvetheir lives. This may be reinforced by the often dismal conditions of thefacilities they have experienced.
! Political support for sanitation is weak compared to water supply. Onereason is that sanitation benefits are focused at household rather thanat community level and are less visible as a result.
! Limited access to sanitation hardware and related information on theoptions may be obstructing demand.
! Sanitation can be relatively expensive in terms of the investmentrequired. Other demands can take priority and may have to be satisfiedfirst.
Project staff must understand these issues, and be responsive to them, ifdemand for sanitation is to be stimulated or 'unlocked'.

75
PART I I : PRACTICE
17 PHAST: Participatory Hygiene and Sanitation Transformation. See next page for details.
What does stimulating demand mean in practice?
Based on the experience of the organisations involved in developing these guide-lines, the following measures can prove very effective in stimulating demand.
! Understand and respond to people's priorities. This may mean dealing withwater supply first, together with other activities such as hygiene promotionneeded to meet project objectives.
! Establish the qualities people value, and reflect this in the options offered.In this respect, men and women's perceptions of convenience, comfort,security, privacy, health benefits and status may all be important.
! Think in terms of incremental change, and ensure that there is sufficienttime in which people's perceptions and behaviour can be modified. Experi-ence shows this can take 5 to 10 years. In the limited time available itmaybe possible to 'seed' demand across the project area. See Box 10.2for details.
! Develop an appropriate range of sanitation options which reflects the di-versity of demand present in a community. Upgradable options allow peo-ple to respond to future changes in their demand as their perceptionschange.
! Build understanding of the links between safe sanitation, hygiene and health.In this respect, the use of PHAST17 tools can be highly effective - if used toencourage learning and action rather than as teaching aids.
! Make sanitation more affordable. Make use of local knowledge, skills andresources. Consider establishing a revolving fund or micro-credit scheme.A limited, well-targeted subsidy may be needed to help those with lessaccess to financial resources provided that this is a response to demand.
! Ensure that people know about the sanitation programme and have ac-cess to information and hardware. The private sector may have a role toplay, supplying sanitation long after project staff have left.

76
DESIGNING TO MEET DEMAND
Box 10.2. Stimulating demand for sanitation: the Mbila Sanitation andhygiene project, KwaZulu Natal
Mbila is a relatively isolated tribal ward in northern KwaZulu Natal, consisting often rural communities, each of about 100 Zulu households. In 1998 it was de-cided by the Mvula Trust to start a sanitation project in the area, based on aearlier pilot project which had finished some years previously. A sanitation com-mittee was duly appointed by the tribal authority. Partners in Development wasappointed as the implementing organisation.
The sanitation committee choose to initiate the project in all ten communities,despite the fact that this would add to logistic problems (and costs) and that, inthe first phase of the project, only 200 latrine subsidies were available. Each ofthese was worth 600 Rand (then worth about 1,00 US $).
Learning important lessons from the previous project, it was decided to offer anumber of superstructure options sharing a Ventilated Improved Pit (VIP) design.The subsidy was used to sink and line a pit and supply a vent pipe, pit cover andpedestal (the VIP and seat is an established norm throughout much of KwaZuluNatal). The prospective owner was responsible for completing the superstructureaccording to his or her preference. A catalogue was produced detailing the vari-ous superstructure options and their approximate costs.
With only twenty latrine subsidies per community, draws were held in each area todetermine who could apply. This mechanism, devised by the sanitation commit-tee, was respected for its transparency and equity. Both the process and thecompleted latrines helped generate interest and demand from other households,as a result of which the programme has been expanded with additional funding.
A householder stands in front of her recently completed latrine, completewith a relatively affordable and highly popular reed superstructure.
Part
ners
in D
evel
opm
ent (
Sout
h A
fric
a)

77
PART I I : PRACTICE
PHAST
PHAST (Participatory Hygiene and Sanitation Transformation) is a participatorytechnique that develops people's understanding of the linkages between sanita-tion, hygiene and health. The aim is to encourage participants to plan their ownsanitation and hygiene initiatives, both at household and at community level.
The technique uses a number of graphical tools such as the sanitation ladderdescribed in Section 10.3.2. It relies on quality facilitation. The risk is that thetools are used to instruct people, removing the opportunity for them to learn fromand act on their own experience.
For details about PHAST see the Water and Sanitation Programme (Africa region)website: www.wsp.org. A video 'Healthy Communities' documenting the processis now available from this source.
Above - men meet to dicuss their plans.Before the opinions of each group are consolidated,
women would meet separately.
WE
DC
/Dar
ren
Sayw
ell

78
DESIGNING TO MEET DEMAND
10.2 Identifying potential options
Having established people's objectives and the attributes of an improvedservice, the identification of options with the potential to meet demand can bea relatively simple process. The factors that should be taken into account areshown in Figure 10.6. At this stage, it is not necessary to develop potentialoptions into actual solutions.
A number of principles can be used to guide the identification process, andsome of these are suggested below.
Figure 10.6. Factors to consider when identifying potential optionsAdapted from IRC (1997)
Financialconstraints
Technicalfactors
Environmentalfactors
Policies, plansand legislation
Social andcultural norms
Perceptionsand priorities
POTENTIALOPTIONS
Institutionalcapacity

79
PART I I : PRACTICE
1. Investigate current practices and underlying perceptionsIn terms of impact and sustainability, it is often more effective to developcurrent practices rather than introduce an 'alien' technology. It may be possibleto introduce improvements to water supplies and sanitation incrementally,keeping pace with (but not exceeding) the capacity of users to sustain them.
2. Ensure that the project team has adequate knowledgeEnsure that technical staff are familiar with (i) a broad range of technologiesand their characteristics, and (ii) the potential for each option to be developedto provide a range of service levels. This reinforces the value of conducting atechnical review referred to in Section 8.5.
3. Consider technical optionsStart by identifying potential technical options. Appropriate management andcontribution systems can be 'added on' to complement technology during thefollowing stage.
4. Participatory investigationConduct field investigations with (rather than for) people. One indicator ofdemand is the extent to which potential users are prepared to investigatepotential options, for example, by digging trial pits or using a shallow auger tofind a local water table. In some cases it may be possible for people to plantheir own investigation, with project staff adopting a more advisory role.
5. Match attributesCompare the characteristics of potential options with the attributes of whatusers want, taking into account constraints that may reduce choice. Objectivetree and attribute ranking can both be used to guide this process. At this stage,rank rather than rule out options.
6. Be transparent.Not only should technologies be discussed with users, so should the risks andconsequences of them failing. In particular this relates to ground water inves-tigations, drilling (which may prove unsuccessful) and the possibility of thefinal plan not being approved by the project's funder.

80
DESIGNING TO MEET DEMAND
7. Make the linkDo not overlook the links between water supply, sanitation and hygiene. Forexample, if latrines are to be provided and hygiene promoted, where will thewater come from to use and clean them and who will undertake this task? If apour flush latrine is preferred, this could amount to an additional 5-10 litresper person per day. Similarly, if house connections are to be provided, con-sumption will be higher and so too will be the volume of wastewater thatneeds to be disposed of or utilised.
8. Remember the environment.This does not only apply to the direct issues of establishing the safe yield of aspring and ensuring wastes do not cause pollution, but also the potentialimpact of using natural resources on the environment and the people whoselivelihoods depend on it. For example, if a significant amount of water is to beabstracted from a number of wells, conservation measures may be needed tosustain the water table.
10.3 Developing potential options into real options
Once potential options have been identified, they can be developed intoservices and facilities capable of meeting demand. Whilst it is important toreflect the perceptions and priorities of users in the final 'product', whatever isplanned must also be environmentally sustainable, technically feasible, finan-cially viable, institutionally supportable, socially acceptable and culturallysensitive!
As potential technical options are developed into a number of service levels(some may be discarded along the way), these can be complemented byappropriate management and contribution systems. This is shown schematicallyin Figure 10.7.

81
PART I I : PRACTICE
Box 10.3 provides an example that illustrates how this pattern of optiondevelopment could be reflected in practice. This is linked to the processoutlined in Figure 10.7. The description is based on a real case study inKwaZulu Natal, South Africa, albeit with minor adaptations. In practice,technical options were developed over the course of the project to overcomethe limitations of dug wells.
Figure 10.7. Option Development. Of three potential options, the first isdropped whilst the others are developed into four service level options.
These are complemented by an appropriate management andcontribution system, represented by the shaded oval.
1
2
2.1
2.2
2.3
2.1
2.2
2.3
3.13.13
Potentialtechnicaloptions
Developedtechnicaloptions
Managementand contributionsystems added

82
DESIGNING TO MEET DEMAND
Box 10.3. Option development in practice:Ubombo Family Wells Programme,Maputaland, South Africa
The following example of option development is based on an actual scenario,taken from the Ubombo Family Wells Programme in KwaZulu Natal, South Africa.
In this case, three potential technical options have been identified: The numbersrelate to those in Figure 10.7.
" A piped water supply from a nearby lake.# Shallow wells.$ Rain water harvesting.
As these are developed into practical options, it transpires that the cost of sus-taining the piped water supply " is much higher than anticipated. There are alsodoubts about the available local capacity to manage a piped water supply. Afterconsulting with focus groups and the water committee, it is agreed to seek analternative option.
The well option # is investigated in more detail, resulting in three service levelsassociated with communal tube wells, family tube wells and dug wells. The latterare primarily intended to satisfy demand for horticulture and livestock. In someareas it is established that the water table is inaccessible, necessitating the de-velopment of a rain-water harvesting option $.
The family tube well provides an alternative to households that could have af-forded the piped water supply. This option has 'upgrade potential' and could beaugmented with a solar pump and roof tank to provide an in-house connection,as long as waste water could be disposed of effectively.
During the development process, the water committee and focus groups areinvolved in the development of a management and contribution system.
The result of this process is a detailed plan, complete with a 'menu' of servicelevel options. Demand for these could be tested before presenting the plan to thecommunity in a mass meeting for their endorsement or rejection.

83
PART I I : PRACTICE
18 See for example the Looking Back study undertaken by WaterAid. For details see WaterAid (2001).
Many water supply projects are undertaken to improve people's health di-rectly. There is however, strong evidence that the economic benefits whichfollow can also have a profound impact18. The time saved by women (becausewater is made more accessible) can be used for income generating activities.Many of these activities make use of the water provided.
This link has been recognised by many organisations including at least two inNepal. The Rural Water Supply and Sanitation Fund Development Board (theFund Board) has established a revolving savings and credit fund for each of itsprojects, allowing women's groups to start a business whether or not it isrelated to water supply. The income generated helps to sustain the watersupply (see Box 10.4). In other areas of Nepal, the Gurkha Welfare Scheme ispiloting drip irrigation systems. These are also proving very successful.
Box 10.4. The Women's Technical SupportService, Nepal
One of the objectives of the Fund Board in Nepal is to provide opportunities forincome generation, focused on women in particular. The scheme has been verysuccessful, demonstrated by the case of Bhatikharda village, where the localWomen's Group have started a revolving fund for goat and pig rearing.
With support from the financial authority, at least twenty families have used thescheme, which has a 100% loan repayment record. Reflecting the success of theWomen's Group, the village water users group has decided to give them respon-sibilities for managing the sanitation revolving loan fund, a second Fund Boardinitiative.
This example, by no means unique, illustrates the link between water and pro-duction. The link must be recognised if demand is to be captured. Additionalinputs - such as capital for a revolving fund - may be needed.
84
DESIGNING TO MEET DEMAND
Economic enhancements such as those described in Box 10.4 do not necessar-ily benefit the poor. Instead, they may increase the poverty gap that existsbetween them and the better off. Specific measures must be taken to identifyand help overcome the constraints which prevent the poor taking up opportu-nities of this sort.
10.3.1 User involvement in option development or in optiontesting?
Ensuring that users participate in the development of options is one way ofcapturing their demand. Alternatively, it is possible to test the demand fordeveloped options, using an appropriate demand assessment technique toestablish, amongst other things, the contribution that people are willing tomake. Each approach has a number of advantages and disadvantages, andthese are summarised in Table 10.1(a and b).

85
PART I I : PRACTICE
Advantages
Increased opportunities for dialoguebetween project staff and potentialusers. This may reinforce a relation-ship of mutual understanding andtrust.
Increased opportunities to identify,assess, use or adapt local knowledge,skills and systems.
Participatory process can identify im-portant details that may have signifi-cant impact on demand.
Participation may encourage a senseof ownership and acceptance of as-sociated responsibilities.
Participatory process can build capac-ity for a future role in managing theservice provided.
Disadvantages
Process may not be truly representa-tive: focus groups can be dominatedby an elite, whilst only relatively smallnumber of potential users can be in-volved.
Considerable time may be needed todiscuss concepts and interpret per-ceptions.
Potential users themselves may nothave time to be able to participate asrequired.
Table 10.1a. Involving users in the development of options

86
DESIGNING TO MEET DEMAND
In practice, the best solution may be to involve users in both the developmentof options and option testing using an appropriate form of demand assess-ment. Further details of demand assessment techniques that could be used inthis way are described in Section 10.4.2.
10.3.2 Communicating ideas
Whether involved in development or testing, potential users must be fullyinformed of the characteristics, costs, benefits and risks associated with eachoption. Communicating ideas can be extremely difficult, especially if peoplehave not been exposed to them before. A number of techniques can be used oradapted to help get messages across:
Advantages Disadvantages
Table 10.1b. Testing demand for developed options
Demand assessment techniques canprovide information on what peopleare willing to pay for options. This helpsdesign a pricing or tariff structure.
Various demand assessment tech-niques are available which can beadapted to suit a number of situations.
Depending on method used, the de-mand assessment may be relativelyrapid. This may be important forproject staff and potential users.
The process can be designed to cap-ture opinions from different groupswithin a community with less risk ofan elite dominating proceedings.
Some methods are statistically robust,with the capacity to identify and ruleout bias.
Potentially these techniques are lessable to capture demand as the deci-sion-making point occurs after arange of options has been developed.
Depending on methods used, can beexpensive to implement and costly tomake significant design changes ifthese are required.
May undermine the sense of owner-ship which is important for commu-nity management.

87
PART I I : PRACTICE
! Maps - superimposing a plan on a community map. These do not have to beon paper, but could be painted on a wall or floor.
! Visits to neighbouring projects where similar options have been developed.This includes dialogue with users and managers.
! Physical models of the proposed facilities. Cut-away models can help ex-plain how facilities work and what is needed to maintain them.
! Pictures, photographs, 'picture stories' and videos. In this category are thewater and sanitation ladders. These can be used to establish local percep-tions and practices, promote a discussion about improvements, and stimu-late demand and behavioural change (Figure 10.8).
! Role-plays and street theatre. These can be used to demonstrate how a man-agement or contribution system could work.
! Demonstrations of service levels and facilities. These must be realistic anddesigned to illustrate how a technology could be used and its costs andbenefits, rather than advocating a particular level of service.
! Demonstration facilities associated with sanitation production centres andrural sanitation markets, either run by a local NGO or a private entrepre-neur.
! Attractive 'catalogues' or simple manuals illustrating different options, theircharacteristics and costs, and how to build or obtain them.
! The use of pie charts and other graphical tools to examine a contributionpolicy or tariff structure.
! Identifying, investigating and highlighting the positive steps taken by someindividuals (positive deviants) to improve their access to water supply andsanitation.

88
DESIGNING TO MEET DEMAND
Safer Practice
Higher cost
Figure 10.8. An example of a sanitation ladder.In practice, the cards would be illustrated by a local artist and
reflect local practices or options. Note how the cards can be positioned toreflect both risk and the cost assisted with each practice or measure.

89
PART I I : PRACTICE
10.3.3 Meeting demand for higher service levels
Some implementing organisations seem reluctant to offer higher servicelevels for water and sanitation, even if demand exists and sufficient resourcesare available. This is often a question of ideology. Whilst it is not the purposeof these guidelines to advocate a particular point of view, the following issuesshould be borne in mind:
! The community's attitude to higher service levels must be established. Insome cases, collective demand for a basic, equitable service must be satis-fied before a community is willing to consider the introduction of higherservice levels.
! Unmet demand may result in individuals developing their own coping strat-egies e.g. private boreholes. If there is competition for resources, this candestabilise a project and compromise its sustainability.
! In the case of water supply, project staff should first confirm if sufficientwater resources are available to offer higher service levels, taking seasonalvariations into account.
! The need to meet or manage future demand should be considered beforeoffering higher service levels.
! The system must be considered as a whole, to ensure that the provision ofhigher service levels does not undermine the financial sustainability of lowerservice levels due to the inefficiency of implementing the latter on a re-duced scale.
! Prices and other forms of contribution should reflect the cost of providingand sustaining the associated service level.
! The provision of higher service levels should increase the financial resourcesavailable to the scheme and may open up opportunities for cross subsidis-ing the poor.
! If higher levels of service for water supply are to be provided, the associ-ated issue of wastewater disposal should be addressed and reflected in thecontributions required.

90
DESIGNING TO MEET DEMAND
! The use of intermediate service levels could be considered as a compro-mise if higher service levels are not to be implemented. These can often fillimportant gaps in a menu of options. An example is the supply of water tohouseholds using the trickle feed drum, described in Figure 10.9.
In many cases it may make sense for project staff to adopt an incrementalapproach to upgrading. This would have to be reflected in the project's overallstrategy.
Mains supply
Valve
Inlet pipe
Lockable lid(key held by Water
Management Commitee) Float valveOrifice (up to 3 small holes)
Tank (capacity100 to 1000 litres),can be:-plastic, ferro-cement,plaster, or othersuitable material
Tap
Jerry can
Figure 10.9. The trickle feed drum: A method of providing water tohouseholds without the need to develop a full pressure distribution system.
The need for a water meter is also dispensed with.For further details, see Tipping and Scott (2001)

91
PART I I : PRACTICE
For example, a community could be provided with a basic water supplydesigned to satisfy initial demand, albeit with a degree of built-in upgradability.At this stage, any unmet demand for higher service levels would have to becontrolled by the local management committee.
After a period of time, the project could be revisited by support staff. By thisstage, users should be familiar with their current system and its capacity toprovide for higher levels of service. Their knowledge could be reinforced bymonitoring both supply and consumption. Upgrades could then be offered tothe households that want them and are willing to pay the additional capital andrecurrent costs.
10.3.4 Management and contribution systems
So far in this section the emphasis has been on the identification and develop-ment of appropriate technical options. It is also possible to extend the princi-ple of user choice to management and contribution systems. Some issuesarise:
1. Potential management and contribution options need to be identified be-fore they can be developed. Local and regional policies and plans should betaken into account. It is suggested that project staff compile their own in-ventory of non-technical options, taking into account the existence of in-digenous systems and local policies and plans.
2. The introduction of multiple service levels and associated contribution sys-tems will add significantly to the responsibilities for local management.This should be reflected in capacity building and training. An incrementalapproach may be required.
3. Local management systems cannot operate in total isolation but inevitablyneed a degree of support from the responsible authority. The provision ofhigher service levels will increase this requirement.
4. Managers and their staff need incentives. An over reliance on volunteershas led to some local management organisations being short lived. In manycountries this factor has contributed to the under achievement of water andsanitation projects.

92
DESIGNING TO MEET DEMAND
5. Management can be significantly strengthened by legal recognition. It isoften possible to register a water and sanitation committee with local gov-ernment. A legitimate committee is also more likely to receive technicaland managerial support from local government. Local disputes can beavoided by formalising the ownership of the water source.
6. Registered committees may be responsible to a local authority, potentiallyimproving their transparency and accountability. For example, there couldbe a requirement to submit books to local government for annual audit.
7. A project can only have a single management system, reinforcing the needfor an appropriate mechanism for collective decision-making. Checks maybe required to prevent a powerful elite undermining or dominating man-agement decisions. Traditional systems may be used or adapted if they aretransparent, representative and accountable.
8. Options based on community management but which involve contractingout certain roles or services to the private sector (such as the local manage-ment of water selling points) are seldom encountered but could fill an im-portant role.
9. Often technical issues (including technical operation and maintenance) aregiven priority over management and contribution systems. Someone in theproject team must be made responsible for facilitating the identification,development and selection of management and contribution options.
10.3.5 Responding to future demand
Projects sometimes fail because systems have not been established to meet orregulate future demand. Unmet demand can result in users reverting to tradi-tional sources. Alternatively, various coping strategies emerge which aretechnically, environmentally or financially unsustainable (see Box 10.5).
Demand for water supply and sanitation is dynamic. Population change andthe influence of economic and social development not only affect the types ofservice that people want, but also how these are valued. Unmet demand canerode the sustainability of a project and eventually cause its downfall.

93
PART I I : PRACTICE
Future demand has to be responded to, either by meeting it or regulating it, andthis has significant implications for how projects are planned, implementedand managed.
Designing for future demand presents a number of challenges to project staff,who usually have limited opportunities to interact with the scheme's futuremanagers. It is particularly difficult to predict population growth, an 'upgraderate', or how people's perceptions may change as their exposure to higherservice levels increases. These problems are significantly reduced if a numberof practical measures are used:
Box 10.5. Unmet demand for yard connections
Mars is a rural settlement in Northern Province, South Africa, with a populationof about 2,000 living in 315 households. Work started on a new piped waterscheme in 1996, with a main pipe supplying 17 communal standpipes. At thetime it was recommended that households should pay a flat rate of 5 Rand(about US$ 0.75) per month.
By May 2000, an estimated 80% of households had installed informal yardconnections. Although the scheme was designed to provide a continuous supply,at the time of the visit, water was being made available for four hours a day, twoto three days a week. The practice of leaving taps on and filling 200 litre drumshad resulted in an unreliable service, with some households suffering from lowpressure or not receiving any water at all. Average consumption was estimatedbetween 10 and 13 litres per capita day.
The flat rate tariff had not been changed in the five years since the scheme wascommissioned. With less than 60% of households paying their bills, the localwater committee was reluctant to increase pumping hours even though the sourcehad significant spare capacity.
When the project was completed, no system had been established to manageupgrading to a higher level of service, periodically review and reset both tariffsand pumping hours or deal with defaulters.
Deverill and Wedgwood (2001)

94
DESIGNING TO MEET DEMAND
General
! Know the limitations of the resources available (in particular, this appliesto the safe yield of a water source and the ability to dispose of waste water).
! If water is likely to be scarce, promote water-saving technologies, practicesand water conservation from the beginning of a project, rather than leavingthis to a management committee to sort out at a later stage.
! Ensure that current demand is met as far as possible.
! Estimate future demand for higher service levels, based on dialogue withpotential users and demand assessment techniques. Consult with the au-thorities responsible for planning developments and allocating land.
! Reflect the need to manage future demand in both management and pay-ment systems and the infrastructure provided.
Management systems
! Ensure that those responsible for the future management of a project areexposed to the potential problem of future demand and are fully involved indeveloping systems that can deal with this issue.
! Develop, test and practice systems to manage future demand during projectpreparation and implementation. These may include devising and agreeingrules, promoting water conservation, tariff changes, and systems for up-grading and extending a service.
! Be prepared for the unexpected. It is often difficult to predict what willhappen. In Tanzania, the population of some villages doubled after a watersupply was installed. Potential problems should be identified and discussed.
! If external technical, managerial or financial support is likely to be needed,establish and, if possible, practise those linkages during project preparationand implementation.

95
PART I I : PRACTICE
Infrastructure
! Model the impact of future demand scenarios on the proposed design. Aspreadsheet can be used to help determine the sensitivity of a design tochanges in consumption.
! Adopt a modular design with spare capacity or upgrade potential, based onestimates of future demand. For example, gravity flow schemes can be de-signed for open flow, with storage being introduced at a later stage. An-other example featuring a modular design is described in Box 10.6. andFigure 10.10.
! Make maximum use of upgradable levels of service and replicable tech-nologies. A diagram showing how a household latrine could be upgraded isshown in Figure 10.11.
! Ensure that those responsible for upgrading and extension have the train-ing, tools and if possible the experience they require to undertake this rolebefore a project enters its operation phase.

96
DESIGNING TO MEET DEMAND
1
2
3
5
4
6
120mm riser main designedfor 50l pcd for combined
population of Ezinqeni, Mpiniand uThungwini. Project rules
state no connections to bemade directly into rising main.
2
Manifold, pump house andpump control panel
designed to accommodatesecond pump.
1
Private yard tap connected tonearest 5 kl tank, not to
distribution pipe. Trickle feedoption could be offered.
Lake Sibhayi
5
Two 50 kl ferrocement tanksbuilt by community under
supervision. Provision for thirdtank to extend system touThungwini when funding
becomes available.
3
School connection for drinking water only,supplemented by 2 x 5 kl roof tanks for hand
washing and cleaning latrines.
6
Distributed storage system based on a total of23 x 5 kl ferrocement tanks built by community
teams. Each connected to 1 or 2 communaltaps, upgradable to 12 private connections
at 50l pcd). If necessary, network can beextended by building more tanks and fitting
more communal taps.
4
Built after implementation
Built during implementation
EZINQENI - MPINI WATER SUPPLY
Figure 10.10. Schematic diagram of the Ezinqeni - Mpini piped water supply

97
PART I I : PRACTICE
Box 10.6. Ezinqeni-Mpini Water Supply
Figure 10.10 is a schematic diagram based on part of the Ezinqeni-Mpini pipedwater supply in KwaZulu Natal, South Africa. The scheme was designed andimplemented by Partners in Development, and illustrates many of the technicalfeatures described in this Section.
The scheme was designed in 1996 for the Ezinqeni and Mpini communities,consisting of about 200 Zulu households with a characteristically dispersed set-tlement pattern. It was intended that at some point the piped network would beextended to uThungwini, a neighbouring community of 100 households. The ex-tension was completed in 1999 by a second implementing organisation.
The piped water system consisted of:
! A pump manifold fitted with one pump (with provision for one more)
! A pump control panel (with the capacity to control two pumps operating inparallel)
! A riser main sized to meet an average water demand of 50 lpcd for thepredicted population of Ezinqeni, Mpini and uThungwini in 10 years time.
! Two 50 kl ferrocement tanks for Ezinqueni and Mpini. The pipework wasdesigned to supply a third for uThungwini.
! Distributed storage provided by 23 5kl ferrocement tanks located on highground in Ezinqeni and Mpini, gravity fed from the larger tanks. The distri-bution pipes were sized to accommodate continuous rather than peakflow. Costs savings were used to build the 5 kl tanks.
! 25 communal taps (this number was increased to about 40), with scopefor up to 12 private connections to each 5 kl tank.
Although the technical design proved highly effective, in retrospect, managementand contribution systems capable of responding to future demand did not receivesufficient emphasis. A savings fund to help households pay for private connec-tions may have proved useful. Such a scheme would need to be established inthe early stages of implementation.
Deverill and Wedgwood (2001)

98
DESIGNING TO MEET DEMAND
Figure 10.11. Showing how a simple pour flush latrine can be upgraded toprovide a number of different service levels. Note that the higher service
levels shown may require additional quantities of water for operation.

99
PART I I : PRACTICE
10.4 Costing, pricing and subsidies
The price of an option should be based on two factors: the actual cost ofdelivering the service (and of sustaining it) and people's willingness to pay forit. In practice, prices are sometimes fixed in an ad-hoc manner that does nottake into account either of these factors.
The need for subsidies for the poor will continue. However, these need to becarefully designed and well-targeted, taking into account user demand. Apoorly designed subsidy policy may not only be financially unsustainable, butcan create a sense of dependency, with users treated as passive beneficiarieswith little or no role in decision-making.
Costing options: what to include?
When costing an option, it is important to know what to include in the calcula-tions. A number of different measures can be used, and these are listed below. Itmay be possible to link different measures with particular service levels, althoughthis can be difficult to manage and higher charges for some may in any case bepassed on to the poor by vendors or private sales.
Some of the more common ways of costing services include:
! Routine operation and maintenance (O&M), excluding major repairs.
! Full O&M costs.
! Full O&M plus a proportion (%) of capital costs (those costs associatedwith the initial provision of infrastructure).
! Full O&M, % capital and a proportion of replacement costs.
! Full O&M, capital and replacement costs.
! Full economic costing, taking into account any environmental and socialcosts (for example, incurred by down stream users being deprived of awater source) and the cost of expanding the system in the future. Whilst itis unlikely that users would be able to pay for the full economic costs, it isa good method of comparing different proposals.

100
DESIGNING TO MEET DEMAND
The long-term goal may be to reach full economic pricing where users pay for thefull environmental and social cost of expanding the system. In practice, achievingeven moderate levels of cost recovery will be a major step forward for manyprojects.
One strategy, adopted by several implementing organisations, is to charge fullO&M costs to users receiving a basic service. People wanting higher levels ofservice pay all the additional capital costs associated with that option. They alsopay O&M charges (like everyone else) and a proportion of the scheme's capitaland replacement costs. This system may be reflected in a pricing structure thattakes into account the volume of water people consume.
If such a pricing structure is used, care must be taken that it does not penalisethe poor because the higher rates associated with higher levels of service (orhigher consumption) are simply passed on to them. For example, several poorfamilies may be renting rooms in a single building fitted with a private connection.People who buy water from vendors or neighbours (who have to pay tariffs reflect-ing their consumption) may also be disadvantaged in the same way.
Pricing, cost recovery and tariff design are subjects covered by a set of guidelinesbeing written and produced by Environmental Resources Management (ERM).For further details, see ERM (2002).
Several of these measures are shown schematically in the following graph. Asthis implies, it may be possible to move from one cost measure to another in aseries of incremental steps, gradually reducing the dependency on external sub-sidies. Such a policy could be associated with upgrading service levels.
Pric
e
time
O & M, replacementand capital costs
O & M, % replace-ment and % capitalcosts
O & M plus %replacement costs
O & M costs only
123456712345671234567123456712345671234567
1234512345123451234512345123451234512345123451234512345
123456712345671234567123456712345671234567123456712345671234567123456712345671234567123456712345671234567123456712345671234567
123456781234567812345678123456781234567812345678123456781234567812345678123456781234567812345678123456781234567812345678123456781234567812345678123456781234567812345678123456781234567812345678
" # $ %
12345678123456781234567812345678123456781234567812345678%
123456781234567812345678123456781234567812345678"
123456712345671234567123456712345671234567$
123456123456123456123456123456#
➦
➦
➦

101
PART I I : PRACTICE
Our research has shown that:
! Costs are not always calculated correctly, and in some cases are not calcu-lated at all. As a result, the prices set by local management organisationsmay be insufficient to sustain a project.
! Replacement costs are seldom taken into account, resulting in problemswhen infrastructure requires renewal.
! Different service levels have different costs. This is not always reflected inthe prices charged, something that often discriminates against the poor whoend up paying relatively more per unit of water consumed.
! Pricing rarely takes into account people's demand for an option, and inparticular their willingness to pay for a particular service or service level.
! Subsidies are often badly targeted and rarely benefit the poorest householdswho may need them.
The remainder of this section looks at costing options, establishing willing-ness to pay, setting prices and allocating subsidies in more detail.
10.4.1 Costing options
Establishing the cost of a service or facility is as important as getting thetechnical design right. The following points should be borne in mind:
! Information about the reliability of infrastructure and its associated cost isoften difficult to obtain. It is important to start investigating this issue whilstconducting a technical review during the preparation of a project strategy.
! Costs are not just financial but often involve other requirements (inputs).For example, the following inputs may be associated with a household la-trine:- Land on which to place it.- Regular cleaning, for which time and water may be required.- Soap and water for hand washing; water, paper or other materials for
anal cleansing.- Regular maintenance and periodic emptying.
102
DESIGNING TO MEET DEMAND
! Many costs are location specific, taking into account the need to find, pur-chase and collect materials or spares.
! Replacement costs are often omitted in calculations, possibly because theyare incurred outside the project's immediate time 'horizon'. However, insome cases, major components need replacing after only a few years usedue to accident, theft or normal wear and tear.
! To ensure transparency and accountability, people should know how costsare calculated.
! The cost of delivering and sustaining an option will often depend on itspopularity, due to the influence of economies of scale. This reinforces theneed to set prices after conducting some form of demand assessment toconfirm people's willingness to pay.
Example 1: Costing a piped water supply
An example showing a breakdown of possible O&M and replacement costs(in US $) for a pumped water supply is shown in Table 10.2. The data is basedon the costs of an existing scheme in KwaZulu Natal serving about 200households.

103
PART I I : PRACTICE
Notes(i) These figures are based on supplying 20 litres per capita day. This equates
to an 8 hour pumping day or 240 pumping hours per month.
(ii) The servicing schedule and related costs are calculated from theanticipated operating hours and the manufacturer’s handbook.
(iii) There are many ways of calculating capital replacement costs, some ofwhich compensate for the time value of money.
The time value of money
The value of money is related to inflation and interest rates in the local andinternational economy. The value of $1 today will purchase more goods than$1 in five years time. Therefore, communities and project staff should beencouraged to think about how prices of local and imported componentsmight change over their life-time to ensure that O&M replacement costs canbe paid for in the future.
Cost area Monthly cost $
Source of information
Fuel costs (ii) $ 180 Based on an 8 hour pumping day
Motor and pump servicing costs(ii)
$ 20 Based on local experience, taking into account spares and technical expertise
Motor and pump replacement fund (iii)
$ 16 In this case, based on an 10 year lifespan and an interest rate of 15% (for details see below)
Pipe network spares $ 15 Local experience of neighbouring schemes
Pump operator�s salary $ 40 Part time skilled wage
Caretaker�s salary $ 40 Part time skilled wage
Book keeper�s salary $ 30 Part time skilled wage
Administration $ 25 Local experience
Sub-total $ 366 Assumed 100% cost recovery
Additional increment $ 92 Based on 25% non-payment rate
Total $ 458
Table 10.2. Operating and replacement cost analysis for a communitypiped water supply

104
DESIGNING TO MEET DEMAND
If users do not save for the replacement of major components, the sustainabilityof most water supply and sanitation projects may be short lived.
One way to do this is to set aside an equal amount (or annuity) every year,taking into account the local interest rate19. This is known as amortization, andis based on an annuity factor (AF) which can be calculated from financial costtables. Its value is a function of the expected life-span of the component inyears (n) and the interest rate (r) in the national economy.
Annuity factors are tabulated in Annex A at the end of this book. The formulafor calculating annuity factors is fairly complicated. As long as implementersunderstand that the annual amount saved should be slightly higher than thecurrent price of a component divided by its expected lifespan in years, thecommunity will be in a better position to replace the part concerned.
Example 2: Costing a handpump
Estimating the cost of a handpump can be relatively simple. The followingexample is based on the Finnish Nira hand pump, used in many countriesincluding Tanzania, from where the following data originates20.
In 2000, the local cost of a Nira handpump in Tanzania was about 625 US $(for a shallow well about 8 metres deep. O&M costs are set out in the Table10.3, and average 56 US $ per year.
19 In practice interest rates are often linked to inflation.
20 For further details see Concern Worldwide (2000).
Annuity = Current replacement costAnnuity factor (AFn,r)

105
PART I I : PRACTICE
In this case, if the pump is well maintained, after 10 years its life can beextended by a further 10 years by replacing a number of critical components.These have a current price of $ 314.
The amount that needs to be set aside each year to raise enough funds topurchase these components in 10 years time can be calculated using anannuity factor. Once again, the appropriate annuity factor can be looked up inAnnex A and used to calculate In this case, assuming an interest rate of 5%;
Finally, replacement costs for the hand-pump valued at $625 can calculated,based on a 20 year life span. Again, applying an annuity factor to the presentvalue of the hand pump ($ 625) results in an annual cost of $ 50.2
Table 10.3. Estimated O&M costs of the Nira AF 85 handpump
Item
Sleeve bearing, required every 2 years
Standing plate, required every 5 years
Cylinder pipe, every 3-5 years
Six M12 nuts and washers every year
Wages for pump attendant
TOTAL
Unit cost(US $)
17
13
5
6
15
56 US $
33
65
20
1
NA
AF(10,5) = 7.72
Annuity = 314/7.72 = $ 40.6 per year
AF (20,5) = 12.46
Annuity = 625/12.46 = $ 50.2 per year
Annual cost(US $)

106
DESIGNING TO MEET DEMAND
The resulting costs of the Nira handpump are summarised in the followingtable.
Table 10.4. Summary of O&M and replacement costs for the Nirahandpump
Cost Description
O&M costs (recurrent)
10 year refit
20 year replacement
Total annual costs, years 1-10
Total annual costs, years 11-20
Annual cost (US $)
56.0 $
40.6 $
50.2 $
146.8
106.2
Table 10.4 shows that in order to enjoy the benefits of the handpump in thefuture, its users should set aside almost 150 $ a year for the first ten years.Assuming the pump is used by 30 families and a flat rate payment system, thisis equivalent to 5 $ per household per year. This figure does not include thecosts of tool replacement, every day caretaking and the cost recovery systemitself. For a point water source in a small village, this last component can bevery high unless a flat rate or equitable share system21 is used.
In many communities, what happens in practice is that people wait until thehandpump breaks down. At that stage, the community - or better-off house-holds within it, may club together to pay for a repair. This could be termedreactive cost recovery.
When presenting costs to users, it is recommended that the advantages anddisadvantages of planned and reactive cost recovery are discussed. The char-acteristics of each system are compared in Table 10.5
21 Flat rate household payments can be made more equitable by taking into account three factors - the distance to the
source, the number of people in the household, and ‘special’ factors such as disability. The proportion of the cost
paid by each household can be agreed by the users themselves using a simple matrix.

107
PART I I : PRACTICE
Table 10.5. Comparison of reactive and planned cost recovery
Reactive cost recovery
Low regular charges - or no chargesat all.
No major fund to look after - reducedneed for management systems andaccountability
Breakdowns may be very expensiveto repair compared to costs of pre-ventative maintenance, and may oc-cur at time when financial resourcesare scarce.
Breakdowns may take time to fix - ifthey are fixed at all.
Payment for repairs may take intoaccount local perceptions of poverty.
Planned cost recovery
Charges may be significantly higher(for example, see Table 10.4).
Requirement to manage accumulat-ing funds - increased need for finan-cial management skills and account-ability.
Opportunities to use funds for devel-opment - e.g. to start a rolling fundfor sanitation improvements or small-scale production. However, this re-quires management skills.
Regular payments may be required fora number of maintenance options, forexample, a leasing arrangement.
Problems may arise if a breakdownoccurs well before it is anticipated.

108
DESIGNING TO MEET DEMAND
10.4.2 Testing demand for developed options
Once they have been developed and costed, options can be tested to establishpeople's demand, including their willingness to pay for them. This process isreferred to as demand assessment, although this term can also be used todescribe the measurement of demand in any stage during the project process(for example, see Section 8.2). In general, the less that users have participatedin the identification and development of options, the greater will be the needfor thorough demand assessment at this stage.
Assessing demand for developed options can be used to:
! Establish what people are willing to pay to receive and sustain particularoptions. This information can be used to design a pricing or tariff structure.
! Predict future demand for higher service levels, in other words, the upgrad-ing rate.
! Establish whether any particular group risks being disadvantaged or ex-cluded.
! Assess the degree of confidence that members of the public have in thedevelopment process itself and the key stakeholders involved.
Various techniques have been developed to assess demand in this way. In allcases, each option is described in detail before asking those involved to statewhat they would be willing to pay to receive it. The validity of the responsedepends on (or is contingent on) users receiving the option as it has beendescribed. For this reason, the techniques used can be considered as differentforms of contingent valuation22.
There are two main types of contingent valuation, based on whether peopleare involved individually, as in the case of a one-to-one interview that formspart of a larger survey, or collectively, as in a focus group discussion. In
22 Contingent valuation has already been mentioned in Section 8.2.2 That concerns its use as a tool to predict likely
demand so that it can be reflected in a project strategy. In this section, the same technique is being used to confirm
demand for developed options later on in a project.

109
PART I I : PRACTICE
practice, the term contingent valuation methodology (CVM) is formally usedto describe the first type of exercise. The basic characteristics of discussionbased and interview based techniques are compared in Table 10.6.
The most important distinction is that CVM can produce statistically useabledata which can then be analysed to identify or rule out bias. This requires astatistics package or spreadsheet - and an experienced analyst. By comparison,group based techniques are more subjective, but allow people to discussissues with their peers before making up their mind. Discussions need carefulfacilitation to avoid them being dominated by an elite.
An example demonstrating the use of CVM is described in Box 10.7. Thisconcerns assessing demand for improved water supplies in informal streetsettlements in Dar es Salaam. A key objective of the exercise was to establishhow much users would be willing to pay to receive an improved service.Details of how to implement a simplified form of CVM in peri-urban areasand informal settlements are found in Wedgwood and Sansom (2001).

110
DESIGNING TO MEET DEMAND
Discussion based demandassessment
DescriptionFacilitated focus groups are presentedwith a menu of options, including de-tails of potential costs and benefits.
Options are usually presented in theform of a sanitation or water ladder(see Figure 10.8)
Participants discuss the relative mer-its of each option, before signallinghow much they are prepared to con-tribute to receive or sustain it.
People can be given a range of pricesto choose from to help them makethis choice.
RequirementsTrained facilitators are required to en-sure process is not dominated by anelite and that focus is retained.
Factors to ConsiderEngineers can enter dialogue withpotential users.
Numbers consulted are necessarilylimited. Results may not reflect viewsof population as a whole.
Participants may not give accurate an-swers due to influence of group.
Time and experienced facilitation isneeded to ensure process capturespeople�s perceptions.
Interview based demandassessment (CVM)
DescriptionSelected householders are inter-viewed by an enumerator as part ofa survey.
Enumerator describes options to therespondent, before asking how muchthe person would be willing to pay.
Respondents are asked to state howmuch they would be willing to pay,by responding to a series of price op-tions. Bias is managed by varying theorder in which price questions aregiven.
Once information is collected, dataare processed to establish relation-ship between price and popularity.
RequirementsEnumerators require training. Ques-tionnaires must be carefully designedand tested.
Statistics software or spreadsheetrequired for data processing.
Factors to ConsiderNumbers involved are limited by re-sources available. Minimum numberof respondents needed to achievestatistically valid result.
Reliance on interviews may result inrespondent not understanding thequestions being asked.
Dependency on specialist expertiseand minimum size of survey canmake CVM prohibitively expensive.
Table 10.6. Comparison of demand assessment techniques

111
PART I I : PRACTICE
WaterAid (Dar es Salaam) is in the process of developing a simpler form ofdemand assessment, combining the interview technique with group discus-sions. Similar techniques have been tried elsewhere. One of these, known byits acronym PREPP, has recently been developed by WEDC for use in high-density informal settlements. This technique is described in Box 10.8.

112
DESIGNING TO MEET DEMAND
Box 10.7. The use of CVM in Dar es Salaam
WaterAid Tanzania recently used CVM to investigate demand for water supply andsanitation improvements in a number of street settlements in the Temeke mu-nicipality of Dar es Salaam. The process was facilitated by an external consultantover three weeks including data processing.
A questionnaire was first developed, based on an assessment of people's copingstrategies and a number of service level options. A local artist was used to repre-sent options on a number of cards. Enumerators were selected from local gov-ernment, NGOs and the communities themselves, receiving training before test-ing the questionnaire on a number of households.
In total, 420 households were interviewed. About half the respondents werewomen, 15% of which headed households. The results were then processed inthe UK using a spreadsheet.
Despite the outwardly similar appearance of people's houses, the survey revealedthe extent that their preferences differed. Demand could only be met by providingmixed service levels.
The survey confirmed that a significant proportion of households were willing topay up to US $100 to receive a private connection. In the past, WaterAid hadfocused on communal water points.
Lessons Learnt
1. The selection and training of enumerators is very important. In this case,the involvement of local people was very useful as they were able to estab-lish a rapport with respondents.
2. More emphasis was needed to establish the costs of different options. Itwas particularly difficult to cost extensions of the government piped watersupply.
3. Options must be environmentally feasible. WaterAid may not be willing tooffer higher levels of service to all that demand them because this mayexceed the safe yield of the boreholes involved.
4. Although the quality of the CVM is important, so too is the willingness ofthe client to use the results to inform policies and plans.
Ndezi and Wedgwood (2001)

113
PART I I : PRACTICE
Box 10.8. The PREPP approach
PREPP (Participation, Ranking, Experience, Perceptions and Partnership) has beendeveloped and tested in high-density informal settlements. It involves a facilitator,focus group and an engineer, and is relatively rapid, taking a few hours to workthrough its five steps.
Steps1. A water ladder, consisting of a range of pre-tested pictures, is used to
examine people's experience of existing water sources.
2. Participants are asked to rank their preferences by placing markers againsteach relevant picture, explaining their choice.
3. The group discusses their perceptions of the water utility and the service itprovides.
4. Participants are presented with pictures representing future options, com-plete with estimated costs, together with the most popular existing sources.Individual preferences are indicated.
5. Finally, household expenditure charts are used to confirm how people allo-cate financial resources.
The value of PREPP is that it facilitates dialogue between potential users andengineers, helping ensure that people's experience and preferences are reflectedin the service and facilities provided.
Sansom et al (2000)
10.4.3 Pricing
The results of a demand assessment exercise should be used to set prices thatreflect demand for different options. The following associated points areparticularly important:

114
DESIGNING TO MEET DEMAND
1. Willingness to payPrices should be informed by the results of demand assessment. Some of thetechniques that can be used in this context have been described in thepreceding section.
2. Adjusting pricesPrices may need to be periodically adjusted. The organisation responsible forcost recovery must be able and sufficiently confident to do this.
3. Transparency and accountabilityThe pricing process must be transparent and accountable. The mechanismused to set, review and adjust prices should be approved by users. Some sortof regular audit may be required to ensure that public confidence is main-tained.
4. Pro-poor strategiesThe effect of a pricing strategy on poor users must be checked before it isimplemented. What at first may seem a pro-poor policy may turn out to havea negative impact. For example, a rising block tariff may result in poorfamilies which share a single tap in a rented block paying the highest tariffrate.
5. Appropriate paymentsAlthough a service can be priced in non-monetary terms, for example, requir-ing a payment of rice or corn, this serves no purpose if the product usedcannot be converted into the inputs needed to receive or sustain the service.
6. Emergency fundsSome implementing organisations require that users contribute towards anemergency fund. This results in a relatively large sum of money beingdeposited in a savings account. Even though interest is being paid, users mayfeel that this is not using their contribution effectively and that the systemlacks accountability. It may be possible to mobilise a proportion of thesefunds for other purposes, for example, to start a revolving fund.
10.4.4 Subsidies
Given the limited resources available to some households it is inevitable thatsubsidies will continue to be needed. However, they need to be well targeted.In practice, subsidies are often claimed by better-off households and seldomreach those most in need (WELL (1998) p108).

115
PART I I : PRACTICE
The requirement for subsidies can be reduced by developing low cost options,and improving access to credit or payment by instalment. A low cost optionhowever will only be a satisfactory solution to the extent that it meets people'sdemands – if it is perceived as inferior they may not be willing to pay for it ormaintain it. In addition, savings and credit facilities tend to be used by thebetter off rather than the poor, many of whom are in debt.
In some cases, a relatively small, well-targeted subsidy can have a significantimpact, both by making a basic option more affordable and also by motivatingpeople to take action. UNICEF and other organisations have learnt the follow-ing lessons:
! Always find out what people are willing to contribute before designing asubsidy programme.
! Investigate and, if possible, build on local practices concerning cross-sub-sidies.
! Investigate opportunities for local cross subsidies. For example, commer-cial users who profit from their use of water could be charged a higher rate.However, it is important to ensure that this does not impact negatively onthe poor, for example if higher rates are simply passed on.
! If policies permit, household subsidies can be managed locally and allo-cated according to local perceptions of need (for example, see Box 10.9).The result can be more efficient targeting and a greater overall impact.
! Consider providing subsidies in the form of materials or specialist advicerather than cash.
! Establish systems that can account for how subsidies are used.
! Only subsidise a basic level of service, with the additional costs of higherservice levels being borne by the users themselves.
! Ensure that the subsidised price of options still reflects the level of servicebeing provided.
! Never give subsidies as a short-term fix to increase coverage.

116
DESIGNING TO MEET DEMAND
! Be transparent in developing and implementing a subsidy policy.
Adapted from EHP (1997) and others
The following example illustrates how NEWAH has used wealth ranking totarget subsidies more effectively in rural communities in Nepal.
Box 10.9. Using wealth ranking to target subsidies
NEWAH has a policy of continuously refining its policies. The creation of a Povertyand Gender group has helped focus attention on these particular issues. Onetangible result has been the recent introduction of a wealth ranking exercise, theresults of which are used to target subsidies more effectively.
A group of 10-13 people are selected by the community to participate in theexercise and identify suitable indicators. Typical criteria are shown in the boxbelow (left). Every household is then placed in one of six socio-economic groups.The characteristics of group 5 are shown in the box (right). The lowest group(group 6) includes the landless poor who have to work in other people's fields tosurvive.
The results of the exercise are then used to determine who contributes what. Thisapplies to the initial cash contribution as well as regular O&M payments. Sanita-tion slabs are provided free to those in groups 5 and 6. Those in groups 4, 5 and6 are favoured when it comes to employment. Vulnerable households are notexpected to contribute voluntary labour, but get a basic wage.
Bajracharya and Deverill (2001)
Criteria for Wealth Ranking! Land ownership! Business ownership! Employment! Indebtedness and "bandha"
or bonded labours! Type of home! Food security
Example: group 5 characteristics! Home owner! Own small parcel of land! Large family size! Loan taken! Some family members
"bandha"

117
PART I I : PRACTICE
Appraising a community plan
In the last section we have seen how a menu of options can be identified, devel-oped and costed. Demand can then be assessed using an appropriate tech-nique. The results of the demand assessment may then be used to help setprices and to gauge the popularity of individual options.
The resulting information can be put together in the form of a planning report thatincludes a detailed design (including a menu of options), a budget and a sched-ule of activities and tasks.
One purpose of such a document could be to inform the project's funder (whetherthis be government, an international donor or an intermediary) about the out-comes of the planning process, and in particular:
! The alternatives considered.! The decisions which were taken.! The process by which decisions were made.! The options to be presented.
It is also possible to present the plan to the community for their formal approval.The form this takes and the methods used must be tailored to suit the needs ofthe audience.
In the UNICEF supported water supply and sanitation projects in Orissa, commu-nity action plans are represented on a large exterior wall in the centre of eachvillage concerned. This dramatic visual aid provides a focus and a reference pointfor the discussions that follow. The plan continues to be used as a backdrop forsubsequent meetings and open discussions, and eventually becomes a monitor-ing tool against which progress is checked.
If a local organisation (this could be a watsan committee, a government depart-ment, an NGO or a private company) is to be responsible for implementing theproject, it should be prepared to present and discuss it in this way, answeringquestions and responding to people's concerns.
Such a presentation should include details of what the options are, the contribu-tions needed to receive and sustain them, and how they are to be made avail-able. It should also include a realistic time frame.
PREP SEL PLAN APP IMP OP

118
DESIGNING TO MEET DEMAND
The final stage of such a meeting could involve a vote of approval for both theplan and the local management organisation that will be involved in its execution.This in itself is an indicator of demand. Approval could also be supported by adecision to start collecting the contribution required.
A community map used to present an action plan in a village inGanjam District, Orissa
This underlines the point that users who take key decisions on behalf of othershave responsibilities both to the project's funder and the households they repre-sent. The role of project staff changes from implementing a project on behalf ofpassive beneficiaries to (i) facilitating users to make informed decisions about theservices they require and (ii) providing advice to a local management organisationthat is responsible for executing a community plan.
Uni
cef W
ES
(Ori
ssa)

119
PART I I : PRACTICE
11. Implementing a community plan
Implementation is not just about construction. Firstly, users have to choosewhich option they want to receive. The result may be mixed levels of service.It is likely that not every user will get his or her first choice and that some sortof negotiated compromise will be required.
Implementation is also the stage in the project when concrete demonstrationsof demand can be used most effectively to guide project progress. Appropriateindicators of demand have to be selected which are clearly linked with theservice and service levels being provided.
Finally, implementation provides the opportunity for project staff to formalisetechnical, contribution and management systems. These will underpin thelonger-term sustainability of the services being provided.
PREP SEL PLAN APP IMP OP
Decision-making and financial control
Decision-making and financial control are inevitably linked. Most key decisionshave financial implications. If decisions are to be made by users or their repre-sentatives, key aspects of financial control should be devolved as well.
Project staff may want to devolve decision-making, but can be reluctant to letusers make decisions which have important financial implications. This is hardlysurprising, as an implementing organisation has responsibilities to the project'sfunder, and often has to bear the risk of failure.
Organisations like Mvula Trust believe that communities must take financial con-trol, but this must be founded on effective capacity building and training to en-sure that funds are well managed. The system is supported by safeguards andmonitoring, although this results in additional bureaucracy and occasional timedelays.

120
DESIGNING TO MEET DEMAND
11.1 Presenting and agreeing options
The key to presenting and agreeing service options is an effective communica-tion strategy. This could inform users of the following:
! How the project is going to be implemented, including details of its man-agement structure, budget, time-frame, reporting and feedback arrangements.
! Which service level options are available. This should include a detaileddescription of their characteristics, including their upgradability. It is alsoimportant to detail any constraints that may narrow choice in certain areasor situations.
! The type and size of contribution required to receive and to sustain eachservice level option. There may be a choice of contribution methods. Ifcosts are sensitive to the popularity of an option, this should also be ex-plained, with a price range being supplied instead.
! How the prices charged are related to the costs of providing and sustainingthe service.
! Details of any local rules or by-laws that apply. For example, it is importantthat a user of a piped water supply understands the implications of not pay-ing before he or she opts for that system.
! Finally, how users can apply to receive a particular service level and howlong this process is expected to take.
! The communication techniques referred to in Section 10.3.2 can be used oradapted to get these messages across.
It may be appropriate for users to demonstrate their preferences by applyingfor a particular level of service. The application process should be carefullymanaged, especially if a cash deposit is concerned, in which case transparencyand accountability are particularly important. Practically, it may be necessaryto cluster households in order that the service can be delivered as efficiently aspossible.
121
PART I I : PRACTICE
One of the key responsibilities for project staff is to try to meet user prefer-ences as far as is technically and economically practicable. It is likely that noteveryone is going to be satisfied. For example, it may prove impossible tosupply a family tube well because the water table is too deep in that particularlocation. This situation is better handled if:
! Users understand from an early stage that it may not be possible to meettheir first preference.
! Demand for options has already been properly assessed, giving project staffand local managers a good indicator of what to expect.
! A number of alternative options exist.
! Local investigations are conducted (and if necessary deposits returned)quickly.
! Project staff and local management are seen to be concerned and do theirbest to resolve the situation.
A flexible, common-sense attitude is often required. For example, if themajority of households opt for yard taps, whilst a small minority of poorhouseholds opt for communal wells, it may be possible to arrange a local crosssubsidy and provide a piped system with yard taps and communal stand pipesinstead of communal wells.
11.2 Using demonstrations of demand
Before the implementation stage of the project, there have been relatively fewopportunities for all users to demonstrate their demand for improved services.It is possible that people did contribute a deposit or 'feasibility fee' during theselection process. Representative groups of users (for example, those in focusgroups) and appointed managers may have been heavily involved during theplanning phase.
Only after options have been developed, however, is it possible to confirmhousehold demand for a specific service and service levels.

122
DESIGNING TO MEET DEMAND
The main reason why demonstrations of demand are needed is to indicate toproject staff whether the planned service improvements do indeed match userdemand. If not, there is still time for the implementing organisation to dosomething about it.
A range of indicators can be used as demonstrations of demand, the mostimportant of which are described below. These must be clearly linked with theservice or service levels being provided. At the same time, indicators must becarefully selected, ensuring in particular that the perceptions of vulnerablegroups are represented.
Whilst the use of a range of indicators may give a more reliable picture thanrelying on one, project staff should not create the impression that users have topass an endless series of demand responsive 'tests' to keep the project going.
11.2.1 Contracts
An agreed contract between the local organisation providing the service andthe household receiving it can - in some circumstances - be used as anindicator of demand. Such agreements should detail both the rights andresponsibilities of the parties involved. For households, the latter may includethe acceptance of rules concerning the use of and payment for the servicesprovided.
The use of contracts depends above all on their perceived authority andcultural acceptability. In practice, it may be most effective to adopt or adapt alocal method of formalising an agreement. If written contracts are used,illiteracy may exclude many users, particularly women and the poor.
Ensuring the local management committee has some form of legal standingcan provide a contract with additional authority. A less formal alternativecould be to establish a user group or association, complete with membershipcards and rules.

123
PART I I : PRACTICE
11.2.2 Upfront cash payments
An upfront or advanced cash payment is often considered to be a clearindicator of demand and can be important for confirming the ownership of thefacilities being provided. Upfront cash contributions can also indicate acommunity's ability to organise and collect payments. The size of the contri-bution should be linked to the cost of the service being provided and anassessment of people's willingness to pay (see Section 10.4.2).
However, as an indicator of household demand, cash payments have somelimitations. In some communities, a wealthy individual may put up the entirepayment required. An unscrupulous contractor may do the same to secure alucrative contract. Households with less influence may be coerced by othersinto making a payment, even if this means taking out an expensive loan.
The size and timing of contribution also requires careful consideration. Bothfactors should reflect the degree of confidence people have in the project andthe realization of its outputs. This implies that contributions should be stag-gered during implementation.
Caution is therefore required. If an upfront cash payment is required, usersshould be warned well in advance in order that they can save up funds ifnecessary. As previously mentioned, it may be necessary for the project toestablish a savings scheme. In any case, the timing of any substantial cashpayment should coincide with the seasonal availability of funds. An exampleillustrating the use and importance of cash payments is described in Box 11.1.

124
DESIGNING TO MEET DEMAND
Box 11.1. The significance of cash contributions
WaterAid�s rural water supply and sanitation programme in Niassa Province, Mo-zambique, reinforces the link between cash contributions and ownership.
A key aspect of the Government�s new water policy is that communities need todemonstrate their capacity to sustain a water system. One way of doing this is tomake an up-front cash contribution towards the capital cost of the supply.
! The cash contribution demonstrates whether communities have the or-ganisational and financial capacity to raise cash.
! It can indicate the degree of confidence users have in the project�s imple-menters (including a local management organisation).
! It also provides some evidence of a community�s interest and commitmentin the scheme, as would a contribution of labour or resources.
It is however questionable whether the cash collected is an indicator of a com-munity�s ability to pay for operation and maintenance over time.
An interesting issue to emerge from the programme in Niassa is the desire ofparticipating communities to pay for their new systems rather than contributingresources or labour. The previous national water policy in Mozambique statedthat communities would feel a sense of ownership if they contributed labour andhoused and fed construction teams. However, evidence from the field stronglysuggested that people believed that they owned a system only if they paid for it.
Breslin (2000 a&b)
11.2.3 Work
A contribution of work is often required during the project implementation,and this can also be used to demonstrate demand. Rather than being com-pletely voluntary, people may instead receive a reduced wage.

125
PART I I : PRACTICE
A number of points should be borne in mind:
! If people are to receive a reduced wage, this must be selected carefully. Ifthis is too high, the project may be perceived as an income earning opportu-nity, with people valuing their wages rather than the service being pro-vided. An alternative may be to provide meals during the construction pe-riod.
! The poor, especially those who have no land, may find it as difficult tocontribute labour as to provide cash, because they are forced to work toearn a basic living.
! The availability of people's time is often seasonal, especially in rural areas.This underlines the value of developing an implementation time table thatis based on a local calendar.
! Women often end up doing voluntary work, thereby increasing their dailyburden.
! Local regulations (for example, concerning union membership and healthand safety) may restrict the use of volunteers to construct infrastructure.
! Regardless of whether work is voluntary or not, it is still necessary to su-pervise quality.
! In some cases it may be possible to offer a degree of flexibility, acceptingcash or another form of contribution instead of work.
11.2.4 Materials
The provision of materials is also a contribution that can be used to demon-strate demand. Because it involves people's labour, all of the points consid-ered above also apply. The availability of materials is location dependent (andmay also be seasonal) and this should be taken into account.
11.2.5 Time and interest
It can be relatively simple to monitor demand based on the interest peopleshow in attending a well-publicised meeting during which critical issues are tobe discussed. The meeting's purpose, location and timing must be carefully
126
DESIGNING TO MEET DEMAND
considered. A number of separate meetings may be needed to capture thesocial or cultural diversity of the community concerned. Having said that, toomany meetings, especially if they are perceived as having little significance,can erode interest as quickly as the credibility of the organisation holdingthem.
Committee and focus group members are often expected to put a considerablenumber of hours into first developing and then implementing a plan. Thedifficulty sometimes experienced just getting to a meeting is often over-looked. Project staff need to be sensitive to these issues.
11.3 Preparing management for its future role
Being demand responsive and offering options that result in mixed levels ofservice make managing the completed project more complex. As has beenmade clear in Section 10 the need to respond to future demand adds to thischallenge.
It is therefore essential that the local management organisation is fully pre-pared to undertake its role. Fortunately, there are many opportunities to ensurethis happens that arise during project implementation.
Responsibilities for this important aspect of capacity building fall on theorganisation implementing the project and in particular, on engineers whooften have financial, technical and management skills. The remainder of thissection details four activities, all associated with future demand, for which a
Preparing management for its future role
The underlying principle is that all the responsibilities of a managementorganisation should be tested and practised during implementation.

127
PART I I : PRACTICE
local management organisation could be responsible. In each case, the tasksdescribed should be practised and tested during implementation.
11.3.1 Price review and adjustment.
Periodically, costs should be reviewed and, if necessary, prices reset. Theorganisation responsible for this task must have the necessary skills andconfidence to carry it out. It must also be able to communicate any changes inprices and explain its action to users.
11.3.2 Upgrading
Technical, financial and management systems are needed to ensure that theprocess of upgrading is managed. In some cases, upgrading will have to becarefully regulated so as not to exceed technical or environmental constraints.The provision of mixed levels of service during implementation providesopportunities for local managers and their staff to develop, test and practisethe upgrading mechanism.
11.3.3 Expansion
Expansion does not simply mean extending a pipeline, but also replicatingfacilities such as wells or latrines to respond to unmet demand. Extending apiped water supply may require external financial and technical support.Responsibilities for providing this support should be agreed during projectpreparation. During implementation, any mechanism for requesting and re-ceiving external support should be practised. External support will be moreeffective if it has access to as-built drawings which detail what was actuallyimplemented (rather than what was intended).
A simple management tool that can facilitate the locally managed constructionof facilities such as domestic latrines, wells and tube wells is the job card. Thissets out the process to be followed and the materials and other inputs required.It also provides a system to monitor quality. Job cards are described in moredetail in Box 11.2.

128
DESIGNING TO MEET DEMAND
Box 11.2. The job card
Job cards have been used by implementing organisations in South Africa, origi-nally to facilitate the local management of sanitation programmes. They havealso been used to simplify the delivery of wells and tube wells. An example of ajob card is shown on the following pages. In this case it is associated with theMbila sanitation and hygiene project, first described in Box 10.2.
The card is initiated when a householder shows interest in acquiring a latrine.Personal details are recorded and a job number allocated. The materials required(shown on the job card) are then dispatched. The householder initials the form toconfirm receipt of the materials delivered.
As work proceeds, the job card details the payments that should be made. Achecklist on the reverse of the card is used to check the quality of the workbefore the latrine is finally handed over to the customer.
As a management tool, the job card sets out the process by which a service isdelivered, simplifies logistics and financial management, and helps with qualitycontrol, monitoring and evaluation. It also enables a local management team tocheck on progress. It has proved particularly effective when a local managementorganisation was faced with the problem of responding to increasing demand forsanitation, allowing it to manage four construction teams simultaneously.

129
PART I I : PRACTICE
VIP Latrine Job Card & Handover Certificate
TRIBAL AUTHORITY: MBILA ISIGODI: uThungwini
Part 1: General
Name of Householder: Job Card No: Receipt No:
Mike Mdletshe 14 106
Part 2: Material, Labour, Transport & Management Needs
Type Unit Quantity Unit Total Material
Needed Cost (R) Cost (R) Issued
Initials
Cement pockets 5 26 130 ML
Weld Mesh metres 4.6 22 101 ML
Galvanised wire kg 1 5 5 ML
Toilet lid 2 16 16 ML
Plastic liner 1 8 8 ML
110mm Vent Pipe 3 metres 1 60 30 ML
Fly Screen 1 2 2 ML
Manual 1 10 10 ML
(Householder)
Builders, Transport and Management Signature
Mbazwana Transport Per Toilet 50 50 HM
Pit team Man days 4 25 100 TM
Pit team leader Man days 2 15 30 TM
Local transport Per Toilet 25 50 ST
Quality Assessor Per Toilet 15 150 KL
Book keeper Per Toilet 10 10 HL
Office expenses Per Toilet 40 40 DZ
Final Inspection Per Toilet 10 10 KL
(Recipient)
Figure 11.2. An example of a job card developed by the Mbila Sanitationand Hygiene Project in Kwa Zulu Natal. The quality control checklist and
handover certificate are printed on the reverse.

130
DESIGNING TO MEET DEMAND
Part 3: Quality Control and Handover FormSignature (QA) Date Remarks
1. Materials
Materials on site KL 10/05/1998
(Tractor driver can be paid after materials for 10 toilets dropped off on site)
2. Precasting Rings
6 rings made and approved KL 23/05/1998
Slab and predestal cast and approved KL 23/05/1998
Location approved KL 23/05/1998
3. Sub-structure
Pit excavated KL 31/05/1998
Rings backfilled KL 31/05/1998
Slab level KL 31/05/1998
Pedestal complete & ok KL 31/05/1998
(Builders, local driver and QA can be paid after 10 superstructures completed)
4. Super-structure
Ventilation KL 22/06/1998
Fly Screen KL 22/06/1998
Drainage KL 22/06/1998
Darkness KL 22/06/1998
5. Hygiene Visit
(Signed by health worker) JM 28/06/1998
(QA can be paid after superstructure is completed and the deposit returned)

131
PART I I : PRACTICE
11.3.4 Monitoring systems
Monitoring systems should also be established and initiated during implemen-tation. These should be designed for use by local management, and focus onissues relating to sustainability. In this respect, monitoring the quality of thework undertaken is very important.
Monitoring quality
The potential users of the service being provided are potentially very effectivemonitors of quality, having a major stake in the outcome. To realise thispotential, appropriate indicators of quality have to be identified, and tools andtraining provided. Project staff must be able to devolve this responsibility,monitoring the local monitoring system rather than the work itself.
A practical example of user based quality control has already been referred toin Box 11.2. In this case, the local management group checked the quality ofeach VIP (together with the householder) before handing it over.
It was the householder's responsibility to complete the superstructure. If thiswas deemed to be inadequate (in terms of its operation), an initial deposit of100 Rand (about US $ 10) made by the householder would be used to setthings right. Otherwise this deposit would be returned.
Monitoring demand
Other than the quality of work being undertaken, it is also important for thelocal management organisation to be able to monitor a number of otherindicators, many of which are related to demand and therefore the sustainabilityof the service in question. These are described in more detail in the nextsection. It is however important to note that such systems must be developed,tested and put in place during implementation, whilst project staff are stillavailable to provide advice.

132
DESIGNING TO MEET DEMAND
11.3.5 Management manuals
To complement the training outlined above, it is recommended that the localmanagement organisation is left with a practical manual detailing its tasks,how to carry them out, and who to contact should a problem arise. Such amanual could also include details of the technical and financial tasks that themanagement organisation is responsible for.
For some time it has been widely recommended that those implementing aproject produce a detailed operation and maintenance manual, handing it overto a water committee once implementation has been completed. What is beingsuggested here is an extension of that idea. However, in this case, the manualwould be developed and used during implementation as a training aid, in linewith the principle defined earlier in this section:
The following table gives some indication of what could be included in such amanual for a piped water supply. Presentation is as important as content, withclear, simple to understand instructions being the key. In this respect, check-lists and flow charts can be very effective.
....all responsibilities of a management organisation should be tested andpractised during implementation.

133
PART I I : PRACTICE
Table 11.1. Suggested contents for a management manual
1. As-built drawings of scheme showing pipe sizes and location.
2. Details of each major component or module.
3. Maintenance calendar and practical details of each maintenance task.
4. Technical notes on upgrading and extending the system.
5. Profit and loss sheets and instructions how to use them. For details seeSection 12.3.
6. Tariff adjustment chart and instructions.
7. Details of monitoring system and instructions.
8. Contact details of support organisations and their responsibilities.

134
DESIGNING TO MEET DEMAND

135
PART I I : PRACTICE
12. Operation
The final section in this booklet concerns both operation and maintenance(O&M) and monitoring and evaluation (M&E). In the past, these have beenseparated institutionally. O&M was the responsibility of local managementand the users themselves, and M&E the responsibility of the external client orgovernment agency.
More recently there has been a shift in thinking, associated with the principlethat management functions should be devolved to the lowest appropriatelevel. If responsibilities for management are to be devolved, so too shouldM&E systems which can serve as a valuable management aid.
This section focuses on how a small number of demand related indicatorscould be used by local management to help sustain a water and sanitationproject. It should be pointed out that whilst this internalises M&E, it also helpsreinforce the links with mentoring and external support agencies.
12.1 Principles of community based M&E
Mvula Trust has developed a set of clear principles for community basedM&E for rural water supply and sanitation projects. These are particularlyappropriate for a demand responsive project and are listed below23.
1. Simplicity and ease of useSystems should be developed that take into account the capacity of those whowill be using them. Only important indicators should be monitored. In termsof M&E tools, flow charts and checklists may be more appropriate than text.
PREP SEL PLAN APP IMP OP
23 For further details, see Netshiswinzhe and Potter (2000).

136
DESIGNING TO MEET DEMAND
2. Use of dataThe information collected must be used to take corrective action, i.e. improv-ing current performance or future programming. This requires simple report-ing lines from the individual measuring the indicator to the individual whotakes corrective action.
3. Focus on key sustainability issuesThe focus should be on sustainability. However, it is important the this is nottoo narrow, for example, examining short-term concerns and leaving out longterm issues. A balance has to be achieved.
4. External linksWhilst the aim is to allow local management to identify their own problemsand solutions, external agencies can play an important role, depending on thelocal context:
! By providing a timely, appropriate response to address problems that can-not be solved at local level.
! By assisting with the measurement of certain indicators, for example, waterquality, borehole yields and auditing accounts. These require less frequentmeasurement.
! By monitoring the M&E system itself. M&E tasks can be nested, withweekly, monthly, six monthly and annual checks being carried out by dif-ferent organisations.
5. Involving womenThe indicators used should reflect the particular interest women have in waterand sanitation. Indicators of user satisfaction should not be limited to pay-ments, for example, if financial resources are largely controlled by men.
12.2 Demand related indicators for managers
The following tables list demand related sanitation and water indicators. Inpractice, it is recommended that locally appropriate indicators are identifiedby the users themselves, together with their local management organisation.
Whatever is used must be perceived as being sufficiently important to measureto justify the associated effort and expense.

137
PART I I : PRACTICE
24 For details of how to conduct a sanitary survey, see Howard (2002)
Table 12.1. Possible indicators for monitoring domestic sanitation
Indicator
Payments received
Waiting time
Number of latrinesbuilt
Use of facilities
Upgrading
Hand washing anduse of soap
Remarks
The number of payments received indicates demandfor each option offered.
Demand may diminish if there is a long delay be-tween payment and �delivery�. A delay can indicateproblems in administration, logistics or construction.
Though important in terms of potential impact andeasy to measure, the number of latrines built is ir-relevant if they are not used.
Use is more difficult to measure. A sanitary survey24
can be used to look for evidence of use. It is impor-tant to establish if all members of the householdare using the latrine, and if not, why not.
Upgrading is a good indicator that (i) people are valu-ing sanitation more and (ii) there is a system thatcan respond to changes in demand.
Related to the use of sanitation and its potentialhealth impact, hygiene behaviour can also be moni-tored, again using evidence from a sanitary survey.

138
DESIGNING TO MEET DEMAND
Table 12.2. Possible indicators for monitoring domestic water supply
Indicator
Upfront cashcontributions
Water availability
Quantity used
Regular payment forservices received
User satisfaction &complaints
Upgrading
Hand washing anduse of soap
Remarks
As already discussed, an up-front contribution is astrong indicator of demand, and should be meas-ured. This illustrates that M&E can be used duringimplementation, as long as systems are established.
Demand is unlikely to be met if water is not avail-able. This can be relatively simple to monitor on adaily or weekly basis, for example by measuring tapflows or hours of operation.
The amount of water used can also be a good indi-cator of demand. Low consumption may indicatethat other sources are preferred. Measuring con-sumption can be difficult if meters are not installed.
If users are not satisfied with the service they re-ceive, they are unlikely to want to pay for it. Pay-ment is simple to measure, and is a useful indica-tor of demand.
It is important to measure user satisfaction (anddissatisfaction) that is not linked to payment. Thismay apply to women who seldom control the finan-cial resources used to pay for water, but who havea �majority interest� in domestic water and sanita-tion.
Upgrading is a good indicator that i) people are valu-ing water supply more and ii) there is a system thatcan respond to changes in demand.
Related to the use of sanitation and its potentialhealth impact, hygiene behaviour can also be moni-tored, again using evidence from a sanitary survey.

139
PART I I : PRACTICE
Each of these indicators can be linked to the results of a wealth rankingexercise. It may be useful for local management to focus on the pooresthouseholds that are most vulnerable to exclusion, ensuring that they are ableto access and use improved services as designed.
12.3 Types of M&E tools
Mvula Trust has developed four categories of M&E tool which are useful fora demand responsive project. These are summarised here25. Each was pilotedin a number of rural water and sanitation projects.
1. FlowchartsFlowcharts provide a simple checklist of factors, arranging these into a logicalsequence of cause and effect, indicator and action. They also highlight certainresponses for follow-up. In practice, flowcharts have proved more popularand easy to use than questionnaires. An example is shown in Annex B.
2. LogbookMost of the information needed to complete a flowchart can be recorded in asimple logbook and financial records. The logbook is a daily or weekly recordof operational problems, the action taken, and the response time. In Mvula'sexperience, it is most effective when completed by whoever is 'on duty' at thetime. The logbook encourages local management to establish a simple faultreporting line. An example of a log sheet is shown in Annex B.
3. QuestionnairesQuestionnaires can be developed to deal with the same type of informationused by the flow charts. Although they are more flexible in that issues can bequalified in more detail, they are more complex to complete.
4. PostersPosters help communicate messages about the steps that users can take incertain situations. This can help with fault reporting or applying for a domesticlatrine. Posters are also important in improving transparency. In the UNICEFsupported water and sanitation programme in Ganjam, Orissa, the results ofcommunity monitoring were displayed for all to see. This took the form of alarge poster next to the village map. In this case, households who had latrinesbut were not using them were identified by a red mark.
25 See Netshiswinzhe and Potter, (2000)

140
DESIGNING TO MEET DEMAND
12.4 Concluding points
Although it is important to be able to measure and respond to the parametersbeing measured, it is also useful to investigate how the situation is changingover time. The most important indicators can be presented pictorially on achart.
The data collected by a local management organisation can be used to evaluatethe long-term impact of a project. In this context, longer-term trends can bejust as important as absolute values.
The M&E system is itself a sustainability indicator. If the monitoring systemis not being used, there may be a problem with the management organisationitself.
Finally, it has been emphasised that the tools used and the parameters meas-ured should be locally appropriate and if possible developed by users and thelocal management organisation. In practice, the use of common tools andindicators - shared between a number of schemes - would help the establish-ment of a simple, efficient project support system. A balance should be found.

141
PART I I : PRACTICE
13. Implications for engineers
13.1 Introduction
A demand responsive approach has implications for all project staff, influenc-ing not only their individual roles and responsibilities, but also how theyinteract professionally. The consequences are likely to be especially signifi-cant for project engineers.
In a ‘conventional’ supply-led environment, engineers derive much of theirauthority and job satisfaction from the infrastructure they provide. Engineersare expected and indeed trained to take important technical decisions onbehalf of the client or the project’s donors.
Not surprisingly, some engineers feel uncertain about introducing a demandresponsive approach that appears to contradict their training by giving peopledecision-making responsibilities26. As a result, engineers may feel marginalisedby this process and may resist change, something that can add to the complex-ity of introducing and scaling up a demand responsive approach. For govern-ment engineers, any uncertainty may be compounded by two other development‘trends’ - decentralisation and the switch from implementation to facilitation.
Reluctance to change is often associated with uncertainty about the future.Whilst this booklet is designed to clarify what designing to meet demandmeans in practice for all project staff, this final section looks specifically at thepossible roles and responsibilities of project engineers.
13.2 The engineer�s role
Considering the project process as a whole, engineers have a number ofpotential responsibilities that together define their role. These are listed below.
26 In fact, many contemporary engineering design textbooks emphasise the importance of consulting people about
the facilities they require and explain how this can be achieved using techniques similar to those described in
Section 10 of these guidelines.

142
DESIGNING TO MEET DEMAND
This list is indicative - actual responsibilities depend on the project’s contextand the capacity and resources available.
Developing a project strategy
! Assessing the enabling environment (consisting of policies, legislation andinstitutions) from a technical perspective. For details see Section 8.1.
! Establishing and developing links between project staff, communities andorganisations responsible for providing longer term technical support.
! As part of an initial assessment of demand, investigating people’s copingstrategies and implied preferences. Such work is likely to be undertakenwith a social facilitator.
! Investigating and developing a number of potential technical options. Thismay involve wider consultation including learning visits to other projects.
! Advising on the use of technical criteria to help select sub-projects.
Working with communities
(Each of the following tasks requires a mix of technical, social and communi-cation skills, implying a team-based approach is necessary).
! Provide users with an informed choice of technical options (and quite pos-sibly financial options) which are (i) likely to meet demand, (ii) effective interms of addressing project objectives and (iii) technically, environmen-tally and financially feasible. People need to be aware of the implicationsof their choice. One implication is that options must be accurately costed.In overall terms, the process benefits from consultation with a range ofpotential users as described in Section 10. Engineers have to be able tolisten to and understand the opinions of potential users.
! Negotiate services levels with the community, balancing demands (some ofwhich may compete with others) with a variety of constraints including thecapacity and resources available, the needs of the environment and the po-tential impact on others.

143
PART I I : PRACTICE
! Specifically ensure that vulnerable groups are included rather than excludedby providing appropriate options with the potential to meet their demands.
! Promote longer-term sustainability by developing local capacity and estab-lishing mechanisms that can manage changes in demand at both householdand community level.
Working with support organisations
! Develop the technical capacity (and maybe the financial and managerialcapacity) of support organisations to help them undertake their responsi-bilities. This may include establishing procedures for mentoring, auditingand the provision of technical support.
Working with the project team
! Learn from other project staff to improve the effectiveness of technicalinputs. Engineers have a responsibility to understand the cultural, socialand economic aspects of people's lives and how this impacts on technol-ogy. Equally, they must also be aware of the techniques used by other projectstaff, their purpose, application, strengths and weaknesses.
! Develop the technical capacity (and quite possibly the financial and mana-gerial capacity) of project staff to offer options and facilitate informed deci-sion making.
! Provide project staff with sound advice on the technical and financial char-acteristics of a wide range of options.
This list of potential responsibilities is not exhaustive. It demonstrates that theengineer’s role in a demand responsive environment is very different - but noless challenging than before. If anything, engineers have to apply their skillsand judgement in greater depth and more broadly to ensure that people havean informed choice of options and mechanisms are established to supportthose choices.
The remainder of this section will look at what could be considered the centralresponsibility in more detail: providing users with options. This is followed bya summary of the knowledge, skills and attitudes that engineers need in orderto design to meet demand.

144
DESIGNING TO MEET DEMAND
27As explained in Part I of this booklet, rather than assume an overall level of affordability, it is more effective to
assess willingness to pay for particular options.
13.3 Providing users with options
Providing users with an informed choice of options that reflect demand andthe various constraints imposed by the natural and the enabling environmentis arguably the most challenging process in a demand responsive project. Tosupport it, engineers require the following:
13.3.1 Familiarity with a wide range of potential options
Engineers need to be familiar with a wide range of service, service level andservice delivery options, their characteristics, limitations, costs and inherentflexibility. Three issues are particularly important:
! Potential options should be affordable27. For many people, ‘unconventional’low-cost solutions may be needed. This applies not only to the technologyand materials used, but also to any mechanism used to supply, operate,maintain and upgrade services. Engineers will be expected to establish thecapital, recurrent and replacement cost of any options.
! The options provided should take into account future changes in demand.This may mean providing upgradable levels of service. If water resourcesare limited, water conservation measures may also be important. Theseshould not discriminate against the poor, who often use very limited amountsof water in any case.
! People’s demands are likely to reflect their livelihoods rather than narrow‘sectoral’ definitions of water supply and sanitation (see Section 3.1). Engi-neers may be required to investigate some options with which they are notfamiliar, for example, a small-scale irrigation system using wastewater fromcommunal taps.
Based on the experience of the authors obtained whilst developing theseguidelines, relatively few engineers have the necessary knowledge and experi-ence to offer a full range of options. This has two major implications.

145
PART I I : PRACTICE
(i) The technical capacity of project engineers may need to be strengthenedduring the initial stages of a project. Opportunities must be identified and timeand resources provided. To this end, a list of useful references has beenincluded in Annex C. These could form the core of a basic technical library.
(ii) In some cases it may be necessary for project staff to contract in orotherwise out-source specialist assistance as and when required. Provision forthis needs to be built-in to the project’s design.
13.3.2 Opportunities and willingness to engage with users
If at all possible engineers should be involved in participatory exercises usedto identify people’s preferences. This helps ensure that questions of clarifica-tion or substance are addressed and are not overlooked. Later on in the project,engineers may need to engage with users to develop options, facilitate deci-sion making and even to negotiate demand taking into account the capacityand resources available.
Dialogue may involve a number of communication techniques tailored for aspecific target audience (see Section 10.3.2). Applying these techniques effec-tively may require a skilled intermediary.
Engineers should therefore be able and willing to work alongside socialfacilitators in the field, and work with rather than in communities, using arange of appropriate tools and techniques.
If working with communities is difficult, working with the poor is that muchharder. Physically this often requires an arduous walk of several hours and, insome cases, several days. It may mean operating in environments wherepersonal security or health can be major concerns.
More fundamentally, working with vulnerable groups demands a degree ofrespect for cultures, social status or lifestyles that few engineers have experi-enced. It often calls for considerable patience and an ability to listen. It may benecessary to meet on a weekend in the late afternoon. Apart from havingsufficient time and access to transport, a certain attitude of mind is needed toengage in this way, reinforced by adequate incentives.

146
DESIGNING TO MEET DEMAND
13.3.3 Ability to cost options
As already implied, costing options (see Section 10.4) is an integral part of theproject process and an important responsibility for engineers, especially in theabsence of a financial adviser. Accuracy is needed if the results are used,directly or indirectly, to set user charges.
The research conducted during the preparation of these guidelines suggeststhat relatively few engineers have the knowledge and skills to do this. Inparticular, replacement costs are frequently over looked, even for facilitieswith a relatively short life-span such as a communal hand pump. Dependingon the project’s financial policy, additional training may be required byengineers to ensure that replacement costs are reflected in the prices charged.
13.3.4 Ability and willingness to adapt standards
Depending on the local situation, standard designs and specifications willoften have to be adapted to suit user demands, taking into account the safety ofusers and environmental health risks.
Engineers are often reluctant to adapt standard designs because it contradictstheir professional training and may lead to problems with the relevant techni-cal authority. As well as this, engineers may not be entirely confident to designa customised or ‘made to measure’ solution. Adapting a standard designincreases the amount of work required - with cost implications.
As long as the result is relatively safe and cost effective, adapting a standarddesign or specification to improve its effectiveness and sustainability can bejustified. Ideally, engineers should be able to assess each situation from a risk-based perspective, taking into account the potentially negative effect of im-posing an inappropriate standard. For example, Argoss (2001) describes howthe relative risk of groundwater pollution caused by on-site sanitation can bemeasured.
A example illustrating the need to adapt a standard design is illustrated in Box13.1. This concerns the provision of a public latrine block in a market inTanzania.

147
PART I I : PRACTICE
13.3.5 Ability to provide mixed service levels
Few engineers used to a supply-led environment will be familiar with theprovision of mixed levels of service and the implications this has for manage-ment28. The introduction of mixed service levels can significantly increase thecomplexity of managing a project, especially if it involves a piped watersupply.
Box 13.1. Adapting standard designs to meet demand
The importance of adapting rather than applying a standard design is demon-strated in an example from a peri-urban town in Tanzania. This concerns theprovision of a public latrine in a newly developed market place. A standard four-cubicle toilet block had been built, consisting of four cubicles (two for men, twofor women) and a male urinal. Even before the latrine block was opened to thepublic, a number of potential problems were apparent:
! the majority of people in the market were women, but the level of serviceoffered was biased in favour of male users;
! women may not be comfortable using a toilet facility shared (and in thiscase, managed) by men;
! no provision had been made for hand washing;
! the VIP sanitation technology used may not be acceptable to Muslims whomade up a significant proportion of the local population.
As the toilet had not been opened at the time of the visit, it is fair to say thatthese points are based on assumption rather than evidence. In this case, itwould have been relatively easy to adapt the standard design, taking into ac-count user perceptions, enhancing its potential impact and sustainability.
Deverill and Wedgwood (2001)
28 For example, Bos (2000) established that fewer than 15% of South African water supply engineers she interviewed
during the course of her research had ever provided more than communal standpipes for rural users.

148
DESIGNING TO MEET DEMAND
In such circumstances, the introduction of mixed service levels should becarefully considered, taking into account the issues identified in Section 10 inthese guidelines.
Assuming resources are available, the most important point is to respectcollective preferences. Higher service levels should never be imposed simplybecause they are considered to be a visible ‘indicator’ of a demand responsiveapproach. In many cases, collective demand for an equitable basic level ofservice may have to be satisfied first before people are willing to investigatethe possibility of offering higher levels of service. In such circumstances,engineers may be expected to suggest solutions designed to help local manag-ers cope with unmet individual demands.
13.4 Summary: knowledge, skills and attitudes
The points raised above emphasise that engineers are likely to be moreeffective if they can demonstrate the following core qualities:
! A thorough knowledge of a broad range of technologies, associated man-agement and contribution systems, their potential advantages and disad-vantages.
! Technical skills, for example, those needed to match the attributes of whatis required with technological solutions and to cost options.
! Communication skills to engage and consult with potential users includingwomen and the poor.
! Attitudes that respect and promote the participation of all users in the projectprocess, including women and the poor.
! An ability to work as a member of a project team, respecting the contribu-tions made by other professions.
Table 13.1 identifies these qualities in more detail, and could be adapted by aproject manager to help recruit or assess engineering staff. One further pointshould be recognised: engineers may want to engage in a demand responsiveapproach, but may need support in order to do so effectively. In fact, the same

149
PART I I : PRACTICE
may apply to all the staff involved. This suggests that it may be useful tointroduce a demand responsive approach incrementally and pilot it beforescaling it up. Its potential benefits can then be balanced with the capacity toimplement and support it. This issue is one of several discussed in Book 2 ofthese guidelines Additional Notes for Policy Makers and Planners.

150
DESIGNING TO MEET DEMAND
Knowledge
Knowledge of policies,legislation andinstitutional arrangementswhich influence technicaldecisions.
Knowledge of individualand team roles andresponsibilities and of keyworking relationships.
Knowledge of a range ofwater supply andsanitation options, theirflexibility and limitations.
Knowledge of how to costoptions accurately.
Knowledge of technicalstandards, their basis andadaptability.
Knowledge of a range ofmanagement options andcontributionsystems.
Knowledge of widerapplications of water andenvironmental sanitation(e.g. small-scaleirrigation, sustainableurban drainage andgarbage disposal).
Knowledge of a numberof participatorytechniques, their use andlimitations, and how toapply them.
Skills
Ability to adapttechnologies to meetdemand, providing mixedlevels of service andupgradable systems.
Ability to cost optionsand recommend pricesbased on the results ofdemand assessment.
Ability to communicatetechnical (and possiblyfinancial) concepts topeople with little or notechnical background.
Ability to negotiatedemand taking intoaccount resource andenvironmentalconstraints.
Ability to engage with allusers, especially thepoor and women.
Ability to train localmanagers, implementersand support staff intechnical, managerialand financial skills.
Attitudes
Ability to work as part ofa multidisciplinaryproject team - withoutnecessarily leading it.
Willingness and patienceto devolve decisionmaking to communitiesand households.
Willingness to workunconventional hoursand to work in remote ordifficult situations.
Willingness to adaptstandards asappropriate, assessingrisk and retainingtechnical responsibility.
Sensitivity to thedemands, culture andcircumstances ofvulnerable groups,especially women andthe poor.
Willingness to improvepersonal knowledge andskills as part ofcontinuous professionaleducation.
Willingness to supportthe project team byimproving basic technicalknowledge and skills.
Table 13.1. Knowledge, skills and attitudes of engineers needed todesign to meet demand. This list is indicative: in practicewhat is required depends on the local context

151
PART I I : PRACTICE
References

152
DESIGNING TO MEET DEMAND

153
PART I I : PRACTICE
References
ARGOSS (2001) Guidelines for Assessing the Risk to Groundwater fromOn-Site Sanitation, 2001, British Geological Survey CommissionedReport CR/01/142. NERC Wallingford, Oxfordshire (UK) 2001.
Bajracharya, D. and Deverill, P. (2001) 'NEWAH: Developing a Povertyfocused, Demand Responsive Approach.' Paper presented at 27th WEDCconference. Lusaka, August 20th - 24th, 2001.
Breslin, N (2000a) 'Lessons from the field - update series: Maúa andNipepe'. Update Number 5, May 2000. Emailed report available [email protected]
Breslin, N (2000b) 'Lessons from the field - update series: Maúa andNipepe'. Update Number 8, September 2000. Emailed report availablefrom [email protected]
Bos, A. (2000) The role of engineers in the damand responsive approach -a study from South Africa. A WEDC MSc demand study in InternationalDevelopment. Water, Engineering and Development Centre, UK
Cairncross, S. (1992) Sanitation and Water Supply: Practical Lessons fromthe Decade: Water and Sanitation. Discussion Paper Series No 9. Waterand Sanitation Programme Washington DC, 1992
Concern Worldwide (2000) Mtwara CDS Programme: an Assessment of theImplementation of Demand Responsive Approach in the CommunityDevelopment Support Programme. Final Report. Quest Consult, Dar esSalaam, April 2000
Deverill, P. and Wedgwood, A. (2001) Designing Water Supply andSanitation Projects to Meet Demand - Reports from field visits to: SouthAfrica, Tanzania, Nepal and India. WEDC May 2001.
DFID (2000) Realising Human Rights for Poor People - Strategies forAchieving the International Development Targets. DFID, London,October 2000.

154
DESIGNING TO MEET DEMAND
EHP (1997) Better Sanitation Programming: a UNICEF handbook.UNICEF April 1997. http://www.ehproject.org
ERM (2002) Cost Recovery in Water and Sanitation Projects Draft FinalPosition Report. ERM Reference 6278, London, March 2002.
Gosling, L and Matthews, M. (1995) Toolkits: A Practical Guide toAssessment, Monitoring, Review and Evaluation. ISBN 1 870322 93 2.Save the Children Fund (UK), London, 1995
GTZ (1995) Gender Sensitive Participatory Approaches in Technical Co-operation: a Trainer's Manual for Local Experts Deutsche Gesellschaftfür Technishe Zusammenarbeit Eschborn, 1995
Hausermann, J. (1999) A Human Rights Approach to Development - SomePractical Implications for WaterAid’s Work, 1st WaterAid Lecture, 10thSeptember 1999. WaterAid, London, 1999
Howard, Guy (2002) Water quality surveillance - a practical guide. WEDC
IIED (1992) RRA Notes Number 15 Special Issue on Applications of WealthRanking. IIED Sustainable Agriculture Programme, London, May 1992
IRC (1997) Linking Technology Choice with Operation and Maintenancefor Low Cost Water Supply and Sanitation. Operation and MaintenanceWorking Group of Water Supply and Sanitation Collaborative Council.IRC, the Netherlands, 1997
Leblanc, M.E. (2001) The Integration of water supply and sanitation: asuccess? MSc Research Project, Water, Engineering and DevelopmentCentre, WEDC (2001)
MacGranahan G. Leitman, J. Surjadi, C. (1997) UnderstandingEnvironmental Problems in Disadvantaged Neighbourhoods: BroadSpectrum Surveys, Participatory Appraisal and Contingent Valuation.Urban Management Programme Working Paper 16. StockholmEnvironment Institute, 1997

155
PART I I : PRACTICE
Mukherjee, Neela (2001) Achieving Sustained Sanitation for the PoorPolicy and Strategy Less from Participatory Assessments in Cambodia,Indonesia, Vietnam. Water and Sanitation Program (East Asia and thePacific) april 2001.
Mukherjee, Neela (1992) 'Villager's Perceptions of Rural Poverty throughthe Mapping Methods of PRA'. Pp 21-26, RRA Notes Number 15Special Issue on Applications of Wealth Ranking. IIED SustainableAgriculture Programme. London, May 1992
Mvula Trust (1996) Specific Policies for Water and Sanitation ProjectDevelopment. Version 7. Mvula Trust, Braamfontein, South Africa,November 1996.
Ndezi, T. and Wedgwood, A. (2001) 'Assessing Demand in Peri-urbanAreas of Dar es Salaam'. Paper presented at 27th WEDC conference.Lusaka, August 20th - 24th, 2001.
Netshiswinzhe, B. and Potter, A. (2000) Developing Community-basedMonitoring and Evaluation Tools for Rural Water and SanitationProjects Final Report. Mvula Trust, Johannesburg, November 2000
Ockelford, J. and Reed, R. (2000) Guidelines for Planning and DesigningRural Water Supply and Sanitation Programmes. DFID KaR Output.WEDC, June 2000
Sansom, K. Coates, S. Njiru, C. and Franceys, R. (2000) StrategicMarketing to Improve Water Utility Finances and Services to PoorUrban Water Consumers. WEDC discussion paper. WEDC, June 2000
Tipping, J and Scott, R. (2001) 'Piloting Trickle-Feed Distribution in RuralSouth Africa' Paper presented at 27th WEDC conference. Lusaka,August 20th - 24th, 2001.
Toot, M. (2000) Presentation on Kenya/Netherlands Rural Water Supplyand Sanitation Development Project, to WEDC, September 2000.

156
DESIGNING TO MEET DEMAND
WaterAid (2001) Looking Back: the Long-term Impacts of Water andSanitation Projects. Condensed Report, WaterAid, London, June 2001
Wedgwood, A. and Sansom, K (2001) Willingness-to-pay surveys - Astreamlined approach - guidance notes for small town water services.Initial draft. Water Engineers and Development Centre October 2001.www.lboro.ac.uk/wedc/projects/omnwss
WEDC (forthcoming) Infrastructure for All. A practical guide forengineers, technicians and project managers on how they can meet theneeds of men and women in development projects (expected to bepublished in early 2002) Project website: www.lboro.ac.uk/wedc/projects/msgender/index
WELL (1998) DFID Guidance Manual on Water Supply and SanitationProgrammes. WELL, 1998
Whittington, D. Davis, J. and McClelland, E. (1998) 'Implementing aDemand-driven Approach to Community Water Supply Planning: a CaseStudy of Lugazi, Uganda' Water International, Vol. 23, pages 134-145
WHO (2000) Global Water Supply and Sanitation Assessment 2000. WHO,Geneva, Switzerland. Details at:
http://www.who.int/water_sanitation_health/Globassessment/Global1.htm
World Bank (1993) 'The demand for water in rural areas: determinants andpolicy implications' World Bank Water Demand Research TeamObserver, pages 47-70, Volume 8 no. 1, January 1993

157
PART I I : PRACTICE
Glossary

158
DESIGNING TO MEET DEMAND

159
PART I I : PRACTICE
Glossary
Affordability The capacity to pay for a service. Affordability isoften assumed by project staff, based on a fixedproportion of household income or the ownershipof assets rather than on user perceptions of theservice on offer.
Amortization A method of calculating the amount of moneyneeded to be set aside each year theannuity toreplace equipment at the end of its expectedoperational life.
Bidding game A method of establishing the maximum amount anindividual is willing to pay for a specified service.The technique is often used in contingentvaluation.
Coping strategy A behaviour or practice used to sustain or improvea livelihood. See also Revealed Preference.
Contingent valuation A demand assessment technique. Several options(each associated with a range of prices) aredescribed to a sample of potential users who thenindicate their preferences. The technique requiresspecialist skills and is most cost effective in high-density urban and peri-urban areas.
Demand Demand is defined in these guidelines as:an informed expression of desire for a particularservice, assessed by the investments people areprepared to make, over the lifetime of the service,to receive and sustain it.
Demand assessment Any technique used to gauge or measure demand.These can be classified as (i) indirect, based mostlyon field observations (e.g. a revealed preferencesurvey), or (ii) direct, relying on people expressingan opinion about a particular service (as used incontingent valuation).

160
DESIGNING TO MEET DEMAND
Demand stimulation Techniques used to unlock latent demand. Thismay involve promoting the characteristics ofoptions which are known to be desirable. Thisreinforces the importance of developing optionsthat take into account people’s preferences andpriorities.
Economy of scale If an option becomes more cost effective whenapplied on a larger scale, it is said to exhibit aneconomy of scale. However, larger projects are notnecessarily more cost effective than smaller ones,because they may require more complex (and moreexpensive) solutions.
Effective demand Demand for a good or service expressed by a user’swillingness to pay in terms of a monetary oreconomic contribution.
Enabling enviroment Relevant policies, legislation and institutionalarrangements that support the design andimplementation of projects and the sustainabilityof the services provided.
Felt need An immediate necessity, as perceived by theindividual or household concerned. A felt needbecomes a demand if it is supported by acommitment to invest resources, interest or time toreceive and sustain it.
Focus group A small group of individuals with a similar social,cultural or economic background, brought togetherwith a facilitator to explore a particular issue.
Harijan A low caste community, family or individual inHindu culture.
Latent demand Demand which is only revealed after it has beenstimulated. See demand stimulation.
Livelihood The capacity, assets (a combination of social,human, financial, natural and physical resources)and activities needed to sustain a particular lifestyle.

161
PART I I : PRACTICE
PHAST Participatory Hygiene and SanitationTransformation: a technique that encourages grouplearning and understanding of links betweenhygiene and sanitation, based on the use ofmainly graphical tools.
Positive deviance Behaviour or practice which have positive impactin terms of environmental health but whichdeviates from established norms.
PREPP Participation, Ranking, Experience, Perceptionsand Partnership: A recently developed demandassessment technique employing components ofcontingent valuation in a focus group discussion.
Revealed preference A socio-economic survey of people’s copingsurvey strategies used by economists to assess demand
for an existing or planned service.
Sanitation In its narrowest sense, sanitation is the safemanagement of human excreta. More broadly, theterm includes the management of wastewater,solid waste and storm water drainage.
Service The system that provides users with a particularfunction (e.g. improved water supply orsanitation). A service includes facilities and theirmanagement, contribution and supportmechanisms.
Service level Used to describe the relative quality of the servicebeing provided to users.This is often associatedwith physical infrastructure, for example, acommunal tap or well, a yard tap or family well,and an in-house private connection.
Social marketing The application of marketing techniques tostimulate demand. The underlying motivation is toreduce exposure to environmental health risksrather than a profit motive.

162
DESIGNING TO MEET DEMAND
Sustainable livelihoods A holistic approach to development, focusing onpeople’s assess to and control over assets andresources; their vulnerability and the supportingframework (made up of policies, legislation andinstitutions).
Triangulation Confirming the results of a sociologicalinvestigation by cross checking with the results ofother investigations.
Want A desire for a good or service that goes beyond afelt need in that it may satisfy a person’s longerterm needs or aspirations.
Water demand The quantity of water people use or are expected touse. As such water demand is an importanttechnical design parameter.
Willingness to pay The financial or economic contribution that peopleare willing to make to receive and sustain aparticular service. See effective demand andcontingent valuation.

163
PART I I : PRACTICE
Annexes
Annex A Table of Annuity factors
Annex B Community monitoring form
Annex C Suggested reference books

164
DESIGNING TO MEET DEMAND

165
PART I I : PRACTICE
Annex A
Valu
e o
f A
nn
uit
y F
acto
rs A
F(r
,n)
at
inte
rest
rate
r%
ru
nn
ing
fo
r n
years
No
of
years
Inte
rest
Rate
(r)
(n)
3%
5%
6%
8%
10%
12%
15%
20%
10.9709
0.9524
0.9434
0.9259
0.9091
0.8929
0.8696
0.8111
21.9135
1.8594
1.8334
1.7833
1.7355
1.6901
1.6257
1.4726
32.8286
2.7232
2.6730
2.5771
2.4869
2.4018
2.2832
2.0146
43.7171
3.5460
3.4651
3.3121
3.1699
3.0373
2.8550
2.4611
54.5797
4.3295
4.2124
3.9927
3.7908
3.6048
3.3522
2.8306
65.4172
5.0757
4.9173
4.6229
4.3553
4.1114
3.7845
3.1378
76.2303
5.7864
5.5824
5.2064
4.8684
4.5638
4.1604
3.3944
87.0197
6.4632
6.2098
5.7466
5.3349
4.9676
4.4873
3.6096
97.7861
7.1078
6.8017
6.2469
5.7590
5.3282
4.7716
3.7909
10
8.5302
7.7
217
7.3601
6.7101
6.1446
5.6502
5.0188
3.9443
11
9.2526
8.3064
7.8869
7.1390
6.4951
5.9377
5.2337
4.0746
12
9.9540
8.8633
8.3838
7.5361
6.8137
6.1944
5.4206
4.1857
13
10.6350
9.3936
8.8527
7.9038
7.1034
6.4235
5.5831
4.2807
14
11.2961
9.8986
9.2950
8.2442
7.3667
6.6282
5.7245
4.3624
15
11.9379
10.3797
9.7122
8.5595
7.6061
6.8109
5.8474
4.4328
20
14.8775
12.4
622
11.4699
9.8181
8.5136
7.4694
6.2593
4.6681
22
15.9369
13.1630
12.0416
10.2007
8.7715
7.6446
6.3587
4.7264
25
17.4131
14.0939
12.7834
10.6748
9.0770
7.8431
6.4641
4.7910
30
19.6004
15.3725
13.7648
11.2578
9.4269
8.0552
6.5660
4.8597
AF
(r,n
) =
[1
-(1
+r)
^(-
n)]
/ r
An
nu
ity =
Cu
rren
t V
alu
e / A
F(r
,n)

166
DESIGNING TO MEET DEMAND

167
PART I I : PRACTICE
Is t
he
amo
un
t o
f m
on
ey c
olle
cted
en
ou
gh
to c
over
th
e ru
nn
ing
co
sts
of
the
pro
ject
?K
eep
it u
p?
YE
SN
O
PR
OF
ITA
BIL
ITY
EX
ER
CIS
E
Mo
nth
ly In
com
e
Hou
seho
ld c
ontr
ibut
ions
Bul
k us
ers
Oth
er
TOTA
L
Gen
eral
Ove
rhea
ds
Sal
arie
s
Ren
t
Oth
er
TOTA
L
O &
M E
xpen
ses
Die
sel
Sp
ares
Oth
ers
TOTA
L
Tota
l Exp
ense
s
Gen
eral
Ove
rhea
ds
O &
M E
xpen
ses
TOTA
L
Pro
fita
bili
ty
Inco
me
Exp
ense
s
DIF
FER
EN
CE
(A)
How
man
y ho
useh
old
s ha
ve p
aid
(B)
How
man
y ho
useh
old
s w
ere
sup
pos
ed to
pay
?
The
per
cent
age
pay
men
t is
A/B
x 1
00
Per
cen
tag
e DO
TH
E P
RO
FIT
AB
ILIT
Y E
XE
RC
ISE
TH
EN
RE
PO
RT
BA
CK
TO
TH
E C
OM
MU
NIT
Y
has
this
bee
n d
one
the
pre
viou
s m
onth
?
Whe
n w
as it
don
e?W
hy n
ot?
Whe
n w
ill it
be
don
e?
YE
SN
O
If n
o, t
he
com
mit
tee
cou
ld t
ake
the
follo
win
g a
ctio
ns:
●C
ut o
ff w
ater
●Fi
ne d
efau
lters
●G
ive
war
ning
●R
epor
t to
com
mun
ity
●R
epor
t to
trad
ition
al le
ader
s
If n
o, h
ow
wer
e th
e co
sts
reco
vere
d:
●Th
roug
h sa
ving
s
Am
ount
●O
ther
(ex
pla
in)
Am
ount
Exa
mp
le o
f a
M&
E f
low
ch
art
for
cost
rec
over
yFo
r d
etai
ls s
ee N
etsh
isw
inzh
ean
d P
otte
r (2
000)
AN
NE
X B
Annex B

168
DESIGNING TO MEET DEMAND

169
PART I I : PRACTICE
Pro
ject
Nam
e:Fo
r th
e pe
riod
:C
ompl
eted
by:
Dis
tric
t:
Is t
he p
robl
em
fixed
(Ye
s/N
o)
Dat
eP
robl
em r
epor
ted
and
loca
ted
Acti
on t
aken
Rev
iew
of
acti
on t
aken
to
fix
prob
lem
If ye
s,
date
fixe
d
If no
, w
hat
actio
nw
ill o
r ha
s be
enta
ken
to fi
x th
epr
oble
m?
Com
men
ts
Exam
ple
of a
n M
&E
Logs
heet
For
deta
ils s
ee N
etsh
isw
inzh
e an
d Po
tter
(20
00)
Annex B

170
DESIGNING TO MEET DEMAND

171
PART I I : PRACTICE
Annex C:Suggested reference books
Below is a short list of books and publications that the authors consider tobe most useful for engineers and project technical staff, taking into accounttheir roles and responsibilities in designing to meet demand.
Water supply and sanitationThe Worth of Water: Technical briefs on health, water and sanitation byRod Shaw, edited by John Pickford. 132 pages. ISBN 1 85339 069 0.
! Published by Intermediate Technology Publications, 103-105 Southamp-ton Row, London, WC1B 4HH, UK. http://www.developmentbookshop.com
! A series of short, illustrated introductions to the main technologies andprocess in village and community level water and sanitation.
Running Water: More technical briefs for health, water and sanitation byRod Shaw, introduced by Ian Smout. 128 pages. ISBN 1 85339450 5
! Published by Intermediate Technology Publications, 103-105 Southamp-ton Row, London, WC1B 4HH, UK. http://www.developmentbookshop.com
! This second collection of 32 short, illustrated introductions to appropriatewater and sanitation technologies and processes complements The Worthof Water. It covers a further range of subjects from water source selectionand handpump maintenance to sanitary surveying, hygiene understandingand community management.
SanitationLow-cost Sanitation: A survey of practical experience by John Pickford.167 pages. ISBN 1 85339 233 2.
! Published in 1997 by Intermediate Technology Publications, 103-105Southampton Row, London, WC1B 4HH, UK.http://www.developmentbookshop.com

172
DESIGNING TO MEET DEMAND
! A guide to what has been learnt about providing sanitation for rural andurban low income communities, outlining what is appropriate, practicaland acceptable. Includes an examination of the health, social and eco-nomic aspects of sanitation in different parts of the world.
A guide to the development of on-site sanitation by Richard Franceys, JohnPickford and Bob Reed of the Water, Engineering and Development Centre.237 pages. ISBN 92 4 15443 0
! Published in 1992 by the World Health Organisation: Distribution andSales, World Health Organisation, 1211 Geneva,27, Switzerland
! In-depth technical information about the design, construction, operationand maintenance of the major types of on-site sanitation facility, fromsimple pit latrines to aqua privies and septic tanks.
Latrine Building : A handbook for implementation of the SanPlat systemby Björn Brandberg. 168 pages. ISBN 1 85339306 1
! Published in 1997 by Intermediate Technology Publications, 103-105Southampton Row, London, WC1B 4HH, UK. http://www.developmentbookshop.com
! Describes the Sanplat system for building improved latrines. The bookdescribes in detail how to make SanPlats and how to implement a latrinebuilding programme, including hygiene education.
Water supplySmall Community Water Supplies: Technology of Small Water SupplySystems in Developing Countries IRC Technical Paper 18. Compiled andedited by E.H.Hofkes. 442 pages. ISBN 0 471 90289 6.
! Current edition published in 1983 by the IRC. Order reference TP-18.International Water and Sanitation Centre, PO Box 2869, 2601 Delft, theNetherlands. http://www.irc.nl
! A core handbook designed as a broad introduction into the technology ofsmall water supply systems in developing countries. Targeted at engineersand technical staff involved in Water Supply programmes and projects.

173
PART I I : PRACTICE
Making your water supply work: Operation and Maintenance of smallwater supplies Occasional Paper no 29 by Jan Davis and François Brikké.108 pages.
! Published in 1995 by the IRC International Water and Sanitation Centre.Order reference OP29-E. Available as a free pdf file from the IRCwebsite. IRC International Water and Sanitation Centre, PO Box 2869,2601 Delft, the Netherlands. http://www.irc.nl
! Recent experience on trends and developments in the operation andmaintenance of water supply systems of small communities, based on areview of available literature and the field experience of the authors.Describes O&M systems for a number of low cost technologies.
Rainwater Catchment Systems for Domestic Water Supply: Design,construction and implementation by John Gould and Erik Nissen-Pietersen.335 pages. ISBN 1 85 339456 4.
! Published in 1999 by Intermediate Technology Publications, 103-105Southampton Row, London, WC1B 4HH, UK. http://www.developmentbookshop.com
! A state of the art review of practice in the collection of rainwater to use orsupplement household water requirements. All aspects of design arecovered, including non-technical as well as technical factors.
Handpumps: Issues and concepts in rural water supply programmes.163pages ISBN 90-6687-010-9. Written and produced by IRC.
! Current edition published in 1996 by the IRC International Water andSanitation Centre. IRC International Water and Sanitation Centre, POBox 2869, 2601 Delft, the Netherlands. http://www.irc.nl
! An up-to-date guide covering the application of handpump technology tosmall community water supplies, from project preparation to operationand maintenance.

174
DESIGNING TO MEET DEMAND
A handbook of Gravity-FlowWater Systems by Thomas D. Jordan Jnr.ISBN 0946688 50 8
! Reprinted in 2000 by Intermediate Technology Publications, 103-105Southampton Row, London, WC1B 4HH, UK http://www.developmentbookshop.com
! A practical handbook covering all aspects of gravity water supply, fromsource selection to pipe line operation.
.