boosting building renovation: what potential and value for europe?
TRANSCRIPT


DIRECTORATE GENERAL FOR INTERNAL POLICIES
POLICY DEPARTMENT A: ECONOMIC AND SCIENTIFIC POLICY
Boosting Building Renovation:What potential and value for Europe?
STUDY
Abstract
Renovation of buildings is key to meet the EU’s energy efficiency targets. Thispaper reviews the literature on the state of the building stock and assessesvarious policy options and their potential for boosting the energy efficientrenovation of buildings in Europe. This document has been commissioned byPolicy Department A at the request of the Committee on Industry, Research andEnergy (ITRE) of the European Paliament.
IP/A/ITRE/2013-046 October 2016
PE 587.326 EN

2 PE 587.326
This document was requested by the European Parliament's Committee on Industry, Researchand Energy.
AUTHOR(S)Irati ARTOLA, TrinomicsKoen RADEMAEKERS, TrinomicsRob WILLIAMS, TrinomicsJessica YEARWOOD, Trinomics
RESPONSIBLE ADMINISTRATORDagmara STOERRINGBalazs MELLAR
EDITORIAL ASSISTANTIrene VERNACOTOLA
LINGUISTIC VERSIONSOriginal: EN
ABOUT THE EDITORPolicy departments provide in-house and external expertise to support EP committees andother parliamentary bodies in shaping legislation and exercising democratic scrutiny over EUinternal policies.
To contact Policy Department A or to subscribe to its newsletter please write to:Policy Department A: Economic and Scientific PolicyEuropean ParliamentB-1047 BrusselsE-mail: [email protected]
Manuscript completed in October 2016© European Union, 2016
This document is available on the Internet at:http://www.europarl.europa.eu/studies
DISCLAIMERThe opinions expressed in this document are the sole responsibility of the author and do notnecessarily represent the official position of the European Parliament.
Reproduction and translation for non-commercial purposes are authorised, provided thesource is acknowledged and the publisher is given prior notice and sent a copy.

Boosting Building Renovation: What potential and value for Europe?
PE 587.326 3
CONTENTS
LIST OF ABBREVIATIONS 6
LIST OF FIGURES 9
LIST OF TABLES 10
EXECUTIVE SUMMARY 11
Costs and benefits of renovation 11
Barriers to renovation in the EU 12
Policy options to boost renovation 12
Recommendations for EU policymakers 13
Recommendations for MS policymakers 13
INTRODUCTION 14
1. THE EU BUILDING STOCK 15
1.1. Residential buildings 15
1.1.1. Energy consumption 15
1.1.2. Age of the building stock 16
1.2. Non-residential buildings 17
1.2.1. Energy consumption 17
1.2.2. Building use 17
1.2.3. Ownership structure 18
1.2.4. Age of the building stock 18
2. THE STATUS OF RENOVATION IN THE EU 19
2.1. Rates and depth of renovation across the EU 19
2.1.1. Scale of renovation 19
2.1.2. Depth of renovation 19
2.1.3. The renovation market 20
2.2. Renovation potential in the EU 21
2.3. Costs of building renovations 22
2.4. Benefits of renovation 23
2.5. Barriers to renovation in the EU 24
3. POLICIES TO BOOST RENOVATION 25
3.1. Overview of current policies to boost building renovation 25
3.1.1. EU targets and strategies 25
3.1.2. EU policies 25
3.1.3. EU financial tools 28
3.1.4. National policies 28

Policy Department A: Economic and Scientific Policy
4 PE 587.326
4. ASSESSMENT OF POLICY OPTIONS 30
4.1. Definition of policy options 30
4.1.1. Regulatory measures 30
4.1.2. Financial and fiscal measures 32
4.1.3. Information campaigns & labelling 35
4.1.4. Others 37
4.2. Assessment of the economic, social and environmental impacts of the differenttypes of policies 39
4.3. Interactions between policies 41
5. RECOMMENDATIONS 43
5.1. Recommendations for EU policymakers 43
5.1.1. Legislating to boost the scale and scope of building renovation 43
5.1.2. Financing renovation 44
5.2. Recommendations for MS policymakers 44
5.2.1. Assessment of the existing building stock - baseline 45
5.2.2. Renovation legislation 45
5.2.3. Financing renovation 45
5.2.4. Facilitating the (decision-making) process of renovation 45
5.3. Recommendations on the best policy mix to remove barriers 46
6. REFERENCES 47
ANNEXES 50
Annex A. Costs and burdens for property owners and landlords, authorities andtenants 50
Annex B. Benefits of renovation 51
B.1 Environmental benefits 51
B.2 Economic benefits 51
B.3 Social benefits 53
Annex C. Barriers to renovation 54
C.1 Financial barriers 54
C.2 Technical barriers 54
C.3 Process barriers 55
C.4 Regulatory barriers 55
C.5 Awareness barriers 55
Annex D. Renovation levels and energy savings targeted or expected by MSs 56
Annex E. A selection of policy measures in EU Member States 58
E.1 Denmark – EEOS successful in increasing energy efficiency and generatingenergy savings 58
E.2 Slovakia – MunSEFF II: The Municipal Sustainable Energy Financing Facility59

Boosting Building Renovation: What potential and value for Europe?
5 PE 587.326
E.3 Spain – Complying with the EED through Alternative Measures instead of EEOS60
E.4 Belgium (Brussels Region) – Grants for energy efficiency in buildings 61
E.5 Italy and France - Tax credit 61
E.6 Germany - The KfW’s programmes 62
E.7 Finland - The Energy Audit Programme 62
E.8 The Netherlands – The Dutch Covenant on Energy Saving in the Rental Sector63
E.9 The United Kingdom (England and Wales) – Private rented sectorregulations 64
E.10 France – Habiter Mieux (Living Better) Programme 64

Policy Department A: Economic and Scientific Policy
6 PE 587.326
LIST OF ABBREVIATIONS
Anah Agence nationale de l'habitat, national agency of housing
BCR Brussels Capital Region
BG Bulgaria
bn billion
BPIE Buildings Performance Institute Europe
BREAM Building Research Establishment Environmental Assessment
Method
CA EPBD Concerted Action European Performance of Buildings Directive
C&D Construction & Demolition
CO2 Carbon dioxide
DK Denmark
DHW Domestic Hot Water
EASME Executive Agency for Small and Medium-sized Enterprises
EBRD European Bank for Reconstruction and Development
EC European Commission
ECO Energy Company Obligation
EE Energy Efficiency
EED Energy Efficiency Directive
EE Estonia
EEOS Energy Efficiency Obligation Scheme
EFSI European Fund for Strategic Investments
e.g. exampli gratia, for example
EIB European Investment Bank

Boosting Building Renovation: What potential and value for Europe?
7 PE 587.326
EL Greece
EnEV Energieeinsparverordnung, Energy Saving Ordinance
EPBD Energy Performance of Buildings Directive
EPC Energy Performance Certificate
ERDF European Regional Development Fund
ES Spain
ESCO Energy Service Company
EU European Union
EUR Euro
FI Financial Instruments
FNEE Fondo Nacional de Eficiencia Energetica, National Energy
Efficiency Fund
GDP Gross Domestic Product
GHG Greenhouse gas
GJ Gigajoules
GW Gigawatt
GWh GigaWatt-hour
H2020 Horizon 2020
HQE Haute Qualité Environnementale, High Quality Environmental
standard
HU Hungary
IEE Intelligent Energy Europe
JRC Joint Research Centre
KfW Kreditanstalt für Wiederaufbau, Reconstruction Credit Institute
Kton Kiloton

Policy Department A: Economic and Scientific Policy
8 PE 587.326
kWh kiloWatt-hour
LEED Leadership in Energy and Environmental Design
LT Lithuania
LV Latvia
MunSEFF Municipal Sustainable Energy Financing Facility
NEEAP National Energy Efficiency Action Plan
nZEB Near Zero-Energy Building
m2 Square meters
MEPS Minimum Energy Performance Standards
MS Member State
PAYS Pay-As-You-Save
PJ Petajoules
PV Photovoltaic
RED Renewable Energy Directive
RES Renewable energy sources
RERM Roadmap to a Resource Efficient Europe
RDI Research Development and Innovation
SME Small and Medium Enterprise
UK United Kingdom
VAT Value Added Tax

Boosting Building Renovation: What potential and value for Europe?
9 PE 587.326
LIST OF FIGURES
Figure 1: Building stock floor area (m2) per building type per Member State 15
Figure 2: Residential stock according to age band 16
Figure 3: Distribution of floor area (m²) per category of non-residential buildings in the EU17
Figure 4: Age profile non-residential buildings EU27 18
Figure 5: Major renovation rates of residential buildings across MSs 19
Figure 6: Average investment cost for different depths of renovation of residentialbuildings per m² in 2005 22
Figure 7: Average investment cost for different depths of renovation of non-residentialbuildings per m2 in 2005 23
Figure 8: Costs of renovation for different actors 23
Figure 9: Benefits of renovation 23
Figure 10: Key barriers to energy renovation of buildings 24
Figure 11: The interactions of policy instruments for energy efficiency in building renovationand operation 41
Figure 12: Components of the recommended policy package for energy efficiency inbuildings 42
Figure 13: Total annual total energy saving per sector compared to targets DK 59
Figure 14: Bâtiments Exemplaires programme poster 61
Figure 15: Be.Exemplary programme logo 61

Policy Department A: Economic and Scientific Policy
10 PE 587.326
LIST OF TABLES
Table 1: EU building renovation policies classification according to barriers addressed 27
Table 2: Main economic instruments in 2013 targeting energy renovations 29
Table 3: Categorisation of policy measures to boost building renovation 30
Table 4: Pros and cons of building codes and MEPS 31
Table 5: Pros and cons of refurbishment obligations 31
Table 6: Pros and cons of EEOS 32
Table 7: Pros and cons of subsidies and other financial instruments 33
Table 8: Pros and cons of RDI Grants 33
Table 9: Pros and cons of tax incentives 34
Table 10: Pros and cons of ESCOs 34
Table 11: Pros and cons of energy audit programmes 34
Table 12: Pros and cons of information campaigns 35
Table 13: Pros and cons of EPCs 36
Table 14: Pros and cons of voluntary energy labelling 36
Table 15: Pros and cons of ecodesign and energy labelling 37
Table 16: Pros and cons of voluntary agreements 37
Table 17: Pros and cons of skills development and capacity building programmes 38
Table 18: Assessment of policy options 39
Table 19: Total cost and energy savings in each obligated sector in 2013 59

Boosting Building Renovation: What potential and value for Europe?
11 PE 587.326
EXECUTIVE SUMMARYBuildings account for 40% of the EU's energy consumption, 36% of its CO2 emissions and55% of its electricity consumption. This makes emissions and energy savings in this sectorvital to meeting the EU's climate and energy targets. The stock of buildings in the EU isrelatively old, with more than 40% of it built before 1960 and 90% before 1990. Olderbuildings typically use more energy than new buildings. The rate at which new buildingseither replace this old stock, or expand the total stock, is low (about 1% a year). This impliesthat if the energy consumption of buildings is to be reduced the renovation of existingbuildings is key. The current renovation rate of existing buildings is low, with only about 1-2% of the building stock renovated each year, although it is estimated that renovationaccounts for 57% of all construction activity. The vast majority of these renovations do notutilise the full potential energy savings that could be achieved.
This paper assesses various policy options and their potential for boosting the energyefficient renovation1 of buildings in Europe. The paper begins by describing the existingbuilding stock and its renovation potential. It also addresses the multiple benefits ofrenovation and the barriers that are slowing its take up.
The analysis has focussed at the EU level, with examples drawn from specific Member States(MSs) when relevant. Policy schemes in the United Kingdom, Denmark, Slovakia, Spain andBelgium were looked at in greater detail and are presented in Annex E.
Costs and benefits of renovationThe overall costs associated with building renovation are split between the property owners,public authorities and tenants (when the buildings are rented or leased) as explained below.
Building renovations have several benefits in addition to energy savings. The diagram belowshows the most relevant ones.
1 The focus of this paper is on energy renovations of buildings, understood as renovations that are carried out toimprove the energy performance of buildings and therefore reduce energy consumption and consequent CO2emissions.
Costs and burdens forproperty owners and
landlords
•Assessment costs•Installation costs•Financing costs•Hidden costs•Costs of understandingregulations
Costs and burdens forauthorities
•Set up costs•Implementingadministrating, monitoringcosts
•Other costs e.g. advisingon regulations
Costs and burdens fortenants
•Potential rent increases•Hidden costs

Policy Department A: Economic and Scientific Policy
12 PE 587.326
Barriers to renovation in the EU
The key barriers to energy renovation of buildings are illustrated in the following diagram:
Policy options to boost renovationThere are a wide range of voluntary and regulatory initiatives or schemes that are designedto stimulate the energy efficient renovation of buildings in the EU. These are summarised inthe table below.
Type Examples of policy option
Regulatory
• Mandatory building codes• Minimum Energy Performance Standards (MEPS)• Refurbishment obligations• Energy Efficiency Obligation Schemes (EEOS)
Financial and fiscal
• Subsidies and financial instruments• Grants for research, innovation and demonstration
programmes (e.g. for nZEBs & smart meter roll-out)• Tax incentives• Energy Service Companies (ESCOs)
Environmental benefits
•Energy savings & GHGemissions reduction
•Reduced usage of materials
Economic benefits
•Employment•GDP and public budgets•Innovation•Sectoral modernisation•Energy Security•Productivity benefits
Social benefits
•Health benefits•Reduction energy poverty•Wellbeing / Comfortbenefits
•Energy bill savings•Increase in property value& tenant satisfaction
Financial barriers
•Renovation costs•Access to finance•Low energy prices
Technical barriers
•Lack of technicalsolutions
•Cost of technicalsolutions
•Lack of knowledge ofconstruction professionals
Process barriers
•Fragmentation of thesupply chain
•Burdening of homeowners
Regulatory barriers
•Varying ambition ofperformance requirements
•Multiple definitions forrenovation
Awareness barriers
•Lack of awareness

Boosting Building Renovation: What potential and value for Europe?
13 PE 587.326
Informationcampaigns &
Labelling
• Awareness raising and information campaigns• EU Energy Performance Certificates (EPCs)• (Voluntary) energy labelling schemes• EU ecodesign and energy labelling
Others• Voluntary and negotiated agreements• Energy audits• Skills development and capacity building programmes
This paper includes an assessment of each of the policy options showing that different policymeasures serve to tackle different barriers. The conclusion is therefore that a full range ofpolicy measures are needed to boost renovation. The optimum policy package shouldtherefore address each of the barriers - prioritising those with most potential, take synergiesinto account, cover the full range of building types - prioritising those with greatest energysavings potential, reflect the mix of building stock across Europe, and prioritise the lowestcost / highest impact policies. The policy package should consist of a combination ofmandatory and voluntary schemes, recognising that voluntary schemes may need tobecome mandatory when results are not achieved over a set timeframe.
Recommendations for EU policymakersA combination of tougher obligations, stronger incentives and more creative use ofinstruments alongside effective transposition, implementation and enforcement of existinglegislation are prerequisites to boost renovation:
Renovation regulations should be concrete, coherent, ambitious and broader inscope. Regulations also need to be enforced and reporting made easier for EU MSs.
Theres is a need to improve coherence between policy instruments, broaden thescope of the provisions of the EU policy instruments and link finance to energyefficiency.
Recommendations for MS policymakersLocal/regional/national authorities in MSs have an important role to play in the markettransformation of the EU building stock. These authorities should:
Carry out a comprehensive census of their existing building stock. Raise the ambition of their regulations and revise their cost-optimal calculation
methods. Ensure that policy instruments aimed at boosting renovation include incentives to
maximise the ambition of the renovation activities; Information dissemination andawareness raising activities on financing options for renovation should also bepromoted.
Encourage the set-up of one-stop-shops and contribute to clear roadmaps forrenovation in order to facilitate the renovation (decision) process.

Policy Department A: Economic and Scientific Policy
14 PE 587.326
INTRODUCTIONThe Energy Efficiency Directive (EED) (2012/27/EU) identified the existing building stockas “the single biggest potential sector for energy savings… crucial to achieving the Unionobjective of reducing greenhouse gas emissions by 80-95% by 2050 compared to 1990.”
Buildings account for 40% of the EU's energy consumption, 36% of its CO2 emissions2 and55% of its electricity consumption,3 making emissions and energy savings in this sector vitalto meeting the EU's climate and energy targets. With the slow addition of new buildings tothe existing building stock, renovation to improve the energy efficiency of the existing stockof buildings is imperative to meet the EU’s targets of a 20% improvement in energyefficiency by 2020 and a 27% improvement by 2030. Renovation is also an important wayto tackle fuel poverty. To date, however, renovation rates in the EU are low4 and renovatingthe existing building stock to make it more energy efficient remains a challenge, even moreso when considering the ambitious levels set by the EPBD which includes aims for nearlyzero-energy buildings (nZEBs).5 Increasing the rate at which existing buildings arerenovated to at least 2-3% (the higher figure for the public sector) per year until 2030 is akey objective of the EU’s Resource Efficiency agenda.
Against this backdrop, this paper sets out to describe the existing building stock and the setof policies that influence it, as well as to assess various policy options and their potential forboosting the renovation of buildings in Europe. The specific objectives of the paper are to: Review existing, planned and potential policies to boost building renovation; Quantify (when possible) and provide a qualitative assessment of their costs and
benefits; Assess their economic, social and environmental impacts; Review the impact of different rates and depths of building renovation in the EU; Identify bottlenecks and barriers to achieving the full benefits of renovation; Recommend policy options to remove these barriers and boost renovation.
It aims to provide policy authorities and MSs with focussed, coherent and specificinterventions to stimulate building renovation and also to inform the ongoing revisions ofthe Energy Efficiency Directive (EED) and the Energy Performance of Buildings Directive(EPBD).
2 https://ec.europa.eu/energy/en/topics/energy-efficiency/buildings.3 http://cordis.europa.eu/result/rcn/186598_en.html.4 COM (2014) 330 final - EU Energy security strategy.5 CA EPBD, 2016. Implementing the Energy Performance of Buildings Directive (EPBD).

Boosting Building Renovation: What potential and value for Europe?
15 PE 587.326
1. THE EU BUILDING STOCKBuildings in the EU have a floor area of 25 billion m2,6 with about ¾ of this being residentialbuildings.7 As the figure below shows the floor area per country roughly follows country size.
Figure 1: Building stock floor area (m2) per building type per Member State
Source: http://www.buildingsdata.eu/data-search
Much of the European building stock is in need of renovation. More than 40% of it was builtbefore 1960 and 90% before 19908, and most of these buildings, will still be standing in20509. Each year, new construction in Europe represents about 1% of building stock10. Thetotal building stock is growing over time, with the rate at which new buildings are erectedexceeding the rate at which old buildings are demolished. The key point is that bothdemolition and construction rates are low. For example, for residential buildings between1980 and 2005, in eight EU countries, the average annual demolition rate was about 0.1%,with the annual new construction rate between 1% and 1.5%11.
1.1. Residential buildings
1.1.1. Energy consumptionFor households, the annual energy consumption for all purposes in the EU28 is 17,793 kWhper active dwelling, and the median cost per unit of energy for households across the EU28is estimated to be in the order of 0.24 €/kWh.12 A BPIE study13 included analysis of the
6 http://www.odyssee-mure.eu/publications/efficiency-by-sector/buildings/buildings-eu.pdf.7 http://www.odyssee-mure.eu/publications/efficiency-by-sector/buildings/buildings-eu.pdf.8 Itard, L., 2008. Building Renovation and Modernization in Europe: State of the Art Review; BPIE, 2011. Europe's
Building under the Microscope: A Country-by-Country Review of the Energy Performance of Buildings.9 The Economist, 2013. Investing in energy efficiency in Europe’s buildings. A view from the construction and
real estate sectors.10 The Economist, 2013. Investing in energy efficiency in Europe’s buildings. A view from the construction and
real estate sectors.11 Itard, L. and Meijer, F., 2008. Towards a sustainable Northern European housing stock: figures, facts and
future.12 http://cordis.europa.eu/result/rcn/186598_en.html.13 BPIE, 2011. Europe's Building under the Microscope: A Country-by-Country Review of the Energy Performance
of Buildings
Policy Department A: Economic and Scientific Policy
16 PE 587.326
energy performance of buildings by age. This confirmed the intuitive assumption that in allthe EU countries surveyed, older buildings (residential and non residential) use more energyper building than modern buildings. This is due to the lack of building energy performancestandards when older buildings were erected which leads to lower standards of insulationand air tightness.
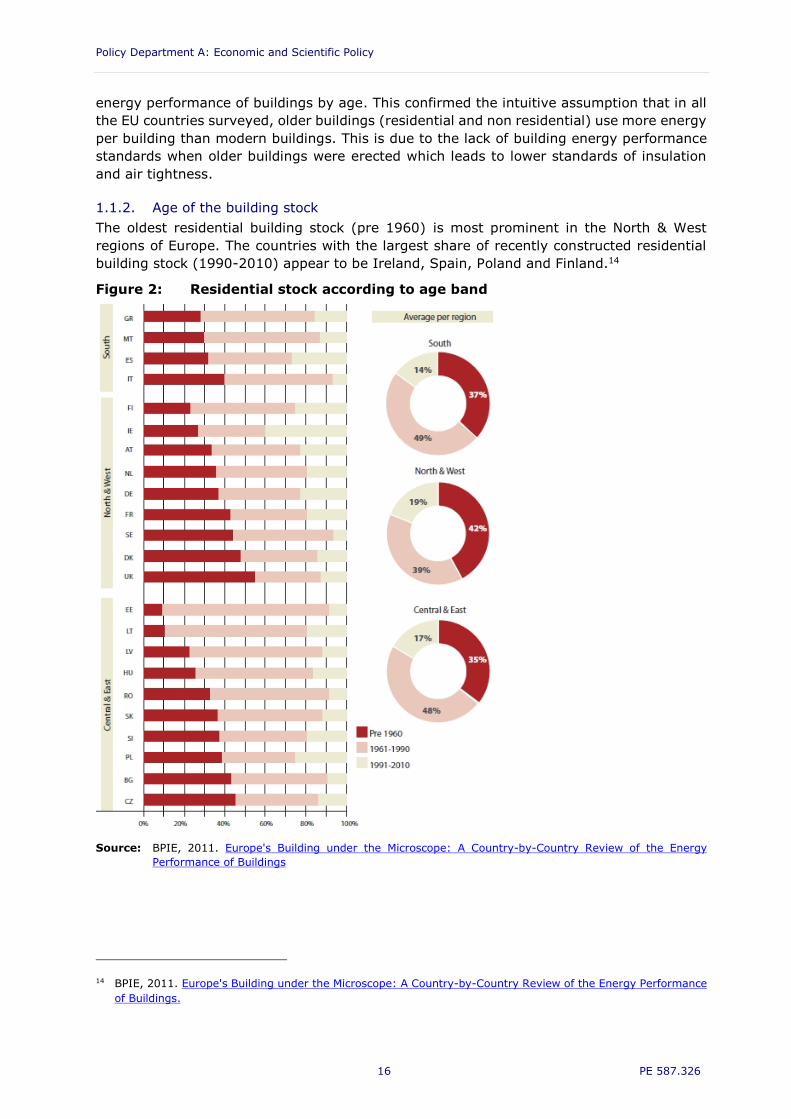
1.1.2. Age of the building stockThe oldest residential building stock (pre 1960) is most prominent in the North & Westregions of Europe. The countries with the largest share of recently constructed residentialbuilding stock (1990-2010) appear to be Ireland, Spain, Poland and Finland.14
Figure 2: Residential stock according to age band
Source: BPIE, 2011. Europe's Building under the Microscope: A Country-by-Country Review of the EnergyPerformance of Buildings
14 BPIE, 2011. Europe's Building under the Microscope: A Country-by-Country Review of the Energy Performanceof Buildings.

Boosting Building Renovation: What potential and value for Europe?
17 PE 587.326
1.2. Non-residential buildingsNon-residential buildings account for 25% of the total floor area of the European buildingstock.15
1.2.1. Energy consumptionResearch shows that the share of energy use in non residential buildings is roughly in linewith their share of floor area. The highest total energy use is within shops (28%), offices(26%), educational (12%) and hotels and restaurants (12%).16 These are followed byhospitals (10%) and sport facilities (6%) with 6% by other building types.
The average specific energy consumption in the non-residential sector is 280kWh / m²(covering all end-uses) which is at least 40% greater than the equivalent value for theresidential sector. In the non-residential sector, electricity use over the last 20 years hasincreased by a remarkable 74% in line with the increased use of IT equipment and airconditioning.17
1.2.2. Building use
Figure 3: Distribution of floor area (m²) per category of non-residentialbuildings in the EU
Source: Helgesen, PJ and IEA SHC Task 47, 2014. Upgrading of the non-residential building stock towardsnZEB standard: Recommendations to authorities and construction industry; BPIE, 2011. Europe'sBuilding under the Microscope: A Country-by-Country Review of the Energy Performance of Buildings.
15 BPIE, 2011. Europe's Building under the Microscope: A Country-by-Country Review of the Energy Performanceof Buildings.
16 Helgesen, PJ and IEA SHC Task 47, 2014. Upgrading of the non-residential building stock towards nZEBstandard: Recommendations to authorities and construction industry; BPIE, 2011. Europe's Building under theMicroscope: A Country-by-Country Review of the Energy Performance of Buildings.
17 BPIE, 2011. Europe's Building under the Microscope: A Country-by-Country Review of the Energy Performanceof Buildings.

Policy Department A: Economic and Scientific Policy
18 PE 587.326
1.2.3. Ownership structureNon-residential buildings are owned by either the private or public sector, though some areshared. Research18 suggests that there is a wide variation between MSs in the mix, varyingbetween private dominance (>70% private – EL, DK, LV, LT) to public dominance (>70%public – HU, BG, EE). The ownership is relevant because some energy efficiency policiesonly apply to public buildings.
1.2.4. Age of the building stockThe European non-residential building stock is generally newer than the residential stockalthough the majority was constructed before 1980. Educational buildings account for thelargest share of the oldest buildings. A relatively large share of public buildings and officebuildings were built in the 1990s.
Figure 4: Age profile non-residential buildings EU27
Source: Ecofys, 2011. Panorama of the European non-residential construction sector
18 BPIE, 2011. Europe's Building under the Microscope: A Country-by-Country Review of the Energy Performanceof Buildings.

Boosting Building Renovation: What potential and value for Europe?
19 PE 587.326
2. THE STATUS OF RENOVATION IN THE EU
2.1. Rates and depth of renovation across the EU
2.1.1. Scale of renovationOur review of the literature indicates that there is a lack of consistent and accurate data onbuilding renovation rates across Europe. Official statistics agencies do not report on this andthe estimates come from a combination of housing condition surveys, construction marketvalue surveys and one-off surveys. The most recent review of the data we could identify isfrom 2012.19 This collates and compares various estimates (with a focus on the housingstock). They conclude that the 3% per year figure included in a 2012 EC consultation onfinance for energy efficiency in buildings20 is over optimistic. The range that emerges fromthe literature they review21 is 0.5% to 2.5% a year, with the rate varying as a result of timelimited renovation programmes and other factors, with a typical figure being 1% (about 250million m2) per year.22 Figure 5 shows the variation between MSs in the major renovationrates of residential buildings.
Figure 5: Major renovation rates of residential buildings across MSs
Source: ZEBRA2020 Data tool
2.1.2. Depth of renovationThe definition of energy efficient renovation varies across EU legislation, and in practice, witha variety of ‘depths’ of renovation defined and carried out.
Recital 16 of the Energy Efficiency Directive (Directive 2012/27/EU) defines ‘deeprenovations’ in a very broad way, as “renovations which lead to a refurbishment that reducesboth the delivered and the final energy consumption of a building by a significant percentage
19 Meijer, F., Visscher, H. E. N. K., Nieboer, N., & Kroese, R., 2012. Jobs creation through energy renovation of thehousing stock. Neujobs Working Paper D 14.2, December.
20 EC, 2012. Consultation paper financial support for energy efficiency in buildings, Brussels, February (results butno consultation paper).
21 Itard, L. and F. Meijer, 2008. Towards a sustainable Northern European housing stock: figures, facts and future;UEA Low Carbon Innovation Centre and Build with CaRe, 2012. Refurbishing Europe. An EU Strategy for EnergyEfficiency and Climate Action Led by Building Refurbishment. Executive Summary; BPIE, 2011. Europe's Buildingunder the Microscope: A Country-by-Country Review of the Energy Performance of Buildings.
22 RESIDE project, 2015. Deliverable 1.1. A baseline scenario for energy efficiency renovations in Europe’sresidential buildings.

Policy Department A: Economic and Scientific Policy
20 PE 587.326
compared with the pre-renovation levels leading to a very high energy performance”. Of thecurrent renovations one estimate is that only 1% meet this definition.23
Article 2 of the EED, defines ‘substantial refurbishment’ as “a refurbishment whose costexceeds 50% of the investment cost for a new comparable unit”. Article 5 describes‘comprehensive renovations’ are renovations which cover “the building as a whole, includingthe building envelope, equipment, operation and maintenance”.
Article 2 of the EPBD recast defines major renovation, as either a renovation in which “thetotal cost of the renovation relating to the building envelope or technical systems is higherthan 25% of the value of the building, excluding the value of the land upon which the buildingis situated”, or a renovation in which “more than 25% of the surface of the building envelopeundergoes renovation”.
Less extensive renovation can be described as ‘piecemeal’ or ‘single-measures’ (e.g. just PVpanels or double-glazing). This reduces energy consumption by less than ‘deep’ renovation.24
These different levels of renovation reflect current maket reality. The BPIE (2011) producedthe following definitions of renovation levels alongside an estimate of the market share (as apercentage of all renovations) of each.
Minor renovations – 85% of the market: the implementation of 1 or 2 measures(e.g. a new boiler) resulting in a reduction in energy consumption of between 0%and 30% (with average costs of €60/m2).
Moderate renovations – 10%: involving 3-5 improvements (e.g. insulation ofrelevant parts of the dwelling plus a new boiler) resulting in energy reductions in therange of 30%-60% (with average costs of €140/m2).
Extensive renovations – 5%: in this approach the renovation is viewed as a packageof measures working together leading to an energy reduction of 60% - 90% (withaverage costs of €330/m2).
Almost Zero-Energy Building renovations - negligible: the replacement or upgrade ofall elements which have a bearing on energy use, as well as the installation ofrenewable energy technologies in order to reduce energy consumption and carbonemission levels to close to zero (with average costs of €580/m2).
This illustrates that there are many opportunites to improve energy efficiency whenrenovating buildings that are not taken up.
2.1.3. The renovation marketA recent study25 estimated that the EU energy renovation market was worthapproximately EUR 109 billion in 2015, consisting of 882,900 jobs.26 The French,German and Italian energy renovation markets account for almost half of the EU total. TheGerman market is by far the largest, accounting for 22% of the total.
23 The Economist, 2013. Investing in energy efficiency in Europe’s buildings. A view from the construction and realestate sectors.
24 EP, 2016. Implementation of the Energy Efficiency Directive (2012/27/EU): Energy Efficiency ObligationSchemes. European Implementation Assessment.
25 Saheb, Y., 2016. Energy Transition of the EU Building Stock. Unleashing the 4th Industrial Revolution in Europe.26 The weighting coefficients used are 15% to assess the energy efficiency component of the renovation market is
and 8.1 jobs per million invested, based on the US study by ACEEE, 2008. The size of the US energy efficiencymarket: generating a more complete picture.

Boosting Building Renovation: What potential and value for Europe?
21 PE 587.326
Renovation accounts for 57% of the total construction market, with residentialbuildings, account for 65% of the renovation market in 2015.27
It has been estimated that the annual investment in the energy renovation of the buildingstock will need to grow from EUR 12 billion (~30 € per capita) (in 2014) to EUR 60 billion(~150 € per capita) in order to meet the EU target of a 20% energy efficiency improvementby 2020.28
2.2. Renovation potential in the EUConsidering the age profile of buildings in the EU (35% of the EU's buildings are over 50years old29) and the slow replacement rates, the renovation potential of buildings in theEU is huge - up to 110 million buildings could be in need of renovation (based on theestimates that count 210 million buildings in the EU30). The extent to which the potential toreduce the energy consumption of existing buildings is realised depends upon the number ofbuildings renovated and the depth of the renovation. There are numerous studies whichmodel combinations of renovation rates and depths. Depth is in turn related to thecombination of energy-efficiency measures in a renovation. A life cycle approach (thatconsiders the future life of the building, comparing energy savings againt the cost of variousenergy efficiency measures) when assessing which energy efficiency measures should beincluded in a renovation is the best way to find the optimal combination of renovationmeasures. However, this analysis is not frequently carried out.31
The cost-optimal level for energy performance is defined as “the energy performance levelwhich leads to the lowest cost during the estimated economic lifecycle”. Article 4(1) of theEPBD states that MSs shall take the necessary measures to ensure that minimum energyperformance requirements for buildings are set with a view to achieving cost-optimal levels.32
However, the interpretation of these requirements differ across Member States.33 There issignificant potential to make the targets implied by cost optimal approach more stringent ifall MSs adopted a consistent (and more testing) approach34 with a 15% difference betweenthe two extreme interpretations.35 Two thirds of the MSs have the potential to make someimprovements, and for about half of the MS, that improvement potential is large. Closing thisgap between the cost-optimal performance levels and the minimum energy requirements canbe achieved through various means36, such as lower investment costs, higher energy prices,lower interest rates, higher shares of renewable energy, the inclusion of the increased valueof property due to increased energy performance and the consideration of other co-benefits(energy security, employment creation, reduced air pollution, health, etc.).
The study “Renovation tracks for Europe until 2050 – building renovation in Europe – whatare the choices” states that a deep renovation of the existing stock together with newbuildings that are nearly zero energy, can save 80% of the final energy use for
27 Saheb, Y., 2016. Energy Transition of the EU Building Stock. Unleashing the 4th Industrial Revolution in Europe.28 CA EPBD, 2016. Implementing the Energy Performance of Buildings Directive (EPBD).29 https://ec.europa.eu/energy/en/topics/energy-efficiency/buildings.30 Loebel, O., 2016. Opportunities and Challenges in Existing Buildings, the Renovate Europe Campaign,
Advancements for Metal Buildings Congress, Ljubljana 22nd October 2016.31 Pombo, O., Rivela, B., & Neila, J., 2016. The challenge of sustainable building renovation: assessment of current
criteria and future outlook. Journal of Cleaner Production, 123, 88-100.32 EPBD Recast, 2010. Directive 2010/31/EU of the European Parliament and of the Council of 19 May 2010 on the
energy performance of buildings (EPBD)33 Ecofys, 2015. Assessment of cost optimal calculations in the context of the EPBD (ENER/C3/2013-414)34 EPBD Recast, 2010. Directive 2010/31/EU of the European Parliament and of the Council of 19 May 2010 on the
energy performance of buildings (EPBD)35 CA EPBD, 2016. Implementing the Energy Performance of Buildings Directive (EPBD)36 Ecofys, 2015. Assessment of cost optimal calculations in the context of the EPBD (ENER/C3/2013-414)

Policy Department A: Economic and Scientific Policy
22 PE 587.326
space heating by 2050, compared to 2012.37 The deep renovation of 3% of the buildingstock (25 billion m2), would generate energy savings of approximately 100 TWh/y by 2020.If around 20% of the building stock was deeply renovated by 2030, it would save 750TWh/y.38
A Eurima study39 supports the 80% final energy savings target (suggested by the EuropeanParliament). The size of the EU energy renovation market could increase by almosthalf the current levels if a 40% energy savings target was adopted for 2030. Meetingthis target would require renovation rates to rise to almost 3% (from 1%). This meansthat in 2030, the renovation market would be worth about EUR 122 billion withapproximately 988,200 additional jobs in the sector.40 GHG emissions would fall by62.9% in the residential sector and 73% in the non-residential sector by 2030. Witha 27% target, by 2030 GHG emissions would fall by 33.8% in the residential sectorand 50.6% in the non-residential sector.
2.3. Costs of building renovationsThe investment required to renovate Europe’s building stock has been estimated to be of theorder of EUR 1 trillion.41 Estimates of energy renovation costs range from EUR 200 to 450per m2 depending on the depth of renovation.42 Focusing less on energy efficiency and moreon renewable energy supply (as an alternative to deep renovation) turns out to be 3.5 %more expensive.43 Figure 6 shows that the costs of renovation differ per country, with labourcosts likely to be a key factor in this variation.
Figure 6: Average investment cost for different depths of renovation ofresidential buildings per m² in 2005
Source: ZEBRA2020 Data tool
37 Ecofys, 2015. The role of energy efficient buildings in the EUs future power system.38 http://cordis.europa.eu/result/rcn/155671_en.html.39 Eurima, 2012. Renovation tracks for Europe up to 2050; building renovation in Europe - what are the choices?40 Saheb, Y., 2016. Energy Transition of the EU Building Stock. Unleashing the 4th Industrial Revolution in Europe.41 IEA, 2014. Special Report: World Energy Investment Outlook.42 JRC, 2015. Energy renovation: The Trump Card for the New Start of Europe.43 Ecofys, 2012. Renovation tracks for Europe up to 2050.
Average Deeprenovation Light renovation Medium
renovation

Boosting Building Renovation: What potential and value for Europe?
23 PE 587.326
Figure 7: Average investment cost for different depths of renovation of non-residential buildings per m2 in 2005
Source: ZEBRA2020 Data tool
The overall costs assocated with building renovation are split between the property owners,public authorities and tenants (for rented or leased buildings) as explained below. Furtherdetail is given in Annex A.
Figure 8: Costs of renovation for different actors
2.4. Benefits of renovationBuilding renovations have several benefits in addition to energy savings. The diagram belowshows the most relevant ones. Further detail is given in Annex B.
Figure 9: Benefits of renovation
Costs and burdens forproperty owners and
landlords
•Assessment costs•Installation costs•Financing costs•Hidden costs•Costs of understandingregulations
Costs and burdens forauthorities
•Set up costs•Implementing,administrating, monitoringcosts
•Other costs e.g. advisingon regulations
Costs and burdens fortenants
•Potential rent increases
Environmental benefits
•Energy savings & GHGemissions reduction
•Reduced usage of materials
Economic benefits
•Employment•GDP and public budgets•Innovation•Sectoral modernisation•Energy Security•Productivity benefits
Social benefits
•Health benefits•Reduction energy poverty•Wellbeing / Comfortbenefits
•Energy bill savings•Increase in property value& tenant satisfaction

Policy Department A: Economic and Scientific Policy
24 PE 587.326
2.5. Barriers to renovation in the EUFigure 10 illustrates the key barriers to renovation. Further detail is given in Annex C.
Figure 10: Key barriers to energy renovation of buildings
Financial barriers
•Renovation costs•Access to finance•Low energy prices
Technical barriers
•Lack of technicalsolutions
•Cost of technicalsolutions
•Lack of knowledge ofconstruction professionals
Process barriers
•Fragmentation of thesupply chain
•Burdening of homeowners
Regulatory barriers
•Varying ambition ofperformance requirements
•Multiple definitions forrenovation
Awareness barriers
•Lack of awareness

Boosting Building Renovation: What potential and value for Europe?
25 PE 587.326
3. POLICIES TO BOOST RENOVATION
3.1. Overview of current policies to boost building renovation
3.1.1. EU targets and strategiesIn 2008, the European Commission adopted the 2020 Climate and Energy Package, whichestablished a target for a 20% improvement in EU’s energy efficiency by 2020. The 2030Climate and Energy Framework44, set an additional target of at least 27 % energy savingscompared to baseline projections by 2030.
The 2011 Roadmap to a Resource Efficient Europe (RERM)45 highlights buildings as one ofthree key sectors to be addressed to make significant resource savings. It includes thefollowing milestones: by 2020 the renovation and construction of buildings and infrastructurewill be made to high resource efficiency levels (…) policies for renovating the existing buildingstock will be in place so that it is cost-efficiently refurbished at a rate of 2% per year.
3.1.2. EU policiesThe Energy Performance of Buildings Directive (EPBD)46, together with the Energy EfficiencyDirective (EED)47, the Renewable Energy Directive (RED)48 , the Ecodesign Directive49 andEnergy Labelling are the key pieces of EU legislation relating to long-term improvements inthe energy performance of Europe's building stock.
Energy Performance of Buildings Directive (EPBD)Article 7 of the 2010 EPBD recast addresses renovation. The Directive intends to encouragerenovation requiring MSs to draw up national plans for increasing the number of nearly zero-energy buildings (NZEBs)50 including a list of national measures for funding energy efficiencyrenovations.51 The recast also required that existing buildings undergoing major renovation52
meet minimum energy performance requirements53 in so far as this is technically, functionallyand economically feasible. The EPBD further suggests that public buildings “set an example”by being subject to regular energy certification, and displaying their energy performancecertificates (EPCs) in a prominent place.
Energy Efficiency Directive (EED)Article 4 of the EED requires each MS to establish a lon-term strategy or roadmap formobilising investment in the energy efficient renovation of the national stock of residentialand commercial buildings, both public and private. As such, EU countries must create anoverview of their national building stock, identify cost-effective ways to renovate accordingto building type and climate, create policies and measures to stimulate investment in energy
44 COM (2014) 15. A policy framework for climate and energy in the period from 2020 to 2030.45 COM (2011) 57EC. Roadmap to a Resource Efficient Europe.46 Directive 2010/31/EU of the European Parliament and of the Council of 19 May 2010 on the energy performance
of buildings.47 Directive 2012/27/EU of the European Parliament and of the Council of 25 October 2012 on energy efficiency.48 Directive 2009/28/EC of the European Parliament and of the Council of 23 April 2009 on the promotion of the
use of energy from renewable sources.49 Directive 2009/125/EC of the European Parliament and of the Council of 21 October 2009 establishing a
framework for the setting of ecodesign requirements for energy-related products.50 EPBD Recast, 2010. Directive 2010/31/EU of the European Parliament and of the Council of 19 May 2010 on the
energy performance of buildings (EPBD).51 https://ec.europa.eu/energy/en/topics/energy-efficiency/buildings/financing-renovations.52 Member States should be able to choose to define a ‘major renovation’ either in terms of a percentage of the
surface of the building envelope or in terms of the value of the building.53 The method for the calculation of this is laid out in annex I of the EPBD recast.

Policy Department A: Economic and Scientific Policy
26 PE 587.326
efficient building renovation and create estimates of expected energy savings. Annex Dcontains a summary of the targets included in these national strategies.
The EED requires an annual renovation rate of 3% of buildings owned and occupied bynational central governments.54 It also requires MSs (Article 7) to establish and operateEnergy Efficiency Obligation Schemes (EEOS) or Alternative Measures (e.g. taxes, financialincentives, regulations, voluntary agreements or labelling, training, education and advice)that achieve the same amount of energy savings. Schemes are currently in place in elevenMSs (Austria, Bulgaria, Denmark, France, Italy, Ireland, Luxembourg, Poland, Slovenia,Spain and The UK) with good evidence of cost-effective savings, and a further five MSs planto establish such schemes. In six MSs (Denmark, France, Ireland, Italy, Poland and The UK),EEOS have transitioned from voluntary to mandatory.55 It is not clear if the use of AlternativeMeasures is positive or negative and their effectiveness relative to EEOS will be hard to assessbecause of the wide range of other factors that influence building renovation rates anddepths.
As part of their National Energy Efficiency Action Plans (NEEAPS), EU countries have drawnup national long-term strategies to show how they plan to foster investment in the renovationof residential and commercial buildings. According to recent research from the Joint ResearchCentre (JRC), the submitted strategies are on track when it comes to meeting therequirements of Article 4 of the Energy Efficiency Directive (EED). 74% of national strategiesmeet the requirements of EED. Ten countries show 'exemplary' standards namely the CzechRepublic, France, Greece, Hungary, Ireland, Lithuania, Romania, Slovenia, Spain and the UK.Six MSs are 'not compliant' (i.e. their renovation strategies can be considered insufficient)namely Austria, Bulgaria, Poland, Portugal and the Wallonia and Flanders regions of Belgium– although this may be due to a reporting issue.56
Ecodesign and Energy Labelling DirectivesThe Ecodesign Directive (2009/125/EC)57 sets minimum efficiency standards for technologiesused in the building sector (e.g. boilers, hot water generators, pumps, ventilation, lighting,etc.). The Energy Labelling Directive58, obliges MSs to use energy efficiency labelling schemesfor a number of products used in the building sector.
Renewable Energy Directive (RED)The Renewable Energy Directive (RED)59 focusses on achieving EU and national targets forthe use of energy derived from renewable sources. Building integrated renewables (PV, solarthermal, biomass boilers, etc.) are clearly noted as having a role in achiveing these targets,but there is nothing specifically related to the energy efficient renovation of buildings.
Roadmap for the Energy UnionBuildings are a pillar of the Energy Union as set by the 2015 Communication ‘A FrameworkStrategy for a Resilient Energy Union with a Forward-looking Climate Change Policy’l60, which
54 Directive 2012/27/EU of the European Parliament and of the Council of 25 October 2012 on energy efficiency.55 CA EPBD, 2016. Implementing the Energy Performance of Buildings Directive (EPBD).56 Castellazzi L., Zangheri P., Paci D., 2016. Synthesis Report on the assessment of Member States' building
renovation strategies.57 Directive 2009/125/EC of the European Parliament and of the Council of 21 October 2009 establishing a
framework for the setting of ecodesign requirements for energy-related products.58 Council Directive 92/75/EEC of 22 September 1992 on the indication by labelling and standard product
information of the consumption of energy and other resources by household appliances.59 Directive 2009/28/EC of the European Parliament and of the Council of 23 April 2009 on the promotion of the
use of energy from renewable sources.60 COM (2015) 080 final. A Framework Strategy for a Resilient Energy Union with a Froward-Looking Climate
Change Policy.

Boosting Building Renovation: What potential and value for Europe?
27 PE 587.326
calls also for action in this regard through the so-called ‘Smart Financing for Smart Buildings’initiative to make existing buildings more energy efficient, facilitating access to existingfunding instruments.
Overview of key policies and instruments√ - It addresses this barrier to a certain extent
√√ - It addresses this barrier to a great extent
X – I does not address this barrier
Table 1: EU building renovation policies classification according to barriersaddressed
Policies/Barriers Financialbarriers
Technicalbarriers
Processbarriers
Regulatorybarriers
Awarenessbarriers
EPBD √√√√ √
√Detailedbuilding
regulationsare
delegated,but this setslimits, whichshould helpachieve aminimumcosistency
√Exemplary
public sector+ Building
stockobservatory
EED √ √ X
√Some MSs
haveadjusted
regulationsas a result
√Exemplary
public sector
RED
√(indirectly,
as MSshave RESsupporttarrifs tohelp meet
thetargets)
X X X√
Exemplarypublic sector
Ecodesign &Energy LabellingDirective
X√
Ecodesign X X√√
Energylabelling
EU funds
√√ERDF,
CohesionFund,
H2020,IEE, etc.providing
grantsand/or FIs
√Build up
skills (waspart of IEE,
nowH2020)
X X X

Policy Department A: Economic and Scientific Policy
28 PE 587.326
Policies/Barriers Financialbarriers
Technicalbarriers
Processbarriers
Regulatorybarriers
Awarenessbarriers
Roadmap for theEnergy Union
√√Smart
Financingfor SmartBuildings
X X X X
Source: Trinomics
3.1.3. EU financial toolsOver EUR 38 billion is available over the period 2014-2020 from EU sources (e.g. CohesionFund, ERDF, H2020) to support the shift to a low carbon economy, with one third of this totalof potential relevance to boosting energy efficiency in buildings.61 Leveraging public andprivate sources, there is a potential to mobilise investment through financial instruments inexcess of EUR 100 billion over 2014-2020.62 The decision to specifically target structuralfunds on the energy efficient refurbishment and the use of renewable energy in existinghomes began with a change to the regualtions in 2009, as part of the European EconomicRecovery Plan. The change allowed up to four per cent of each member state’s ERDFallocation (including Eastern MSs with large stocks of low efficiency housing) to be spent onthis. The success of this change in improving the energy efficiency of existing housing stockquickly became apparent63. This approach was continued and expended in the 2014-2020fuding period, with the requirement that 12% to 20% (depending on the region’s level ofdevelopment) of each region’s European Regional Development Fund (ERDF) allocationshould be invested in measures supporting the shift to a low-carbon economy. DG Regioproduced technical guidance64 to Member States on ‘Financing the energy renovation ofbuildings with Cohesion Polcy funding’ which includes advice on the use of financialinstruments to leverage EU funds.
A report from the Energy Efficiency Financial Institutions Group (EEFIG) describes a numberof financial instruments relevant for renovation65, these include: Dedicated credit lines (orsoft loans); risk-sharing facilities (Guarantee funds and First-loss Facilities); real estate andinfrastructure funds; and Energy Performance Contracts. The EEFIG also identifies otheremerging instruments. These include: On-Bill Repayment, a mechanism used to improve thecreditworthiness (or seniority) of energy efficiency investments by having them repaid in theutility or tax bill and through the existing payment collection infrastructures of utilities orpublic authorities; and green bonds for green buildings (Supply Driver) led by the privatesector and institutional investors. The European Commission have announced66 that they willpresent a new Smart Financing for Smart Building initiative in the autumn of 2016.
3.1.4. National policiesEach MS has its own regulations, in line with the EPBD and EED, regarding buildings andrenovation. Analysis of the MS policies reported as being designed to meet national and EU
61 CA EPBD, 2016. Implementing the Energy Performance of Buildings Directive (EPBD).62 CA EPBD, 2016. Implementing the Energy Performance of Buildings Directive (EPBD).63 http://www.buildup.eu/sites/default/files/content/housing_structural_funds_web.pdf.64 https://ec.europa.eu/energy/sites/ener/files/documents/2014_guidance_energy_renovation_buildings.pdf.65 EEFIG, 2015. Energy efficiency, the first fuel for the EU economy. How to drive new finance for energy-efficiency
investments. Part 1: Buildings (Interim Report).66 http://www.euractiv.com/section/climate-environment/news/energy-union-boss-wants-wave-of-public-
finance-to-spur-building-renovations/

Boosting Building Renovation: What potential and value for Europe?
29 PE 587.326
energy and renovation targets indicates that 43% are financial and fiscal measures – of which90% are grants; 25% are regulatory measures - mostly directed to the implementation ofthe EPBD provisions regarding new buildings (and not renovations); and 13% are measuresaddressing issues such as training and capacity building. Of the planned measures, 36% arerelated to financing and 35% to regulatory measures.67 The table below provides a countryoverview regarding existing economic instruments targeting energy renovations.
Table 2: Main economic instruments in 2013 targeting energy renovations
Note: EEO – Energy efficiency obligation; WC – White certificate
Source: JRC, 2014. Financing building energy renovations: current experiences & ways forward
Annex E illustrates a selection of Member State specific regulation and policy measures.
67 Saheb, Y., 2016. Energy Transition of the EU Building Stock. Unleashing the 4th Industrial Revolution in Europe.
Policy Department A: Economic and Scientific Policy
30 PE 587.326
4. ASSESSMENT OF POLICY OPTIONSThis chapter describes and assesses the potential impacts associated with various policyoptions, providing a qualitative (and in parts quantitative) assessment of their costs andbenefits. These policy options are intended to suggest ways in which the EU and MSgovernments can help overcome the main barriers to the energy efficient renovation ofbuildings.
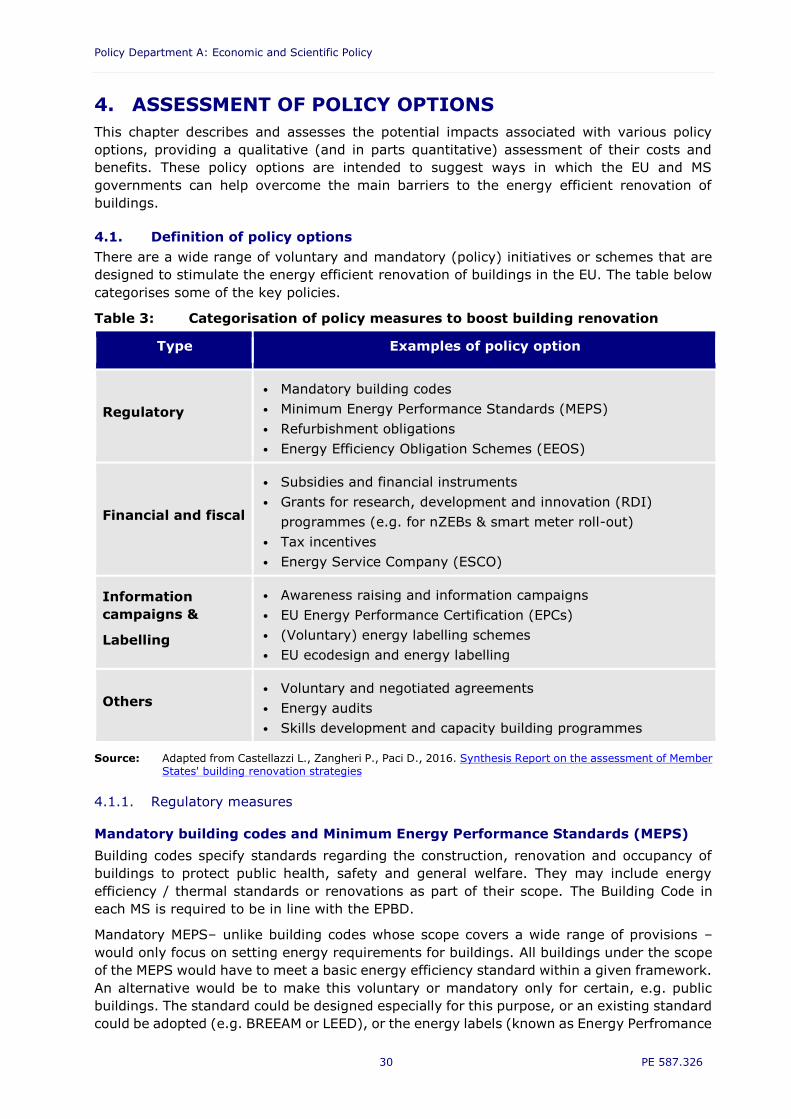
4.1. Definition of policy optionsThere are a wide range of voluntary and mandatory (policy) initiatives or schemes that aredesigned to stimulate the energy efficient renovation of buildings in the EU. The table belowcategorises some of the key policies.
Table 3: Categorisation of policy measures to boost building renovation
Type Examples of policy option
Regulatory
• Mandatory building codes• Minimum Energy Performance Standards (MEPS)• Refurbishment obligations• Energy Efficiency Obligation Schemes (EEOS)
Financial and fiscal
• Subsidies and financial instruments• Grants for research, development and innovation (RDI)
programmes (e.g. for nZEBs & smart meter roll-out)• Tax incentives• Energy Service Company (ESCO)
Informationcampaigns &
Labelling
• Awareness raising and information campaigns• EU Energy Performance Certification (EPCs)• (Voluntary) energy labelling schemes• EU ecodesign and energy labelling
Others• Voluntary and negotiated agreements• Energy audits• Skills development and capacity building programmes
Source: Adapted from Castellazzi L., Zangheri P., Paci D., 2016. Synthesis Report on the assessment of MemberStates' building renovation strategies
4.1.1. Regulatory measures
Mandatory building codes and Minimum Energy Performance Standards (MEPS)Building codes specify standards regarding the construction, renovation and occupancy ofbuildings to protect public health, safety and general welfare. They may include energyefficiency / thermal standards or renovations as part of their scope. The Building Code ineach MS is required to be in line with the EPBD.
Mandatory MEPS– unlike building codes whose scope covers a wide range of provisions –would only focus on setting energy requirements for buildings. All buildings under the scopeof the MEPS would have to meet a basic energy efficiency standard within a given framework.An alternative would be to make this voluntary or mandatory only for certain, e.g. publicbuildings. The standard could be designed especially for this purpose, or an existing standardcould be adopted (e.g. BREEAM or LEED), or the energy labels (known as Energy Perfromance

Boosting Building Renovation: What potential and value for Europe?
31 PE 587.326
Certificates (EPCs)) that buildings are required to show when sold (or rented in many MSs)could be used. There are several examples of building codes and MEPS, such as Germany’sminimum energy performance standards for buildings (Energieeinsparverordnung - EnEV –or Energy Saving Ordinance in English). The requirement to reach a mimimum energystandard could be triggered when the building is sold, rented or renovated.
Table 4: Pros and cons of building codes and MEPS
Pros Cons
Directly relate to individual buildings Complementary to ecodesign of
appliances and equipment Building codes present in all countries,
would only require adaptation Effective, would address the issue directly
since it’s mandatory A MEPS operation framework could build-
on existing EPC framework Take up can be high when paired with
financial incentives Can be paired with other standards such
as sanitation and safety
Address only new buildings and majorrenovations (or at sale/ rental)
Problem with enforcement, decreasestheir effectiveness
The results would depend on thestringency of the minimum requirements
Difficult to gain political acceptance if theyare mandatory
MEPS needs operational framework(setting the standard, accredited auditors,etc.)
Needs a long compliance period to gainsupport, potentially delaying results
Source: Trinomics
Annex E includes a description of the UK’s policy to require landlords to renovate theirproperties to a minimum energy standard before they can be rented out (or when the tenantchanges).
Refurbishment obligationsThe EED requirement for Member States to renovate 3% per year of the total floor area ofbuildings owned and occupied by the central government only affects a small proportion ofEurope’s buildings.68 However, a similar obligation could be set for additional building types(e.g. buildings in the service sector or social housing) and/or the obligation could beexpanded to include buildings owned and occupied by regional and local governments.
Table 5: Pros and cons of refurbishment obligations
Pros Cons
Targets all existing buildings (or selectedsegment of existing building stock)
Approach being used for public buildingscould be expanded
Can be combined with existing EPCs
Needs appropriate monitoring Burden on building owners Needs to be combined with incentives Although some MSs do it on a voluntary
basis, the EED does not require thereporting of projected energy savingsfrom the buildings stock
Source: Trinomics
Energy Efficiency Obligation Schemes (EEOS)EEOS are a policy mechanism that obliges energy suppliers to fund energy savings amongsttheir customers, with the amount of energy that needs to be saved typically defined on a percustomer basis. EEOS can deliver highly cost effective energy savings. Most EEOS cover all
68 BPIE, 2015. Renovation in practice. Best practice examples of voluntary and mandatory initiatives across Europe.

Policy Department A: Economic and Scientific Policy
32 PE 587.326
sectors, but some focus mainly, or exclusively, on the residential sector. As would beexpected, the majority of measures funded by EEOS are ‘low-hanging fruits’ (i.e. investmentswith the largest energy saving per unit of expenditure), in the residential sector this typicallymeans efficient light bulbs and roof insulation. For EEOS focused on buildings, continuing todeliver highly cost-effective savings becomes more challenging over time, as theopportunities available to install low-cost, mass market, technological savings opportunitiesare gradually used up. Therefore, rather than targeting low-income or fuel poor households,EEOS should focus on housing with very low energy efficiency standards. EEOS need to becombined with other policy measures, such as publicly funded grants and subsidised loanprogrammes.
Table 6: Pros and cons of EEOS
Pros Cons
In place or planned in 16 MSs69
Effective in housing with very low EEstandards
Targets the most cost effective savingsfirst
Different design in different MS Risk of under delivery for countries with
new EEOS which have not taken steps toshorten the learning period (i.e. BG, HR,EE, LV, LT, ES)
Source: Trinomics
Annex E includes an example of the Danish EEOS, which has operated since the 1990s andhas overachieved its annual energy saving target in every year except one. The Annex alsodescribes the Spanish approach where an EEOS equivalent is combined with Structural Fundsto finance domestic energy efficiciency investments.
4.1.2. Financial and fiscal measures
Subsidies and other financial instrumentsAn example of such an instrument is financial support for households (and/or buildingowners) that fulfil certain energy performance standards/ improvements when renovatingtheir building. The financial support is to help purchase and install energy efficiencymeasures/ equipment. This support can come from a dedicated fund, with a body establishedthat can also provide support regarding information on other possible financial instruments(e.g. tax advantages, soft loans, grants, etc.). It can target particular types of the housingstock and could further target, for example, low-income households to address energypoverty. An example of such a programme is the French Habiter Mieux programme and theGerman Reconstruction Credit Institute’s (KfW) programmes (which are described in AnnexE). An implementation risk is the attraction of recipients who would have carried out theinvestments without the incentive (i.e. free riders). In order to reduce this risk, careful designis required, e.g. restricting the scope to those least able to finance the investmentsthemselves e.g. low income households and Small and Medium Enterprises (SMEs).70
Annex E includes a profile of the Slovakian Municipal Sustainable Energy Financing Facility(MunSEFF) facility financed by the European Bank for Reconstruction and Development(EBRD) and the EC, which supported energy efficiency schemes via ESCOs and other methodsin 114 municipal buildings and 219 residential buildings. The Annex also includes adescription of a grant programme in Brussels to support exemplary energy renovations andto support energy surveys.
69 EP, 2016. Implementation of the Energy Efficiency Directive (2012/27/EU): Energy Efficiency ObligationSchemes. European Implementation Assessment.
70 JRC, 2014. Financing building energy renovations: current experiences & ways forward.

Boosting Building Renovation: What potential and value for Europe?
33 PE 587.326
Table 7: Pros and cons of subsidies and other financial instruments
Pros Cons
Can be effective, has been used broadly Can target low income households Targets existing buildings Could be complemented by an information
and marketing option. Grants and rebates most effective.
Needs a budget and an administrativebody
Risk of not enough participation & of freeriders
Eligibility criteria need to be properlydesigned and checked (avoiding misuse ofthis instrument)
Might need co-financing from tenants/landlords, which can be challenging forsome tenants/ owners
Monetary incentives are helpful but notsufficient to overcome the barriers forrental housing. Non-financial incentivesalso play a major role (marketing isneeded)
Source: Trinomics
Grants supporting RDI programmes (e.g. for nZEBs and smart meter roll-out)Funds are available at EU and national level to support research, development andinnovation. At the EU level, for example, the Horizon 202071 programme includes support fortechnology designed to improve the energy efficiency of buildings.
Table 8: Pros and cons of RDI Grants
Pros Cons
Can be targeted on those issues with keyknown technical and/or cost constraints
Supports innovation and the knowledgeeconomy – with future growth and jobsbenefits
Inevitable delay between developing andcommercialising the solutions
Resistance to change in the constructionsector slows uptake of innovation
Tax incentivesThere are a number of ways in which the tax system can be used to encourage the energyefficient renovation of buildings. This can be done by purchase tax (e.g. VAT) reductions forspecific products that are key to energy efficient renovation, such as boilers, water heaters,PV systems, double glazing, insulation, etc. It can also be done through income tax incentivesbased on the renovation investment as a whole. In this case a maximum renovationexpenditure allowance (in Euros/building) can be set against earnings to reduce the taxableamount and hence reduce the tax bill of the household / building owner. Examples of suchfiscal schemes are available in Italy, France and Belgium and are described in Annex E. Tax
71 Horizon 2020, through its Secure, Clean and Efficient Energy Challenge, includes both “Energy Efficiency” and“Smart Cities and Communities” as focus areas. 2016 calls for proposals include E-11: Overcoming marketbarriers and promoting deep renovation of buildings. Projects include, REFURB (REgional process innovationsFOR Building renovation packages opening markets to zero energy renovations), PROF-TRAC (PROFessionalmulti-disciplinary TRAining and Continuing development in skills for nZEB principles), and URBAN RECREATION(Energy efficient retrofit for carbon zero and socio-oriented urban environments). Intelligent Energy Europe (nowpart of H2020) also financed relevant projects such as PassREg (Passive House Regions with RenewableEnergies), Nearly Zero-Energy Building Strategy 2020 (ZEBRA2020) and Promotion of smart and integratednZEB renovation measures in the European renovation market (NEZER).

Policy Department A: Economic and Scientific Policy
34 PE 587.326
deductions can also be applied to property taxes. For example, one off, or ongoing propertytax discounts can be offered for buildings which have been renovated to a high standard ofenergy efficiency.
Table 9: Pros and cons of tax incentives
Pros Cons
Widely used (not to the extent of grants) Applicable to renovations and to products Mobilises private funding Does not affect the producer
Free riders Less tax income – cost for government Administrative costs
Source: Trinomics
Energy Service Companies (ESCOs)The ESCO concept is intuitively attractive because it uses the money saved throughinvestments in energy efficiency to pay off the cost of the initial capital investment. Thecustomer pays an "energy services charge," which allows the ESCO to collect the funds eachmonth from customers. With the ESCO using this charge to both purchase the (reduced)amount of energy required and to repay the capital invested in energy efficiency. Aninnovative feature (known in the United States as Pay-As-You-Save (PAYS)) is that thecharge is assigned to the meter location, thereby associating the costs and the savings tothe person paying the energy bill, rather than the costs of installation going to the owner ofthe property (as they are not necessarily the same person) and the energy savings benefittingthe occupier. This approach can help overcome the split incentive (also known as thelandlord/tenant) barrier.
Table 10: Pros and cons of ESCOs
Pros Cons
Provides financing for any and all energyefficiency products, purchased with nomoney down and financed by the utility oran independent provider
Not widely implemented as it represents adeparture from the current system
Major regulatory action would be requiredto allow tariffs to be assigned to metersrather than to customers (as the buildinguser may currently change their energysupplier at will, but for an ESCOarrangement to work, the tariff needs tostay in place until the ESCO recovers thecost of their expenditure on improvingenergy efficiency)
Source: Trinomics
Energy audit programmesEnergy audit programmes can be supported by governments at different levels. The purposeof energy audits is to assess the energy use of the building, to determine the energy savingspotential and to present recommendations on profitable energy saving measures. Energyaudit programmes usually combine financial incentives (subsidising the audits themselves)with information regarding potential energy saving measures. Annex E includes a descriptionof a Finnish energy audit programme, which has covered over 40% of the building stock sinceit started in 1992 and audited all of the industrial energy use.
Table 11: Pros and cons of energy audit programmes

Boosting Building Renovation: What potential and value for Europe?
35 PE 587.326
Pros Cons
Can be very effective, especially forservices and non-intensive industry
Additional aspects can be included in thescope (e.g. processes, material and wateruse)
Active promotion is essential Audit is broader than only renovation Needs to include: development of energy
audit models, auditor’s tools, training andauthorisation of auditors, monitoring andquality control
Does not ensure implementation ofsuggested measures (unless e.g.combined with financial incentives thatrequire this)
Source: Trinomics
4.1.3. Information campaigns & labelling
Awareness raising and information campaigns targeted at consumers and industryThis is a relatively “light” approach, in that it is low cost in comparison to policies such as taxincentives and audits. It is intended to increase awareness and increase the demand for moreenergy efficient buildings. The information on the benefits of energy efficiency and the waysin which it can be improved can be provided by any level of government, independentorganisations or local groups.
Table 12: Pros and cons of information campaigns
Pros Cons
Very light approach, easily politicallyacceptable
Moral or "soft" incentives such asinformation provision and community-based social marketing campaigns appealto individuals' sense of reason andresponsibility in order to encourageefficiency investments
Improves relationship between landlordsand tenants (e.g. via forums,communication)
They can make informed decisions aboutenergy usage and living situation
Effectiveness and efficiency are hard toevidence because it is very difficult toisolate, demonstrate or prove the directinfluence of such schemes
Source: Trinomics
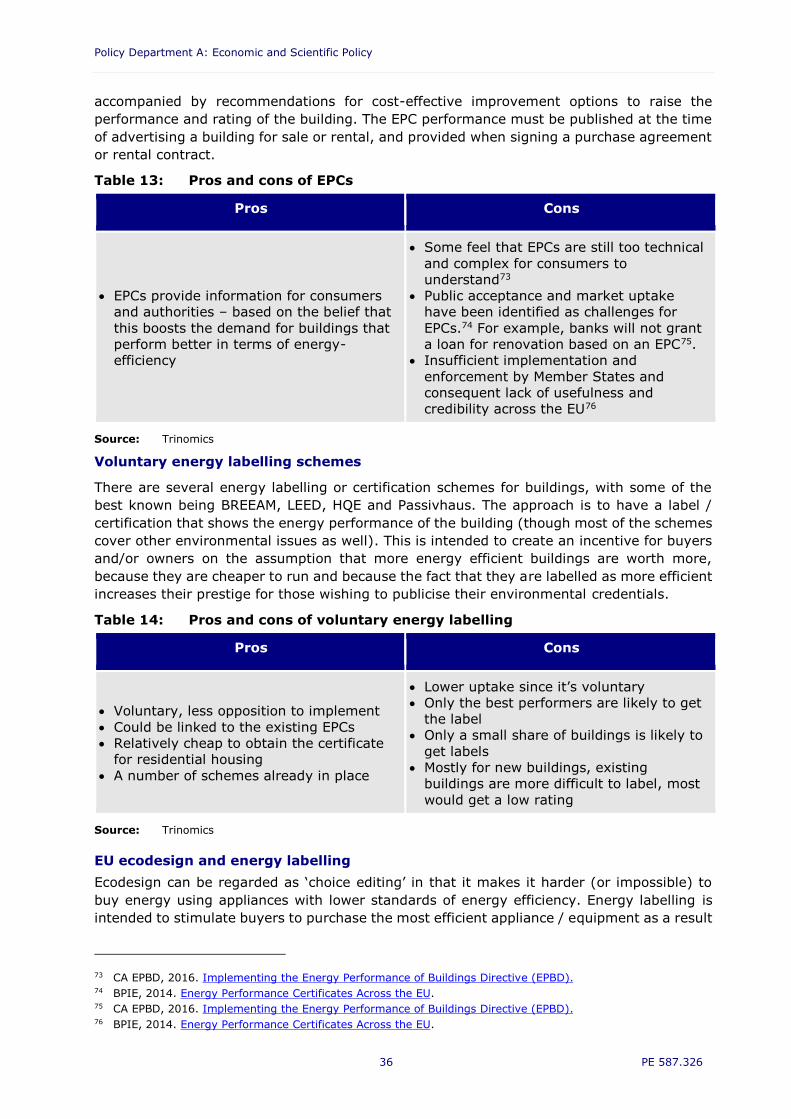
EU Energy Performance Certification (EPCs)The EPBD, among other measures, introduced a framework for energy performancecertificates (EPCs), although some MSs had similar sytems prior to this. EPCs coverresidential and non-residential buildings, whether they are public or private, owner-occupiedor rented.72 The main costs of EPCs are the costs to the bulding owner of getting a survey.There are also some costs associated with administering the system of accrediting surveyorsand mainting a register of certificates. EPCs must include reference values in order to makeit possible for consumers to compare and assess energy performance. They must also be
72 DG ENER, 2013. Energy performance certificates in buildings and their impact on transaction prices and rents inselected EU countries.
Policy Department A: Economic and Scientific Policy
36 PE 587.326
accompanied by recommendations for cost-effective improvement options to raise theperformance and rating of the building. The EPC performance must be published at the timeof advertising a building for sale or rental, and provided when signing a purchase agreementor rental contract.
Table 13: Pros and cons of EPCs
Pros Cons
EPCs provide information for consumersand authorities – based on the belief thatthis boosts the demand for buildings thatperform better in terms of energy-efficiency
Some feel that EPCs are still too technicaland complex for consumers tounderstand73
Public acceptance and market uptakehave been identified as challenges forEPCs.74 For example, banks will not granta loan for renovation based on an EPC75.
Insufficient implementation andenforcement by Member States andconsequent lack of usefulness andcredibility across the EU76
Source: Trinomics
Voluntary energy labelling schemes
There are several energy labelling or certification schemes for buildings, with some of thebest known being BREEAM, LEED, HQE and Passivhaus. The approach is to have a label /certification that shows the energy performance of the building (though most of the schemescover other environmental issues as well). This is intended to create an incentive for buyersand/or owners on the assumption that more energy efficient buildings are worth more,because they are cheaper to run and because the fact that they are labelled as more efficientincreases their prestige for those wishing to publicise their environmental credentials.
Table 14: Pros and cons of voluntary energy labelling
Pros Cons
Voluntary, less opposition to implement Could be linked to the existing EPCs Relatively cheap to obtain the certificate
for residential housing A number of schemes already in place
Lower uptake since it’s voluntary Only the best performers are likely to get
the label Only a small share of buildings is likely to
get labels Mostly for new buildings, existing
buildings are more difficult to label, mostwould get a low rating
Source: Trinomics
EU ecodesign and energy labellingEcodesign can be regarded as ‘choice editing’ in that it makes it harder (or impossible) tobuy energy using appliances with lower standards of energy efficiency. Energy labelling isintended to stimulate buyers to purchase the most efficient appliance / equipment as a result
73 CA EPBD, 2016. Implementing the Energy Performance of Buildings Directive (EPBD).74 BPIE, 2014. Energy Performance Certificates Across the EU.75 CA EPBD, 2016. Implementing the Energy Performance of Buildings Directive (EPBD).76 BPIE, 2014. Energy Performance Certificates Across the EU.

Boosting Building Renovation: What potential and value for Europe?
37 PE 587.326
of standardised and comparable information on energy efficiency (and other factors) beingclearly available at the point of sale.
Table 15: Pros and cons of ecodesign and energy labelling
Pros Cons
Already in place for several key types ofappliance and equipment (e.g. Ecodesignand energy labelling directives)
Known to be effective
Not sufficient to solve the issue alone asthey do not cover all potential sources ofenergy efficiency
Do not cover the energy performance ofthe building as a whole
Source: Trinomics
4.1.4. Others
Voluntary and negotiated agreementsAn example of a voluntary agreement would be a covenant where a housing associationagrees to renovate their properties to reach a specific energy performance (e.g. energy labelB) within a specific timeframe. This example requires a structured and regulated rentalmarket. Annex E includes a description of a Dutch example of this type of covenant, wherea housing corporation has committed to improving the efficiency of their housing stock.
Table 16: Pros and cons of voluntary agreements
Pros Cons
Take up can be high when paired withfinancial incentives
Voluntary, so less opposition toimplement
Involvement and ownership from keystakeholders (housing associations)
Need a commericalised, top-down market(associations)
Level of ambition depends on the housingassociation
Source: Trinomics
Skills development and capacity building programmesAn example of a relevant skills development and capacity building programme is the BUILDUP skills programme77. This was initiated in 2011 to boost continuing and further educationand training of craftsmen and other on-site construction workers, and (energy efficiency andrenewable energy) systems installers in the building sector. It is managed by the EuropeanCommission’s Executive Agency for Small and Medium-sized Enterprises (EASME). It beganas part of the Intelligent Energy Europe (IEE) programme and is now contuing as part of theHorizon 2020 programme. BUILD UP skills offers financial support to national teams to fosterthe continued education of workers in the building sector. The initiative stemmed from theshortage of building workers expected by 2020 in most European countries and the need fortraining of the current workforce to be able to construct according to energy efficiencystandards and to install renewable energy technologies. It was estimated that up to 3 millionworkers were in need of up-skilling on energy efficiency and/or renewable energytechnologies by 2020.78 To date, no cost-effectiveness assessment of the initiative has been
77 http://www.buildupskills.eu/about-bus.78 Vincent Berruto, 2015. Introduction to the 7th BUILD UP Skills EU-exchange meeting. Presentation at the BUILD
UP Skills 7th EU Exchange Meeting in Brussels, Belgium.

Policy Department A: Economic and Scientific Policy
38 PE 587.326
performed. This can be expected from the final evaluation of the programme after Pillar II iscompleted.79
Table 17: Pros and cons of skills development and capacity buildingprogrammes
Pros Cons
The complexity of energy-efficientrenovation and the current skills gapmakes the need for training key
Brings many stakeholders together, suchas national energy agencies, governmentor ministries; organisations for vocationaltraining and education, associations ofworkers (e.g. electricians, insulationworkers, workers with construction skills,plumbing, heating installations,carpenters, installers etc.) and financialinstitutions80
Preparing the Calls for Proposals forBUILD UP Skills was a time-consumingprocess due to consultation processeswith professional organisations and theneed to prepare pre-filled templates toensure comparability of the applications
BUILD UP Skills targeted blue-collarworkers, but the evaluation of the firstpillar of the programme (Pillar I)concluded that there is also a need totrain white-collar workers (e.g. architectsand engineers)81
Source: Trinomics
79 Trinomics is supporting EASME with the evaluation of Pillar II of BUILD UP Skills, which is due summer 2017.80 EC, 2016. Evaluation of the BUILD UP Skills Initiative under the Intelligent Energy Europe Programme.81 EC, 2016. Evaluation of the BUILD UP Skills Initiative under the Intelligent Energy Europe Programme.

Boosting Building Renovation: What potential and value for Europe?
PE 587.326 39
4.2. Assessment of the economic, social and environmental impacts of the different types of policies
Table 18: Assessment of policy options
Policy Type Barriersaddressed
Scope Costs Benefits Other
Building codes andMEPS Regulatory Regulatory All buildings High (due to operational
framework needed)
High potential(Mandatory, butdepends onrequirements’stringency)
Long compliance period
Enforcement issues
Refurbishmentobligations Regulatory Regulatory Existing buildings Medium (depends on
monitoring scheme)
High potential(Mandatory, butdepends on goal’sstringency)
Long compliance period
Enforcement issues
EEOS Regulatory Financial All buildings (andenergy use)
Medium (majority ofcost is borne byutilities, but this is likelyto ultimately be passedonto consumers)
High, but likely todimish over time. Notgood for ‘deeprenovation’
Utilities are likely topick most cost effectivemeasures first.
Subsidies & other FIs Financial Financial All buildings
High
185.2 €/GJ (GermanyKfW loans & grants)
99.3 €/GJ (Belgiangrants)
Medium
Risk of free riders
FIs are preferable,could use a revolvingfund to limit costs
Grants for RDIprogrammes
Financial +Informative Technical / Awareness
Industry +
Demonstration projectsLow Limited
Speed of take up ofinnovations oftenlimited by theconservative nature ofthe construction sector
Tax incentives Fiscal Financial All buildings
High
111.8 €/GJ (Italian taxcredit)
460.9 €/GJ (French taxcredit)
Medium Risk of free riders

Policy Department A: Economic and Scientific Policy
40 PE 587.326
Policy Type Barriersaddressed
Scope Costs Benefits Other
ESCOs Financial Financial / Process All buildings Low Medium
Can be constrained byfreedom of energysupplier legislation -asit requires the energycustomer to stay with asupplier for a fixed term
Energy audits Financial +Informative Technical / Awareness All buildings
Low
0.09-0.11 €/GJ(Finland)
Medium Risk of measures notbeing implemented
Awareness &informationcampaigns
Informative Awareness Tenants, owners,industry Low Limited Hard to prove / isolate
the impacts
Voluntary energylabels Informative Awareness All buildings Low Limited Several labels already
in place
EU ecodesign andenergy labelling
Regulatory+Informative
Awareness Appliances & equipment
Voluntaryagreements Other Process Buildings from housing
associations Low Medium (depends ongoal’s stringency)
Need commercialisedmarket
Skills and capacitybuilding Informative Technical / Awareness Industry Medium Medium
Costs: Costs to the EU and MSs incurred by the need to implement and monitor the policy option.Benefits: Increase in building renovations expected as a result from the policy option.Source: Trinomics

Boosting Building Renovation: What potential and value for Europe?
PE 587.326 41
4.3. Interactions between policiesIt is hard to arrive at a definition of an “optimal mix of policies” although it is apparent thatcombining different types of policies in a package, is likely to be more effective than stand-alone measures. According to a JRC study, 60% of economic instruments addressing energyretrofits were reported to be part of a policy package (though what constitutes a policypackage is not consistently defined across MSs).82 The different policy options presentedabove interact in several ways. Synergies can and should be created, but the interactionsshould be considered to avoid instruments undermining each other’s objectives andcredibility. The figure below provides an overview of the most relevant policy effects, andhow several measures together can provide better results, by both increasing the level ofenergy performance of the buildings and the amount of buildings being renovated.
Figure 11: The interactions of policy instruments for energy efficiency inbuilding renovation and operation
Source: Wuppertal Institute (2015), Energy efficiency policies for buildings
According to a Wuppertal study, the operational goal for a policy package aimed at buildingrenovation should be to: 1) achieve “deep” energy retrofits when a building is renovated;and 2) increase the rate of “deep” renovations83. The Wuppertal study includes the followingtable which provides a breakdown of the various policy types needed in a policy package:
82 JRC, 2014. Financing building energy renovations: current experiences & ways forward.83 Wuppertal Institute, 2015. Energy efficiency policies for buildings.

Policy Department A: Economic and Scientific Policy
42 PE 587.326
Figure 12: Components of the recommended policy package for energyefficiency in buildings
Source: Wuppertal Institute, 2015. Energy efficiency policies for buildings
Mandatory MEPS are arguably the most important instrument for new buildings, and alsovery important for renovations. However, for existing buildings, research suggests that themost important policies are those tackling information and financial barriers.84 Theseinstruments include EPCs and energy labels combined with awareness raising programmesand individual advice for building owners (e.g. energy audits), as well as financial support forinvestors85. EPCs have a number of interactions with other policies. A specific (relatively high)EPC rating is often used as a target for other interventions such as financial support orrefurbishment obligations. 86 When policies are targeted at buildings with an EPC rating belowa certain threshold it should help ensure that the least energy efficient buildings are tackledfirst.
84 Wuppertal Institute, 2015. Energy efficiency policies for buildings.85 Wuppertal Institute, 2015. Energy efficiency policies for buildings.86 JRC, 2014. Financing building energy renovations: current experiences & ways forward.

Boosting Building Renovation: What potential and value for Europe?
PE 587.326 43
5. RECOMMENDATIONS
5.1. Recommendations for EU policymakersA combination of tougher obligations, stronger incentives, more creative use of financialinstruments, and improved implementation and enforcement of existing legislation areprerequisites to boost renovation as explained below.
5.1.1. Legislating to boost the scale and scope of building renovationThere is a need to improve coherence between the different pieces of legislationthat have implications for building renovation i.e. EPBD, the EED and the RED. This wouldenable better exploitation of the synergies between the various policy instruments (EED,RED, Ecodesign Directive, Labelling Directive…).87 An example of a potential synergy wouldbe combining the work required on financial instruments, ESCOs, EEOS and expert training.88
Provisions to reduce energy consumption and GHG emissions of buildings are currentlyspread between several EU-wide policy instruments.89 This fragmented landscape of policyinstruments increases the reporting burden of MSs (as MSs have to report on the provisionsincluded in each instrument separately) and hampers the coherent assessment of theeffectiveness of overall EU investment (risk of double counting).90
The scope of the provisions of the EU policy instruments should be broadened. Theprovisions of the EU policy instruments to reduce energy consumption and GHG emissions ofthe building stock (which currently includes the overall building stock, different buildingtypologies individually, and building components and elements) should be broadened toproperly cover systems (i.e. heating, cooling and lighting).91
Policies should be designed so as to make better use of periodic opportunities when buildingwork occurs (i.e. any aesthetic or maintenance work which is done on a building) to improveenergy efficiency in a more cost-effective way.92
Broadening the scope of EU regulation for building renovation to increase its scale:
Mandatory renovation requirements for buildings that do not meet defined minimumlevels of energy performance.93 In order to address the buildings with the worstenergy performance, a minimum energy performance threshold target could be setfor all buildings (varied according to building type) to be achieved within a giventimeframe.94 If this timeframe is missed, the building in question would be deemedunsuitable for occupation. This should go alongside financial support to achieve thehigher energy standard.
Other opportunities to boost renovation identified in the literature include:95 makeresidential accommodation for households at risk of fuel poverty, e.g. social housing,meet the highest energy performance ratings within a specified timeframe in order toprovide comfortable, affordable housing; Make building extensions as well as major
87 Saheb, Y., 2016. Energy Transition of the EU Building Stock. Unleashing the 4th Industrial Revolution in Europe.88 EP, 2016. Implementation of the Energy Efficiency Directive (2012/27/EU): Energy Efficiency Obligation
Schemes. European Implementation Assessment.89 Saheb, Y., 2016. Energy Transition of the EU Building Stock. Unleashing the 4th Industrial Revolution in Europe.90 Saheb, Y., 2016. Energy Transition of the EU Building Stock. Unleashing the 4th Industrial Revolution in Europe.91 Saheb, Y., 2016. Energy Transition of the EU Building Stock. Unleashing the 4th Industrial Revolution in Europe.92 Wuppertal Institute, 2015. Energy efficiency policies for buildings.93 BPIE, 2016. 9 ways to make Energy Performance of Buildings Directive (EPBD) more effective.94 Saheb, Y., 2016. Energy Transition of the EU Building Stock. Unleashing the 4th Industrial Revolution in Europe.95 BPIE, 2015. Renovation in practice. Best practice examples of voluntary and mandatory initiatives across Europe.
Policy Department A: Economic and Scientific Policy
44 PE 587.326
building services (e.g. cooling, heating) system changes conditional on theimprovement of the overall energy performance of the building, and in the latter case,also conditional on an assessment of options for the introduction of renewables.
EU regulation needs to be more concrete. The various renovation concepts (majorrenovation, deep renovation etc) should be replaced by a single concept.96 The EPBD shoulddefine the specific circumstances in which building owners are required to renovate theirbuildings by investing in energy performance improvements. This is already done in some EUMember States (e.g. Germany, France, the UK, Belgium, Italy and Denmark).97
Enforcing and facilitating reporting. The EED should oblige MSs to report on projectedfinal energy savings from buildings against a long-term energy and/or carbon reductiontarget to 2050 with 2020 and 2030 milestones. These energy saving targets could be furtherspecified for each measure or group of measures. Templates, with guidelines to makereporting systematic and straightforward, should be provided to Member States to monitorEED implementation.98
EU regulation needs to be more ambitious. The current renovation concepts should bereplaced by a single and ambitious concept such as a ‘net zero energy’ consumption level,which combined with smart meters, will make monitoring of compliance and enforcementeasier.99 The target for Article 5 of the EED requiring Member States to renovate 3% of floorarea of the Central Government estate every year, should be extended to include all publicbuildings, so that the whole public sector leads by example.100
5.1.2. Financing renovationFinance for building renovation should be awarded on the “Energy Efficiency First”principle.101 “Energy Efficiency First” is the principle of prioritising the potential for energyefficiency first in all decision-making related to energy (over expanding infrastructure forgeneration, transmission and imports) to redress the historic bias towards prioritisingincreasing supply over reducing demand.
Establish an EU Risk Sharing Facility.102 This suggestion would enable more coherent useof public funding and provide continuous support to investments in energy renovation. Thisfacility would provide loan guarantees to project aggregators, to reduce the risks thatinvestors perceive. It would also enable low-interest rates at the local level. The facility couldbe established by bundling existing EU funding.
5.2. Recommendations for MS policymakersLocal/regional authorities in Member States are major potential players in the markettransformation of the EU building stock. Besides ensuring the effective transposition of EUlegislation, recommendations for this group are:
96 Saheb, Y., 2016. Energy Transition of the EU Building Stock. Unleashing the 4th Industrial Revolution in Europe.97 BPIE, 2016. 9 ways to make Energy Performance of Buildings Directive (EPBD) more effective.98 EP, 2016. Implementation of the Energy Efficiency Directive (2012/27/EU): Energy Efficiency Obligation
Schemes. European Implementation Assessment.99 Saheb, Y., 2016. Energy Transition of the EU Building Stock. Unleashing the 4th Industrial Revolution in Europe.100 BPIE, 2015. Renovation in practice. Best practice examples of voluntary and mandatory initiatives across Europe;
Saheb, Y., 2016. Energy Transition of the EU Building Stock. Unleashing the 4th Industrial Revolution in Europe.101 Saheb, Y., 2016. Energy Transition of the EU Building Stock. Unleashing the 4th Industrial Revolution in Europe.102 Saheb, Y., 2016. Energy Transition of the EU Building Stock. Unleashing the 4th Industrial Revolution in Europe.
Boosting Building Renovation: What potential and value for Europe?
PE 587.326 45
5.2.1. Assessment of the existing building stock - baselineA comprehensive census of their buildings to give a consistent assessment of the statusof the current building stock – i.e. a baseline – should be carried out by the Member States.103
Data on the European building stock has significant gaps. Effective renovation strategies canonly be implemented if Member States have good data to define baseline performance. Thiscould be supported by setting up national EPC databases that provide a ready-to-use sourceof information on the building stock for policy making and allow monitoring of theimplementation of EPCs at the MS and EU level.
5.2.2. Renovation legislationMember States need to increase their ambition and revise their cost-optimalcalculation methods. The cost-optimal methodology calculations of Member States showthat a significant improvement is necessary to support renovation activities towards nZEBgoals.104 Analysis suggest that about 2/3 of the Member States’ have potential to improvetheir approach by addressing the gap that exists between the ambitions set and the cost-optimal level, with about half of the Member States having a significant (larger than 15%)gap.105
5.2.3. Financing renovationIncrease the level of ambition for policy instruments aimed at boosting renovation.For the residential sector for instance, schemes that support renovation leading to minorenergy savings could be abolished106 in favour of incentives to reward more ambitiousrenovations.107
More emphasis on information dissemination and awareness raising regardingbuilding renovation. This should include ensuring open-source access to all aspects ofbuildings performance data and the articulation of the multiple benefits of energy efficiencyinvestments. Governments should provide information to improve the awareness levels ofdecision makers (public authorities, buildings owners and households)108. Market-basedinstruments are likely to become increasingly important in financing renovations.109
MS authorities should continue to work on translating EU funds (e.g. Cohesion fund) intowell-designed and targeted stimulus instruments for boosting building renovation.110
5.2.4. Facilitating the (decision-making) process of renovationMember states should encourage the set-up of one-stop-shops at the local / regionallevel as independent (from EU institutions) energy renovation facilitators. Their current roleas information providers should be expanded so that they become renovation coordinators,bringing together all parties needed in the renovation process to ensure quality and timely
103 BPIE, 2016. 9 ways to make Energy Performance of Buildings Directive (EPBD) more effective.104 BPIE, 2016. 9 ways to make Energy Performance of Buildings Directive (EPBD) more effective.105 Ecofys, 2015. Assessment of cost optimal calculations in the context of the EPBD (ENER/C3/2013-414).106 Dubois, M. and Allacker, K., 2015. Energy savings from housing: Ineffective renovation subsidies vs efficient
demolition and reconstruction incentives.107 CA EPBD, 2016. Implementing the Energy Performance of Buildings Directive (EPBD).108 EEFIG, 2015. Energy efficiency, the first fuel for the EU economy. How to drive new finance for energy-efficiency
investments. Part 1: Buildings (Interim Report).109 EP, 2016. Implementation of the Energy Efficiency Directive (2012/27/EU): Energy Efficiency Obligation
Schemes. European Implementation Assessment.110 EP, 2016. Implementation of the Energy Efficiency Directive (2012/27/EU): Energy Efficiency Obligation
Schemes. European Implementation Assessment.

Policy Department A: Economic and Scientific Policy
46 PE 587.326
delivery.111 MS authorities should contribute to clear roadmaps for renovation bycontinuing to work on documentation to assist building renovation strategies.112
5.3. Recommendations on the best policy mix to remove barriersA recent Wuppertal report on energy efficiency policies for buildings concluded with asummary of the optimum policy package. This package is equally relevant for buildingrenovations. The key points of the package are:
A clear vision and targets for energy efficiency need to be established at the highestgovernment level.
Allocate finance and resources for implementation of sectoral policies andaddressing market imperfections simultaneously.
At the sector-specific level, policy instruments such as regulations, incentives andfinancing and capacity building are important components of a comprehensive policypackage for energy efficiency in buildings.113
To summarise the optimum policy package should do the following:
Take synergies into account. Cover the full range of building types (and building ownership / occupation
patterns) - but prioritise those with most potential energy savings. Address each of the barriers - prioritising those with most potential. Reflect the mix of building stock (and climates) across Europe. Prioritise the lowest cost / highest impact policies.
The policy package should consist of a combination of mandatory and voluntary schemes, inorder to encourage participation and boost uptake. However, it should also be recognisedthat if results are not achieved then the voluntary aspects can need to become mandatoryto target certain issues.
111 Saheb, Y., 2016. Energy Transition of the EU Building Stock. Unleashing the 4th Industrial Revolution in Europe.112 EP, 2016. Implementation of the Energy Efficiency Directive (2012/27/EU): Energy Efficiency Obligation
Schemes. European Implementation Assessment.113 Wuppertal Institute, 2015. Energy efficiency policies for buildings.

Boosting Building Renovation: What potential and value for Europe?
PE 587.326 47
6. REFERENCES ACEEE, 2008. The size of the US energy efficiency market: generating a more complete
picture.
Beillan, V. et al., 2011. Barriers and drivers to energy-efficient renovation in theresidential sector: Empirical findings from five European countries. ECEEE Report.
BigEE/ Wuppertal, 2015. Energy efficiency policies for buildings.
BPIE, 2011. Europe's Building under the Microscope: A Country-by-Country Review ofthe Energy Performance of Buildings.
BPIE, 2014. Energy Performance Certificates Across the EU.
BPIE, 2015. Renovation in practice. Best practice examples of voluntary and mandatoryinitiatives across Europe.
BPIE, 2016. 9 ways to make Energy Performance of Buildings Directive (EPBD) moreeffective.
CA EPBD, 2016. Implementing the Energy Performance of Buildings Directive (EPBD).
Castellazzi, L., Zangheri, P., Paci D., 2016. Synthesis Report on the assessment ofMember States' building renovation strategies.
CE, 2015. The role of building renovation in the EU investment strategy.
COM (2011) 57EC. Roadmap to a Resource Efficient Europe.
COM (2014) 330 final - EU Energy security strategy.
COM (2014) 15: A policy framework for climate and energy in the period from 2020 to2030.
COM (2015) 080 final. A Framework Strategy for a Resilient Energy Union with aFroward-Looking Climate Change Policy.
Copenhagen Economics, 2012. Multiple benefits of investing in energy efficientrenovation of buildings.
Council Directive 92/75/EEC of 22 September 1992 on the indication by labelling andstandard product information of the consumption of energy and other resources byhousehold appliances.
DG ENER, 2013. Energy performance certificates in buildings and their impact ontransaction prices and rents in selected EU countries.
Directive 2009/125/EC of the European Parliament and of the Council of 21 October 2009establishing a framework for the setting of ecodesign requirements for energy-relatedproducts.
Directive 2009/28/EC of the European Parliament and of the Council of 23 April 2009 onthe promotion of the use of energy from renewable sources.
Directive 2010/31/EU of the European Parliament and of the Council of 19 May 2010 onthe energy performance of buildings.
Directive 2012/27/EU of the European Parliament and of the Council of 25 October 2012on energy efficiency.
Dubois, M. and Allacker, K., 2015. Energy savings from housing: Ineffective renovationsubsidies vs efficient demolition and reconstruction incentives.

Policy Department A: Economic and Scientific Policy
48 PE 587.326
Ecofys, 2011. Panorama of the European non-residential construction sector.
Ecofys, 2012. Renovation tracks for Europe up to 2050.
Ecofys/Eurima, 2014. Deep renovation of buildings. An effective way to decreaseEurope’s energy import dependency.
Ecofys, 2015. The role of energy efficient buildings in the EUs future power system.
Ecorys, 2014. Resource efficiency in the building sector.
EEA, 2010. SOER2010 Material resources and waste — SOER 2010 thematic assessment.
EEA, 2010. SOER2010 Land use — SOER 2010 thematic assessment.
EEFIG, 2015. Energy efficiency, the first fuel for the EU economy. How to drive newfinance for energy-efficiency investments. Part 1: Buildings (Interim Report).
Element Energy, 2016. Minimum thermal efficiency standards for rental properties.
ENSPOL, 2015. Energy Saving Policies and Energy Efficiency Obligation Scheme. D2.1.1:Report on existing and planned EEOS in the EU – Part I: Evaluation of existing schemes.
EPBD Recast, 2010. Directive 2010/31/EU of the European Parliament and of the Councilof 19 May 2010 on the energy performance of buildings (EPBD).
EP, 2016. Implementation of the Energy Efficiency Directive (2012/27/EU): EnergyEfficiency Obligation Schemes. European Implementation Assessment.
EUPOPP, 2010. Impact Assessment Paper- Minimum energy performance standards forbuildings in Germany.
Eurima, 2012. Renovation tracks for Europe up to 2050; building renovation in Europe -what are the choices?
EC, 2012. Consultation paper financial support for energy efficiency in buildings,Brussels, February (results but no consultation paper).
EC, 2016. Evaluation of the BUILD UP Skills Initiative under the Intelligent Energy EuropeProgramme.
Fisk, W., Seppanen, O., 2007. Providing better indoor environment quality bringseconomic benefits. Published in proceedings of Climate 2007. Lawrence BerkeleyNational Laboratory, University of Berkeley and Helsinki University of Technology,Finland.
Helgesen, PJ and IEA SHC Task 47, 2014. Upgrading of the non-residential building stocktowards nZEB standard: Recommendations to authorities and construction industry.International Energy Agency, IEA. Solar Heating and Cooling.
Hoppe, T., 2012. Adoption of innovative energy systems in social housing: Lessons fromeight large-scale renovation projects in The Netherlands. Energy Policy, 51, 791–801.
IEA, 2010. Policy pathways: energy performance certification of buildings.
IEA, 2014. Special Report: World Energy Investment Outlook.
IEEP, 2013. Review of costs and benefits of energy and savings.
Itard, L., 2008. Building Renovation and Modernization in Europe: State of the ArtReview.
Itard, L. and Meijer, F., 2008. Towards a sustainable Northern European housing stock:figures, facts and future.

Boosting Building Renovation: What potential and value for Europe?
PE 587.326 49
JRC, 2014. Financing building energy renovations: current experiences & ways forward.
JRC, 2015. Energy renovation: The Trump Card for the New Start of Europe.
Loebel, O., 2016. Opportunities and Challenges in Existing Buildings, the RenovateEurope Campaign, Advancements for Metal Buildings Congress, Ljubljana 22nd October2016.
Mahapatra, K. et al., 2013. Business models for full service energy renovation of single-family houses in Nordic countries. Applied Energy, 112, 1558–1565.
Meijer, F., Visscher, H. E. N. K., Nieboer, N., & Kroese, R., 2012. Jobs creation throughenergy renovation of the housing stock. Neujobs Working Paper D 14.2, December.
Mlecnik, E., Kondratenko, I., Haavik, T., 2013. Opportunities and Barriers related toSupply Chain Collaboration for Delivering Integrated Single-Family Home Renovations.Presented at the CIB World Building Congress 2013 in Brisbane, 5-9 May 2013.
Mlecnik, E. et al., 2012. Opportunities and barriers for business modelling of integratedenergy renovation services. PassivhusNorden, 2012.
Mlecnik, E., 2013. Opportunities for supplier-led systemic innovation in highly energy-efficient housing. Journal of Cleaner Production, 56, 103-111.
Pombo, O., Rivela, B., & Neila, J., 2016. The challenge of sustainable building renovation:assessment of current criteria and future outlook. Journal of Cleaner Production, 123,88-100.
RESIDE project, 2015. Deliverable 1.1. A baseline scenario for energy efficiencyrenovations in Europe’s residential buildings.
Saheb, Y., 2016. Energy Transition of the EU Building Stock. Unleashing the 4th IndustrialRevolution in Europe.
The Economist, 2013. Investing in energy efficiency in Europe’s buildings. A view fromthe construction and real estate sectors.
Total Concept, 2014. Energy Renovations of Non-residential Buildings in NorthernEuropean Countries. National non-technical barriers and methods to overcome them.
UEA Low Carbon Innovation Centre and Build with CaRe, 2012. Refurbishing Europe. AnEU Strategy for Energy Efficiency and Climate Action Led by Building Refurbishment.Executive Summary.
Vincent Berruto, 2015. Introduction to the 7th BUILD UP Skills EU-exchange meeting.Presentation at the BUILD UP Skills 7th EU Exchange Meeting in Brussels, Belgium.
World Green Building Council, 2014. Health, Wellbeing & Productivity in Offices. The nextchapter for green building.
Wuppertal Institute, 2015. Energy efficiency policies for buildings.
Wyon, D. P., 2004. The effects of indoor air quality on performance and productivity.Indoor air, 2004, 14 suppl 7 Page 92-101. International Centre for Indoor Environmentand Energy, Technical University of Denmark, Denmark.
ZenN – Nearly Zero energy Neighborhoods, 2013. Common barriers and challenges incurrent nZEB practice in Europe D.1.1. Report.

Policy Department A: Economic and Scientific Policy
50 PE 587.326
ANNEXES
Annex A. Costs and burdens for property owners and landlords, authorities andtenants
Costs and burdens for property owners and landlords
Assessment costs - Incurred by property owners in order to have theirproperties assessed and to arrange and finance any required improvements;
Installation costs – of carrying out the works necessary to implement theenergy efficient measures;
Financing costs – of the renovation for the property owner (or tenant), dependon the conditions of the commercial loan obtained by the bank;
Hidden costs – as result of contracts that are not clear, clean-up costs afterthe renovation, costs of not being able to inhabit or cook in the building / home(in the case the property owner is the occupier of the building / house) or lostrental cost (in the case of landlords);
Costs of understanding regulations – to assess to what extent certainmeasures are allowed to be implemented in a building.
Costs and burdens for authorities related to supporting policies Set up costs (e.g. training staff to develop knowledge on the regulations,
information campaigns of new legal duties to landlords);
Implementing, administrating and monitoring of the supporting policies,
including e.g. the set-up of databases on the building stock and its energy
performance level;
Other annual costs114 such as advising on regulations, assessing compliance,
dealing with complaints related to the supporting policies, costs for certifying
temporary exemptions, etc.
Costs and burdens for tenantsThe costs and burdens for tenants mainly revolve around potential rent increases –depending on if, and to what extent, the costs of energy efficiency improvements forlandlords will/ can be passed onto tenants.
In addition, tenants may also need to bear the burden of some of the aforementioned hidden-costs, for example, clean-up costs after the renovation, or the costs of not being able toinhabit or cook in the building / home (if the tenant was already inhabiting the house whenthe renovation works started).
114 Annual costs: One local authority indicated an average annual cost of around £53,000 based on 0.5 FTE HousingOffice; 1 Technical Officer; 0.1 Senior Officer. These are costs for an average year. It is expected that annualcosts will be higher in the run to up the minimum energy efficient standard coming into force and the first fewyears after the policy has come into force.

Boosting Building Renovation: What potential and value for Europe?
PE 587.326 51
Annex B. Benefits of renovation
B.1 Environmental benefits
Energy savings and GHG emission reductionsDeep renovation115 can lead to a 75% reduction in final energy comsumption by 2050(compared to 2010).116 By 2050 it would also lead to a 95% reduction in gas consumption(from 1,653 TWh in 2015 to 82 TWh) and of 97% in oil consumption (from 745 TWh to 19TWh).117. A high efficiency scenario, savings in peak demand for electricity could be as highas 57 GW (over one-tenth of the EU’s total) by 2050 compared to a low efficiency scenario,resulting in savings on power generation capacity of EUR 89-153 billion up to 2050.118 Deeprenovation can generate significant GHG emission reductions (up to 90% savings by 2050compared to 1990).119
Reduced usage of materialsImpacts on waste and input materials can also be expected.120 More than 30-50% of totalmaterial use in Europe goes to housing121. Around 65% of total aggregates (sand, gravel andcrushed rock) and approximately 20% of total metals are used by the construction sector.122
For renovation of existing buildings, less material is required per square meter than forconstruction of new buildings. Increasing the rate of renovation compared to demolition andsubsequent new build could therefore decrease future levels of construction and demolition(C&D) waste generation. C&D waste is about 33% of total EU waste generated.123
B.2 Economic benefits
EmploymentEnergy efficient renovation of buildings supports employment. It has been calculated togenerate about 19 jobs for every million euros invested124. Other studies estimate 12 – 17jobs per million euros invested.125 Estimates of employment creation differ from source tosource, probably due to the different depths of renovation possible and the different targetsthat are being explored. A 2014 study for Eurima, states that a ‘deep renovation’ scenario126
would lead to the creation of an additional 1.4 million jobs by 2050.127 If an energy savings
115 Deep renovation defined as “a high level of energy efficiency improvement at a rate of 2.3% of the buildingstock, with a high focus on the efficiency of the building envelope and high use of renewable energy”.
116 Ecofys, 2012. Renovation tracks for Europe up to 2050.117 Ecofys/Eurima, 2014. Deep renovation of buildings. An effective way to decrease Europe’s energy import
dependency.118 Ecofys, 2015. The role of energy efficient buildings in the EUs future power system.119 Ecofys/Eurima, 2014. Deep renovation of buildings. An effective way to decrease Europe’s energy import
dependency.120 http://ec.europa.eu/smart-regulation/roadmaps/docs/2016_ener_001_epbd_smart_buildings_en.pdf.121 EEA, 2010. SOER2010 Material resources and waste — SOER 2010 thematic assessment.122 Ecorys, 2014. Resource efficiency in the building sector.123 EEA, 2010. SOER2010 Land use — SOER 2010 thematic assessment.124 Copenhagen Economics, 2012. Multiple benefits of investing in energy efficient renovation of buildings. Ratio
from Janssen, R. and Staniaszek, D., 2012. How many jobs? A survey of the Employment Effects of Investmentin Energy Efficiency of Buildings.
125 IEEP, 2013. Review of costs and benefits of energy and savings.126 Deep renovation defined as “a high level of energy efficiency improvement at a rate of 2.3% of the building
stock, with a high focus on the efficiency of the building envelope and high use of renewable energy”.127 Ecofys/Eurima, 2014. Deep renovation of buildings. An effective way to decrease Europe’s energy import
dependency.

Policy Policy Department A: Economic and Scientific Policy
52 PE 587.326
target of 40% is adopted for 2030, the EU energy renovation market could increase by almosthalf its current size, leading to more than one million additional jobs.128 This implies that thenumber of jobs created in the sector is positively correlated to the ambition of the renovationand energy saving targets set by authorities. Estimates from the industry are more optimisticand predict the number of additional jobs stemming from energy-efficient renovation(without specifying to what depth i.e. deep renovation or not) would be 2 million by 2020and additional 1.1 million on average per year until 2050.
In addition to this, renovation enhances the resilience of the construction sector in the faceof a crisis, as evidenced by the experience in recent years.129 Employment dropped drasticallyin countries where the construction sector focused mainly on new build construction projectsas compared to countries in which the fraction of renovation activities was higher.
GDP and public budgetsA 2012 study130 showed that EUR 1 billion of energy efficiency investments, had an impacton GDP of EUR 0.88 – 1.06 billion. In addition, energy efficiency improvements in buildingscan ease pressure on public finances (i.e. budgets of national authorities), by generatingincreased tax revenues through increased economic activity and by reducing governmentexpenditure on energy131 and unemployment benefits132.
Innovation & sectoral modernisationBoosting energy efficient renovation should improve competitiveness and innovation in theEuropean construction and energy services industries.133
Energy security & energy infrastructureThe EU’s dependency on energy imports is up to 90% for crude oil and 66% for naturalgas134, differing per Member State. This is particularly important for those Member Statesthat are solely reliant on imported gas from one single supplier namely Belgium, Estonia,Czech Republic, Latvia, Lithuania and Portugal.135 A 2014 study136 suggests that deeprenovation137 would reduce buildings gas consumption by 95% by 2050 and of oilconsumption by 97%.
Productivity benefitsLiterature138 suggests that improvements in energy efficiency, leading to improved indoor airquality and thermal comfort, has productivity benefits. These result from fewer days of work
128 Saheb, Y., 2016. Energy Transition of the EU Building Stock. Unleashing the 4th Industrial Revolution in Europe.129 JRC, 2015. Energy renovation: The Trump Card for the New Start of Europe.130 Copenhagen Economics, 2012. Multiple benefits of investing in energy efficient renovation of buildings.131 http://ec.europa.eu/smart-regulation/roadmaps/docs/2016_ener_001_epbd_smart_buildings_en.pdf.132 Copenhagen Economics, 2012. Multiple benefits of investing in energy efficient renovation of buildings.133 http://ec.europa.eu/smart-regulation/roadmaps/docs/2016_ener_001_epbd_smart_buildings_en.pdf.134 COM (2014) 330 final - EU Energy security strategy.135 Saheb, Y., 2016. Energy Transition of the EU Building Stock. Unleashing the 4th Industrial Revolution in Europe.136 Ecofys/Eurima, 2014. Deep renovation of buildings. An effective way to decrease Europe’s energy import
dependency.137 Deep renovation defined as “a high level of energy efficiency improvement at a rate of 2.3% of the building
stock, with a high focus on the efficiency of the building envelope and high use of renewable energy”.138 Wyon, D. P., 2004. The effects of indoor air quality on performance and productivity. Indoor air, 2004, 14 suppl
7 Page 92-101. International Centre for Indoor Environment and Energy, Technical University of Denmark,Denmark; World Green Building Council, 2014. Health, Wellbeing & Productivity in Offices. The next chapter forgreen building; Fisk, W., Seppanen, O., 2007. Providing better indoor environment quality brings economic

Boosting Building Renovation: What potential and value for Europe?
PE 587.326 53
missed. A study139 estimates that every euro invested in insulation, results in 0.78 eurosbenefit in reduced days of work missed. Productivity improvements due to better air qualitycan reach 8-11%.140
B.3 Social benefits
Health benefitsRenovation reduces energy demand, which reduces energy production and associated airpollution from burning fossil fuels. As mentioned above it also improves indoor air conditions.Both of these points decrease respiratory diseases and improve productivity.141
Wellbeing / comfort benefitsRenovation is also a key issue in the reduction of the level of severe housing deprivation inEurope. Eurostat defines severe housing deprivation as “the percentage of the populationwhich is considered overcrowded”, while also exhibiting at least one of the housingdeprivation measures (leaking roof, no bath/shower/ no indoor toilet, high level of darknessin dwelling).142
Energy povertyThe share of the EU population unable to keep their homes warm -which impacts health andcomfort- increased from 9.5% in 2010 to 10.2% in 2014.143 Building renovations shouldreduce energy poverty by cutting energy bills. This should also reduce the number ofhouseholds that are unable to pay their utility bills on time due to financial difficulties, i.e.decrease the proportion of the population with arrears on utility bills. In 2013, around 10 percent of the households in the EU28 were in arrears with energy utility bills.144 The majorityof these households were in South Eastern Europe – Greece, Romania, Bulgaria, Croatia andHungary.
Increased property valueBoth property value and rental income can be assumed to increase from renovation ofproperties with energy efficiency measures.145 A study found that a property with an EPC Arating is typically worth 11% more, and can attract 1.9% higher rent, than a D rated propertyin the same location.
benefits. Published in proceedings of Climate 2007. Lawrence Berkeley National Laboratory, University ofBerkeley and Helsinki University of Technology, Finland.
139 Copenhagen Economics, 2012. Multiple benefits of investing in energy efficient renovation of buildings. Ratioderived from Barnard et al, 2011. Warm Up New Zealand.
140 World Green Building Council, 2014. Health, Wellbeing & Productivity in Offices. The next chapter for greenbuilding.
141 Element Energy, 2016. Minimum thermal efficiency standards for rental properties.142 Ecorys, 2014. Resource efficiency in the building sector.143 Saheb, Y., 2016. Energy Transition of the EU Building Stock. Unleashing the 4th Industrial Revolution in Europe.144 Micklitz, H. W., & Domurath, M. I. (2015). Consumer debt and social exclusion in Europe. Ashgate Publishing,
Ltd.145 Element Energy, 2016. Minimum thermal efficiency standards for rental properties.

Policy Policy Department A: Economic and Scientific Policy
54 PE 587.326
Annex C. Barriers to renovation
C.1 Financial barriers
Renovation costsThe (high) upfront costs of renovation and the long payback for some measures are probablythe most important barriers found in literature.
Access to financeThere is a lack of standard financial approaches for building renovation (e.g. agreed protocolsand benchmarking rules for private capital investment, ‘ready to use’ financial products). TheEnergy Efficiency Financial Institutions Group (EEFIG) highlighted the need for a strongregulatory framework accompanied by financing-related measures such as improvement ofpublic procurement rules, standardisation of investment procedures or better monitoring ofenergy performance.146
Low energy prices / energy as a minor part of the budgetLow energy prices are a major barrier for countries in which the energy costs are a small partof the overall budget of a real estate company and of the rents for the tenants, as is the casein Denmark. This reduces the financial value of the energy savings that renovation to a highstandard of energy efficiency generates, and affects the payback period.147
C.2 Technical barriers
Lack of technical solutionsAlthough technology is not generally a significant barrier for building renovation, energyefficient approaches may not be easily available in some cases (for example because of thehistoric nature of the building component in question) or there may be uncertainties as towhether the new technologies will perform reliably.148
Cost of technical solutionsThe affordability of certain technical solutions is a problem.149
Complexity of renovations and associated lack of knowledge of constructionprofessionals
Many construction professionals still lack training and experience with some of the methodsand materials required to deliver successful energy efficiency renovations. Different authors
146 http://ec.europa.eu/smart-regulation/roadmaps/docs/2016_ener_001_epbd_smart_buildings_en.pdf.147 Total Concept, 2014. Energy Renovations of Non-residential Buildings in Northern European Countries.
National non-technical barriers and methods to overcome them.148 BigEE/ Wuppertal, 2015. Energy efficiency policies for buildings.149 ZenN – Nearly Zero energy Neighborhoods, 2013. Common barriers and challenges in current nZEB practice in
Europe D.1.1. Report.

Boosting Building Renovation: What potential and value for Europe?
PE 587.326 55
agree that better supply side collaboration structures between SMEs are needed150 and/orthat professionals are key to tackling this issue. 151
C.3 Process barriers
Fragmentation of the supply chainSome feel 152 that the lack of a single party willing to offer integrated housing renovation asa service, is a key barrier to low energy (particualry near zero energy) renovations. At presentthe need for mutliple parties to work together on a construction project is a constraint.
Complexity of renovation and associated burdening of home ownersRenovation of buildings requires building/housing owners to contract various different parties(architects, energy advisors, contractors, etc.) for each type of specialised work. The financialinstruments available for renovation are also not always clear.153
C.4 Regulatory barriers
Varying ambition of performance requirementsAll Member States have introduced EPCs, but their quality, reliability and market acceptancevaries which undermines their credibility. The EPBD could set national guidelines for theirimplementation, encourage independent control and enforce penalties for non-compliance.154
Multiple definitions for renovationThe EED uses five ‘renovation’ concepts: ‘deep’ ‘cost-effective’, ‘staged deep’, ‘substantialrefurbishment’ and ‘comprehensive’. The EPBD focused on the concept of ‘major renovation’.These different terminologies and definitions cause confusion.155
C.5 Awareness barriersIndividuals are often insufficiently acquainted with the energy performance of their building(insulation and performances of equipment) and with the comfort and quality of life anenergy-efficient retrofit can bring, although the degree of unfamiliarity varies betweencountries.156
150 IEA, 2010. Policy pathways: energy performance certification of buildings; Hoppe, T., 2012. Adoption ofinnovative energy systems in social housing: Lessons from eight large-scale renovation projects in TheNetherlands. Energy Policy, 51, 791–801; Mlecnik, E., Kondratenko, I., Haavik, T., 2013. Opportunities andBarriers related to Supply Chain Collaboration for Delivering Integrated Single-Family Home Renovations.Presented at the CIB World Building Congress 2013 in Brisbane, 5-9 May 2013.
151 Mlecnik, E., Kondratenko, I., Haavik, T., 2013. Opportunities and Barriers related to Supply Chain Collaborationfor Delivering Integrated Single-Family Home Renovations. Presented at the CIB World Building Congress 2013in Brisbane, 5-9 May 2013.
152 Mlecnik, E. et al., 2012. Opportunities and barriers for business modelling of integrated energy renovationservices. PassivhusNorden, 2012; Mahapatra, K. et al., 2013. Business models for full service energy renovationof single-family houses in Nordic countries. Applied Energy, 112, 1558–1565; Mlecnik, E., 2013. Opportunitiesfor supplier-led systemic innovation in highly energy-efficient housing. Journal of Cleaner Production, 56, 103-111.
153 CA EPBD, 2016. Implementing the Energy Performance of Buildings Directive (EPBD).154 BPIE, 2016. 9 ways to make Energy Performance of Buildings Directive (EPBD) more effective.155 Saheb, Y., 2016. Energy Transition of the EU Building Stock. Unleashing the 4th Industrial Revolution in Europe.156 Beillan, V. et al., 2011. Barriers and drivers to energy-efficient renovation in the residential sector: Empirical
findings from five European countries. ECEEE Report.

Policy Policy Department A: Economic and Scientific Policy
56 PE 587.326
Annex D. Renovation levels and energy savings targeted or expected by MSs157
MemberState
Target/Estimation
Energy savings
Austria Estimated 3% building sector energy use reduction in the in 2020,compared to 2013.
Belgium(BrusselsCapitalRegion -BCR)
n/a n/a
Belgium(Wallonia)
n/a n/a
Belgium(Flanders)
Estimated 4288 GWh of final energy and 4581 GWh for primaryenergy saved by 2020.
Bulgaria n/a n/a
Croatia Targeted 80% reduction of GHG emissions in buildings for ofnational building stock by 2050.
Cyprus n/a n/a
CzechRepublic
Estimated 77 PJ saving of energy (45% reduction compared tocurrent consumption) for heating in residentialbuildings.
Denmark Estimated 35% reduction in net energy consumption for heatingand hot water in the building stock by 2050, comparedto 2011.
Estonia Targeted 3.5 PJ/y energy savings the building sector to beachieved by 2016.
Finland Estimated -8% energy consumption by 2020, -37% by 2050 (-8115 GWh by 2020, -36889 GWh by 2050).
France Targeted 38% reduction of energy consumption of buildings by2020 AND 400.000 dwellings per year should be energy-renovated starting from 2013.
Germany Estimated 337 PJ/year energy savings for period 2008-2020.
Gibraltar Estimated 6.7 GWh of primary energy saved by 2020 and 88.8GWh by 2050.
Greece Targeted At least 80% of the existing building stock renovated by2050.
Hungary Targeted 49PJ/y primary energy saving for the building sector at2020.
Ireland Targeted A nearly-zero emissions building sector by 2050; %33reduction of energy usage in the public sector by 2020.
Italy Targeted;Estimated
4.9 Mtoe/y final energy savings of the building sector by2020 (3.67 Mtoe/y in the residential sector, 1.23 Mtoe/yin service sector) have been targeted; it is estimatedthat this could lead to a 24% reduction of primary
157 Data was not available for: Belgium (Wallonia region and BCR), Bulgaria, Cyprus, Luxembourg, Malta, Poland,Portugal, Romania, Spain, United Kingdom.

Boosting Building Renovation: What potential and value for Europe?
PE 587.326 57
MemberState
Target/Estimation
Energy savings
energy consumption in comparison with the business asusual scenario.
Latvia Targeted;Estimated
50% reduction of consumption of thermal energy forheating against the current indicator is the target to beachieved by 2030. It is estimated that by renovating 3%of State owned and used building areas each year, 186GWh energy savings could be achieved over the period2014–2020.
Lithuania Targeted At least 500 GWh of thermal energy to be saved (i.e. forspace heating) by 2020.
Luxembourg n/a n/a
Malta n/a n/a
Netherlands Targeted 300,000 existing buildings per year to improve by atleast two energy label steps; Average social rentalproperty to achieve label B; 80% of private rental toachieve minimum label C by 2020; At least an averageenergy label A for buildings by 2030.
Poland n/a n/a
Portugal n/a n/a
Romania n/a n/a
Slovakia Estimated 6928.6 GWh energy savings up to 2030.
Slovenia Targeted At least 16% final energy consumption in buildingdecreased by 2020; 30% by 2030 (compared to 2005);almost carbon-free energy use in the building sector by2050.
Spain n/a n/a
Sweden Estimated 12-25% reduction of final energy consumption forheating and domestic hot water (DHW) in buildings.
UnitedKingdom
n/a n/a
Source: Adapted from Castellazzi L., Zangheri P., Paci D., 2016. Synthesis Report on the assessment of MemberStates' building renovation strategies.

Policy Policy Department A: Economic and Scientific Policy
58 PE 587.326
Annex E. A selection of policy measures in EU Member StatesThis annex describes the following policy measures:
Denmark – EEOS successful in increasing energy efficieny and generating energysavings
Slovakia – MunSEFF II: The Municipal Sustainable Energy Financing Facility Spain – Complying with the EED through Alternative Measures instead of EEOS Belgian grants in Brussels Region for energy efficiency in buildings Italy and France - Tax credit Germany - The KfW’s programmes Finland - The Energy Audit Programme The Netherlands – The Dutch Covenant on Energy Saving in the Rental Sector The United Kingdom (England and Wales) – Private Rented Sector Regulations France – Habiter Mieux (Living Better) Programme
E.1 Denmark – EEOS successful in increasing energy efficiency and generating energysavings
The Danish EEOS consists of voluntary agreements negotiated between the Danish EnergyAgency and the energy utilities.158
The country started to develop its EEOS in the 1990s with electricity distribution companiesand the scheme was eventually expanded to include natural gas suppliers (2004) and oil anddistrict heating companies (2006).159 The scheme sets an energy efficiency target for thedifferent industries, in relation to their yearly sales of energy. The companies that are obligedto take part are distribution companies for electricity, natural gas, district heating and oil(there are three gas companies, six oil companies, 74 electricity companies and 417 districtheating companies).160
As can be seen from Figure 13 there has been an overachievement of the target every yearsince the implementation of quantified targets and requirement to document the realisationsin 2006, except for 2013.
The Danish obligations under the energy policy agreement are considerably higher thanrequired by the Directive. In 2013 and 2014, the annual target for the Danish energyefficiency obligation was 10.7 PJ, corresponding to 2.6% of energy end use, which for theperiod 2015-2020 was raised to an annual target of 12.2 PJ, corresponding to around 3.0%of energy end use.161
158 EP, 2016. Implementation of the Energy Efficiency Directive (2012/27/EU): Energy Efficiency ObligationSchemes. European Implementation Assessment.
159 EP, 2016. Implementation of the Energy Efficiency Directive (2012/27/EU): Energy Efficiency ObligationSchemes. European Implementation Assessment.
160 ENSPOL, 2015. Energy Saving Policies and Energy Efficiency Obligation Scheme, D2.1.1: Report on existing andplanned EEOS in the EU – Part I: Evaluation of existing schemes.
161 https://ec.europa.eu/energy/sites/ener/files/documents/2014_neeap_en_denmark.pdf.

Boosting Building Renovation: What potential and value for Europe?
PE 587.326 59
Figure 13: Total annual total energy saving per sector compared to targets DK
Source: Danish Energy Agency
The following figure indicates the costs of the EEOS for each obligated sector (in 2013) andcompares it to the target. In addition, the administrative cost paid by the Danish EnergyAgency amounts to approximately EUR 540,000 annually.
Table 19: Total cost and energy savings in each obligated sector in 2013
Source: Danish Energy /regulatory Authority
E.2 Slovakia – MunSEFF II: The Municipal Sustainable Energy Financing Facility 162
The Municipal Sustainable Energy Financing Facility (MunSEFF) was an initiativelaunched by the European Bank for Reconstruction and Development (EBRD) and theEuropean Commission to develop and stimulate commercial bank financing to municipalitiesand their utility companies in Slovakia. The programme, designed to run between 2007 and2010, aimed at stimulating implementation of energy efficient renovation of municipalinfrastructure. As such, eligible sub-borrowers for MunSEFF II were municipalities, housingassociations, public or private companies providing municipal services, and Energy Service
162 http://www.munseff.eu/en/index.html.
Policy Policy Department A: Economic and Scientific Policy
60 PE 587.326
Companies (ESCOs) implementing energy efficiency investments in co-operation with oneor more municipalities.
Given the increased demand for support, the EBRD launched the second phase of the Facility,MunSEFF II, designed to reach an even larger variety of municipal projects. The second phaserun until December 2015.
During its course, MunSEFF supported 403 projects, including energy efficiencyimprovements in 114 municipal buildings, 219 residential buildings and 70 municipalinfrastructure projects. The total loan amount reached about EUR 84.5 million with the totalinvestment costs of more than EUR 92.5 million. The programme was supported by an EUgrant of EUR 21.3 million used for investment incentives and the provision of technicalassistance to its partner banks and sub-borrowers. Projects financed under MunSEFF will leadto annual primary energy savings of 79 GWh - equivalent to the household electricityconsumption of the Slovak city of Trnava with about 70,000 inhabitants - and annualgreenhouse gas emission reductions of 15,000 tonnes of CO2 equivalent.
E.3 Spain – Complying with the EED through Alternative Measures instead of EEOSSpain has opted for so-called Alternative Measures instead of EEOS, as the latter facedresistance from industry including fuel product suppliers and some utilities, whichstakeholders have described as being oligopolistic and influential.163 However, EEOS areplanned to be implemented in the near future.
One main Alternative Measure adopted to comply with the EED has been the NationalEnergy Efficiency Fund (Fondo Nacional de Eficiencia Energetica – FNEE), set up as analternative to taxes and standards. The FNEE is a simple fund that subsidises projects forsectors and regions regarding energy efficiency measures mainly in housing and non-residential buildings. The fund is financed by energy providers based on the calculation ofthe estimated costs for each of them to reach a 1.5% net reduction in energy sales. Fundingfrom FNEE can also be used with EU Structural and Investement Funds to co-financemeasures, which means that much of the FNEE is then managed by the autonomouscommunities, which are in charge of the Structural Funds. The fund has faced criticism,because it has been unable to disburse the funds effectively and has partially been capturedby vested interests.
163 EP, 2016. Implementation of the Energy Efficiency Directive (2012/27/EU): Energy Efficiency ObligationSchemes. European Implementation Assessment.

Boosting Building Renovation: What potential and value for Europe?
PE 587.326 61
E.4 Belgium (Brussels Region) – Grants for energy efficiency in buildings
The program Exemplary Buildings (BâtimentsExemplaires)164 ran from May 2007 until December2014 in the Brussels Region in Belgium. It is regared as a successstory regarding the implementation of the EPBD in Europe165. Theprogramme consisted of a multi-annual demonstration programrelated to energy and buildings and was managed by BruxellesEnvironnement – Leefmilieu Brussel, an institution which providescitizens with information and assistance with all financialsubsidies available for citizens of of Brussels wishing to renovatetheir buildings. Within this program, funds were awarded for theconstruction or renovation of buildings that are at the forefront interms of energy and environmental performance. This resulted inaround over 90 public and private renovation projects to (moreor less) passive building standards.
At present, as a continuation to BâtimentsExemplaires, ‘Be.Exemplary’166, a new call forinnovative and ambitious projects of exemplarybuildings has been issued by the regionalgovernment in Brussels. Be.Exemplary is open to allbuilding owners who build or renovate in Brussels:individuals, public, parastatal and private companiesinstitutions powers (developers, businesses, non-profit organisations, etc.).
Another exemplary policy measure in the Brussels Region is the energy managementprogramme PLAGE ("Plan Local d'Action pour la Gestion Énergétique"). The Plan,which started in 2005, originally targeted real estate owners or occupants with buildingscovering more than 100,000 m2 overall, obliging them to reduce their energy consumptionby implementing energy management measures. The size threshold was later lowered to50,000 m2. Energy efficiency targets are also being set for public actors by a decreecurrently under implementation. The targets correspond to a 10% reduction of the annualenergy consumption that will have to be achieved in four years.167
E.5 Italy and France - Tax credit168
Tax credit for energy efficiency improvement in Italy’s residential sectorItaly provides a tax credit equivalent to 65% of the total expenditure (up to EUR 100,000per project) for energy efficiency improvement measures in residential buildings. It covers alist of individual measures (including insulation, window replacement, condensing gas boilers
164 http://www.environnement.brussels/thematiques/batiment/sinspirer-des-batiments-exemplaires.165 http://www.epbd-ca.eu/outcomes/2011-2015/CA3-2016-National-BELGIUM-Brussels-web.pdf.166 http://www.beexemplary.brussels/.167 Castellazzi L., Zangheri P., Paci D., 2016. Synthesis Report on the assessment of Member States' building
renovation strategies168 JRC, 2014. Financing building energy renovations: current experiences & ways forward
Figure 14: BâtimentsExemplaires programme poster
Figure 15: Be.Exemplaryprogramme logo

Policy Policy Department A: Economic and Scientific Policy
62 PE 587.326
and heat pumps) and also offers the option of a comprehensive retrofit package (whichrequires a 20% minimum reduction in primary energy demand for heating).
The total costs (public and private) of the Italian scheme were estimated to be 13 eurocents/kWh of saved energy. The total investment was EUR 15.5 billion (2007-2011) with atax expenditure of around EUR 8.5 billion for the same period. According to the ex-postassessment, it led to energy savings of 7,700 GWh/year.
Sustainable Development tax credit in FranceThis income tax credit is applicable to several energy efficiency measures, energy efficientproducts and also to the realisation of an energy performance diagnosis (i.e. survey). Thelevel of support ranges from 10-32% depending on the measure, with the maximum amountdetermined by the number of inhabitants.169 This can be declared over a period of 5consecutive years. The programme reached 1.3 million households in 2010 with a totalinvestment of EUR 11 billion and expected energy savings of 6,630 GWh/year.
E.6 Germany - The KfW’s programmes170
The KfW’s programmes provide owners with subsidies, including loans with low interestrates and long durations, thus lowering investment costs for energy efficient renovations.171
280,000 flats were renovated per year between 2006 and 2010 leading to annual energysavings of 2.1 TWh and emissions reductions of 750 kton CO2. The average annual publicbudget contribution was 10% of the total investment of EUR 14 billion. In 2011 it was EUR0.95 million of the total EUR 18 billion investment costs.
Direct benefits are energy savings of 1.25 TWh per year and indirect benefits include 251000 person years of additional employment.
E.7 Finland - The Energy Audit Programme172
In Finland, an Energy Audit Programme (EAP) has been in place since 1992. It is a voluntaryprogramme for industry where the Ministry of Employment and Economy provides a 40-50%subsidy (participants cover the remaining costs). The programme is run by Motiva Oy, a stateowned company, whose responsibilities include: promotion of audit activities, developmentof auditing models, monitoring, training of energy auditors and the quality assurance ofaudits. The audits themselves are mainly carried out by private consulting companies.
Between 1992 and 2007 it covered almost 40% of the building stock.173 By the end of 2011,virtually all energy use in industry had been audited at least once.
Impact on energy and emissions: The average savings potentials between 1995and 2011, in non-intensive industry were 18% in heat and fuels, 6% in electricityand 7% in water consumption. For the energy intensive industry these figures weremuch lower. The installation rate of the proposed measures is approximately 70% inthe service sector and 55% in industry. This translated into annual savings of EUR78 million, or 2.8 TWh in industry by the end of 2011. Cumulative savings from theprogramme since 1992 up to 2011 were about EUR 360 million of which 70% came
169 8,000 euro for a single person; 16,000 euro for a couple (with additional 400 euro per dependant) and 8,000euro per dwelling unit for a landlord (maximum 3 units).
170 IEEP, 2013. Review of costs and benefits of energy and savings.171 EUPOPP, 2010. Impact Assessment Paper-Minimum energy performance standards for buildings in Germany.172 JRC, 2014. Financing building energy renovations: current experiences & ways forward.173 Maio et al., 2012. Cited in IEEP, 2013. Review of costs and benefits of energy and savings.

Boosting Building Renovation: What potential and value for Europe?
PE 587.326 63
from industry.174 For end users the result of the EAP is an annual return, with theratio between return and energy savings in the range of 0.9-1.1 €/GJ.
Estimated costs for government: Government support between 1992-2011reached EUR 31,5 million, with the total cost of audits being EUR 72 million. A 2006evaluation stated that cost efficiency for government, as a ratio between costs andenergy savings (including free rider effect), is 0.09-0.11 €/GJ without costs for theVA scheme or 0.15-0.18 €/GJ, including these costs.
E.8 The Netherlands – The Dutch Covenant on Energy Saving in the Rental Sector175
A number of housing corporations in the Netherlands have set up a voluntary agreement,committing to reach a certain energy performance level (B rating on average) in their buildingstock by 2020. The covenant is expected to cover almost 2 million properties. Between 2011and 2013 it led to a 20% reduction in gas consumption and a 4% reduction in electricityconsumption. The housing corporations are expected to cover all costs, but may requestsupport from the government for research and technical assistance.
The details of the agreement are as follows. By 2020, for all rental properties in the Aedes(association of housing corporations in the Netherlands) and Woonbond (National associationof tenants and home seekers) stock (total available rental housing of housing corporations),the target is that an average energy index of 1.25 (average energy label B) should beachieved. This is in line with the target of a 33% reduction in energy consumption in existingsocial housing in the period of 2008-2020 (from article 1 of the Covenant). By 2020, 80% ofrental properties in the Vastgoed Belang (association of private property owners) stockshould achieve an energy label of C or better (from article 1). The backstop date for allbuildings to meet these minimum standards is 31 December 2020.
The Dutch Ministry of Interior Affairs and Kingdom Relations has committed to providingfinancial assistance for some of the activities required to deliver this covenant176, as well asproviding favourable interest rates on loans and committing that 5-10% of the EuropeanRegional Development Fund (ERDF) will be allocated towards these renovations. The Ministryis also using an innovative scheme called Energiesprong (Energy Leap) to provide additionaladvice on how to best stimulate energy efficiency investments in rental buildings, using billsavings to fund retrofits, thereby ensuring no additional costs to tenants. The scheme isfocused on social housing and aims to fund the investments in retrofit through bill savings,ensuring no net additional cost to tenants. Houses are renovated to the point where theybecome (almost) energy neutral and there are no longer energy bills for the tenants. Insteadof paying their energy bills, tenants pay a similar amount to the housing associations, inorder that they recover their investment. Using this money, the corporations pay buildingcompanies to retrofit the houses cost-effectively. (The necessary upfront capital comes fromthe WSW social bank, which has provided EUR 6 billion to underwrite government-backed40-year loans to housing associations). Key to the scheme is that it is an area-basedapproach, using retrofit technology that can be introduced rapidly. A government contractwill see 111,000 homes retrofitted, equivalent to an investment of EUR 6 billion.
Some results of this initiative are: CO2 reduction/m2 2011-2013: 15.6% Gas consumption reduction/m2 2011-2013: 19.4%
174 Maio et al., 2012. Cited IEEP, 2013. Review of costs and benefits of energy and savings.175 Dutch Ministry of Interior Affairs and Kingdom Relations (2012). Convenant Energiebesparing Huursector 28 juni
2012.176 Dutch Ministry of Interior Affairs and Kingdom Relations (2012). Convenant Energiebesparing Huursector 28 juni
2012.

Policy Policy Department A: Economic and Scientific Policy
64 PE 587.326
Electricity consumption reduction/m2 2011-2013: 4.3% Heating consumption increase/m2 2011-2013: 0.3%
E.9 The United Kingdom (England and Wales) – Private rented sector regulationsIn England and Wales Minimum energy standard for rentals have been introduced. The aimis that all buildings in the private rental sector with an EPC rating of F or G are improved toan EPC Rating E. The policy has a ‘soft start’: Landlords only have to comply after 1st April2018 upon tenancy renewal, or once a new tenant moves in. Also, landlords will have theopportunity to make use of one or a combination of: 1) taking out a Green Deal (subject tomeeting the ‘Golden Rule’); 2) using Energy Company Obligation (ECO) funding whereavailable; 3) obtaining a local or central Government grant.177
The major benefits of this policy are energy savings, followed by comfort and air qualitybenefits. The policy will also contribute to alleviating fuel poverty and supporting job creationin the green construction sector. The main benefits and costs are associated with F and Grated properties moving to an E rating. There are also costs associated with understandingthe new regulations, as well as costs met by local authorities for having to regulate this newlaw. The Green Deal (until 2015) and other funding options served to reduce upfront capitalcosts for landlords. Landlords may also be able to pass on some of their costs onto tenantsthrough marginally higher rent charges, depending on local market conditions. Landlordsmust undertake those measures that meet the Green Deal Golden Rule (i.e. repaymentsmust not be any larger than the expected energy bill savings taking into account any fundingavailable from Green Deal Finance, ECO or grant source). To do this, they would first obtaina domestic Green Deal Assessment which would set out a recommended package ofimprovements for the property, including their expected bill savings.
The UK government’s impact assessment of the approach calculated the following economic,environmental and social impacts:
Economic impacts: Total costs are estimated to be around £2.4bn, and an overall anet benefit of around £2.0bn is predicted. Penalties for failing to comply with thepolicy. Penalties for a single offence (e.g. failing to meet the backstop date) may becumulative up to a maximum of £5,000.
Environmental impacts: 6.6 million tonnes of CO2 equivalent change in greenhousegas emissions traded (5.0 non-traded).
Social impacts: By increasing the internal temperature of the buildings with theworst energy ratings in the rental sector, tenants will be less likely to fall ill andthose with long term sickness may find the higher temperatures will be beneficial fortheir illness.
E.10 France – Habiter Mieux (Living Better) ProgrammeHabiter Mieux178 is a seven-year fuel poverty funding programme (started in 2010) of thenational agency of housing (L'Agence nationale de l'habitat (Anah) for rental property. Itaims to complement existing financial incentives for energy renovations and to specificallytarget low/medium-income households (to fight energy poverty).
Its main design aspects are:
177https://www.gov.uk/government/uploads/system/uploads/attachment_data/file/335073/Consultation_Stage_Impact_Assessment_for_the_PRS_Regulations.pdf.
178 http://www.anah.fr/proprietaires/proprietaires-occupants/etre-mieux-chauffe/.

Boosting Building Renovation: What potential and value for Europe?
PE 587.326 65
50% coverage of the renovation works (Anah aids max EUR 10,000) if low income,35% if middle income (max EUR 7,000 aid).
A support of EUR 1,600 to 3,000 ecological solidarity grant + Anah grants (incomeceiling up to EUR 20,000).
The tenant has not benefited from an interest-free loan (Prêt à Taux Zero - PTZ) forthe previous 5 years.
Although initially designed for low income rental housing only (2010), in 2013 the scope wasextended to include co-owners and non-occupant owners and lifted the resource ceiling upto the median income. The target set was to renovate 300,000 households (older than 15years) by 2017 achieving an average of 38% efficiency gains after renovations (beyond the25% imposed threshold).
Other measures that go alongside this include Minimum Energy Performance Standards whichare set at low energy consumption levels. Enforcement is through voluntary certification andfinancial support schemes (such as the Habiter Mieux programme). There are grants, interestfree mortgages and tax breaks available for energy conservation measures, which aredescribed in the guide to Home Energy Conservation in France.
The rules do not always require a specific level of energy performance to be achieved, notablywith some of the tax credits that are available, although in all cases there are rules on thestandard of performance of the materials and equipment to be used. In other cases, there isa general requirement to have an energy performance audit undertaken, with an assessmentof the anticipated benefits of the work.
Results from impact assessments:179
Economic impacts: In 2010-2013 grants were primarily given to households in ruralareas who were also owners. Even after receiving the grants 37% of very modestincome households and 49% of modest income households still have more than EUR5,000 to contribute to financing renovations.
Social impacts: Only 50,000 renovations were funded in 2010-2014 (against atarget of 300,000 by 2017). Due to the extension of the scope in 2013, 46% of alllandlords became eligible. This extension of the scheme has diverted most of thefunds towards middle-class households to the detriment of the lowest-incomehouseholds.
Environmental impacts: Energy efficiency gains of 38% after renovations (beyondthe 25% imposed threshold). However, stakeholders point out that in the absence offurther obligations, renovations often result in the improvement of one singleappliance or structure, without overall household energy efficiency gains.
179 Insight-E, 2015. Energy poverty and vulnerable consumers in the energy sector: analysis of policies andmeasures.

Policy Policy Department A: Economic and Scientific Policy
66 PE 587.326
NOTES


