boston foundation, inc./media/tbforg/files/financial... · management ’s responsibility ......
TRANSCRIPT

BOSTON FOUNDATION, INC.
Consolidated Financial Statements
June 30, 2014 and 2013
(With Independent Auditors’ Report Thereon)

Independent Auditors’ Report
The Board of Directors
Boston Foundation, Inc.:
We have audited the accompanying consolidated financial statements of Boston Foundation, Inc. and its
affiliates, which comprise the consolidated statements of financial position as of June 30, 2014 and 2013,
the related consolidated statements of activities and cash flows for the years then ended, and the related
notes to the consolidated financial statements.
Management’s Responsibility for the Consolidated Financial Statements
Management is responsible for the preparation and fair presentation of these consolidated financial
statements in accordance with U.S. generally accepted accounting principles; this includes the design,
implementation, and maintenance of internal control relevant to the preparation and fair presentation of
consolidated financial statements that are free from material misstatement, whether due to fraud or error.
Auditors’ Responsibility
Our responsibility is to express an opinion on these consolidated financial statements based on our audits.
We conducted our audits in accordance with auditing standards generally accepted in the United States of
America. Those standards require that we plan and perform the audit to obtain reasonable assurance about
whether the consolidated financial statements are free from material misstatement.
An audit involves performing procedures to obtain audit evidence about the amounts and disclosures in the
consolidated financial statements. The procedures selected depend on the auditors’ judgment, including the
assessment of the risks of material misstatement of the consolidated financial statements, whether due to
fraud or error. In making those risk assessments, the auditor considers internal control relevant to the
entity’s preparation and fair presentation of the consolidated financial statements in order to design audit
procedures that are appropriate in the circumstances, but not for the purpose of expressing an opinion on
the effectiveness of the entity’s internal control. Accordingly, we express no such opinion. An audit also
includes evaluating the appropriateness of accounting policies used and the reasonableness of significant
accounting estimates made by management, as well as evaluating the overall presentation of the
consolidated financial statements.
We believe that the audit evidence we have obtained is sufficient and appropriate to provide a basis for our
audit opinion.
KPMG LLP Two Financial Center 60 South Street Boston, MA 02111
KPMG LLP is a Delaware limited liability partnership, the U.S. member firm of KPMG International Cooperative (“KPMG International”), a Swiss entity.

2
Opinion
In our opinion, the consolidated financial statements referred to above present fairly, in all material
respects, the financial position of Boston Foundation, Inc. and its affiliates as of June 30, 2014 and 2013,
and the changes in their net assets and their cash flows for the years then ended in accordance with
U.S. generally accepted accounting principles.
December 18, 2014

3
BOSTON FOUNDATION, INC.
Consolidated Statements of Financial Position
June 30, 2014 and 2013
(Dollars in thousands)
Assets 2014 2013
Cash and cash equivalents $ 24,717 26,658 Program-related receivables and other assets 5,908 8,684 Contributions receivable, net 518 456 Investments, at fair value 971,648 859,227 Noncash donations held for sale 479 619 Fixed assets, net 424 572
Total assets $ 1,003,694 896,216
Liabilities and Net Assets
Liabilities:Accounts payable and accrued liabilities $ 6,486 6,803 Grants payable 9,267 11,966
Total liabilities 15,753 18,769
Net assets:Unrestricted 524,781 454,833 Temporarily restricted 241,158 205,925 Permanently restricted 222,002 216,689
Total net assets 987,941 877,447 Total liabilities and net assets $ 1,003,694 896,216
See accompanying notes to consolidated financial statements.

4
BOSTON FOUNDATION, INC.
Consolidated Statement of Activities
Year ended June 30, 2014
(Dollars in thousands)
Temporarily PermanentlyUnrestricted restricted restricted Total
Revenues and investment activity:Contributions $ 106,387 106 5,398 111,891 Service fees 1,954 — — 1,954 Interest and dividends, net of fees 2,870 2,734 — 5,604 Unrealized and realized net
gains on investmentsand trusts 63,071 59,987 — 123,058
Reclassification of net assets 85 — (85) — Net assets released from
restrictions 27,594 (27,594) — —
Total revenues andinvestment activity 201,961 35,233 5,313 242,507
Expenses:Grants 110,566 — — 110,566 Change in split-interest trusts 310 — — 310 Program support 6,651 — — 6,651
Operating expenses:Grantmaking and civic
leadership 3,284 — — 3,284 Development and donor
services 4,253 — — 4,253 Finance and administration 6,949 — — 6,949
Total operatingexpenses 14,486 — — 14,486
Total expenses 132,013 — — 132,013
Change in net assets 69,948 35,233 5,313 110,494
Net assets, beginning of year 454,833 205,925 216,689 877,447 Net assets, end of year $ 524,781 241,158 222,002 987,941
See accompanying notes to consolidated financial statements.

5
BOSTON FOUNDATION, INC.
Consolidated Statement of Activities
Year ended June 30, 2013
(Dollars in thousands)
Temporarily PermanentlyUnrestricted restricted restricted Total
Revenues and investment activity:Contributions $ 122,842 5,972 1,668 130,482 Service fees 1,801 — — 1,801 Interest and dividends, net of fees 7,075 3,730 — 10,805 Unrealized and realized net
losses on investmentsand trusts 28,917 36,380 — 65,297
Reclassification of net assets 2,242 205 (2,447) — Net assets released from
restrictions 35,274 (35,274) — —
Total revenues andinvestment activity 198,151 11,013 (779) 208,385
Expenses:Grants 105,365 — — 105,365 Change in split-interest trusts (546) — — (546) Program support 6,227 — — 6,227
Operating expenses:Grantmaking and civic
leadership 3,254 — — 3,254 Development and donor
services 3,751 — — 3,751 Finance and administration 6,998 — — 6,998
Total operatingexpenses 14,003 — — 14,003
Total expenses 125,049 — — 125,049
Change in net assets 73,102 11,013 (779) 83,336
Net assets, beginning of year 381,731 194,912 217,468 794,111 Net assets, end of year $ 454,833 205,925 216,689 877,447
See accompanying notes to consolidated financial statements.

6
BOSTON FOUNDATION, INC.
Consolidated Statements of Cash Flows
Years ended June 30, 2014 and 2013
(Dollars in thousands)
2014 2013
Cash flows from operating activities:Cash received from contributions and service fees $ 108,156 131,143 Interest and dividends received, net of fees 5,604 10,805 Annuity and beneficiary payments (192) (629) Grants paid (112,214) (96,955) Cash paid:
For program expenses (6,651) (6,677) To employees and suppliers (14,529) (13,559)
Net cash (used in) provided by operating activities (19,826) 24,128
Cash flows from investing activities:Proceeds from sales of investments 129,099 175,646 Purchases of investments (116,155) (204,305) Purchases of equipment (62) (276)
Net cash provided by (used in) investing activities 12,882 (28,935)
Cash flows from financing activities:Contributions to permanently restricted funds 5,313 1,668 Other changes in annuity and beneficiary payables (310) 546
Net cash provided by financing activities 5,003 2,214
Net change in cash and cash equivalents (1,941) (2,593)
Cash and cash equivalents, beginning of year 26,658 29,251 Cash and cash equivalents, end of year $ 24,717 26,658
Reconciliation of change in net assets to net cash used in operating activities:Change in net assets $ 110,494 83,336 Adjustments to reconcile change in net assets to net cash used in
operating activities:Depreciation 209 133 Change in annuity and beneficiary payables (192) (629) Change in contributions receivable, net (62) (120) Changes in other assets and liabilities, net (1,904) 8,373 Contributions restricted for long-term investment (5,313) (1,668) Unrealized and realized net (gains) losses on investments and trusts (123,058) (65,297)
Net cash (used in) provided by operating activities $ (19,826) 24,128
See accompanying notes to consolidated financial statements.

BOSTON FOUNDATION, INC.
Notes to Consolidated Financial Statements
June 30, 2014 and 2013
7 (Continued)
(1) Description of the Boston Foundation
(a) Organization
Founded in 1915, the Boston Foundation, Inc. (the Foundation) is one of the nation’s oldest and
largest community foundations – a major grantmaker, partner in philanthropy, provider of
information, and civic leader addressing Greater Boston’s most pressing challenges.
The Foundation is a tax-exempt organization as described in Section 501(c)(3) of the Internal
Revenue Code (the Code) and is generally exempt from income taxes pursuant to Section 501(a) of
the Code and qualifies as a public charity under Section 170(b)(1)(A)(vi) of the Code.
The Foundation has not taken any tax positions which would have a material effect, individually or
in the aggregate, upon the Foundation’s financial statements. The Foundation believes it has not
taken any significant uncertain tax positions or any tax positions that would jeopardize the
Foundation’s tax-exempt status.
Effective January 1, 2012, The Philanthropic Initiative, Inc. merged with the Foundation, with the
Foundation continuing as the surviving corporation.
(b) Activity
As Greater Boston’s community foundation, the Foundation devotes its resources to building and
sustaining a vital and prosperous city and region, where justice and opportunity are extended to
everyone. The Foundation’s primary purposes are threefold: to make charitable grants to qualified
recipients; to assist donors with their philanthropic goals; and to be a civic leader, convener, and
information provider in the Boston community. The Foundation receives support directly from the
public. Due to the generosity of donors, the Foundation is able to serve as a major grantmaker in
Greater Boston, supporting hundreds of not-for-profit organizations that are helping to build a strong
and healthy community.
(2) Summary of Significant Accounting Policies
(a) Basis of Presentation
The accompanying consolidated financial statements, which are presented on the accrual basis of
accounting in accordance with U.S. generally accepted accounting principles (GAAP), have been
prepared to focus on the Foundation as a whole and to present balances and transactions according to
the existence or absence of donor-imposed restrictions. The consolidated financial statements include
the accounts of the Foundation and those of its affiliated supporting organizations, which are also
501(c)(3) exempt organizations. The total net assets of the supporting organizations were $20,241
and $17,761 as of June 30, 2014 and 2013, respectively. Inter-organizational transactions and
balances have been eliminated.
(b) Use of Estimates
The preparation of financial statements in conformity with GAAP requires management to make
estimates and assumptions that affect the reported amounts of assets and liabilities, and disclosure of
contingent assets and liabilities, as of the dates of the consolidated financial statements and the

BOSTON FOUNDATION, INC.
Notes to Consolidated Financial Statements
June 30, 2014 and 2013
8 (Continued)
reported amounts of revenue and expenses during the reporting periods. Actual results could differ
from those estimates.
(c) Classification of Net Assets
The Foundation reports information regarding its financial position and activities in three classes of
net assets based upon the existence or absence of donor-imposed restrictions, as follows:
Unrestricted net assets have no donor-imposed or legal stipulations as to their use. Unrestricted
net assets include donor-advised funds.
Temporarily restricted net assets contain donor-imposed stipulations as to the timing of their
availability or use for a particular purpose. These net assets are released from restrictions when
the specified time elapses or actions have been taken to meet the restrictions.
Permanently restricted net assets have donor-imposed stipulations that neither expire with the
passage of time nor can be removed by actions of the Foundation and consist primarily of the
historic dollar value of gifts to establish or add to the Foundation’s donor-restricted endowment
funds. Net assets of such funds in excess of their historic dollar value are classified as
temporarily restricted net assets until appropriated by the Board of Directors (the Board) and
spent in accordance with the standard of prudence imposed by state law.
The Articles of Organization of the Foundation include a variance power provision, which gives the
Board the power to modify any restriction or condition placed on gifts, if in its sole judgment the
Board determines that the restriction becomes, in effect, incapable of fulfillment due to the changing
needs of the community. During 2014, a fund previously classified as permanently restricted was
reclassified as unrestricted due to the release of restrictions previously imposed by the donor. During
2013, the Board utilized variance power to 1) grant out the balance of an advised fund to a
not-for-profit organization, and 2) select a new eligible beneficiary for the annual distributions from
a permanently restricted fund when the current named beneficiary became no longer eligible.
(d) Spending Policy
Generally, the Foundation manages its funds using a total return concept, which emphasizes total
investment return, including interest and dividends and realized and unrealized gains and losses.
Annually the Foundation’s Board determines the level of grantmaking based on two factors that
serve to stabilize annual spending levels and preserve the real value of the endowment over time. In
fiscal years 2014 and 2013, those factors are 70% of the prior year’s spending, adjusted for inflation,
plus 30% of a spending rate applied to the estimated fair value of its endowment. The discretionary
endowment is made up of funds with no restrictions placed on the way income may be used. The
designated endowment is composed of funds created for specifically named agencies or projects. The
spending policy rates were as follows:

BOSTON FOUNDATION, INC.
Notes to Consolidated Financial Statements
June 30, 2014 and 2013
9 (Continued)
2014 2013
Discretionary endowment 6.4% 6.4%Designated endowment 5.0 5.4Endowed donor advised funds 5.4 5.4
For fiscal year 2015, the Board of Directors has approved the spending policy rate of 6.4% for its
discretionary endowment and 5.0% for designated endowments and endowed donor advised funds.
(e) Investments
The investment goal of the Foundation is to invest its assets in a manner that will achieve a total rate
of return sufficient to replace the assets spent for grants and expenses and recoup any value lost due
to inflation. To manage risk, the Foundation strives to diversify its investments among various
financial instruments and asset categories and uses multiple investment strategies and managers. Key
investment decisions are made by the Board’s Investment Committee, which has oversight
responsibility for the Foundation’s investment program. The Foundation’s portfolio is mostly
managed by outside investment managers.
Investments are reported at estimated fair value. If an investment is held directly by the Foundation
and an active market with quoted prices exists, the Foundation reports the fair value as the market
price of an identical security. Shares in mutual funds are based on share values reported by the funds
as of the last business day of the fiscal year. The Foundation also holds shares or units in traditional
institutional funds as well as in alternative investment funds involving private equity, venture capital,
flexible capital, and real asset strategies. Flexible capital strategies involve funds whose managers
have the authority to invest in multiple asset classes at their discretion, including the ability to invest
long and short in the markets. Flexible capital funds may hold securities or other financial
instruments for which a ready market exists and are priced accordingly. In addition, such funds may
hold assets which require the estimation of fair values in the absence of readily determinable market
values. Private equity, venture capital, and real asset funds generally hold assets that require the
estimation of fair values in the absence of readily determinable market values. Because of the
inherent uncertainties of valuation, the fair values may differ significantly from the value that would
have been used had a ready market for the investment existed and the differences could be material.
Such valuations are determined by fund managers and generally consider variables such as operating
results, comparable earnings multiples, projected cash flows, recent sales prices, and other pertinent
information, and may reflect discounts for the illiquid nature of certain investments held.
The Foundation has applied GAAP, which permits the use of net asset value (NAV) or its equivalent
reported by each underlying alternative investment fund as a practical expedient to estimate the fair
value of the investment. The flexible capital investments are generally redeemable under the original
terms of the subscription agreements. However, it is possible that these redemption rights may be
restricted by the funds in the future in accordance with the underlying fund agreements, as
applicable. Changes in market conditions, the economic environment, or the funds’ liquidity
provisions may significantly impact the NAV of the funds, and consequently, the fair value of the
Foundation’s interest in such funds. Although certain investments may be sold in a secondary
market, the secondary market is not active and individual transactions are not necessarily observable;

BOSTON FOUNDATION, INC.
Notes to Consolidated Financial Statements
June 30, 2014 and 2013
10 (Continued)
therefore, it is possible that if the Foundation were to sell its interest in a fund in the secondary
market, the sale could occur at an amount materially different from the reported value. Other
alternative investments (private equity, venture capital, and real assets) are not redeemable; they are
liquidated over time as funds become available according to the terms of the partnership agreements.
Realized and unrealized investment gains or losses are determined by comparison of average asset
cost to net proceeds received at the time of disposition and comparison of the difference between
market values and average cost, respectively. Dividend and interest income is recognized when
earned.
(f) Cash and Cash Equivalents
Except for amounts included in the Foundation’s investment pools, the Foundation records liquid
investments purchased with remaining maturities of less than 90 days as cash equivalents.
(g) Contributions Receivable
Contributions receivable consist of unconditional promises to give that are expected to be collected
within one year.
(h) Fixed Assets
The Foundation capitalizes expenditures over $5 incurred to purchase office equipment, computer
systems, furniture, and leasehold improvements. Depreciation is recognized over the estimated
useful life of the assets, typically from three to five years, on a straight-line basis. Leasehold
improvements are amortized over the lesser of their useful lives or the remaining term of the lease.
(i) Grants Expense
The Foundation records grants as expenses when all conditions stipulated by the grant have been
substantially met by the grantee. Grants issued with future payment dates and without substantive
conditions are accrued and expensed when approved.
(j) Contributions and Bequests
Contributions, including unconditional promises from donors, are recorded as revenue when
received. Promises to give subject to donor-imposed stipulations that the corpus be maintained
permanently are shown as increases in permanently restricted net assets. Conditional promises to
give are not recognized until they become unconditional, that is, when the conditions on which they
depend are substantially met. Bequests generally are accrued as revenue when the respective will has
been admitted to probate and all appeal periods have expired. Contributions to be received after one
year are discounted at the appropriate rate commensurate with the risks and duration involved.
(k) Program Support
Program support consists primarily of additional expenses incurred related to individual programs or
programs in which the funding is shared by others. These expenses are separate and distinct from the
Foundation’s operating expenses. Examples of current programs are the Boston Indicators Project,
StreetSafe Boston, the Skillworks Initiative and Success Boston.

BOSTON FOUNDATION, INC.
Notes to Consolidated Financial Statements
June 30, 2014 and 2013
11 (Continued)
(l) Operating Expenses
Operating expenses include salaries and benefits, rent, and other overhead expenses that are incurred
in the operation of the Foundation overall and are not specifically attributable to a particular fund or
program. An administrative fee ranging from 0.5% to 1.2% of the net asset balance by fund is
charged to each donor advised, discretionary and designated fund to cover operating expenses. Fees
between 1% and 20% of contributions received by fund are charged to initiative and similar funds
depending upon the relative level of support provided by the Foundation’s operating resources. In
addition, certain specific operating expenses are charged against income earned on specific funds
prior to the time grants are paid. The Foundation also charges an investment support fee of 0.15% to
cover certain investment-related operating expenses.
(m) Disclosures about the Fair Value of Other Assets and Liabilities
The carrying values of the Foundation’s cash and cash equivalents, receivables, other assets,
accounts payable, and accrued liabilities approximated their fair values because they are stated at net
realizable value or have relatively short-term maturities.
(n) Fair Value
GAAP defines fair value and requires certain disclosures about fair value measurements. Fair value
represents the price that would be received upon the sale of an asset or paid upon the transfer of a
liability in an orderly transaction between market participants as of the measurement date. GAAP
also establishes a fair value hierarchy that prioritizes observable and unobservable inputs used to
measure fair value into three levels:
Level 1 – quoted prices (unadjusted) in active markets that are accessible at the measurement
date for assets or liabilities;
Level 2 – observable prices that are based on inputs not quoted in active markets, but
corroborated by market data; and
Level 3 – inputs are derived from valuation methodologies, including pricing models,
discounted cash flow models, and similar techniques, and are not based on market, exchange,
dealer, or broker-traded transactions. In addition, Level 3 valuations incorporate assumptions
and projections that are not observable in the market, and significant professional judgment is
required in determining the fair value assigned to such assets or liabilities.
The fair value hierarchy gives the highest priority to Level 1 inputs and the lowest priority to Level 3
inputs. In determining fair value, the Foundation utilizes valuation techniques that maximize the use
of observable inputs and minimize the use of unobservable inputs to the extent possible.
Most investments classified in Levels 2 and 3 consist of shares or units in investment funds as
opposed to direct interests in the funds’ underlying holdings, which may be marketable. Because the
NAV reported by each fund is used as a practical expedient to estimate the fair value of the
Foundation’s interest therein, its classification of Level 2 or 3 is based on the Foundation’s ability to
redeem its interest at or near the date of the statement of financial position as opposed to whether
valuation inputs are observable or unobservable. If the interest can be redeemed in the near term, the

BOSTON FOUNDATION, INC.
Notes to Consolidated Financial Statements
June 30, 2014 and 2013
12 (Continued)
investment is classified in Level 2. The classification of investments in the fair value hierarchy is not
necessarily an indication of the risk, liquidity, or degree of difficulty in estimating the fair value of
each investment’s underlying assets and liabilities.
(3) Program-Related Receivables and Other Assets
The Foundation invests a portion of its funds in projects that advance its philanthropic purposes by
providing loans, known as program-related “investments”, to certain not-for-profit organizations. At
June 30, 2014 and 2013, respectively, these loans, included in program-related receivables and other assets,
totaled $5,577 and $8,288 net of unamortized discounts of $1,246 and $535 and allowance for possible
losses of $275 and $453 in 2014 and 2013, respectively, with various repayment dates beginning in 2015
and ending in 2032.
In addition, the Foundation has a ten-year $2,500 loan guarantee expiring in 2016 for the purpose of
building or improving charter schools in the Massachusetts and a $3,000 loan guarantee expiring in 2031
for the purpose of reducing the cash-funded reserves in credit projects that have a first mortgage financing
from the Massachusetts Housing Partnership Fund Board. The Foundation's $2,500 loan guarantee serves
as a backup to guarantees made by other entities and the Foundation's $3,000 guarantee is matched by the
same amount from another foundation. As of June 30, 2014 and 2013, the Foundation's commitments have
not been drawn. The Foundation believes the estimated fair value of the guarantees and any potential
liability is not material.
(4) Investments
The Foundation maintains three investment pools as part of its Fund for the 21st Century for investing its
assets as follows:
Balanced Plus Pool – Approximately 45 investment management firms manage the assets in this
pool. Approximately 20% of this pool is allocated to private partnerships holding interests in private
equity, venture capital, real estate, timber, and energy. This asset mix is intended to produce the
highest long-term investment return. The Foundation invests its endowment assets in this pool.
Balanced Pool – Approximately 22 investment management firms manage the assets in this pool.
This pool does not include private partnerships, which use strategies that are generally expected to
yield higher returns over time, and accordingly, this asset allocation is expected to produce a slightly
lower investment return. Typically, donor advised funds desiring a higher allocation to fixed income
and limited exposure to illiquid investments are invested in this pool. This pool was established in
February 2011.
Short-Term Pool – This pool is invested in money market funds and U.S. Treasury bills with a
weighted average maturity of less than 60 days. Typically, donor advised funds intending to avoid
market exposure and to make grants in the near term are invested in this pool. This pool was
established in January 2010.

BOSTON FOUNDATION, INC.
Notes to Consolidated Financial Statements
June 30, 2014 and 2013
13 (Continued)
The following table summarizes the Foundation’s investments in the fair value hierarchy as of June 30,
2014:
Related
2014 Redemption Days’ unfunded
Level 1 Level 2 Level 3 Total or liquidation notice commitment
Balanced plus pool:
Global equities:
Developed markets index $ 108,833 — — 108,833 Daily 1 None
Developed markets 18,387 — — 18,387 Daily 4 None
Developed markets — 56,092 — 56,092 Monthly 30 None
Emerging markets — 31,885 — 31,885 Monthly 30 None
Emerging markets index — 60,723 — 60,723 Semi-monthly 3 None
Developed long/short — 90,953 — 90,953 Quarterly 60 None
Total 127,220 239,653 — 366,873
Flexible capital:
Multi-strategy — — 150,420 150,420 (1) N/A None
Diversified fund of funds — — 44,543 44,543 (1) N/A None
Credit opportunities — — 5,666 5,666 (1) N/A None
Total — — 200,629 200,629
Private equity and
venture capital (2): — — 82,550 82,550 Illiquid N/A $ 31,642
Real assets (3):
Real estate — — 20,207 20,207 Illiquid N/A 4,726
Timber — — 22,784 22,784 Illiquid N/A 277
Energy — — 25,362 25,362 Illiquid N/A 4,944
Total — — 68,353 68,353 $ 9,947
Fixed income:
Money market 30,586 — — 30,586 Daily 1 None
U.S. Treasuries 29,989 — — 29,989 Daily 1 None
U.S. TIPs (4) — 17,537 — 17,537 Daily 4 None
Global fixed income 7,100 — — 7,100 Daily 1 None
Global fixed income — 6,991 — 6,991 Monthly 30 None
Total 67,675 24,528 — 92,203
Total balanced
plus pool 194,895 264,181 351,532 810,608

BOSTON FOUNDATION, INC.
Notes to Consolidated Financial Statements
June 30, 2014 and 2013
14 (Continued)
Related
2014 Redemption Days’ unfunded
Level 1 Level 2 Level 3 Total or liquidation notice commitment
Balanced pool:
Global equities:
Developed markets index $ 6,278 — — 6,278 Daily 1 None
Developed markets 3,836 — — 3,836 Daily 4 None
Developed markets — 5,613 — 5,613 Monthly 30 None
Emerging markets — 1,839 — 1,839 Monthly 30 None
Emerging markets index — 3,503 — 3,503 Semi-monthly 3 None
Developed long/short — 5,247 — 5,247 Quarterly 60 None
Total 10,114 16,202 — 26,316
Flexible capital:
Multi-strategy — — 9,845 9,845 (1) N/A None
Diversified fund of funds — — 2,915 2,915 (1) N/A None
Credit opportunities — — 371 371 (1) N/A None
Total — — 13,131 13,131
Fixed income:
Money market 2,686 — — 2,686 Daily 1 None
U.S. Treasuries 6,997 — — 6,997 Daily 1 None
U.S. TIPs (4) — 2,078 — 2,078 Daily 4 None
Global fixed income 539 — — 539 Daily 1 None
Global fixed income — 530 — 530 Monthly 30 None
Total 10,222 2,608 — 12,830
Total balanced pool 20,336 18,810 13,131 52,277
Short-Term Pool:
Money market 2,458 — — 2,458 Daily 1 None
U.S. Treasuries 56,331 — — 56,331 Daily 1 None
Total short-term
pool 58,789 — — 58,789
Other investments:
Money market 332 — — 332 Daily 1 None
Developed global equities 21,263 — — 21,263 Daily 4 None
Global fixed income 8,678 — — 8,678 Daily 1 None
Global equity index — 5,048 — 5,048 Semi-monthly 3 None
Global fixed income — — 2,398 2,398 Illiquid N/A None
Developed global equities — — 4,499 4,499 Illiquid N/A None
Other private interests — — 7,756 7,756 Illiquid N/A None
Total other
investments 30,273 5,048 14,653 49,974
Total investments $ 304,293 288,039 379,316 971,648

BOSTON FOUNDATION, INC.
Notes to Consolidated Financial Statements
June 30, 2014 and 2013
15 (Continued)
(1) Flexible Capital (except credit opportunities that are not redeemable) represents minority ownership
in investment vehicles that generally contain rolling lock-up provisions. Under such provisions,
redemptions are generally possible every one to three years. A redemption request must be made in
accordance with the notification terms of the underlying agreement. Investments of $31,940 are
redeemable quarterly and $158,800 are redeemable in 1 – 5 years. However, certain, or all, of the
additional related investment proceeds may not be received for a significantly longer period until
underlying investments are sold (so called side-pockets). Side-pocket balances of $23,020 are
illiquid.
(2) The Foundation’s ownership interests in private equity and venture capital investments represent
ownership interests in a variety of entities, typically as a minority limited partner. These investments
are both directly in private equity and venture capital partnerships as well as in funds of funds that
make these types of investments.
(3) Real assets represent ownership interests in a variety of entities, including as a minority limited
partner. These entities focus their investment activities on a type of asset, such as the ownership of
real estate properties, timber assets, or oil and gas properties. The underlying investment vehicles
often utilize leverage.
(4) These securities are directly owned U.S. Treasury Inflation Protected Securities (TIPS). The markets
for these securities are active and trading in these bonds typically occurs every day. However, as
these markets are over the counter, pricing for all securities is not always available daily. As such,
they have been classified in Level 2.
In addition, as of June 30, 2014 and 2013, the Foundation owns an interest in other noncash assets that
were received as a donation. These assets are currently held for sale and are carried at an estimated fair
value of $479 and $619, at June 30, 2014 and 2013, respectively.

BOSTON FOUNDATION, INC.
Notes to Consolidated Financial Statements
June 30, 2014 and 2013
16 (Continued)
The following table summarizes the Foundation’s investments in the fair value hierarchy as of June 30,
2013:
Related
2013 Redemption Days’ unfunded
Level 1 Level 2 Level 3 Total or liquidation notice commitment
Balanced Plus Pool:Global equities:
Developed markets index $ 96,802 — — 96,802 Daily 1 NoneDeveloped markets 14,962 — — 14,962 Daily 4 NoneDeveloped markets — 43,129 — 43,129 Monthly 30 NoneEmerging markets — 27,400 — 27,400 Monthly 30 NoneEmerging markets index — 51,239 — 51,239 Semi-monthly 3 NoneDeveloped long/short — 76,895 — 76,895 Quarterly 60 None
Total 111,764 198,663 — 310,427
Flexible capital:Multi-strategy — — 123,034 123,034 (1) N/A NoneDiversified fund of funds — — 35,388 35,388 (1) N/A NoneCredit opportunities — — 8,935 8,935 (1) N/A None
Total — — 167,357 167,357
Private equity and
venture capital (2): — — 73,157 73,157 Illiquid N/A $ 36,823
Real assets (3):Real estate — — 29,250 29,250 Illiquid N/A 4,801 Timber — — 22,598 22,598 Illiquid N/A 277 Energy — — 34,962 34,962 Illiquid N/A 4,765
Total — — 86,810 86,810 $ 9,843
Fixed income:Money market 9,581 — — 9,581 Daily 1 NoneU.S. Treasuries 31,984 — — 31,984 Daily 1 NoneU.S. TIPs (4) — 17,843 — 17,843 Daily 4 NoneGlobal fixed income 6,790 — — 6,790 Daily 1 NoneGlobal fixed income — 6,733 — 6,733 Monthly 30 None
Total 48,355 24,576 — 72,931
Total balancedplus pool 160,119 223,239 327,324 710,682

BOSTON FOUNDATION, INC.
Notes to Consolidated Financial Statements
June 30, 2014 and 2013
17 (Continued)
Related
2013 Redemption Days’ unfunded
Level 1 Level 2 Level 3 Total or liquidation notice commitment
Balanced Pool:
Global equities:
Developed markets index $ 3,957 — — 3,957 Daily 1 None
Developed markets 2,223 — — 2,223 Daily 4 None
Developed markets — 3,287 — 3,287 Monthly 30 None
Emerging markets — 1,120 — 1,120 Monthly 30 None
Emerging markets index — 2,094 — 2,094 Semi-monthly 3 None
Developed long/short — 3,143 — 3,143 Quarterly 60 None
Total 6,180 9,644 — 15,824
Flexible capital:
Multi-strategy — — 6,059 6,059 (1) N/A None
Diversified fund of funds — — 1,743 1,743 (1) N/A None
Credit opportunities — — 440 440 (1) N/A None
Total — — 8,242 8,242
Fixed income:
Money market 1,722 — — 1,722 Daily 1 None
U.S. Treasuries 4,996 — — 4,996 Daily 1 None
U.S. TIPs (4) — 1,305 — 1,305 Daily 4 None
Global fixed income 318 — — 318 Daily 1 None
Global fixed income — 316 — 316 Monthly 30 None
Total 7,036 1,621 — 8,657
Total balanced pool 13,216 11,265 8,242 32,723
Short-Term Pool:
Money market 14,311 — — 14,311 Daily 1 None
U.S. Treasuries 58,996 — — 58,996 Daily 1 None
Total short-term
pool 73,307 — — 73,307
Other Investments:
Money market 467 — — 467 Daily 1 None
Developed global equities 12,800 — — 12,800 Daily 4 None
Global fixed income 8,155 — — 8,155 Daily 1 None
Global equity index — 4,424 — 4,424 Semi-monthly 3 None
Global fixed income — — 2,286 2,286 Illiquid N/A None
Developed global equities — — 4,224 4,224 Illiquid N/A None
Other private interests — — 10,159 10,159 Illiquid N/A None
Total other
investments 21,422 4,424 16,669 42,515
Total investments $ 268,064 238,928 352,235 859,227
(1) Flexible Capital (except credit opportunities that are not redeemable) represents minority ownership
in investment vehicles that generally contain rolling lock-up provisions. Under such provisions,
redemptions are generally possible every one to three years. A redemption request must be made in
accordance with the notification terms of the underlying agreement. Investments of $25,052 are
redeemable quarterly and $119,721 are redeemable in 1 – 5 years. However, certain, or all, of the
investment proceeds may not be received for a significantly longer period until underlying
investments are sold (so called side pockets). Balances of $30,826 are illiquid.

BOSTON FOUNDATION, INC.
Notes to Consolidated Financial Statements
June 30, 2014 and 2013
18 (Continued)
(2) The Foundation’s ownership interests in private equity and venture capital investments represent
ownership interests in a variety of entities, typically as a minority limited partner. These investments
are both directly in private equity and venture capital partnerships as well as in funds of funds that
make these types of investments.
(3) Real assets represent ownership interests in a variety of entities, including as a minority limited
partner. These entities focus their investment activities on a type of asset, such as the ownership of
real estate properties, timber assets, or oil and gas properties. The underlying investment vehicles
often utilize leverage.
(4) These securities are directly owned U.S. Treasury Inflation Protected Securities (TIPS). The markets
for these securities are active and trading in these bonds typically occurs every day. However, as
these markets are over the counter, pricing for all securities is not always available daily. As such,
they have been classified in Level 2.
Level 3 Investment Activity
The following table presents the Foundation’s activity for the fiscal years ended June 30, 2014 and 2013
for investments classified in Level 3:
Private
Flexible equity and Real Other
capital venture capital assets investments Total
Fair value as of July 1, 2012 $ 150,861 77,672 96,621 11,529 336,683
Purchases and capital calls 15,000 8,537 3,806 5,060 32,403
Sales and distributions (10,976) (17,076) (14,683) (86) (42,821)
Net realized and unrealized gains 20,714 4,024 1,066 166 25,970
Fair value as of June 30, 2013 $ 175,599 73,157 86,810 16,669 352,235
Fair value as of July 1, 2013 $ 175,599 73,157 86,810 16,669 352,235
Purchases and capital calls 29,000 11,660 1,965 163 42,788
Sales and distributions (15,528) (20,575) (18,845) (2,377) (57,325)
Net realized and unrealized gains
(losses) 24,689 18,308 (1,577) 198 41,618
Fair value as of June 30, 2014 $ 213,760 82,550 68,353 14,653 379,316
There were no asset reclassifications in 2014 or 2013.

BOSTON FOUNDATION, INC.
Notes to Consolidated Financial Statements
June 30, 2014 and 2013
19 (Continued)
Liquidity
Certain investments measured at NAV are redeemable with the funds or limited partnerships at NAV under
the original terms of the subscription agreement and/or partnership agreements. The majority of such
redemptions require 90 days or less written notice prior to the redemption period. The investments’ fair
values are aggregated below by redemption or liquidation period, availability, or sale in the case of
marketable securities as of June 30:
2014 2013
Daily $ 323,909 287,212 Semi-monthly 69,274 57,757 Monthly 102,951 81,985 Quarterly 128,138 80,038 1 to 5 years 175,690 144,773
Total redeemable investments 799,962 651,765
Illiquid 171,686 207,462
Total $ 971,648 859,227
Investment Returns
Investment returns for the years ended June 30 were as follows:
2014 2013
Interest and dividends, net of fees $ 5,604 10,805 Unrealized and realized gains on investments and trusts 123,058 65,297
Total return $ 128,662 76,102
Interest and dividends are shown net of investment management and custody fees. Investment management
and custody fees paid directly to the managers for the years ended June 30, 2014 and 2013 were $2,770
and $2,190, respectively. Additional investment fees that were not paid directly to the managers have been
netted against the return on certain investments. The Foundation is not able to determine the amount of
such fees.
Investment returns by investment pool for the years ended June 30 were as follows:
2014 2013
Balance plus pool $ 108,611 68,718 Balance pool 6,466 1,851 Short term pool 36 75 Other investments 13,549 5,458
Total return $ 128,662 76,102

BOSTON FOUNDATION, INC.
Notes to Consolidated Financial Statements
June 30, 2014 and 2013
20 (Continued)
Commitments
Private equity, venture capital, and real asset investments are generally made through limited partnerships.
Under the terms of these agreements, the Foundation is obligated to remit additional funding periodically
as capital calls are exercised by the manager. These partnerships have a limited existence, generally around
10 years, and such agreements may provide for annual extensions for the purpose of disposing of portfolio
positions and returning capital to investors. However, depending on market conditions, the inability to
execute the fund’s strategy, and other factors, a manager may extend the term of a fund beyond its
originally anticipated existence or may wind down the fund prematurely. The Foundation cannot anticipate
such changes because they are based on unforeseen events, but should they occur they may result in less
liquidity or return from the investment than originally anticipated. As a result, the timing and amount of
future capital calls expected to be exercised in any particular year is uncertain.
Unfunded commitments at June 30 were as follows:
2014 2013
Private equity and venture capital $ 31,642 36,823 Real assets 9,947 9,843
Total unfunded commitments $ 41,589 46,666
These amounts are generally payable within ten days of the receipt of a capital call notice. The Foundation
has no control as to when a request for funding will be received. It is currently anticipated that the
Foundation will be required to fund these commitments within the next three years, but the specific timing
is ultimately subject to the discretion of the fund managers.
(5) Endowment Net Assets
Endowment net assets consist of the following:
Temporarily PermanentlyUnrestricted restricted restricted Total
As of June 30, 2014:Endowment funds $ (2,919) 222,265 222,002 441,348
As of June 30, 2013:Endowment funds $ (4,501) 174,123 216,689 386,311
GAAP provides guidance on the net asset classification of donor-restricted endowment funds for a
not-for-profit organization that is subject to an enacted version of the Uniform Prudent Management of
Institutional Funds Act (UPMIFA) and requires comprehensive disclosures regarding donor-restricted
endowment funds.
The Foundation’s endowment for the years ended June 30, 2014 and 2013 consists of 232 and 231,
respectively, individual funds established for a variety of purposes including donor-restricted endowment
funds.

BOSTON FOUNDATION, INC.
Notes to Consolidated Financial Statements
June 30, 2014 and 2013
21 (Continued)
The Foundation is subject to UPMIFA as adopted by the Commonwealth of Massachusetts. Under
UPMIFA, the Board of Directors has discretion to determine appropriate expenditures of a donor-restricted
endowment fund in accordance with a robust set of guidelines about what constitutes prudent spending.
UPMIFA permits the Foundation to appropriate for expenditure or accumulate so much of an endowment
fund as the Foundation determines to be prudent for the uses, benefits, purposes and duration for which the
endowment fund is established. Seven criteria are to be used to guide the Foundation in its yearly
expenditure decisions: 1) duration and preservation of the endowment fund; 2) the purposes of the
Foundation and the endowment fund; 3) general economic conditions; 4) effect of inflation or deflation;
5) the expected total return from income and the appreciation of investments; 6) other resources of the
Foundation; and 7) the investment policy of the Foundation.
Although UPMIFA offers short-term spending flexibility, the explicit consideration of the preservation of
funds among factors for prudent spending suggests that a donor-restricted endowment fund is still
perpetual in nature. Under UPMIFA, the Board is permitted to determine and continue a prudent payout
amount, even if the market value of the fund is below historic dollar value. There is an expectation that,
over time, the permanently restricted amount will remain intact. This perspective is aligned with the
accounting standards definition that permanently restricted funds are those that must be held in perpetuity
even though the historic-dollar-value may be expended on a temporary basis. At June 30, 2014 and 2013,
the fair value of certain of these individual funds was less than their historic dollar value by $2,919 and
$4,501, respectively, due to investment losses. Unrestricted net assets have been charged for the deficiency
caused by these losses.
The Foundation classifies as permanently restricted net assets (a) the original value of gifts donated to the
permanent endowment, (b) the original value of subsequent gifts to the permanent endowment, and
(c) accumulations to the permanent endowment made in accordance with the direction of the applicable
donor gift instrument at the time the accumulation is added to the fund. The remaining portion of the
donor-restricted endowment fund that is not classified as permanently restricted net assets is classified as
temporarily restricted net assets, until appropriated for spending by the Board of Directors.

BOSTON FOUNDATION, INC.
Notes to Consolidated Financial Statements
June 30, 2014 and 2013
22 (Continued)
Changes in endowment net assets for the year ended June 30, 2014 are as follows:
Temporarily PermanentlyUnrestricted restricted restricted Total
Endowment net assets,June 30, 2013 $ (4,501) 174,123 216,689 386,311
Investment return:Investment income, net — 2,623 — 2,623 Net realized and unrealized
gains — 57,457 — 57,457
Total investmentreturn — 60,080 — 60,080
Contributions received — — 5,398 5,398 Grants paid (18,609) — — (18,609) Operating expenses (5,247) — — (5,247) Transfers and reclassifications 85 13,415 (85) 13,415 Net assets released from
restrictions 25,353 (25,353) — —
Endowment net assets,June 30, 2014 $ (2,919) 222,265 222,002 441,348
Changes in endowment net assets for the year ended June 30, 2013 are as follows:
Temporarily PermanentlyUnrestricted restricted restricted Total
Endowment net assets,June 30, 2012 $ (4,828) 160,690 217,468 373,330 Investment return:
Investment income, net — 2,906 — 2,906 Net realized and unrealized
gains 326 36,229 — 36,555
Total investmentreturn 326 39,135 — 39,461
Contributions received — — 1,668 1,668 Grants paid (21,294) — — (21,294) Operating expenses (4,407) — — (4,407) Reclassification of net assets — — (2,447) (2,447) Net assets released from
restrictions 25,702 (25,702) — —
Endowment net assets,June 30, 2013 $ (4,501) 174,123 216,689 386,311

BOSTON FOUNDATION, INC.
Notes to Consolidated Financial Statements
June 30, 2014 and 2013
23 (Continued)
(6) Fixed Assets
Fixed assets consisted of the following as of June 30:
2014 2013
Office equipment, computer system, and furniture $ 1,526 1,611 Leasehold improvements 2,592 2,571
4,118 4,182
Less accumulated depreciation (3,694) (3,610)
$ 424 572
Depreciation expense was $209 and $133 for the years ended June 30, 2014 and 2013, respectively.
(7) Grant Commitments
Grants payable of $9,267 as of June 30, 2014 represent unconditional promises to other organizations.
Grants scheduled to be paid after one year are discounted at a rate commensurate with the duration
involved.
In addition, as of June 30, 2014, the Board of Directors had authorized the payment of certain grants in
future periods, subject to certain conditions to be met by the grantees that have not yet met the conditions
for accrual in the accompanying consolidated financial statements. Total grants subject to such conditions
are as follows:
2014
Grants subject to conditions to be met by external grantees $ 17,200 Grants subject to conditions to be met by internal grantees 7,809
Total grants subject to conditions to be met bygrantees $ 25,009
BOSTON FOUNDATION, INC.
Notes to Consolidated Financial Statements
June 30, 2014 and 2013
24 (Continued)
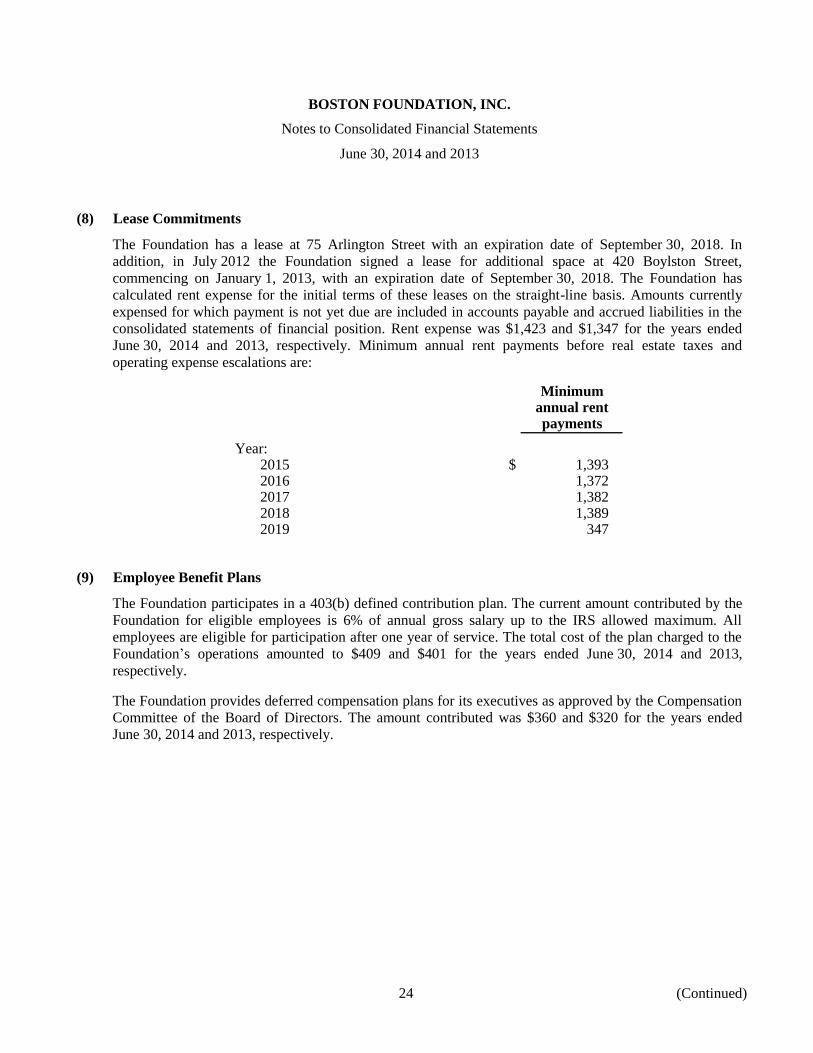
(8) Lease Commitments
The Foundation has a lease at 75 Arlington Street with an expiration date of September 30, 2018. In
addition, in July 2012 the Foundation signed a lease for additional space at 420 Boylston Street,
commencing on January 1, 2013, with an expiration date of September 30, 2018. The Foundation has
calculated rent expense for the initial terms of these leases on the straight-line basis. Amounts currently
expensed for which payment is not yet due are included in accounts payable and accrued liabilities in the
consolidated statements of financial position. Rent expense was $1,423 and $1,347 for the years ended
June 30, 2014 and 2013, respectively. Minimum annual rent payments before real estate taxes and
operating expense escalations are:
Minimumannual rentpayments
Year:2015 $ 1,393 2016 1,372 2017 1,382 2018 1,389 2019 347
(9) Employee Benefit Plans
The Foundation participates in a 403(b) defined contribution plan. The current amount contributed by the
Foundation for eligible employees is 6% of annual gross salary up to the IRS allowed maximum. All
employees are eligible for participation after one year of service. The total cost of the plan charged to the
Foundation’s operations amounted to $409 and $401 for the years ended June 30, 2014 and 2013,
respectively.
The Foundation provides deferred compensation plans for its executives as approved by the Compensation
Committee of the Board of Directors. The amount contributed was $360 and $320 for the years ended
June 30, 2014 and 2013, respectively.

BOSTON FOUNDATION, INC.
Notes to Consolidated Financial Statements
June 30, 2014 and 2013
25 (Continued)
(10) Temporarily Restricted Net Assets
Temporarily restricted net assets consisted of the following at June 30:
2014 2013
Unappropriated appreciation on endowment funds for:Discretionary purposes $ 170,698 138,530 Designated purposes 50,474 35,375 Donor advised 1,093 218
222,265 174,123
Purpose restricted:Initiatives — 1,498 Designated purpose 11,506 20,053 Field of interest 5,889 7,745 Scholarships 1,498 2,506
18,893 31,802
Total $ 241,158 205,925
(11) Permanently Restricted Net Assets
Permanently restricted net assets consisted of the following at June 30:
2014 2013
Endowment funds for:Discretionary purposes $ 141,545 141,441 Designated purposes 62,487 61,398 Donor advised 17,970 13,850
Total $ 222,002 216,689

BOSTON FOUNDATION, INC.
Notes to Consolidated Financial Statements
June 30, 2014 and 2013
26
(12) Operating Expenses
A summary of the Foundation’s operating expenses for the years ended June 30 is as follows:
2014 2013
Salary and benefits $ 9,340 8,669 Rent and related occupancy costs 1,587 1,509 Professional fees 1,349 1,641 Meetings and conference events and travel 558 833 Marketing 1,049 729 Technology 386 408 Office expense 217 214
$ 14,486 14,003
The Foundation’s operating expenses as presented above include $60 and $21 of operating expenses of its
supporting organizations for the years ended June 30, 2014 and 2013, respectively.
(13) Subsequent Events
Management has evaluated events subsequent to June 30, 2014 and through December 18, 2014, the date
on which the financial statements were available to be issued.