botswana agricultural census 2015 analytical papers · botswana agricultural census 2015 analytical...
TRANSCRIPT
Botswana Agricultural Census 2015 | Analytical Papers 1
BOTSWANA AGRICULTURAL CENSUS 2015ANALYTICAL PAPERS

Botswana Agricultural Census 2015 | Analytical Papers2
PREFACE
The 2015 Agricultural Census is the fourth census of its kind in the country. The first, second and third agricultural censuses were conducted in 1982, 1993 and 2004 respectively. In order to maximize the value from any census data, it is general practice that after the release of any census results, interested researchers are invited to further analyze the data available to augment the agricultural statistics information. For this reason, Statistics Botswana engaged two researchers to conduct in-depth analysis of the crop and livestock sub-sectors from the 2015 Agricultural Census results. A Breakfast Seminar was held on 24 July 2018 to present the analytical papers from the Botswana Institute for Development Policy Analysis (BIDPA) and Botswana University of Agriculture & Natural Resources (BUAN).
I hereby wish to acknowledge Assistant Professors Patrick Malope and Utlwang Batlang together with their teams of experts, who tirelessly worked on the production and presentation of the two analytical papers on Crops and Livestock. I wish to extend my appreciation to the Ministry of Agricultural Development and Food Security Management for contributing to the success of the Agricultural Census Seminar. I would also like to extend my gratitude specifically to the Agricultural Statistics Unit staff in the Department of Agricultural Research, Statistics, and Policy Development for devoting time to avail the required information for the production of the analytical papers. Finally, let me take this opportunity to acknowledge everyone who participated in making the 2015 Agricultural Census Breakfast Seminar a success.
It is hoped that the analytical papers will be useful in augmenting agricultural information for the formulation and review of policies, programmes and projects in order to improve the performance of the agricultural sector.
-----------------------------Dr. Burton S. Mguni Statistician General
Botswana Agricultural Census 2015 | Analytical Papers2
reAnalysis of the Crop AgricultuSub-sector Data with emphasis on2004 and 2015 census results.
Utlwang Batlang (Agronomist), Gothatamang Patrick Nthoiwa (Statistician)
Botswana Agricultural Census 2015 | Analytical Papers 3
Utlwang Batlang (Agronomist)Department Crop Science and Production
Botswana university of Agriculture and Natural resourcesPrivate Bag 0027. [email protected]
Gothatamang Patrick Nthoiwa (Statistician)Department Basic Sciences
Botswana university of Agriculture and Natural resourcesPrivate Bag 0027. [email protected]
Botswana Agricultural Census 2015 | Analytical Papers4
ABSTRACT
This paper presents the analysis of data for the Crop Agriculture Sub-sector with emphasis on comparing the 2004 and 2015 census results. The traditional and commercial results were also compared based on national results. In addition, the analysis sort to determine the impact of ISPAAD in the period 2008 to 2015 against the production trends between 1979 and 2007. The results indicate that except for maize, which experienced reduced production by 50%, total production increased in 2015 for sorghum, beans/pulses and sunflower. The increase was ascribed to increased production by commercial farmers as opposed to traditional sector. Results on yield per hectare harvested shows that in 2015 there were yield reductions in sorghum, maize, beans/pulses under traditional sector, while commercial sector farmers increased yield in this same year, which indicates that commercial enterprises were more productive than their traditional counterparts. Historical data (1979-2015) suggests that the sector has the potential to produce over hundred thousand (100, 000) tonnes, with yield exceeding 500kg/ha of cereal grain. On the other hand, during the ISPAAD period, the average production was below forty thousand (40, 000) tonnes and yield of 200kg/ha and not trending towards the potentials, which means the impact in terms of the above indicators are yet to be realized. However, during the Programme there was an increase on commercial arable enterprises, which contributed to more production in 2015 compared to 2004.
Botswana Agricultural Census 2015 | Analytical Papers 5
1. Introduction
In Botswana, the agricultural sector is composed of crop and livestock production. In the crop-subsector, under both traditional and commercial farming, the predominant crops are; cereals (sorghum, maize and pearl millet), pulses (cowpeas and beans) and oilseeds (sunflower and groundnuts) and watermelons (Statistics Botswana, 2012). In some instances commercial farmers produce other crops such as wheat and finger millet. The total area planted to arable crops is usually in the range of 150,000 ha which is only around 0.2% of the total arable land (BIDPA, 2006). With variable percentages, crop production is carried out by two categories of arable farmers who are, traditional farmers and commercial farmers. About 70% of rural households derive their livelihoods from dry land arable agriculture, through subsistence farming, which is dominated by small traditional farms with an average size of five (5) hectares. About 63,000 arable farms fit under this category, while only 112 farms are larger than 150 hectares (Statistics Botswana, 2012).
The environment in which crop production takes place is constrained by the following biophysical factors; low and unreliable rainfall, recurrent droughts, very high summer temperatures and relatively poor soils. In addition, socio-economic factors such as, lack of credit, inadequate infrastructure, lack of appropriate technology and poor management also affect crop production. With regard to traditional farmers, the majority of farming households in the country practice arable production with low factor endowment. According to Chanda et al., (1999), lack of or shortage of labour and draught power during cultivation, weeding and harvest time are some of the persistent problems among the poor households, most of whom are female or elderly headed. There is lack of access to capital by majority of farmers and investments are difficult to make for the majority households, especially given the risky condition for crop production due to the low and variable rainfall. Few of these farmers utilise soil fertility enhancing strategies coupled with outdated farming practices such as seed broadcasting and mixed cropping. At the onset of rain, the mixed seeds are broadcasted, followed by a tractor or a donkey with a small plough. In the next 4-6 weeks depending on crop variety and species the fields are manually weeded, which is mostly undertaken by women. On the other hand arable commercial farmers cultivate less than 10% of agricultural arable land. However, productivity indicators in the commercial sector are significantly higher than in traditional sector. The 2015 Agricultural Census report indicates that the commercial sector recorded high yields per hectare as compared to the traditional sector in many crops. The long term (1979-1996) average yield for sorghum and maize were respectively 185 and 84 kg/ha in the traditional sector compared to 549 and 784 kg/ha in the commercial sector (CSO, 2000). Similar trends were reported by Kgathi et al., (2003), where commercial farmers were more productive. Efficiency or productivity of the commercial sector could be attributed to better management enhanced by the NAMPAADD interventions, which assisted farmers to upgrade their technologies and management levels.
In the period 1979-2015, Statistics Botswana has collected and documented crop statistics for the country and this is on the following key production indicators; area planted (AP), area harvested (AH) and crop productivity (AP/AH). At the end production, post-harvest activities (consumption, storage and trading) were also collected and documented. In addition to the key indicators, crop farming practices; planting methods, use of draught power, use of fertilizers and other agrochemicals were collected. Availability of these data enabled us to conduct time series and higher level statistical analysis to;
a. Compare the 2004 and 2015 agricultural census results (commercial and traditional) and discuss them at national level. b. In addition, analysis of these data presented an opportunity to determine the impact of ISPAAD in the period 2008-2015.
2. METHODOLOGY
a. Data Acquisition and PreparationLong term data (1979-2015) on key indicators of crop production, post-harvest utilization, crop farming practices and information on major crops were sourced from Statistics Botswana. Appropriate data preparation was carried out to prepare data for further analysis.
b. Statistical AnalysisDescriptive statistics (means) was used to compare crop statistics by each agricultural region and administrative districts. This comparison will include the key production indicators; area planted, area harvested and crop productivity.

Botswana Agricultural Census 2015 | Analytical Papers6
Total land area decreased by 2% from 208752 in 2004 to 204965 in 2015 under traditional sector and increased by 224% from 16856 to 54691 under the commercial sector (Figure 2a and 2b). The overall trend indicates that, the total land area increased from 225608 in 2004 to 259656 in 2015 which is a 15% increase.
3. RESULTS
3.1 Total holdings, area planted and harvested. The number of land holdings decreased from 63257 in 2004 to 41043 in 2015 under the traditional sector and a similar trend was observed for the total holdings in which there was a decrease from 63357 in 2004 to 41 348 holdings (Figure 1). On the other hand, under the commercial sector there was an increase in land holding from 100 to 305.
Botswana Agricultural Census 2015 | Analytical Papers 7
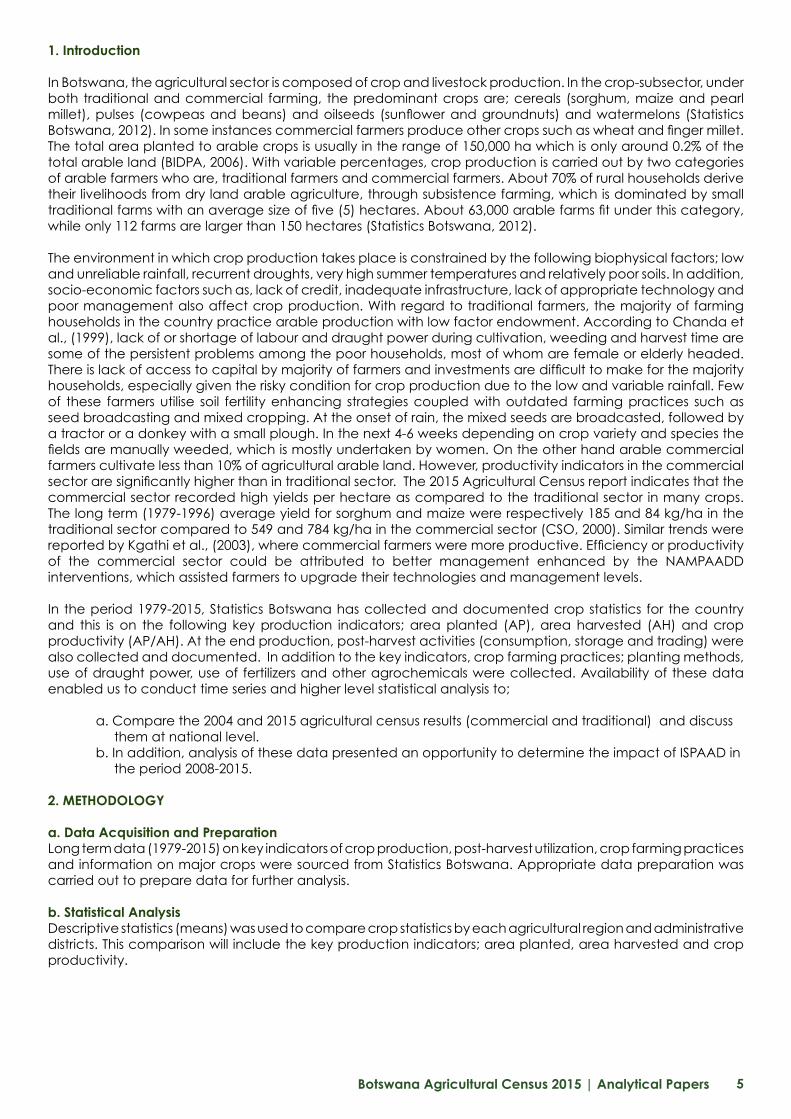
Area planted also decreased by 13% from 141585 ha in 2004 to 123251 ha in 2015 under traditional sector, and increased by 105% from 16856 ha to 34562 ha for the commercial sector (Figure 2b). The total land area planted under both sectors decreased by 0.4% from 158441 ha in 2004 to 157813 ha in 2015.
3.2 Crops planted and harvested
Sorghum, maize and beans/pulses are the major crops in terms of area planted and consistent production in the 2004 and 2015. Planting maize has been predominant in the traditional sector, with the total area planted at 63214 ha in 2004 to 61803 ha in 2015, and this was a 2% decrease between the two years (Figure 3a and 3b). The total area planted under sorghum also decreased by 52% from 48815 in 2004 to 23223 in 2015. Area planted to beans/pulses increased from 15819 ha in 2004 to 32383 ha in 2015 which is a 49% increase. Area planted to sunflower decreased from 2951 ha in 2004 to 1713 ha in 2015 which is a 68% decrease. Except for sunflower, where area planted decreased by 50% commercial farmers increased area planted to; sorghum by 56%, maize by 440%, beans/pulses by 1734% in the year 2015 compared to the year 2004 (Figure 3b). In 2004 there were total land planted to maize was 63829 and this increased to 65129 in 2005, which is a 2% increase (Figure 3a).

Botswana Agricultural Census 2015 | Analytical Papers8
Under the traditional sector, area harvested for sorghum decreased from 38736 ha in 2004 to 7925 ha in 2015 by 79%, for maize it also decreased by 68% from 42804 ha to 13318 ha and the same decreased trend was observed for beans/pulses (Figure 4a and 4b). Except for sunflower 49% reduction, harvested area under commercial sector experienced an increase in 2015 compared to 2004 by 50% for sorghum, 162% for maize and 2142% for beans/pulses. Total area harvested; for sorghum was 50568 ha in 2004 and 25863 ha in 2015, which represents a 49% reduction, for maize it was 4390 in 2004 and 14857 in 2015 an this was a 238% increase (Figure 4a). The total area harvested for beans/pulses increased by 87% from 8130 ha in 2004 to 15235 ha in 2015, while total harvested area for sunflower was 2856 ha in 2004 and 1620 ha in 2015, a decrease of 43%.

Botswana Agricultural Census 2015 | Analytical Papers 9
3.3 Crop Production and yield
3.3.1 Production
Under traditional sectors sorghum production went down from 10581 tonnes in 2004 to 1927 tonnes in 2015, which is a 81% reduction, while commercial farmers increased sorghum production by 2758% from 1175 tonnes in 2004 to 33581 tonnes in 2015 (Figure 5a and 5b). The data further shows that the overall total production for sorghum increased from 11756 tonnes in 2004 to 35508 in 2015 and this was a 202% increase.
The total maize production decreased from 7536 tonnes in 2004 to 3792 tonnes in 2015, which was a 49% decrease. Maize production by traditional sector experienced reduction by 80% from 7223 tonnes in 2004 to 1417 tonnes in 2015, while commercial sector production of the crop increased by 658% from 313 tonnes in 2004 to 2375 tonnes (Figure 5a and 5b).
Production for beans/pulses by traditional farmers decreased in 2015 compared to 2004 by 61% while there was an increase by 4893 % by commercial sector from 128 tonnes in 2004 to 6391 tonnes in 2015. Concerning sunflower production there was a 209% increase from 22 tonnes in 2004 to 68 tonnes in 2015 under traditional, and a 184% increase from 465 tonnes in 2004 to 1320 tonnes in 2015 under commercial sector. Total sunflower production also experienced a 185% increase from 487 tonnes in 2004 to 1388 tonnes in 2015. Except for maize, total production for all the crops was increased by an average of 141% in 2015.
Botswana Agricultural Census 2015 | Analytical Papers10
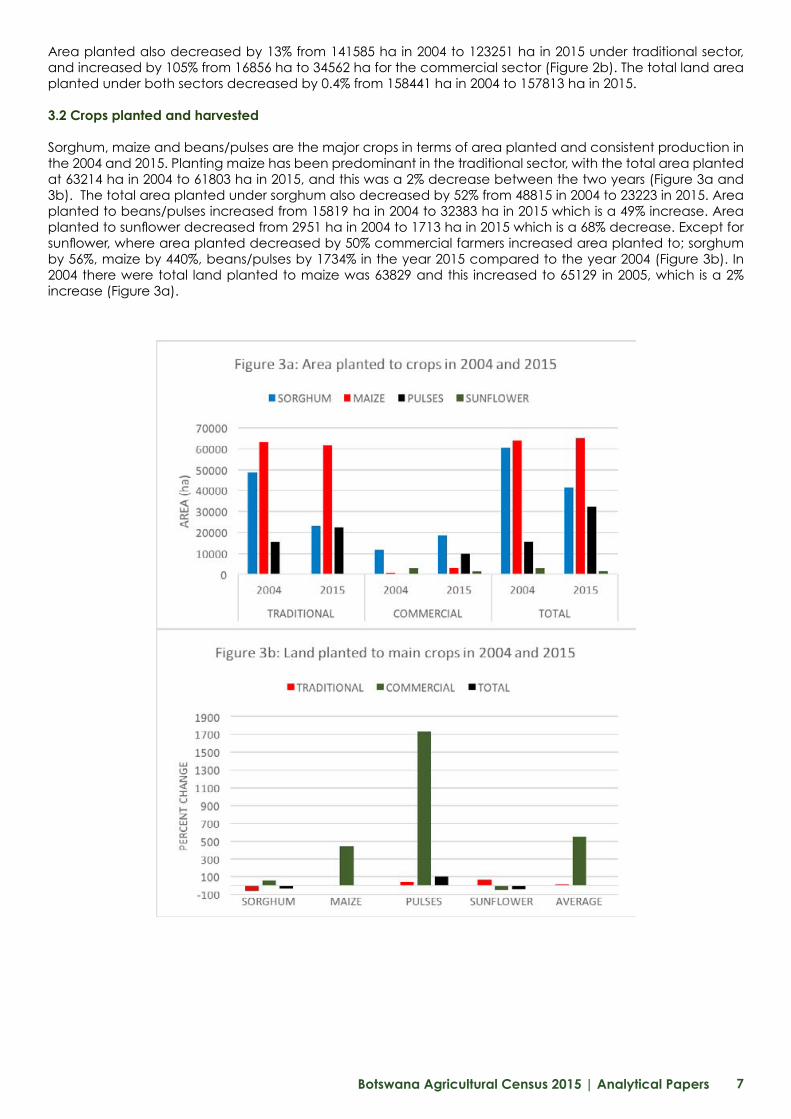
3.3.2 Crop Yield on area harvested
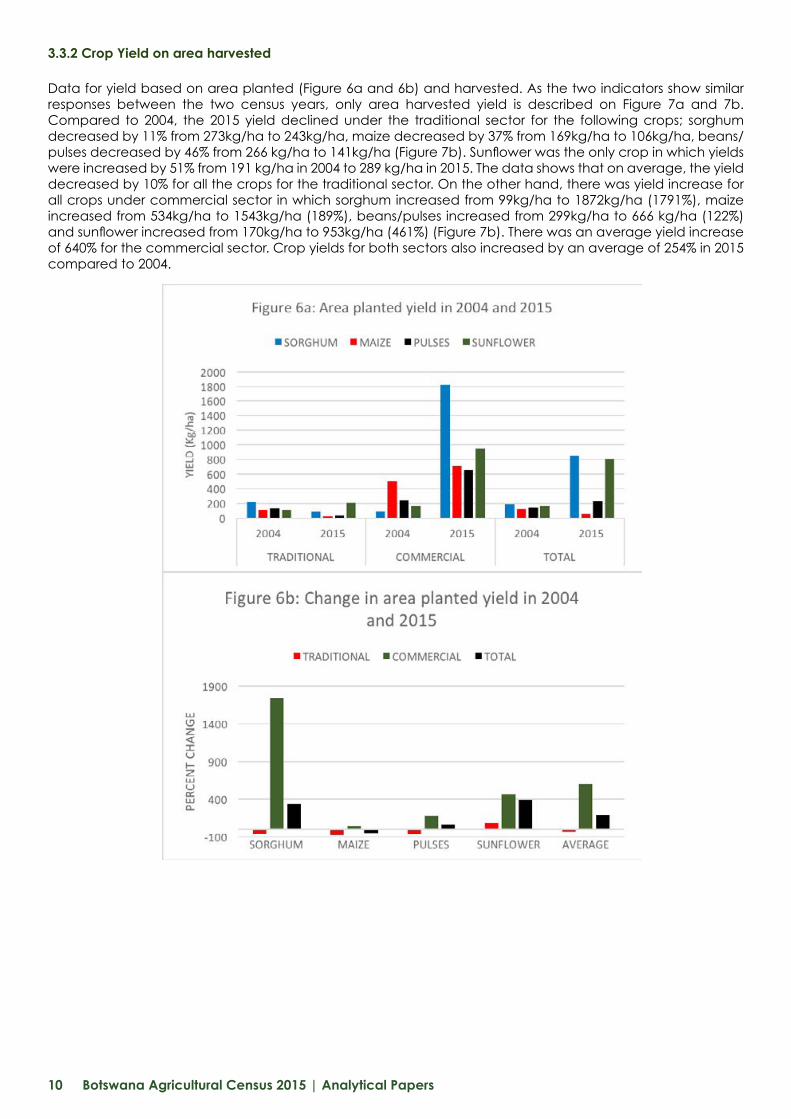
Data for yield based on area planted (Figure 6a and 6b) and harvested. As the two indicators show similar responses between the two census years, only area harvested yield is described on Figure 7a and 7b. Compared to 2004, the 2015 yield declined under the traditional sector for the following crops; sorghum decreased by 11% from 273kg/ha to 243kg/ha, maize decreased by 37% from 169kg/ha to 106kg/ha, beans/pulses decreased by 46% from 266 kg/ha to 141kg/ha (Figure 7b). Sunflower was the only crop in which yields were increased by 51% from 191 kg/ha in 2004 to 289 kg/ha in 2015. The data shows that on average, the yield decreased by 10% for all the crops for the traditional sector. On the other hand, there was yield increase for all crops under commercial sector in which sorghum increased from 99kg/ha to 1872kg/ha (1791%), maize increased from 534kg/ha to 1543kg/ha (189%), beans/pulses increased from 299kg/ha to 666 kg/ha (122%) and sunflower increased from 170kg/ha to 953kg/ha (461%) (Figure 7b). There was an average yield increase of 640% for the commercial sector. Crop yields for both sectors also increased by an average of 254% in 2015 compared to 2004.
Botswana Agricultural Census 2015 | Analytical Papers 11
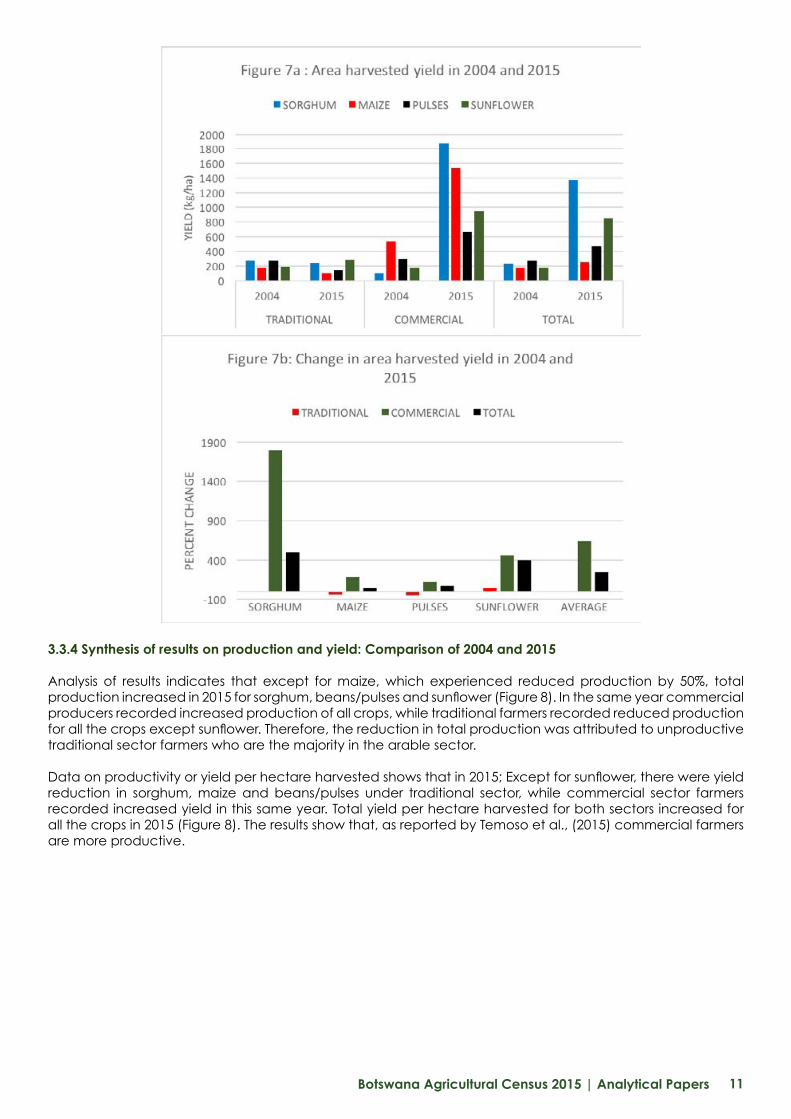
3.3.4 Synthesis of results on production and yield: Comparison of 2004 and 2015
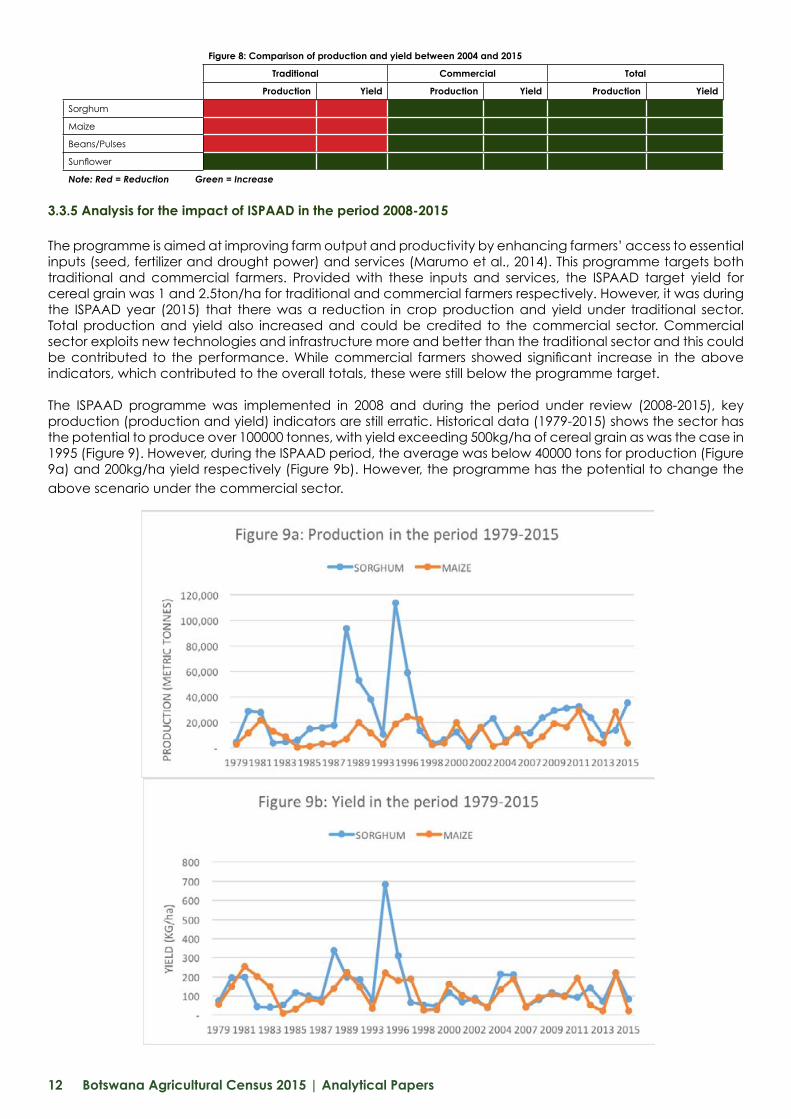
Analysis of results indicates that except for maize, which experienced reduced production by 50%, total production increased in 2015 for sorghum, beans/pulses and sunflower (Figure 8). In the same year commercial producers recorded increased production of all crops, while traditional farmers recorded reduced production for all the crops except sunflower. Therefore, the reduction in total production was attributed to unproductive traditional sector farmers who are the majority in the arable sector.
Data on productivity or yield per hectare harvested shows that in 2015; Except for sunflower, there were yield reduction in sorghum, maize and beans/pulses under traditional sector, while commercial sector farmers recorded increased yield in this same year. Total yield per hectare harvested for both sectors increased for all the crops in 2015 (Figure 8). The results show that, as reported by Temoso et al., (2015) commercial farmers are more productive.
Botswana Agricultural Census 2015 | Analytical Papers12
Figure 8: Comparison of production and yield between 2004 and 2015
Traditional Commercial Total
Production Yield Production Yield Production Yield
Sorghum
Maize
Beans/Pulses
Sunflower
Note: Red = Reduction Green = Increase
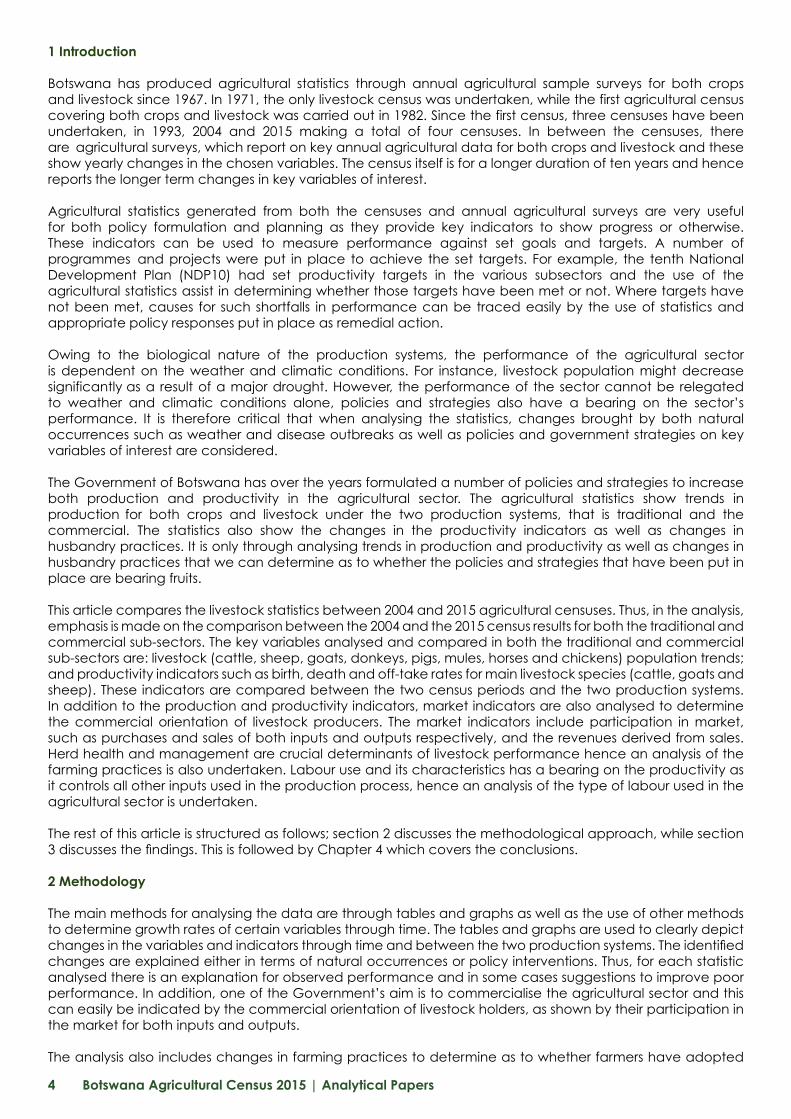
3.3.5 Analysis for the impact of ISPAAD in the period 2008-2015
The programme is aimed at improving farm output and productivity by enhancing farmers’ access to essential inputs (seed, fertilizer and drought power) and services (Marumo et al., 2014). This programme targets both traditional and commercial farmers. Provided with these inputs and services, the ISPAAD target yield for cereal grain was 1 and 2.5ton/ha for traditional and commercial farmers respectively. However, it was during the ISPAAD year (2015) that there was a reduction in crop production and yield under traditional sector. Total production and yield also increased and could be credited to the commercial sector. Commercial sector exploits new technologies and infrastructure more and better than the traditional sector and this could be contributed to the performance. While commercial farmers showed significant increase in the above indicators, which contributed to the overall totals, these were still below the programme target.
The ISPAAD programme was implemented in 2008 and during the period under review (2008-2015), key production (production and yield) indicators are still erratic. Historical data (1979-2015) shows the sector has the potential to produce over 100000 tonnes, with yield exceeding 500kg/ha of cereal grain as was the case in 1995 (Figure 9). However, during the ISPAAD period, the average was below 40000 tons for production (Figure 9a) and 200kg/ha yield respectively (Figure 9b). However, the programme has the potential to change the above scenario under the commercial sector.

Botswana Agricultural Census 2015 | Analytical Papers 13
4. CONCLUSION
The results indicate that except for maize, which experienced reduced production by 50%, total production was increased in 2015 for sorghum, beans and pulses and sunflower compared to 2004. Yield per hectare harvested was reduced in 2015 in sorghum, maize, beans/pulses under traditional sector, while commercial sector farmers increased their yield as such they were more productive that their traditional counterparts. During the ISPAAD period in 2008-2015, the average production yields were below or within the historical results, which means it’s the impact in terms of the indicators are yet to be realized.
5. REFERENCES
Baliyan SP, Kgathi DL. 2009. Production and marketing problems in small scale horticulture farming in Botswana. Acta Horticulturae 831: 31-40.
CSO. 2000. Analysis of arable statistics. Planning and Statistics Department, Ministry of Agriculture, Gaborone, Botswana.
Chanda R, Chipanshi AC, Totolo O, Magole L. 1999. Vulnerability and adaptation to climate change of the crops subsector in Botswana: The case study of sorghum and maize in the Borolong and Ngamiland Agricultural Districts. Department of Mines, Ministry of Water and Mineral Resources, Gaborone, Botwana.
Kgathi DL, Sekhwela MBM, Hamandawana H. 2003. Sustainability of commercial agriculture in Chobe District, Botswana. South African Geography Journal 85: 18-25.
Morula M. 2015. Shortfalls in fruits and vegetables met with imports. Sunday Standard, 18 October 2015.
Williams PJ. 1989. Horticulture in Botswana. Institute of World Affairs, Washington, DC.
MMEWR. 2015. Botswana’s Agriculture and Water Resources. Policy Brief. Department of Water Affairs, Gaborone, Botswana.
Statistics Botswana. 2012. The 2009 and 2010 annual agricultural survey preliminary results. Report No. 13 of 2012, Gaborone, Botswana.
Temoso O, Villano R, Hadley D. 2015. Agricultural productivity, efficiency and growth in a semi-arid country: a case of Botswana. African Journal of Agricultural and Resource Economics 10: 192-206.
Botswana Agricultural Census 2015 | Analytical Papers2
Trends in Livestock Production and Productivity: What do the 2015 Agricultural Census Results Say?Patrick Malope¹, Omogolo Maripe² and Boitshepo Ramokate³
Botswana Agricultural Census 2015 | Analytical Papers 3
Abstract
This article analyses the 2015 agricultural census results for the livestock sector. In the analysis a comparison is made between the 2004 and 2015 results as well as between the two production systems: the traditional and commercial. The analysis has been undertaken through the use of tables and graphs as well as explanation for the performance of the sector in certain key variables of interest. The results indicate that in terms of population, there has been a fall in all livestock species between 2004 and 2015, with ostriches recording the highest fall of 62%, followed by donkeys (56%), horses (33%) and sheep population having fallen the least at 1%. In terms of productivity, there has been no significant improvement between the two periods, with all the indicators failing to meet targets set during National Development Plan 9, a planning period that ended in 2009. The commercial sector’s performance is slightly better in terms of off-take and death rates, while the traditional sector performs better in terms of birth rates in the beef sector. In terms of farming practices livestock farmers are still reluctant to adopt modern husbandry practices such as the use of supplementary feeds and Artificial Insemination as a breeding method. The majority of farmers do not participate in the market, indicating a low commercial orientation. Improvement in output from the livestock sector calls for increased productivity per animal and per land area. Thus, output from the livestock sector is unlikely to improve through increase in population because some grazing land has been taken up by other uses such as residential, commercial and industrial, including mining and arable agriculture. Increase in output in the sector can only be achieved if farmers improve their management, for example selling younger male animals which will release the grazing land to the breeding herd and hence produce more output using the same amount of land. In addition, output from the sector can be increased through improvement in productivity indicators, such as birth, off-take and death rates. This calls for better management of the herd by practicing modern husbandry practices such as controlled breeding, adoption of better vaccination and disease control measures as well as increase in commercial orientation of livestock keepers.
¹Senior Research Fellow, Botswana Institute for Development Policy Analysis ²Associate Researcher, Botswana Institute for Development Policy Analysis ³Intern, University of Reading. Department of Economics
Botswana Agricultural Census 2015 | Analytical Papers4
1 Introduction
Botswana has produced agricultural statistics through annual agricultural sample surveys for both crops and livestock since 1967. In 1971, the only livestock census was undertaken, while the first agricultural census covering both crops and livestock was carried out in 1982. Since the first census, three censuses have been undertaken, in 1993, 2004 and 2015 making a total of four censuses. In between the censuses, there are agricultural surveys, which report on key annual agricultural data for both crops and livestock and these show yearly changes in the chosen variables. The census itself is for a longer duration of ten years and hence reports the longer term changes in key variables of interest.
Agricultural statistics generated from both the censuses and annual agricultural surveys are very useful for both policy formulation and planning as they provide key indicators to show progress or otherwise. These indicators can be used to measure performance against set goals and targets. A number of programmes and projects were put in place to achieve the set targets. For example, the tenth National Development Plan (NDP10) had set productivity targets in the various subsectors and the use of the agricultural statistics assist in determining whether those targets have been met or not. Where targets have not been met, causes for such shortfalls in performance can be traced easily by the use of statistics and appropriate policy responses put in place as remedial action.
Owing to the biological nature of the production systems, the performance of the agricultural sector is dependent on the weather and climatic conditions. For instance, livestock population might decrease significantly as a result of a major drought. However, the performance of the sector cannot be relegated to weather and climatic conditions alone, policies and strategies also have a bearing on the sector’s performance. It is therefore critical that when analysing the statistics, changes brought by both natural occurrences such as weather and disease outbreaks as well as policies and government strategies on key variables of interest are considered.
The Government of Botswana has over the years formulated a number of policies and strategies to increase both production and productivity in the agricultural sector. The agricultural statistics show trends in production for both crops and livestock under the two production systems, that is traditional and the commercial. The statistics also show the changes in the productivity indicators as well as changes in husbandry practices. It is only through analysing trends in production and productivity as well as changes in husbandry practices that we can determine as to whether the policies and strategies that have been put in place are bearing fruits.
This article compares the livestock statistics between 2004 and 2015 agricultural censuses. Thus, in the analysis, emphasis is made on the comparison between the 2004 and the 2015 census results for both the traditional and commercial sub-sectors. The key variables analysed and compared in both the traditional and commercial sub-sectors are: livestock (cattle, sheep, goats, donkeys, pigs, mules, horses and chickens) population trends; and productivity indicators such as birth, death and off-take rates for main livestock species (cattle, goats and sheep). These indicators are compared between the two census periods and the two production systems. In addition to the production and productivity indicators, market indicators are also analysed to determine the commercial orientation of livestock producers. The market indicators include participation in market, such as purchases and sales of both inputs and outputs respectively, and the revenues derived from sales. Herd health and management are crucial determinants of livestock performance hence an analysis of the farming practices is also undertaken. Labour use and its characteristics has a bearing on the productivity as it controls all other inputs used in the production process, hence an analysis of the type of labour used in the agricultural sector is undertaken.
The rest of this article is structured as follows; section 2 discusses the methodological approach, while section 3 discusses the findings. This is followed by Chapter 4 which covers the conclusions.
2 Methodology
The main methods for analysing the data are through tables and graphs as well as the use of other methods to determine growth rates of certain variables through time. The tables and graphs are used to clearly depict changes in the variables and indicators through time and between the two production systems. The identified changes are explained either in terms of natural occurrences or policy interventions. Thus, for each statistic analysed there is an explanation for observed performance and in some cases suggestions to improve poor performance. In addition, one of the Government’s aim is to commercialise the agricultural sector and this can easily be indicated by the commercial orientation of livestock holders, as shown by their participation in the market for both inputs and outputs.
The analysis also includes changes in farming practices to determine as to whether farmers have adopted
Botswana Agricultural Census 2015 | Analytical Papers 5
modern farming practices such as the use of breeding methods (bull service or artificial insemination), the use of chemicals/drugs/vaccines to control diseases and occurrence of diseases affecting livestock, as well as the use of feeds and types of feeds used for livestock. The use of livestock for home consumption, losses due to either animal going astray/ theft and given away are also analysed as well as deaths and causes of such deaths.
3 Results3.1 Livestock population trends
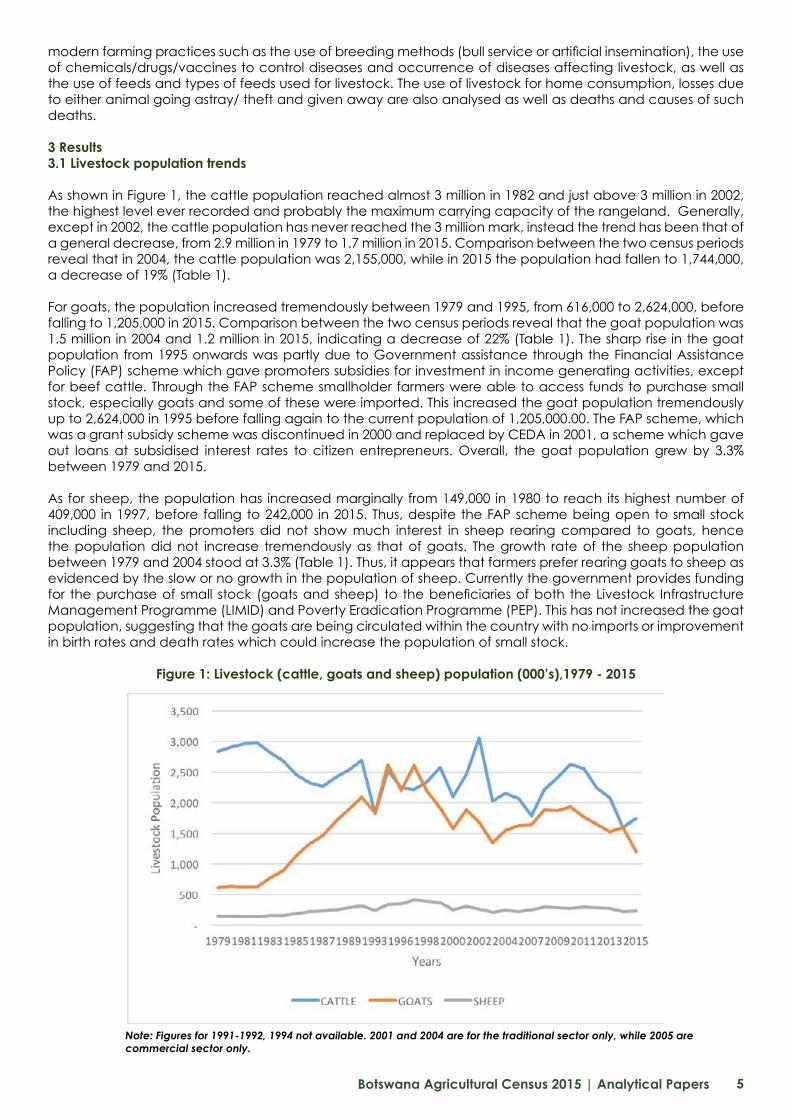
As shown in Figure 1, the cattle population reached almost 3 million in 1982 and just above 3 million in 2002, the highest level ever recorded and probably the maximum carrying capacity of the rangeland. Generally, except in 2002, the cattle population has never reached the 3 million mark, instead the trend has been that of a general decrease, from 2.9 million in 1979 to 1.7 million in 2015. Comparison between the two census periods reveal that in 2004, the cattle population was 2,155,000, while in 2015 the population had fallen to 1,744,000, a decrease of 19% (Table 1).
For goats, the population increased tremendously between 1979 and 1995, from 616,000 to 2,624,000, before falling to 1,205,000 in 2015. Comparison between the two census periods reveal that the goat population was 1.5 million in 2004 and 1.2 million in 2015, indicating a decrease of 22% (Table 1). The sharp rise in the goat population from 1995 onwards was partly due to Government assistance through the Financial Assistance Policy (FAP) scheme which gave promoters subsidies for investment in income generating activities, except for beef cattle. Through the FAP scheme smallholder farmers were able to access funds to purchase small stock, especially goats and some of these were imported. This increased the goat population tremendously up to 2,624,000 in 1995 before falling again to the current population of 1,205,000.00. The FAP scheme, which was a grant subsidy scheme was discontinued in 2000 and replaced by CEDA in 2001, a scheme which gave out loans at subsidised interest rates to citizen entrepreneurs. Overall, the goat population grew by 3.3% between 1979 and 2015.
As for sheep, the population has increased marginally from 149,000 in 1980 to reach its highest number of 409,000 in 1997, before falling to 242,000 in 2015. Thus, despite the FAP scheme being open to small stock including sheep, the promoters did not show much interest in sheep rearing compared to goats, hence the population did not increase tremendously as that of goats. The growth rate of the sheep population between 1979 and 2004 stood at 3.3% (Table 1). Thus, it appears that farmers prefer rearing goats to sheep as evidenced by the slow or no growth in the population of sheep. Currently the government provides funding for the purchase of small stock (goats and sheep) to the beneficiaries of both the Livestock Infrastructure Management Programme (LIMID) and Poverty Eradication Programme (PEP). This has not increased the goat population, suggesting that the goats are being circulated within the country with no imports or improvement in birth rates and death rates which could increase the population of small stock.
Figure 1: Livestock (cattle, goats and sheep) population (000’s),1979 - 2015
Note: Figures for 1991-1992, 1994 not available. 2001 and 2004 are for the traditional sector only, while 2005 are commercial sector only.

Botswana Agricultural Census 2015 | Analytical Papers6
The cyclical behaviour of livestock population depicted in Figure 1 is typical of extensive livestock production systems. Under these systems, livestock depend on natural grazing for over 80% of their feed requirements. The population rises in periods of plentiful rainfall and falls during droughts and/or major disease epidemics. After periods of high rainfall, there is plentiful grazing and livestock keepers tend to build their herds and there is no drought induced mortalities. After poor rainfall, hence limited natural grazing animals die of hunger, thus there are more drought induced mortalities and hence the population falls. The drought periods are normally followed by periods of good rains and as the pasture improves the population rises again. Thus, there is cyclical behaviour of the cattle population due to rainfall variability and hence availability of natural grazing.
There were three outbreaks of Foot and Mouth Disease (FMD) between the two census periods in 2005-2008; 2010-2012; and 2014-2015. During some of these outbreaks, FMD was controlled through eradication of the infected cloven animals and this reduced their population. In addition, there were several drought episodes, in fact the drought covered 2004 through 2015 and this further reduced the population, especially for cattle.
As depicted in Table 1, the population of other livestock species (donkeys, ostrich, horses, poultry and pigs) fell from their 2004 levels in 2015, with the highest (62%) fall being experienced by ostriches, followed by donkeys at 56% and horses (33%) and chicken (27%) and the smallest (1%) change recorded by sheep. The fall in the population of ostriches can be attributed to lack of market outlets after the closure of European Union (EU) registered abattoir. This left commercial ostrich farmers with no alternative, but to reduce or stop ostrich farming altogether leading to drastic fall in commercial ostrich population. On the other hand, the fall in the population of donkeys might be due the exportation of their skins, increase in local consumption and the general decline in their use as a source of draught power especially for ploughing and planting, with tractors being used instead.
Table 1: Population of other livestock species, 2004 and 2015
Source: 2015 Agricultural Census Report
3.2 Livestock population by production systems
Table 2, shows the population of the main livestock species by production systems. As shown in the table, the traditional sector dominates in terms of population for all the three livestock species. The traditional sector holds almost (95% goats and 88% sheep) all small stock, with the commercial sector holding 5% of goats and 12% of sheep in 2015. While in 2004, the traditional sector held 90% cattle, this has decreased to 78% in 2015. The main reason for this being that some of the traditional holdings were reclassified as commercial. For example, in 2004 there were only 695 commercial holdings and by 2015 the commercial holdings increased by almost two fold to 1,301. The reclassification stems from the fact that some of the traditional holdings were allocated leasehold ranches in tribal areas, which they fenced such as Kaka in Boteti Sub-district and hence reclassified as commercial holdings. Thus, the classification of farms into commercial or traditional depends on the land tenure one is operating under, with the freehold and leasehold farms with exclusive rights to grazing resources within the fenced farms being classified as commercial.
Table 2: Livestock population production system
Source: 2015 Agricultural Census Report
Species/Year 2004 2015 Percent Change
Cattle 2,155,000 1,744,000 -19
Goats 1,550,000 1,205,000 -22
Sheep 244,000 242,000 -1
Donkeys 403,000 178,000 -56
Horses 48,000 32,000 -33
Chicken 1,046,000 760,000 -27
Pigs 5,000 4,000 -20
Ostrich 1,000 380 -62
Species
Traditional Sector Commercial Sector
2004 2015 2004 2015
Cattle 1,939,927 (90%) 1,360,467 (78%) 214,893 (10%) 383,699 (22%)
Goats 1,518,456 (98%) 1,143,251 (95%) 31,881 (2%) 61,987 (5%)
Sheep 232,168 (95%) 214,234(88%) 11,734 (5%) 28,198 (12%)
Botswana Agricultural Census 2015 | Analytical Papers 7
3.3 Livestock ownership by gender
Livestock farming in Botswana has historically been dominated by males. As indicated in Table 3, livestock farming is still predominately a male activity in both the traditional and commercial sectors. In the traditional sector, males own 84% of cattle, 81% sheep and 73% of goats, while in the commercial sector they own 71% cattle, 76% goats and 69% sheep. It should however be noted that males are likely to be the owners of the livestock companies and hence own a higher proportion of livestock in the commercial sector than indicated in Table 3. Average number of livestock per holding in the traditional sector is 36, 26 and 17 for cattle, goats and sheep respectively, while in the commercial sector average number of cattle per holding is 294, and 69 for goats and 56 for sheep. Thus, the commercial sector tends to have more animals per holding due to its commercial orientation, and having exclusive rights to grazing resources. In both production systems small stock ownership per holding is lower than that of cattle, suggesting that livestock farmers prefer rearing cattle to small stock. This is probably because there are higher returns associated with raising cattle compared to small stock.
Table 3: Livestock ownership by gender
Source: 2015 Agricultural Census Report NB: Figures in parentheses are percentages
It is apparent that the amount of available grazing has decreased over the years. It is therefore not possible to increase livestock production through increase in the population using the current oxen production system, which is prevalent in the traditional sector. The amount of available grazing has decreased as some of it has been allocated to other competing uses both in the traditional and commercial sectors. For example, agricultural land has been allocated for residential, commercial and industrial uses. In the commercial sector, a case in point is the Gaborone, Lobatse and Tati freehold ranches which no longer keep livestock. In the tribal areas land has been allocated for residential, commercial and industrial uses such as mines. In addition, grazing land has been allocated to arable agriculture. All these have reduced the available land for grazing, hence limiting the ability of increasing output from the livestock sector through increases in the population, especially large ruminants such as cattle.
One way through which livestock keepers could increase livestock production, especially beef production is a change from the oxen system of production, where male animals are kept and sold after 3-5 or even more
feedlots as this will release part of the range for the breeding herd (cows and heifers) and hence produce more calves and weaners for the feedlot and more beef output per given area of land. However, given limited feed availability in the country and the very low margins in beef cattle feedlotting this option may not be feasible in the short term unless efforts are made to produce fodder and reduce reliance on expensive imported feeds.
A viable option in the short term is for farmers to raise tollies and sell them at less than 3 years. In order to encourage this, the pricing system at the Botswana Meat Commission (BMC)� is that younger males receive higher price than the old pricing system where weight was used as the overriding criteria. This encourages the oxen system of production, especially in the traditional sector as older animals are heavier and hence fetch a higher price per head.
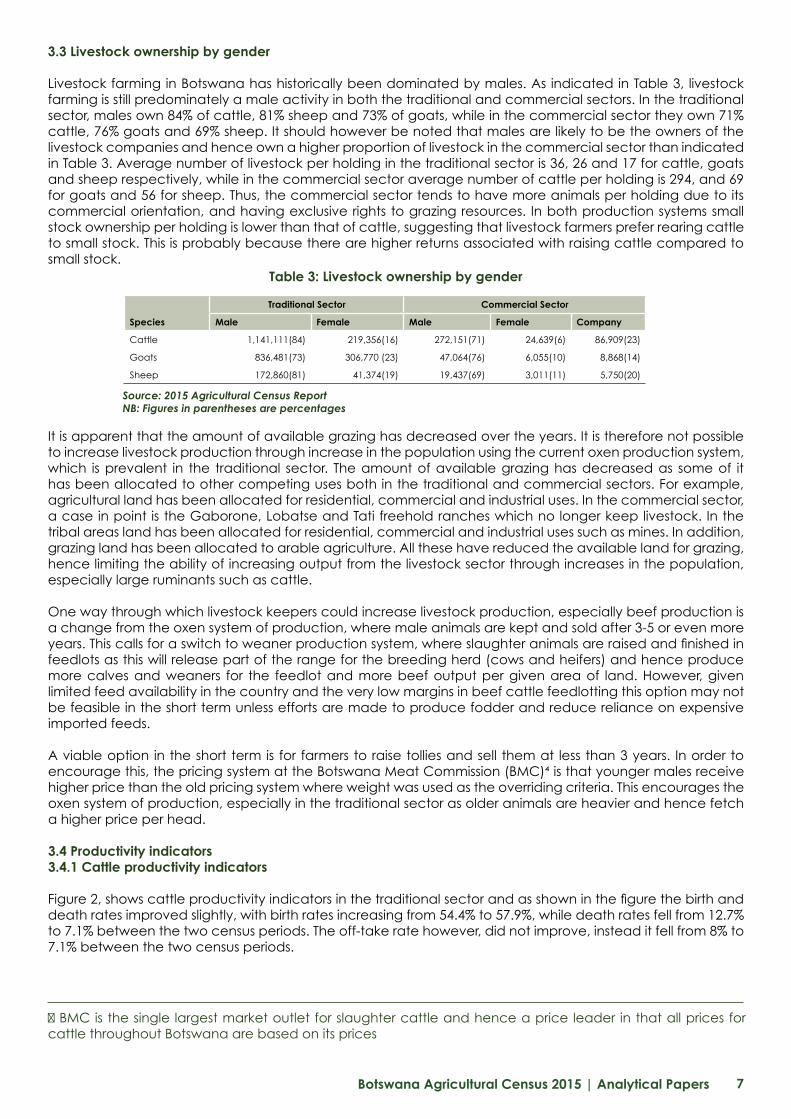
3.4 Productivity indicators3.4.1 Cattle productivity indicators
death rates improved slightly, with birth rates increasing from 54.4% to 57.9%, while death rates fell from 12.7% to 7.1% between the two census periods. The off-take rate however, did not improve, instead it fell from 8% to 7.1% between the two census periods.
Species
Traditional Sector Commercial Sector
Male Female Male Female Company
Cattle 1,141,111(84) 219,356(16) 272,151(71) 24,639(6) 86,909(23)
Goats 836,481(73) 306,770 (23) 47,064(76) 6,055(10) 8,868(14)
Sheep 172,860(81) 41,374(19) 19,437(69) 3,011(11) 5,750(20)
� BMC is the single largest market outlet for slaughter cattle and hence a price leader in that all prices for cattle throughout Botswana are based on its prices
Botswana Agricultural Census 2015 | Analytical Papers8
Figure 2: Cattle productivity indicators in the traditional sector: 2004 and 2015
Source: 2015 Agricultural Census Report
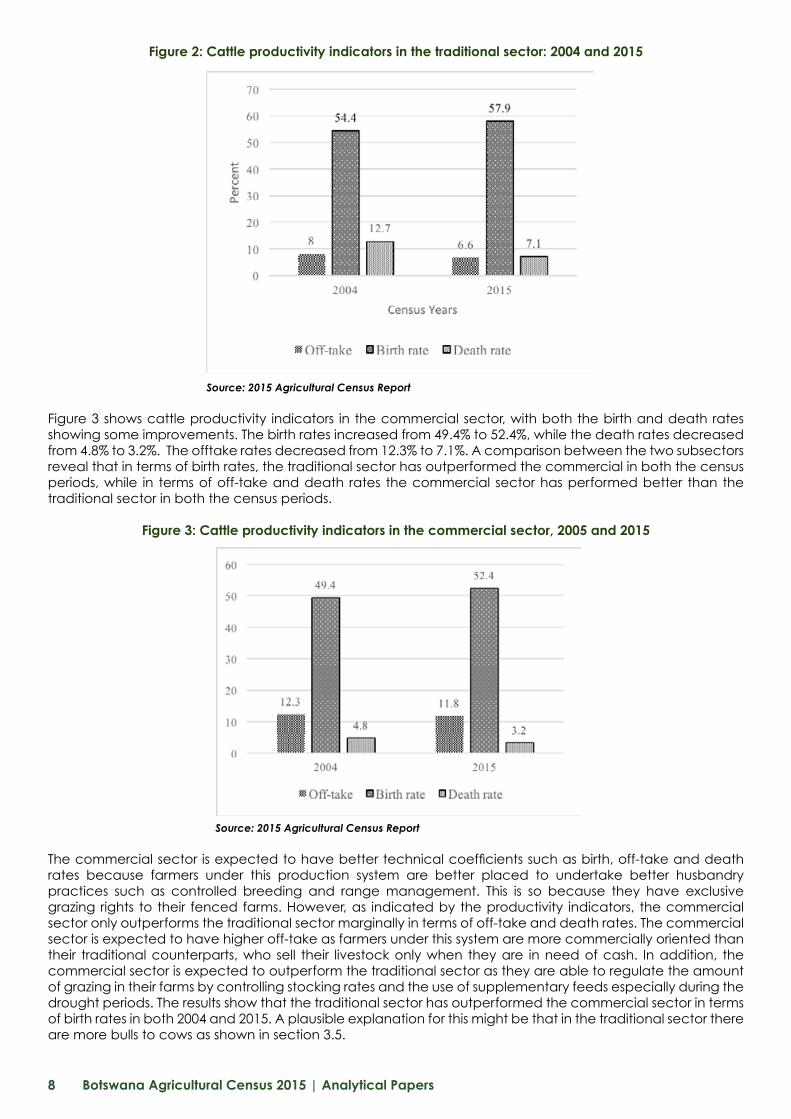
Figure 3 shows cattle productivity indicators in the commercial sector, with both the birth and death rates showing some improvements. The birth rates increased from 49.4% to 52.4%, while the death rates decreased from 4.8% to 3.2%. The offtake rates decreased from 12.3% to 7.1%. A comparison between the two subsectors reveal that in terms of birth rates, the traditional sector has outperformed the commercial in both the census periods, while in terms of off-take and death rates the commercial sector has performed better than the traditional sector in both the census periods.
Figure 3: Cattle productivity indicators in the commercial sector, 2005 and 2015
Source: 2015 Agricultural Census Report
The commercial sector is expected to have better technical coefficients such as birth, off-take and death rates because farmers under this production system are better placed to undertake better husbandry practices such as controlled breeding and range management. This is so because they have exclusive grazing rights to their fenced farms. However, as indicated by the productivity indicators, the commercial sector only outperforms the traditional sector marginally in terms of off-take and death rates. The commercial sector is expected to have higher off-take as farmers under this system are more commercially oriented than their traditional counterparts, who sell their livestock only when they are in need of cash. In addition, the commercial sector is expected to outperform the traditional sector as they are able to regulate the amount of grazing in their farms by controlling stocking rates and the use of supplementary feeds especially during the drought periods. The results show that the traditional sector has outperformed the commercial sector in terms of birth rates in both 2004 and 2015. A plausible explanation for this might be that in the traditional sector there are more bulls to cows as shown in section 3.5.
Botswana Agricultural Census 2015 | Analytical Papers 9
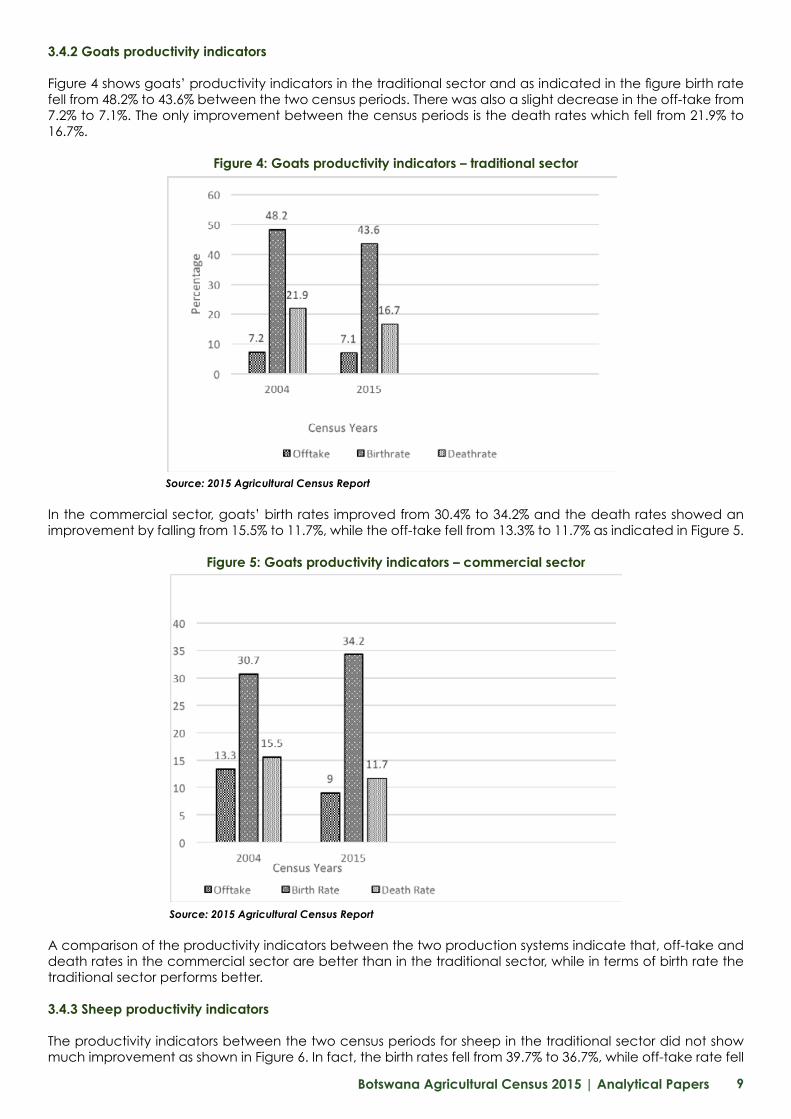
3.4.2 Goats productivity indicators
Figure 4 shows goats’ productivity indicators in the traditional sector and as indicated in the figure birth rate fell from 48.2% to 43.6% between the two census periods. There was also a slight decrease in the off-take from 7.2% to 7.1%. The only improvement between the census periods is the death rates which fell from 21.9% to 16.7%.
Figure 4: Goats productivity indicators – traditional sector
Source: 2015 Agricultural Census Report
In the commercial sector, goats’ birth rates improved from 30.4% to 34.2% and the death rates showed an improvement by falling from 15.5% to 11.7%, while the off-take fell from 13.3% to 11.7% as indicated in Figure 5.
Figure 5: Goats productivity indicators – commercial sector
Source: 2015 Agricultural Census Report
A comparison of the productivity indicators between the two production systems indicate that, off-take and death rates in the commercial sector are better than in the traditional sector, while in terms of birth rate the traditional sector performs better.
3.4.3 Sheep productivity indicators
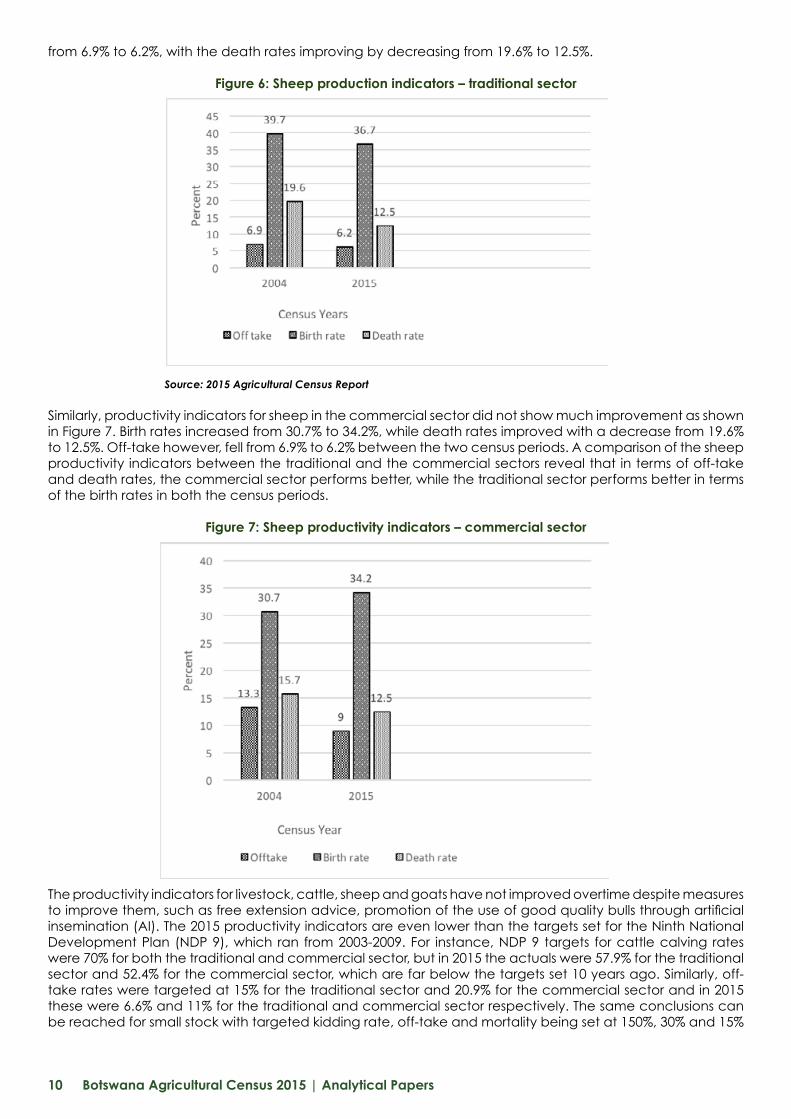
The productivity indicators between the two census periods for sheep in the traditional sector did not show much improvement as shown in Figure 6. In fact, the birth rates fell from 39.7% to 36.7%, while off-take rate fell
Botswana Agricultural Census 2015 | Analytical Papers10
from 6.9% to 6.2%, with the death rates improving by decreasing from 19.6% to 12.5%.
Figure 6: Sheep production indicators – traditional sector
Source: 2015 Agricultural Census Report
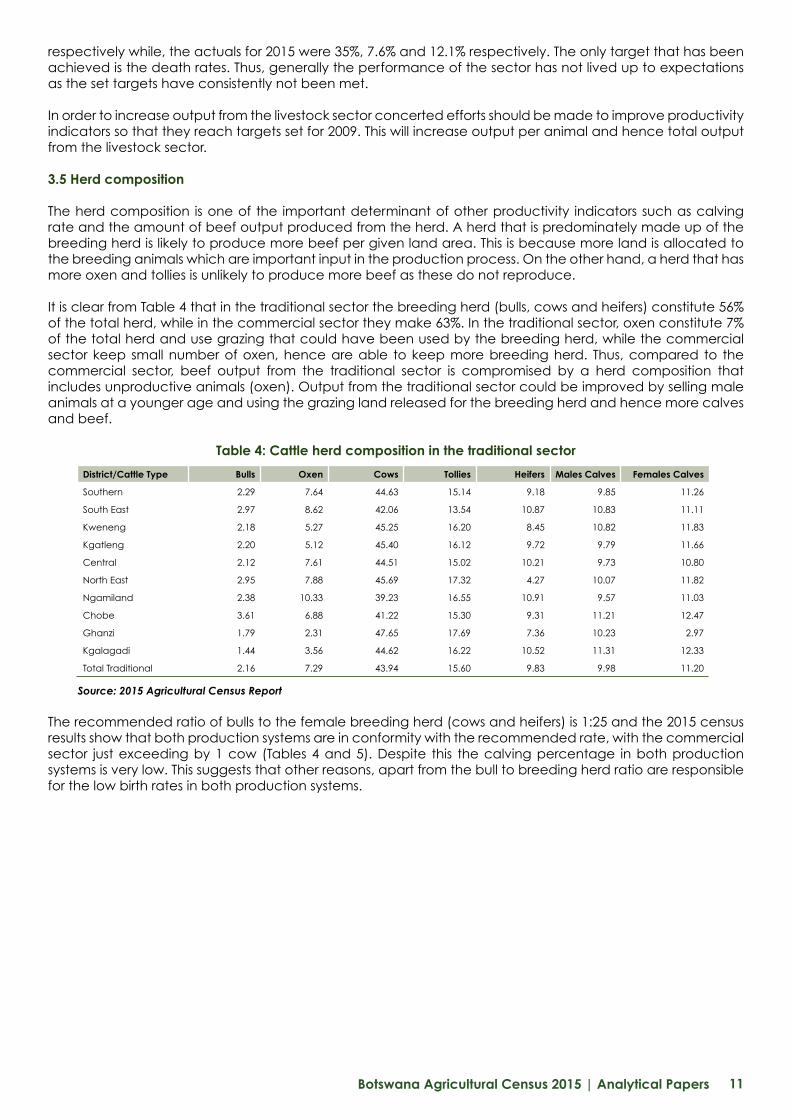
Similarly, productivity indicators for sheep in the commercial sector did not show much improvement as shown in Figure 7. Birth rates increased from 30.7% to 34.2%, while death rates improved with a decrease from 19.6% to 12.5%. Off-take however, fell from 6.9% to 6.2% between the two census periods. A comparison of the sheep productivity indicators between the traditional and the commercial sectors reveal that in terms of off-take and death rates, the commercial sector performs better, while the traditional sector performs better in terms of the birth rates in both the census periods.
Figure 7: Sheep productivity indicators – commercial sector
The productivity indicators for livestock, cattle, sheep and goats have not improved overtime despite measures to improve them, such as free extension advice, promotion of the use of good quality bulls through artificial insemination (AI). The 2015 productivity indicators are even lower than the targets set for the Ninth National Development Plan (NDP 9), which ran from 2003-2009. For instance, NDP 9 targets for cattle calving rates were 70% for both the traditional and commercial sector, but in 2015 the actuals were 57.9% for the traditional sector and 52.4% for the commercial sector, which are far below the targets set 10 years ago. Similarly, off-take rates were targeted at 15% for the traditional sector and 20.9% for the commercial sector and in 2015 these were 6.6% and 11% for the traditional and commercial sector respectively. The same conclusions can be reached for small stock with targeted kidding rate, off-take and mortality being set at 150%, 30% and 15%
Botswana Agricultural Census 2015 | Analytical Papers 11
respectively while, the actuals for 2015 were 35%, 7.6% and 12.1% respectively. The only target that has been achieved is the death rates. Thus, generally the performance of the sector has not lived up to expectations as the set targets have consistently not been met.
In order to increase output from the livestock sector concerted efforts should be made to improve productivity indicators so that they reach targets set for 2009. This will increase output per animal and hence total output from the livestock sector.
3.5 Herd composition
The herd composition is one of the important determinant of other productivity indicators such as calving rate and the amount of beef output produced from the herd. A herd that is predominately made up of the breeding herd is likely to produce more beef per given land area. This is because more land is allocated to the breeding animals which are important input in the production process. On the other hand, a herd that has more oxen and tollies is unlikely to produce more beef as these do not reproduce.
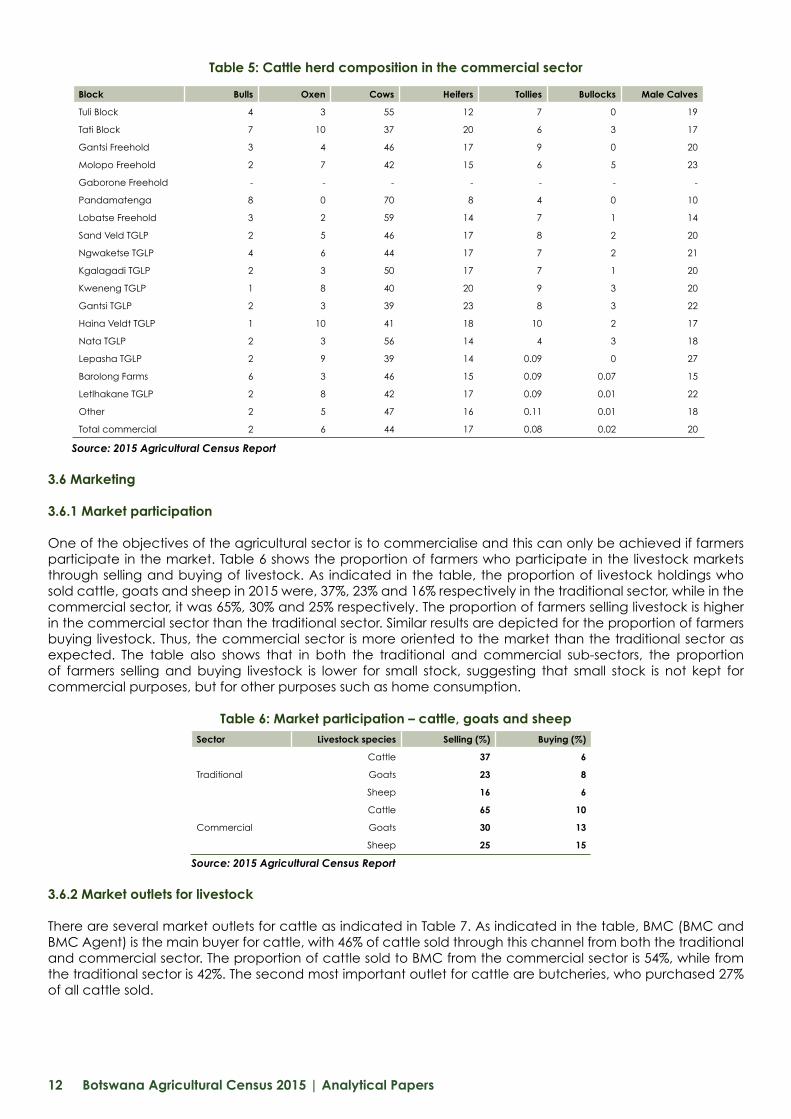
It is clear from Table 4 that in the traditional sector the breeding herd (bulls, cows and heifers) constitute 56% of the total herd, while in the commercial sector they make 63%. In the traditional sector, oxen constitute 7% of the total herd and use grazing that could have been used by the breeding herd, while the commercial sector keep small number of oxen, hence are able to keep more breeding herd. Thus, compared to the commercial sector, beef output from the traditional sector is compromised by a herd composition that includes unproductive animals (oxen). Output from the traditional sector could be improved by selling male animals at a younger age and using the grazing land released for the breeding herd and hence more calves and beef.
Table 4: Cattle herd composition in the traditional sector
Source: 2015 Agricultural Census Report
The recommended ratio of bulls to the female breeding herd (cows and heifers) is 1:25 and the 2015 census results show that both production systems are in conformity with the recommended rate, with the commercial sector just exceeding by 1 cow (Tables 4 and 5). Despite this the calving percentage in both production systems is very low. This suggests that other reasons, apart from the bull to breeding herd ratio are responsible for the low birth rates in both production systems.
District/Cattle Type Bulls Oxen Cows Tollies Heifers Males Calves Females Calves
Southern 2.29 7.64 44.63 15.14 9.18 9.85 11.26
South East 2.97 8.62 42.06 13.54 10.87 10.83 11.11
Kweneng 2.18 5.27 45.25 16.20 8.45 10.82 11.83
Kgatleng 2.20 5.12 45.40 16.12 9.72 9.79 11.66
Central 2.12 7.61 44.51 15.02 10.21 9.73 10.80
North East 2.95 7.88 45.69 17.32 4.27 10.07 11.82
Ngamiland 2.38 10.33 39.23 16.55 10.91 9.57 11.03
Chobe 3.61 6.88 41.22 15.30 9.31 11.21 12.47
Ghanzi 1.79 2.31 47.65 17.69 7.36 10.23 2.97
Kgalagadi 1.44 3.56 44.62 16.22 10.52 11.31 12.33
Total Traditional 2.16 7.29 43.94 15.60 9.83 9.98 11.20
Botswana Agricultural Census 2015 | Analytical Papers12
Table 5: Cattle herd composition in the commercial sector
Source: 2015 Agricultural Census Report
3.6 Marketing
3.6.1 Market participation
One of the objectives of the agricultural sector is to commercialise and this can only be achieved if farmers participate in the market. Table 6 shows the proportion of farmers who participate in the livestock markets through selling and buying of livestock. As indicated in the table, the proportion of livestock holdings who sold cattle, goats and sheep in 2015 were, 37%, 23% and 16% respectively in the traditional sector, while in the commercial sector, it was 65%, 30% and 25% respectively. The proportion of farmers selling livestock is higher in the commercial sector than the traditional sector. Similar results are depicted for the proportion of farmers buying livestock. Thus, the commercial sector is more oriented to the market than the traditional sector as expected. The table also shows that in both the traditional and commercial sub-sectors, the proportion of farmers selling and buying livestock is lower for small stock, suggesting that small stock is not kept for commercial purposes, but for other purposes such as home consumption.
Table 6: Market participation – cattle, goats and sheep
Source: 2015 Agricultural Census Report
3.6.2 Market outlets for livestock
There are several market outlets for cattle as indicated in Table 7. As indicated in the table, BMC (BMC and BMC Agent) is the main buyer for cattle, with 46% of cattle sold through this channel from both the traditional and commercial sector. The proportion of cattle sold to BMC from the commercial sector is 54%, while from the traditional sector is 42%. The second most important outlet for cattle are butcheries, who purchased 27% of all cattle sold.
Sector Livestock species Selling (%) Buying (%)
Cattle 37 6
Traditional Goats 23 8
Sheep 16 6
Cattle 65 10
Commercial Goats 30 13
Sheep 25 15
Block Bulls Oxen Cows Heifers Tollies Bullocks Male Calves
Tuli Block 4 3 55 12 7 0 19
Tati Block 7 10 37 20 6 3 17
Gantsi Freehold 3 4 46 17 9 0 20
Molopo Freehold 2 7 42 15 6 5 23
Gaborone Freehold - - - - - - -
Pandamatenga 8 0 70 8 4 0 10
Lobatse Freehold 3 2 59 14 7 1 14
Sand Veld TGLP 2 5 46 17 8 2 20
Ngwaketse TGLP 4 6 44 17 7 2 21
Kgalagadi TGLP 2 3 50 17 7 1 20
Kweneng TGLP 1 8 40 20 9 3 20
Gantsi TGLP 2 3 39 23 8 3 22
Haina Veldt TGLP 1 10 41 18 10 2 17
Nata TGLP 2 3 56 14 4 3 18
Lepasha TGLP 2 9 39 14 0.09 0 27
Barolong Farms 6 3 46 15 0.09 0.07 15
Letlhakane TGLP 2 8 42 17 0.09 0.01 22
Other 2 5 47 16 0.11 0.01 18
Total commercial 2 6 44 17 0.08 0.02 20
Botswana Agricultural Census 2015 | Analytical Papers 13
Sector/Outlet BMC BMC Agent Auction Gov’t Another Farmer Trader Butcher Feedlot Other Total
Traditional 25,701(31)
8,657(11)
557(0.7)
329(0.4)
9,249(11)
4,067(5)
29,084(36)
2,846(3)
1,225(1)
81,716
Commercial 20,888(44)
4,847(10)
435(0.9)
- 5,735(12)
1,542(3)
6,087(13)
6,996(15)
1,293(2.7)
47,823
Total 46,589(36)
13,504(10)
992(0.8)
329(0.3)
14,984(12)
5,609(4)
35,171(27)
9,842(8)
2,518(2)
129,539
Table 7: Market outlets for cattle
NB: Figures in parentheses are percentages.
The butcheries are the preferred channel for traditional farmers, who sold 36% of their cattle through this channel, while the commercial sector sold only 13% of cattle through this channel. The preference of the butcheries by the traditional farmers is that the majority sell fewer animals and the fact that butcheries are located nearer to them and hence they incur less transaction costs. In addition, a majority (60%) of traditional holdings indicated that they were not aware of the quota system used by the BMC and 57% said that they were not happy with the system. This explains why they do not prefer BMC as their main market outlet. To make matters worse in recent years, the BMC has had problems in paying farmers who sold livestock to them on the promised time. On the other hand, it is easy for commercial farmers to register for the European Union (EU) where they are able to receive premium prices when selling to the BMC.
3.6.3 Price comparison for different market outlets
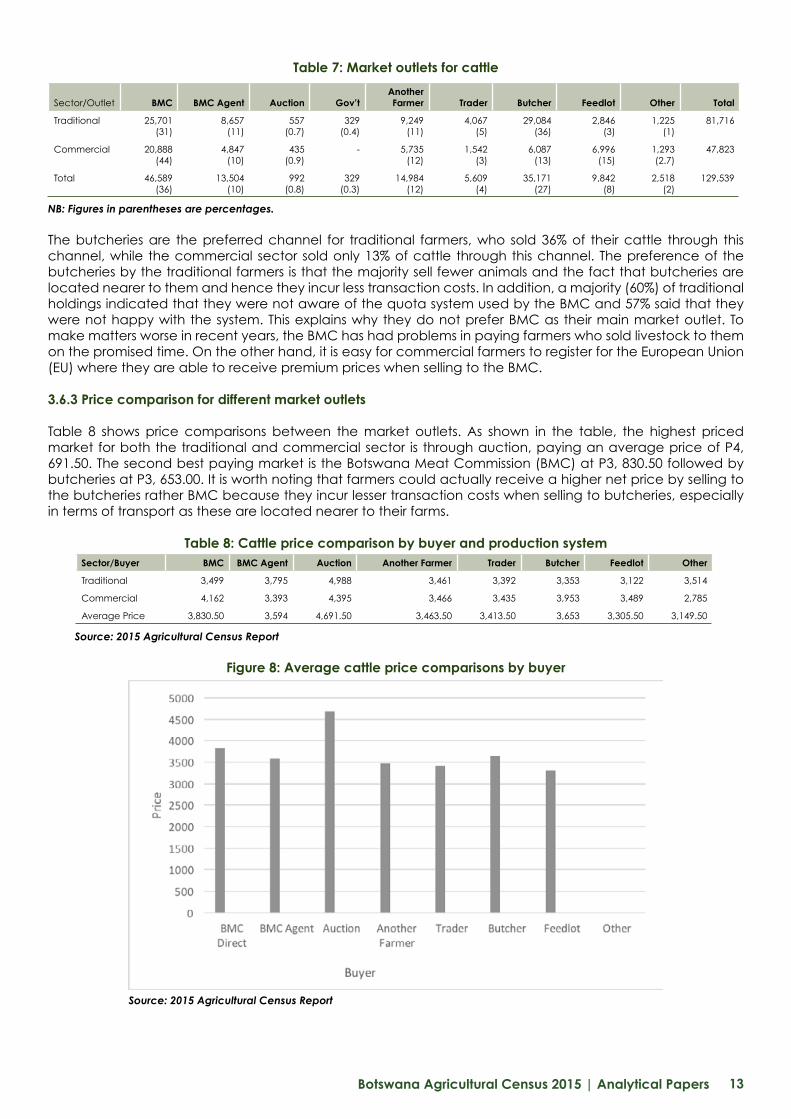
Table 8 shows price comparisons between the market outlets. As shown in the table, the highest priced market for both the traditional and commercial sector is through auction, paying an average price of P4, 691.50. The second best paying market is the Botswana Meat Commission (BMC) at P3, 830.50 followed by butcheries at P3, 653.00. It is worth noting that farmers could actually receive a higher net price by selling to the butcheries rather BMC because they incur lesser transaction costs when selling to butcheries, especially in terms of transport as these are located nearer to their farms.
Table 8: Cattle price comparison by buyer and production system
Source: 2015 Agricultural Census Report
Figure 8: Average cattle price comparisons by buyer
Source: 2015 Agricultural Census Report
Sector/Buyer BMC BMC Agent Auction Another Farmer Trader Butcher Feedlot Other
Traditional 3,499 3,795 4,988 3,461 3,392 3,353 3,122 3,514
Commercial 4,162 3,393 4,395 3,466 3,435 3,953 3,489 2,785
Average Price 3,830.50 3,594 4,691.50 3,463.50 3,413.50 3,653 3,305.50 3,149.50
Botswana Agricultural Census 2015 | Analytical Papers14
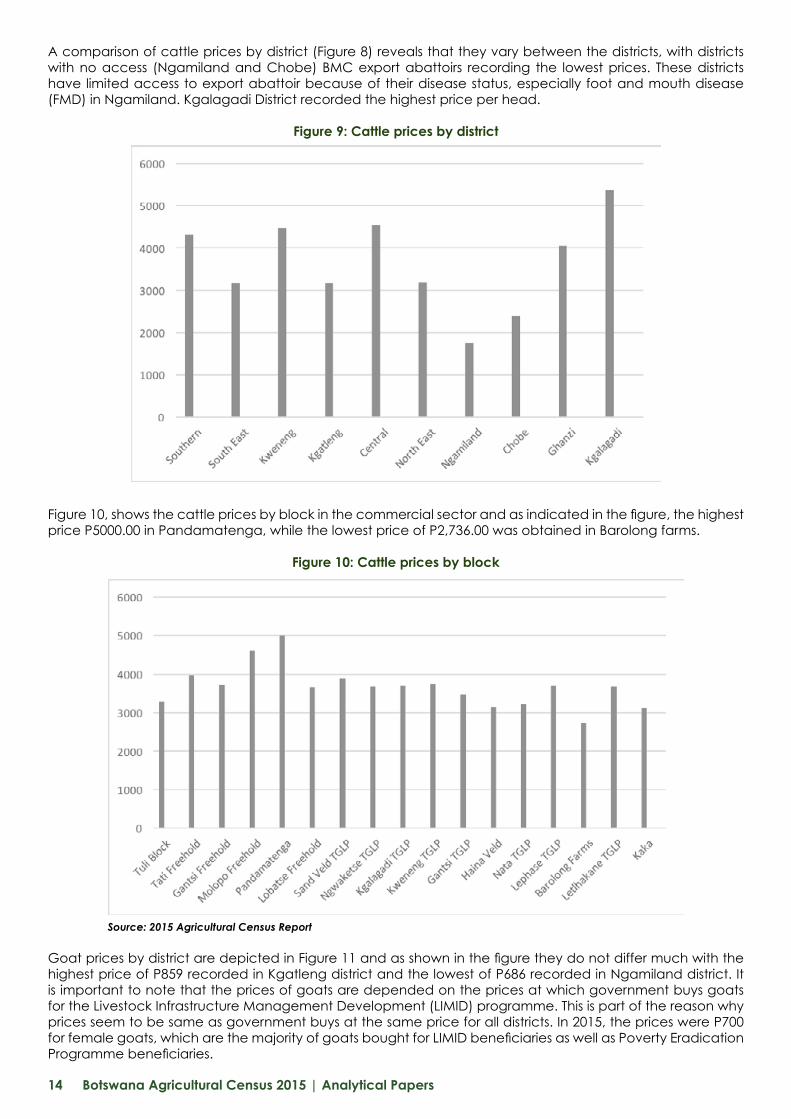
A comparison of cattle prices by district (Figure 8) reveals that they vary between the districts, with districts with no access (Ngamiland and Chobe) BMC export abattoirs recording the lowest prices. These districts have limited access to export abattoir because of their disease status, especially foot and mouth disease (FMD) in Ngamiland. Kgalagadi District recorded the highest price per head.
Figure 9: Cattle prices by district
Figure 10, shows the cattle prices by block in the commercial sector and as indicated in the figure, the highest price P5000.00 in Pandamatenga, while the lowest price of P2,736.00 was obtained in Barolong farms.
Figure 10: Cattle prices by block
Source: 2015 Agricultural Census Report
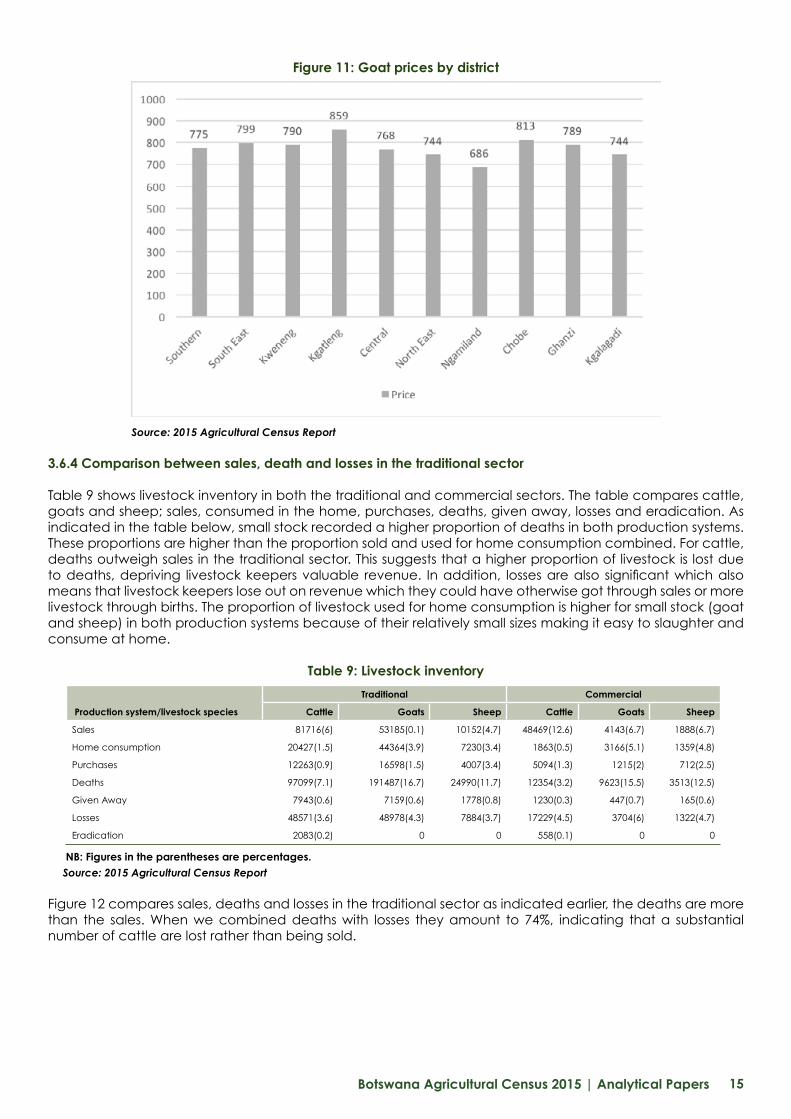
Goat prices by district are depicted in Figure 11 and as shown in the figure they do not differ much with the highest price of P859 recorded in Kgatleng district and the lowest of P686 recorded in Ngamiland district. It is important to note that the prices of goats are depended on the prices at which government buys goats for the Livestock Infrastructure Management Development (LIMID) programme. This is part of the reason why prices seem to be same as government buys at the same price for all districts. In 2015, the prices were P700 for female goats, which are the majority of goats bought for LIMID beneficiaries as well as Poverty Eradication Programme beneficiaries.
Botswana Agricultural Census 2015 | Analytical Papers 15
Figure 11: Goat prices by district
Source: 2015 Agricultural Census Report
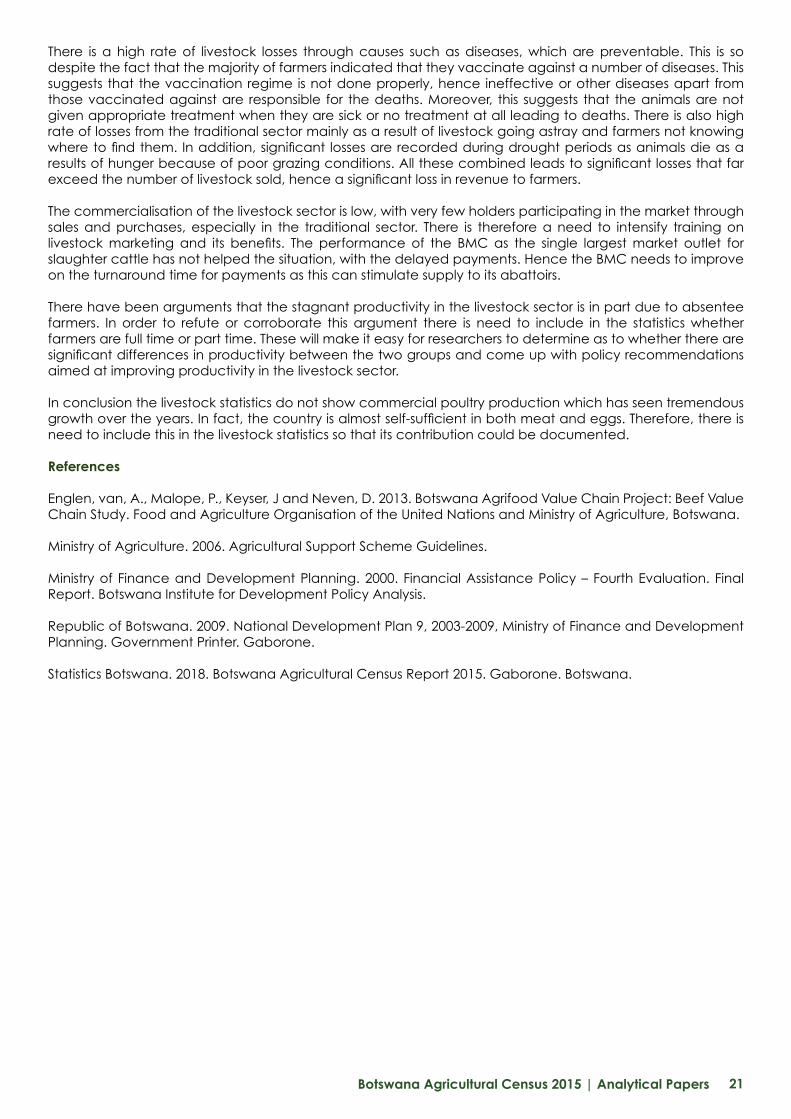
3.6.4 Comparison between sales, death and losses in the traditional sector
Table 9 shows livestock inventory in both the traditional and commercial sectors. The table compares cattle, goats and sheep; sales, consumed in the home, purchases, deaths, given away, losses and eradication. As indicated in the table below, small stock recorded a higher proportion of deaths in both production systems. These proportions are higher than the proportion sold and used for home consumption combined. For cattle, deaths outweigh sales in the traditional sector. This suggests that a higher proportion of livestock is lost due to deaths, depriving livestock keepers valuable revenue. In addition, losses are also significant which also means that livestock keepers lose out on revenue which they could have otherwise got through sales or more livestock through births. The proportion of livestock used for home consumption is higher for small stock (goat and sheep) in both production systems because of their relatively small sizes making it easy to slaughter and consume at home.
Table 9: Livestock inventory
NB: Figures in the parentheses are percentages. Source: 2015 Agricultural Census Report
Figure 12 compares sales, deaths and losses in the traditional sector as indicated earlier, the deaths are more than the sales. When we combined deaths with losses they amount to 74%, indicating that a substantial number of cattle are lost rather than being sold.
Production system/livestock species
Traditional Commercial
Cattle Goats Sheep Cattle Goats Sheep
Sales 81716(6) 53185(0.1) 10152(4.7) 48469(12.6) 4143(6.7) 1888(6.7)
Home consumption 20427(1.5) 44364(3.9) 7230(3.4) 1863(0.5) 3166(5.1) 1359(4.8)
Purchases 12263(0.9) 16598(1.5) 4007(3.4) 5094(1.3) 1215(2) 712(2.5)
Deaths 97099(7.1) 191487(16.7) 24990(11.7) 12354(3.2) 9623(15.5) 3513(12.5)
Given Away 7943(0.6) 7159(0.6) 1778(0.8) 1230(0.3) 447(0.7) 165(0.6)
Losses 48571(3.6) 48978(4.3) 7884(3.7) 17229(4.5) 3704(6) 1322(4.7)
Eradication 2083(0.2) 0 0 558(0.1) 0 0

Botswana Agricultural Census 2015 | Analytical Papers16
Figure 12: Cattle sales, deaths and losses – traditional sector
Source: 2015 Agricultural Census Report
The total revenue generated from livestock sales (cattle, goats and sheep) in 2015 stood at BWP520 million, with the major (84.4%) part of this being realized from cattle sales, especially in the traditional sector (Table 10) indicating that cattle rearing is still a dominant activity in the livestock sector.
Table 10: Total revenue generated from livestock sales
NB. Figures in parentheses are percentages Source: 2015 Agricultural Census Report
3.6.5 Livestock purchases
Table 11 shows the number of holdings, number of livestock purchased as well as the costs incurred in the traditional and commercial sectors. As indicated in the figure, the highest price for both sheep and goats observed in the commercial sector was P1, 244 and P1,075.00 per head respectively.
Table 11: Livestock purchases
Source: 2015 Agricultural Census Report
3.7 Health and herd management
One of the critical productivity indicator discussed previously is the death rate and this is depended on the health and herd management strategies that a livestock keeper employs. Livestock mortality can be as a result of several causes; diseases, hunger and others. Herd health also has important implications on the productivity of the herd, as a healthy herd is more likely to calve and wean healthy calves.
Sector Livestock species Total Revenue (BWP)
Cattle 283,078,639 (54.5)
Traditional Goats 40,521,015 (3.8)
Sheep 8,579,690 (1.7)
Cattle 181,535,925 (34.9)
Commercial Goats 4,001,572 (0.8)
Sheep 1,981,915 (0.4)
Total All 519,698,756
Sector, Livestock species
Traditional Commercial
Goats Sheep Goats Sheep
No. of holdings 3,610 793 118 75
Number purchased 16,598 4,007 1215 712
Total Costs Incurred (P) 12,227,562 3,088,830 1,305,950 885,450
Average Cost Per Holdings (P) 736.69 770.86 1,074.86 1,243,61
Average Price per Head 737 771 1,075 1,244

Botswana Agricultural Census 2015 | Analytical Papers 17
3.7.1 Major causes mortality
As indicated in Table 12, the major causes of mortality in cattle farming are diseases for both calves and mature cattle, with 53% and 59% of calves and cattle deaths respectively being caused by diseases. The second major cause of calve mortality is predators, causing 23% of calve deaths, while the second main cause of cattle mortality is drought. Similarly, the major causes of mortality for goats is diseases accounting for 62% and 61% for kids and mature goats respectively, while for sheep and lambs mortality stands at 57% and 48% respectively. The second major cause of mortality for small stock are predators. Overall, the major (48%) cause of mortality of all species are diseases, followed by predators (23%) and drought (10%). This suggests that the vaccination programme followed by farmers is not effective as majority (82%) reported that they vaccinated their animals. Alternatively, farmers may not be treating their sick animals in an appropriate manner. In addition, other diseases than those being vaccinated against such as deficiency diseases might be responsible for deaths as the majority of farmers do not supplement their livestock. Those that do supplement give poor quality feed which does not contain minerals that are lacking in Botswana pastures.
Table 12: Causes of livestock mortality in the traditional sector (%)
Source: 2015 Agricultural Census Report
3.7.2 Vaccinations
Diseases are the major cause of mortality for all livestock species suggesting that their prevention through vaccination or treatment regime undertaken are not effective. This is despite the fact that, the majority 31,225 (82%) of traditional cattle holdings reported that they vaccinated cattle as a preventive measure against livestock diseases. The major diseases vaccinated against are: black quarter (serotswana), 18,397 (24 %); anthrax, 17,270 (26 %); pasteurellosis, 8,375 (12 %); brucellosis, 7,761(11 %) and internal parasites, 7,363 (10 %). Despite the high proportion of farmers vaccinating their animals, there is still a higher proportion of livestock lost through deaths due to diseases.
3.8 Farming practices
3.8.1 Breeding methods used
Government has over the years encouraged the use of exotic breeds in order to improve the progeny of the Tswana breed. This has been done through measures such as the bull subsidy scheme, which has since been terminated, because it was felt that it was unsustainable as the exotic bulls were expensive. The current measure in place is the use of artificial insemination (AI). Under this arrangement, the Government keeps a number of bulls at its Ramatlabama camp for production of semen and there are 15 AI camps through the country which are supplied with semen from these bulls. Farmers are allowed to bring five animals to these camps for AI for a small fee of P20.00 per cow for locally collected semen and a higher price for imported semen. Famers are also trained in the use of AI for free so that they can perform it on their farms. In addition, fertility tests are performed on farmers’ bulls to be used for AI at a cost of P175 per bull. AI equipment is also sold at subsidised prices to farmers.
Nationally, only 0.8% of cattle holdings reported using AI, with 1.1% using both AI and bull service and the rest using bull service only as a breeding method. The use of a bull requires the purchase of improved bulls which are very expensive and hence out of reach for the majority of smallholder farmers who keep an average of 36 herd of cattle. AI is a cheaper option for farmers to embark upon, however its uptake is very low. It is not clear as to whether the current number of AI camps are not enough or whether farmers do not see the benefit of using AI. Government provides training to farmers on AI so that they could use it on their farms, but this initiative does not appear to have been well received by livestock farmers.
As a result of this the majority (57%) of traditional farmers keep Tswana breed of cattle, with only 37% having
Cause/Livestock species Diseases Parasites Accidents Predators Drought Others
Cattle
Calves 53 1 2 23 15 5
Cattle 59 2 4 11 21 4
Goats
Kids 62 1 1.5 19 10 5
Goats 61 1 3 2 8 6
Sheep
Lambs 57 1 2 24 9 7
Sheep 48 8 3 23 10 9

Botswana Agricultural Census 2015 | Analytical Papers18
crosses and 6% keeping exotic breeds. Within the traditional sector, the Tswana breed dominates, with the highest proportion observed in Chobe (86%), South East (85%) and North East (84%). A comparison between administrative districts reveals that a high (76%) proportion of traditional farmers with cross bred cattle are found in Gantsi, followed by Kgatleng (55%) and Kweneng (46%), with the districts with the least proportion of cross-bred cattle being South East (12%) and North East and Chobe at 14% each (Table 13). These are the smallest districts in terms of land area.
Table 13: Type of cattle breed by administrative district in the traditional sector (%)
Source: 2015 Agricultural Census Report
Table 14: Type of cattle breeds by block in the commercial sector (%)
Source: 2015 Agricultural Census Report
In the commercial sector, the use of exotic breeds is predominant indicating that farmers have taken up measures to improve their herds (Table 14). Tswana breed is still dominant in Pandamantega and Barolong farms probably because these blocks are less commercially oriented than the other blocks. In terms of breeds, crosses dominate in the commercial sector, with 47.7% of livestock keepers having cross-bred cattle. The predominant breed kept by commercial farmers is the Brahman, which is kept by 15.71% of farmers, followed by Simmental at 11.6%.
District/Breed Type Tswana Crosses Exotic
Southern 57 34 9
South East 85 12 3
Kweneng 43 46 11
Kgatleng 42 55 3
Central 59 37 4
North East 84 14 1
Ngamiland 71 27 2
Chobe 86 14 0
Gantsi 16 76 8
Kgalagadi 52 34 14
Total Traditional 57 37 6
Block Sim
me
nta
l
Cha
rolia
s
Bro
wn
Swis
s
Tuli
Bons
ma
ra
Bra
hma
n
Suss
ex
Afri
kand
er
Sant
a G
ert
rud
is
Bee
f Ma
ste
r
Cro
sse
s
Mus
i
Tsw
ana
Oth
er
Tuli Block 74 0.01 0.01 4.98 15.09 19.08 0.03 0 0 2.3 38.03 0 8.55 9.18
Tati Block 0.55 2.14 0.17 0.5 2.54 35.1 0 0.01 0.01 2.01 47.12 0.4 8.52 0.91
Gantsi Freehold 14.23 8.89 0.67 0 9.24 7.11 0.98 0.4 0.45 13.88 32.02 1.3 1.76 9.08
Molopo Freehold 6.42 0.57 0 0 32.15 6.53 1.49 0 0.01 0.1 52.73 0 0 0
Gaborone Freehold* - - - - - - - - - - - -- -
Pandamatenga 36.28 0 0 0 0 0.88 0 0 0 0 0 0 62.83 0
Lobatse Freehold 3.84 1.43 0 0 0 3.26 0 0 0 0 77.26 3.78 0.98 9.45
Sand Veld TGLP 10.01 5.56 0.28 0.11 1.81 24.4 0.37 0 1.12 0.06 53.26 2.13 0.66 0.22
Ngwaketse TGLP 16.79 3.71 0.22 0 2.09 8.59 1.18 0.4 0.29 3.56 58.63 0 4.01 0.5
Kgalagadi TGLP 16.74 2.81 0.25 0 3.53 17.09 3.58 0.45 1.2 0.94 41.07 0.95 6.09 5.31
Kweneng TGLP 29.83 8.01 2.81 0 0.83 22.31 0.87 0 3.75 2.27 18.14 0 10.95 0.25
Gantsi TGLP 16.46 3.32 0.59 0 0.04 8.77 0.76 0.01 2.04 0.45 57.43 1.05 6.95 2.12
Haina Veldt TGLP 6.78 2.88 0.96 0.07 0 10.32 0.4 2.56 0.34 7.23 54.31 0 13.83 0.32
Nata TGLP 2.48 2.73 0.04 0 4.98 53.75 1.59 0 0 0 10.54 0 14.81 9.09
Lepasha TGLP 10.17 12.15 0 0 2.44 27.65 0 0 0 0 13.64 5.09 28.87 0
Barolong Farms* 0.7 0.11 0 0.7 0.62 2.97 0 0 0 0 43 6.78 45.05 0.07
Letlhakane TGLP 13.41 4.8 0 0 0.66 14.19 0.01 0 0 1.97 62.29 0.17 2.49 0
Kaka 4.48 2.71 0.47 0 0.36 23.41 0.63 0 0.98 0.04 66.28 0.39 0.21 0.04
Total Commercial 11.6 4.49 0.53 0.23 5.23 15.71 0.83 0.4 0.83 3.69 47.73 0.86 5.35 2.53

Botswana Agricultural Census 2015 | Analytical Papers 19
Botswana developed its own composite breed, Musi in 2011. The breed is a composite of Sussex, South Devon, Santa Gertrudis and Charolais, with the Brahman used as a terminal sire. The Musi breed was developed with the objective of improving beef cattle productivity in Botswana. The 2015 census results show that farmers have not adopted the breed, with only 0.86% of commercial farmers having the breed. Since its release in 2011, the breed has been distributed to selected commercial farmers for evaluation under farm conditions and no major sales have been made except for culls through auctions. According to the Department of Agricultural Research, the breed is still being multiplied so that enough breeding stock is available for sale to farmers.
3.8.3 Feeds and types of feeds used
One of the important input in animal breeding is the adequacy and quality of feed used as it determines both the productivity and survival of animals. Botswana is prone to droughts and this leads to limited availability of natural grazing pastures and as a result animals die due to hunger. To prevent deaths as a result of hunger, livestock keepers should provide supplementary feeding to their animals. In addition, Botswana pastures especially in the sand veldt encompassing the Kalahari Desert lack certain minerals such as phosphorus especially in the dry season. This can lead to nutrition induced diseases leading to poor productivity or even deaths.
Table 15 shows the proportion of farmers who supplemented their livestock by district and reveals that overall, 44%, 32% and 45% of livestock farmers supplemented their cattle, goats and sheep respectively. There is wide variation by districts, with the highest (70%) proportion of livestock farmers using supplementary feeds for cattle being found in Kgatleng, followed by Southern (67%) and Kweneng (61%). For Goats, the highest (49%) proportion of farmers using feeds is Southern, followed by Kgalagadi and Gantsi districts at 44% and 43% respectively. Similarly, the highest proportion of sheep holdings using supplementary feed are in Southern, followed by Kgalagadi (56%) and Gantsi districts (47%).
Table 15: Proportion of livestock holdings using supplementary feeds by district
Source: 2015 Agricultural Census Report
In terms of feeds used, the most common supplementary feeds used by cattle farmers is salt, which is used by 33% of cattle holdings, followed by moroko (18%), dicalcium (14%) and the least used feed is urea which was used by 0.1% holdings. For goats supplementary feed used by most (14.7%) holdings is moroko, followed by ram and ewe pallets (8%) and salt (7.4%). The feed mostly used by sheep farmers is salt, which was used by 7.4% of sheep holdings, followed by moroko (5.8%) and ram and ewe pallets (3.7%). The least feed used by small stock farmers is molasses liquid, which is used by 0.5% of both sheep and goat holdings. Thus, most livestock keepers use cheap and hence low quality feeds such as salt and moroko.
3.8.4 Water Source
The most predominant water source for livestock in the traditional sector is borehole, with 33, 417 (55.7%) of holdings using this source, followed by river and dam. The majority (10,961 or 18.3 %) of water sources used belong to Government, followed by syndicates (10,474 or 18%) and community ownership (7,612 or 12.7%). The mostly widely used energy source for pumping water from boreholes is diesel (30,711 or 76%); followed by electricity (4,278 or 10.6%); and petrol (3,820 or 9.4%) this is despite the fact that Botswana has abundant sunlight, with approximately 300 clear days annually.
3.8.5 Labour
In terms of employment in the commercial sector, the majority (81%) of famers employ hired labour. On
District Cattle Goats Sheep
Southern 67 49 60
South East 51 29 22
Kweneng 61 41 0
Kgatleng 70 29 42
Central 35 26 35
North East 21 20 28
Ngamiland 22 26 36
Chobe 12 22 32
Gantsi 47 43 47
Kgalagadi 57 44 56
Total 44 32 45
Botswana Agricultural Census 2015 | Analytical Papers20
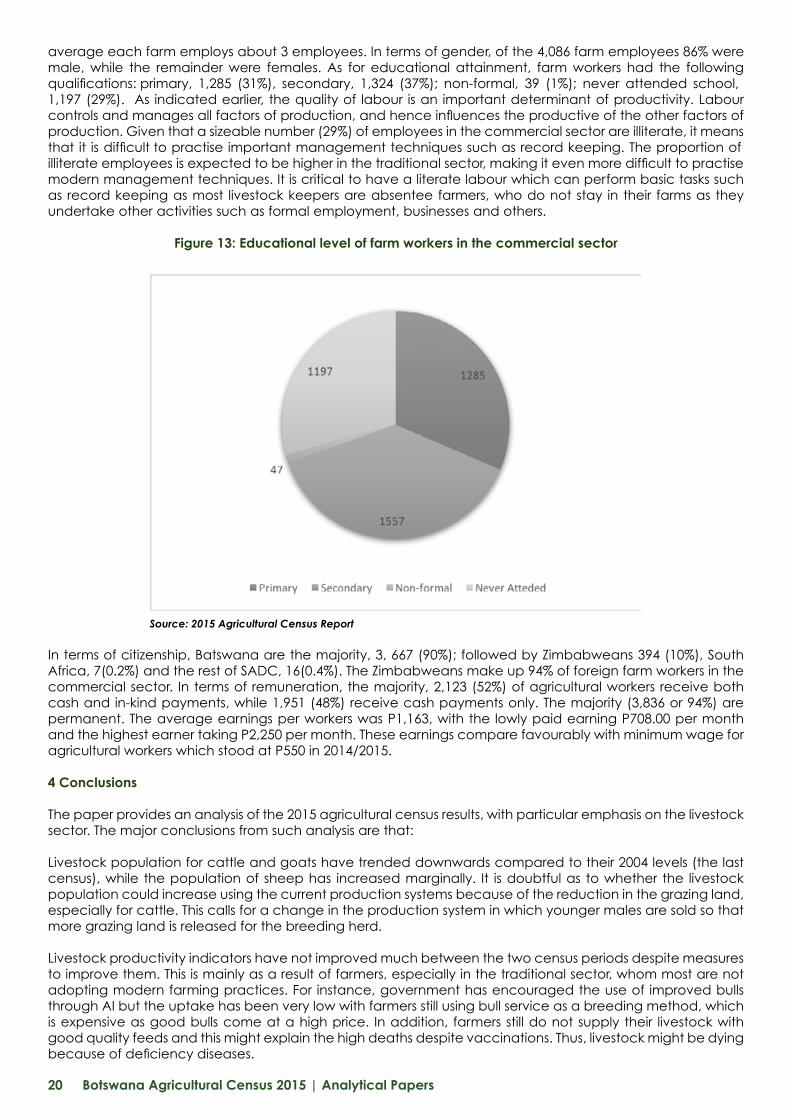
average each farm employs about 3 employees. In terms of gender, of the 4,086 farm employees 86% were male, while the remainder were females. As for educational attainment, farm workers had the following qualifications: primary, 1,285 (31%), secondary, 1,324 (37%); non-formal, 39 (1%); never attended school, 1,197 (29%). As indicated earlier, the quality of labour is an important determinant of productivity. Labour controls and manages all factors of production, and hence influences the productive of the other factors of production. Given that a sizeable number (29%) of employees in the commercial sector are illiterate, it means that it is difficult to practise important management techniques such as record keeping. The proportion of illiterate employees is expected to be higher in the traditional sector, making it even more difficult to practise modern management techniques. It is critical to have a literate labour which can perform basic tasks such as record keeping as most livestock keepers are absentee farmers, who do not stay in their farms as they undertake other activities such as formal employment, businesses and others.
Figure 13: Educational level of farm workers in the commercial sector
Source: 2015 Agricultural Census Report
In terms of citizenship, Batswana are the majority, 3, 667 (90%); followed by Zimbabweans 394 (10%), South Africa, 7(0.2%) and the rest of SADC, 16(0.4%). The Zimbabweans make up 94% of foreign farm workers in the commercial sector. In terms of remuneration, the majority, 2,123 (52%) of agricultural workers receive both cash and in-kind payments, while 1,951 (48%) receive cash payments only. The majority (3,836 or 94%) are permanent. The average earnings per workers was P1,163, with the lowly paid earning P708.00 per month and the highest earner taking P2,250 per month. These earnings compare favourably with minimum wage for agricultural workers which stood at P550 in 2014/2015.
4 Conclusions
The paper provides an analysis of the 2015 agricultural census results, with particular emphasis on the livestock sector. The major conclusions from such analysis are that:
Livestock population for cattle and goats have trended downwards compared to their 2004 levels (the last census), while the population of sheep has increased marginally. It is doubtful as to whether the livestock population could increase using the current production systems because of the reduction in the grazing land, especially for cattle. This calls for a change in the production system in which younger males are sold so that more grazing land is released for the breeding herd.
Livestock productivity indicators have not improved much between the two census periods despite measures to improve them. This is mainly as a result of farmers, especially in the traditional sector, whom most are not adopting modern farming practices. For instance, government has encouraged the use of improved bulls through AI but the uptake has been very low with farmers still using bull service as a breeding method, which is expensive as good bulls come at a high price. In addition, farmers still do not supply their livestock with good quality feeds and this might explain the high deaths despite vaccinations. Thus, livestock might be dying because of deficiency diseases.
Botswana Agricultural Census 2015 | Analytical Papers 21
There is a high rate of livestock losses through causes such as diseases, which are preventable. This is so despite the fact that the majority of farmers indicated that they vaccinate against a number of diseases. This suggests that the vaccination regime is not done properly, hence ineffective or other diseases apart from those vaccinated against are responsible for the deaths. Moreover, this suggests that the animals are not given appropriate treatment when they are sick or no treatment at all leading to deaths. There is also high rate of losses from the traditional sector mainly as a result of livestock going astray and farmers not knowing where to find them. In addition, significant losses are recorded during drought periods as animals die as a results of hunger because of poor grazing conditions. All these combined leads to significant losses that far exceed the number of livestock sold, hence a significant loss in revenue to farmers.
The commercialisation of the livestock sector is low, with very few holders participating in the market through sales and purchases, especially in the traditional sector. There is therefore a need to intensify training on livestock marketing and its benefits. The performance of the BMC as the single largest market outlet for slaughter cattle has not helped the situation, with the delayed payments. Hence the BMC needs to improve on the turnaround time for payments as this can stimulate supply to its abattoirs.
There have been arguments that the stagnant productivity in the livestock sector is in part due to absentee farmers. In order to refute or corroborate this argument there is need to include in the statistics whether farmers are full time or part time. These will make it easy for researchers to determine as to whether there are significant differences in productivity between the two groups and come up with policy recommendations aimed at improving productivity in the livestock sector.
In conclusion the livestock statistics do not show commercial poultry production which has seen tremendous growth over the years. In fact, the country is almost self-sufficient in both meat and eggs. Therefore, there is need to include this in the livestock statistics so that its contribution could be documented.
References
Englen, van, A., Malope, P., Keyser, J and Neven, D. 2013. Botswana Agrifood Value Chain Project: Beef Value Chain Study. Food and Agriculture Organisation of the United Nations and Ministry of Agriculture, Botswana.
Ministry of Agriculture. 2006. Agricultural Support Scheme Guidelines.
Ministry of Finance and Development Planning. 2000. Financial Assistance Policy – Fourth Evaluation. Final Report. Botswana Institute for Development Policy Analysis.
Republic of Botswana. 2009. National Development Plan 9, 2003-2009, Ministry of Finance and Development Planning. Government Printer. Gaborone.
Statistics Botswana. 2018. Botswana Agricultural Census Report 2015. Gaborone. Botswana.

Botswana Agricultural Census 2015 | Analytical Papers22