boulder county real estate statistics june 2015
TRANSCRIPT
Boulder County Real Estate Sales Statistics June 2015
Presented by Neil Kearney, MBA, CRS303.818.4055
www.NeilKearney.com
Copyright 2015 Neil Kearney, Kearney Realty Co.

Sales were slightly up for the month. YTD sales
are up 7%.

Inventory increased again this month but it’s still significantly
lower than past years.

This chart shows how tight the market has been this
year. Sales have increased and there have been fewer
listings – resulting in a super high U/C %. At the end of June 51% of the
homes on the MLS were already under contract.
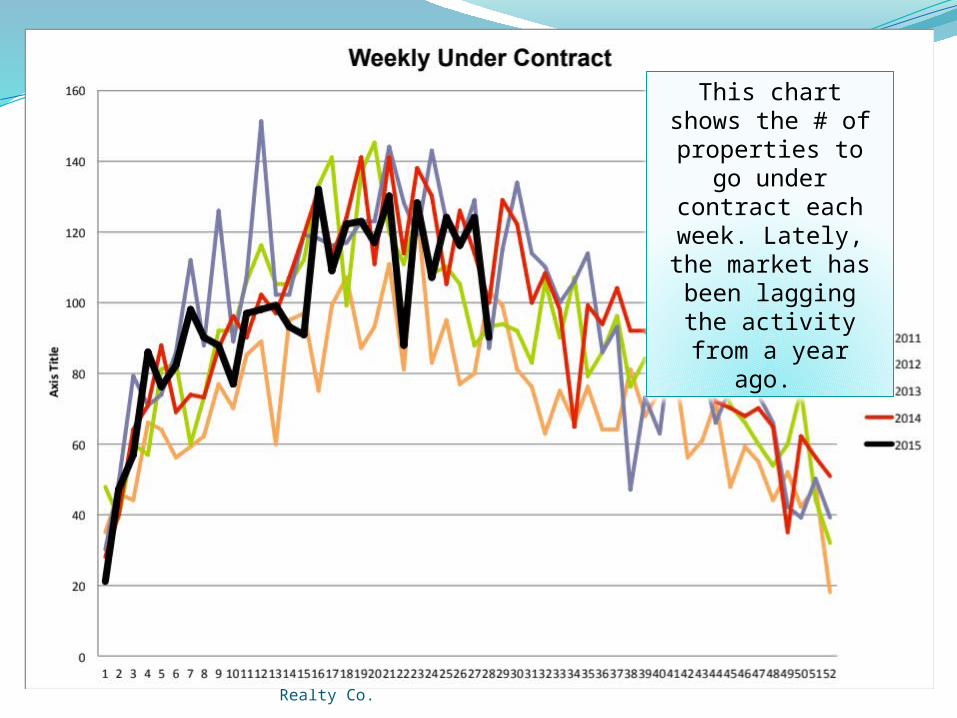
This chart shows the # of
properties to go under contract
each week. Lately, the market has
been lagging the activity from a
year ago.

New listing activity is
increasing but it is still behind the past few years.

Sales through the first half of 2015 are up 7% from a
year ago.
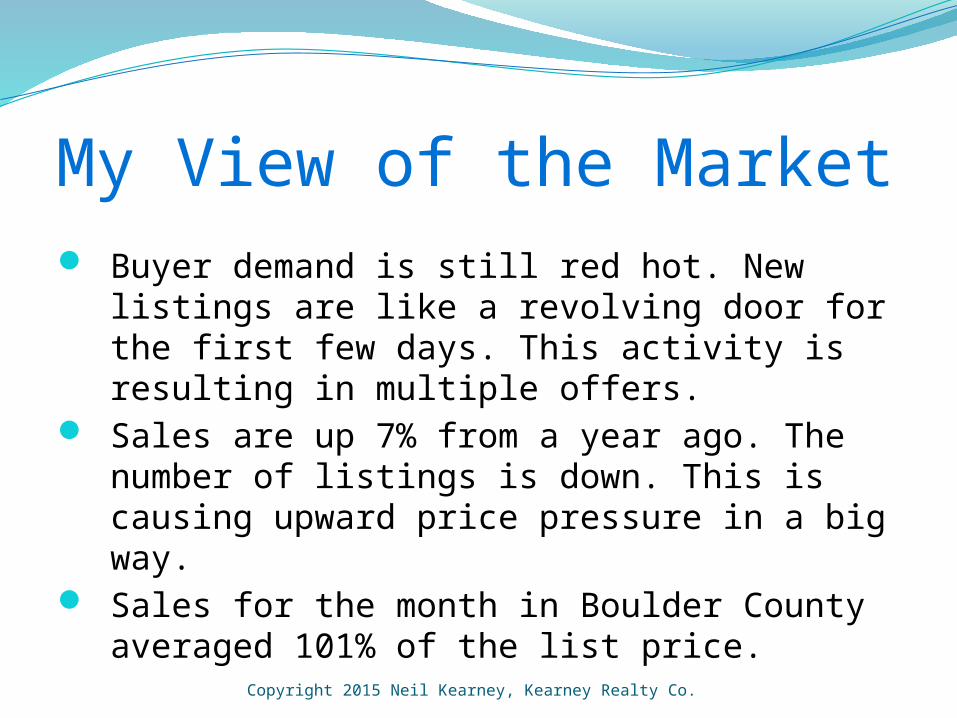
My View of the Market Buyer demand is still red hot. New listings
are like a revolving door for the first few days. This activity is resulting in multiple offers.
Sales are up 7% from a year ago. The number of listings is down. This is causing upward price pressure in a big way.
Sales for the month in Boulder County averaged 101% of the list price.
Copyright 2015 Neil Kearney, Kearney Realty Co.

If You Plan To Make a Move Plan to call the area expert.
Copyright 2015 Neil Kearney, Kearney Realty Co.