boyeraff 011417 - wordpress.com
TRANSCRIPT


Exhibit A

Gregory L. Boyer Faculty of Chemistry, State University of New York
College of Environmental Science and Forestry Syracuse, NY 13210
Contact: Email: [email protected] Telephone: (315) 470-6825 FAX: (315) 470-6855 RESEARCH INTERESTS The chemistry and biochemistry of biologically active natural products from plants and algae including toxins, siderophores, allelopathic agents, and growth regulators. Special interests include the chemistry / ecology of marine and freshwater harmful algal blooms such as cyanobacteria in large lake ecosystems, automated monitoring systems for these blooms, rapid detection methods for toxic cyanobacteria and paralytic shellfish poisoning (PSP) toxins, large scale algal culture facilities for bioproducts productions, and the biochemistry of iron in forest and aquatic (marine and freshwater) ecosystems.
EDUCATION: Ph.D., University of Wisconsin - Madison, 1980, (Biochemistry). A.B., University of California - Berkeley, 1975, (Biochemistry). A.S., Reedley College (Reedley, Calif.), 1973, (Chemistry).
PROFESSIONAL EXPERIENCE: 2007-present: Director, Great Lakes Research Consortium, Syracuse, NY 13210 1998-present: Professor of BioChemistry, State University of New York, College of Environmental
Science and Forestry, (SUNY-ESF) Syracuse NY 13210. 2011-2014: Chair, Department of Chemistry, SUNY-ESF. 2010 E.T.S. Walton Visiting Professor, Cork Institute of Technology, Cork, Ireland 1991-1998 Associate Professor of Chemistry, SUNY-ESF. 1994 Visiting Scientist, Biology Dept., Woods Hole Oceanographic Institute, Woods Hole, MA 1986-1991 Joint Academic Appointment in the Faculty of Environmental Sciences, SUNY-ESF. 1985-1990 Assistant Professor of Chemistry, SUNY-ESF. 1983-1984 Research Associate, Dept. of Oceanography, Univ. of British Columbia, Vancouver, BC. 1980-1982 Research Associate, Michigan State Univ. - DOE, Plant Research Labs. East Lansing, MI. 1975-1980 Research Assistant, Department of Biochemistry, University of Wisconsin, Madison, WI.
HONORS and Supporting Activities: Life member; Phi Beta Kappa - Alpha (UC-Berkeley Honor Soc.) and Alpha Gamma Sigma (Reedley College Honor Soc.), International Expert for IAEA (International Atomic Energy Agency) on PSP toxins (1999), Participant in EPA’s “Creating a Cyanotoxin Target List for the Unregulated Contaminant Monitoring Rule” taskforce (2001), Participant in NOAA workshop entitled “Developing a National Plan for Remediation of Harmful Algal Blooms”, Steering committee for “National Plan for Marine Biotoxins-2004; Elected member of the US National Harmful Algal Bloom Advisory Committee (2005-2008), Invited External Reviewer for EPA Toxicological Reviews of Cyanobacteria Toxins (2007), Elected to the Governing Body of the Northeast Algal Society 1999-2017; Recipient; State University of New York Research Foundations 2003 Award for Excellence in the Pursuit on Knowledge. Recipient; 2005 ESF award for integrating outreach activities with Teaching and Research. Recipient; ESF 2009 Exemplary Researcher Award ; Recipient; 2010 Science Foundation of Ireland E.T.S. Walton Visiting Professorship, Chief Scientist, Centers for Excellent in Ocean Science Education (COSEE) research cruises 2005, 2008 and 2009, Participate in more than 25 International Research Cruises (eight times as Senior or lead Scientist), Member of International Joint Commission’s Council of Research Managers and New York’s Great Lakes Basin Advisory Committee. Recipient; 2015 Lake Tear of the Clouds Award for outstanding service to the New York State Federal of Lake Associations. Recipient: 2016 Chancellors Award for Excellence in Faculty Service.
SELECTED PROFESSIONAL SOCIETIES: American Society of Limnology and Oceanography, North East Algal Society, International Association for Great Lakes Research, International, Society for the Study of Harmful Algal Blooms, North American Lake Management Society.
PUBLICATIONS OF GREGORY L. BOYER: 1. Boyer, G.L., E.J. Schantz, and H.K. Schnoes (1978) Characterization of 11-hydroxysaxitoxin
sulfate, a major toxin in scallops exposed to blooms of the poisonous dinoflagellate, Gonyaulax tamarensis. J.C.S. Chem. Comm. 20: 889-890.
2. Boyer, G.L., C.F. Wichmann, J. Mosser, E.J. Schantz, and H.K. Schnoes (1979) Toxins isolated from Bay of Fundy Scallops. In: Toxic Dinoflagellate Blooms, D.L. Taylor, H.H. Seliger, eds. Elsevier-North Holland, New York. pp. 373-376.
3. Wichmann, C.F., C.L. Divan, G.L. Boyer, E.J. Schantz, and H.K. Schnoes (1981) Neurotoxins from Gonyaulax excavata and the Bay of Fundy scallops. Tetrahedron Letters 22(21): 1941-1944.
4. Boyer, G.L. and J.A.D. Zeevaart (1982) Isolation and quantitation of B-D-glucopyranosyl abscisate from leaves of Xanthium and Spinach. Plant Physiol. 70: 227-231.
5. Zeevaart, J.A.D. and G.L. Boyer (1982) Metabolism of abscisic acid in Xanthium strumarium and Ricinus communis. In: Plant Growth Substances 1982, P.F. Wareing, ed. Springer Verlag, New York, pp. 335-342.
6. Zeevaart, J.A.D. and G.L. Boyer (1984) Accumulation and transport of abscisic acid and its metabolites in Ricinus and Xanthium. Plant Physiol. 74: 934-939.
7. Hall, S., S.D. Darling, G.L. Boyer, P.B. Reichardt, and H.-W. Liu (1984) Dinoflagellate neurotoxins related to saxitoxin: Structures of toxins C3 and C4, and confirmation of the structure of neosaxitoxin. Tetrahedron Letters 25(33): 3537-3538.
8. Boyer, G.L. and J.A.D. Zeevaart (1986) 7'-hydroxy abscisic acid; an artifact of feeding racemic abscisic acid to Xanthium strumarium. Phytochemistry 25: 1103-1105.
9. Boyer, G.L., J.J. Sullivan, R.J. Andersen, P.J. Harrison, and F.J.R. Taylor (1986) Toxin production in three isolates of Protogonyaulax sp. In: Toxic Dinoflagellates, D.M. Anderson, A.W. White, and D.G. Baden, eds., Elsevier, pp 281-286.
10. *Boyer, G.L., J.J. Sullivan, M. LeBlanc, and R.J. Andersen (1986) The assimilation of PSP toxins by the copopod Tigriopus from dietary Protogonyaulax tamarensis. In: Toxic Dinoflagellates, D.M. Anderson, A.W. White, and D.G. Baden, eds., Elsevier, pp 407-412.
11. Zeevaart, J.A.D., G.L. Boyer, K. Cornish, and R. Creelman (1986) Metabolism of abscisic acid. In: Plant Growth Substances 1985, M. Bopp, ed., Springer-Verlag, pp. 101-107.
12. Boyer, G.L., J.J. Sullivan, R.J. Andersen, F.J.R. Taylor, P.J. Harrison, and A.D. Cembella (1986) The use of HPLC to investigate the production of paralytic shellfish toxins by Protogonyaulax sp. in culture. Mar. Biol. 93: 361-369.
13. Boyer, G.L., B.V. Milborrow, P.F. Wareing, and J.A.D. Zeevaart (1986) The nomenclature of abscisic acid and its metabolites. In; Plant Growth Substances 1985, M. Bopp, ed., Springer-Verlag, pp. 99-100.
14. Boyer, G.L., A.H. Gillam, and C.G. Trick (1987) Iron Ecology and Uptake. In: The Cyanobacteria - A Comprehensive Review, P. Fay and C. van Baalen, eds., Elsevier Biomedical, pp. 415-436.
15. Zeevaart, J.A.D., and G.L. Boyer (1987) Photoperiodic Induction and the Floral Stimulus in Perilla. In: The Manipulation of Flowering, J.G. Atherton, ed. Butterworths, London, pp. 269-277.
16. Cembella, A.D., J.J. Sullivan, G.L. Boyer, F.J.R. Taylor, and R.J. Andersen (1987) Toxin variability within the Protogonyaulax tamarensis / catenella species complex. Biochem. Syst. Ecol. 15:171-186.
17. Whitefleet, J., G.L. Boyer, and H.K. Schnoes (1987) Isolation and spectral characteristics of four toxins from the dinoflagellate Ptychodiscus brevis. Toxicon 24:1075-1090.
18. Boyer, G.L., J.J. Sullivan, R.J. Andersen, P.J. Harrison, and F.J.R. Taylor (1987) The effects of nutrient limitation on toxin production in Protogonyaulax tamarensis. Marine Biol. 96: 123-128.
19. Boyer, G.L. and S.S. Dougherty (1988) Identification of abscisic acid in the seaweed Ascophyllum nodosum. Phytochemistry, 27: 1521-1522.
20. Omholt, T.E. and G.L. Boyer (1988) The reduction of iron in squash callus cultures. J. Plant Nutr., 11(6-11): 1227-1235.
21. Doucette, G.J., A.D. Cembella, and G.L. Boyer (1989) Cyst formation in the red tide dinoflagellate Alexandrium tamarensis (Dinophyceae): Effects of iron stress. J. Phycol., 25: 721-731.
22. Boyer, G.L. (1989) Chlorophyll and phytoplankton dynamics of Beaver Lake. In: "Beaver Lake 1988" J.M. Hassett, Ed. SUNY College of Environmental Science and Forestry, Syracuse pp 104-124.
23. Speirs, R.J., and G.L. Boyer (1991) Analysis of 55-Fe Labeled hydroxamate siderophores by high-performance liquid chromatography. J. Chrom. 537:259-267.
24. Boyer, G.L. (1991) HPLC separation of Iron Chelators. J. Chromato. Science. 29:319 25. Boyer, G.L., and D.J. Nicholson (1991) Occurrence of abscisic acid in unicellular green algae.
Plant Physiol. 96s:76. 26. Aronson, D.B., and G.L. Boyer (1992) Frankia produces a hydroxamate siderophore under iron
limitation. J. Plant Nutr. 15:2193-2201. 27. Freeman, R.A. and G.L. Boyer (1992) Solid phase extraction techniques for the isolation of
siderophores from aquatic environments. J. Plant Nutr. 15:2263-2275. 28. Janiszewski, J. and G.L. Boyer (1993) The electrochemical oxidation of saxitoxin and derivatives:
its application to the HPLC analysis of PSP toxins. In "Toxic Phytoplankton Blooms in the Sea" T. Symeda and Y. Shimizu, (Eds.), Elsevier Science Publishers, pages 889-894.
29. Boyer, G. L., and D. B. Aronson (1994) Iron uptake and siderophore formation in the actinorhizal symbiont Frankia. In: "The Biochemistry of Metal Micronutrients in the Rhizosphere" J.A. Manthey, D.E. Crowley, D.G. Luster, Eds., Lewis Publ., Chelsea, MI., pp. 41-54.
30. Aronson, D. B., and G. L. Boyer (1994) Growth and Siderophore formation in six iron-limited strains of Frankia. Soil Biol. Biochem. 26: 561-567.
31. Hu, X., and G. L. Boyer (1995) Isolation and characterization of the siderophore N-deoxyschizokinen from Bacillus megaterium ATCC 19213. BioMetals. 8:357-364.
32. Prabhu, V., H. Wilcox, and G. Boyer (1995) Properties of Nitrate Reductase from the mycorrhizal ascomycete Wilcoxina mikolae var mikaloe. Mycol. Res. 99:1356-1360.
33. Boyer, G. L. (1995) Role of Iron in Brown Tides: An Overview. In: "Proceedings of the Brown Tide Summit, October 20-21, 1995", A. McElroy, (ed.), New York Sea Grant Institute; Stony Brook, NY. pp. 49-51.
34. Prabhu, V., P. Biolchini, and G. L. Boyer (1996) Detection and identification of ferricrocin produced by ectendomycorrhizal fungi in the genus Wilcoxina. Biometals. 9:229-234.
35. Hu, X., and G. L. Boyer (1996) Effect of metal ions on the quantitative determination of hydroxamic acids. Anal. Chem. 68:1812-1815.
36. Prabhu, V., H. Wilcox, and G. Boyer (1996) Regulation of nitrate reductase in the mycorrhizal ascomycete fungus Wilcoxina mikolae var mikolae. Mycol. Res. 100: 333-336.
37. Hu, X., and G. L. Boyer (1996) Siderophore-mediated aluminum uptake by Bacillus megaterium ATCC 19213. Appl. Environ. Microbiol. 62:4044-4048.
38. Boyer, G. L., and X. Hu (1996) The electrochemical detection of PSP toxins. Can. Tech. Rep. Fish. Aquat. Sci. #2138:1-5.

39. Boyer, G. L., J. J. Janiszewski, and X. Hu (1997) A comparison of Electrochemical Methods for the HPLC analysis of PSP toxins. In: "Harmful Microalgae" B. Reguera, J. Blanco, M. L. Fernandez, and T. Wyatt, (eds.), Xunta del Galicia, Vigo Spain., pp 515-518.
40. Boyer, G. L., and L. Brand (1998) Micro nutrient availability and trace metal chelator interactions. NATO ASI Physiological Ecology of Harmful Algal Blooms, pp. 489-508.
41. Giner, J.-L., and G. L. Boyer (1998) Sterols of the Brown Tide Alga Aureococcus anophagefferens. Phytochemistry. 48:479-484.
42. Boyer, G. L., and G. D. Goddard (1999) High performance liquid chromatography (HPLC) coupled with post-column electrochemical oxidation (ECOS) for the detection of PSP toxins. In: "Advances in Detection methods for Fungal and Algal Toxins" F. M. Van Dolah, and J. L. Richard, Eds., Gordon Research Satellite Conference, Mt Desert Island, June 17-19.
43. Boyer, G. L., S. A. Kane, J. A. Alexander, and D. B. Aronson (1999) Siderophore formation in iron-limited cultures of Frankia sp. 52065 and Frankia sp. CeSI5. Can. J. Bot. 77:1316-1320.
44. Boyer, G. L., D. B. Szmyr, and J. A. Alexander (1999) Iron and Nitrogen nutrition in the Brown tide organism Aureococcus anophagefferens. In: J.L. Martin and K. Haya (eds) Proceedings of the Sixth Canadian Workshop on Harmful Marine Algae. Can Tech Rep. Fish. Aquat. Sci. 2261:11-13.
45. Goddard, G., and G. L. Boyer (1999) High performance liquid chromatography (HPLC) coupled with post-column electrochemical oxidation (ECOS) for the detection of PSP toxins. Natural Toxins. 7:353-359.
46. Goddard, G., K. Haya, and G. L. Boyer (1999) Evaluation of the electrochemical oxidation system for the analysis of PSP toxins in natural shellfish samples. In: J.L. Martin and K. Haya (eds.) Proceedings of the Sixth Canadian Workshop on Harmful Marine Algae Can. Tech. Rep. Fish. Aquat. Sci. 2261:58-62
47. Bates, S. S., C. Leger, M. Satchwell, and G. L. Boyer (2001) The effects of iron on domoic acid production by Pseudo-nitzschia multiseries. In: "Harmful Algal Blooms 2000" S.I. Blackburn G.M. Hallegraeff, C.J. Bolch, R.J. Lewis, ed., p. 320-323.
48. Giner, J-L., X. Li, and G. L. Boyer (2001) Sterol composition of Aureoumbra legunensis, the Texas brown tide alga. Phytochemistry, 57:787-789.
49. Goddard, G. D., and G. L. Boyer (2001) A comparison of HPLC with electrochemical oxidation, HPLC with chemical oxidation, and the mouse bioassay for the analysis of PSP toxins in shellfish. In: "Harmful Algal Blooms 2000", G.M. Hallegraeff, S.I. Blackburn, C.J. Bolch, R.J. Lewis, ed., p. 261-265.
50. Nichols, D. B., M. F. Satchwell, J. E. Alexander, N. M. Martin, M. T. Baesl, and G. L. Boyer (2001) Iron nutrition in the brown tide algae, Aureococcus anophagefferens: Characterization of a ferric chelate reductase activity. In: "Harmful Algal Blooms 2000", G.M. Hallegraeff, S.I. Blackburn, C.J. Bolch, R.J. Lewis, ed., p. 340-343.
51. Baker, T. R., G. J. Doucette, C. L. Powell, G. L. Boyer, and F. G. Plumley (2003) Characterization of fluorescent compounds from Pseudomonas stutzeri SF/PS and Pseudomonas/Altermonas PTB-1, bacteria associated with Alexandrium spp. and paralytic Shellfish Poisoning. Toxicon 41:339-347.
52. Giner, J.-L., J.A. Farldos, G.L. Boyer (2003) Unique sterols of the toxic dinoflagellate Gymnodinium breve and a proposed defensive function for unusual marine sterols, J. Phycol. 39:1-6
53. Satchwell, M. F., and G. L. Boyer (2003) Comparison of three methods for the detection of microcystin cyanobacterial toxins: In “Harmful Algae 2002” , K. A. Steidinger, J.H. Landsberg, C.R.Tomas, G. A. Vargo, eds, p 169-171.

54. Boyer, G., M. C. Watzin, A. D. Shambaugh, M. F. Satchwell, B. R. Rosen, and T. Mihuc (2004) The occurrence of cyanobacterial toxins in Lake Champlain. In: "Lake Champlain: partnerships and Research in the New Millennium. (Proceedings of the Lake Champlain Research Consortium, May 20th 2002, Saint-Jean-sur-Richelieu, Quebec" T. Manley, Ed., p 241-257.
55. Lehman, P. W., S. Waller, G. Boyer, and K. Gehrts (2004) Distribution and toxicity of a new Microcystis aeruginosa bloom in the upper San Francisco Bay region. Report prepared for NOAA Coastal Ocean Program Monitoring and Event Response for Harmful Algal Blooms. 17 p.
56. Lehman, P., G. Boyer, C. Hall, S. Waller, and K. Gerhts (2004) Distribution and toxicity of a new colonial Microcystis aeruginosa bloom in San Francisco Estuary, California. Hydrobiology. 541:87-99.
57. Patchett, E.A. M.F. Satchwell, J. Alexander, and G.L. Boyer (2004) The effects of Iron Limitation on Growth and PSP toxin Production in Alexandrium fundyense. In “Harmful Algae 2002” , K. A. Steidinger, J.H. Landsberg, C.R.Tomas, G. A. Vargo, eds, p 213-215.
58. Atkinson, J. F., M. L. Green, M. Sultan, R. Becker, and G. L. Boyer (2005) Monitoring algal blooms in the Great Lakes. In: "Proceedings, 8th International Conference of Remote Sensing for Marine and Coastal Environments, Halifax, Nova Scotia, Canada, May 17-19, 2005" missing page numbers
59. Becker, R., M. Sultan, J. Atkinson, G. Boyer, and E. Konopko (2005) Spatial and temporal variations of algal blooms in the lower Great Lakes. In: "Proceedings, 8th International Conference on Remote Sensing for marine and Coastal Environments, Halifax, Nova Scotia, Canada, May 17-19, 2005 missing page numbers
60. Hotto, A., M. Satchwell, and G. Boyer (2005) Seasonal Production and Molecular Characterization of Microcystins in Oneida Lake, New York, USA. Environmental Toxicology. 20:243-248.
61. Gobler, C. J., D. J. Lonsdale, and G. L. Boyer (2005) A review of causes, effects, and potential management of harmful brown tide blooms caused by the alga Aureococcus anophagefferens (Hargraves et Sieburth). Estuaries. 28:726-749
62. Mihuc, T. B., G. L. Boyer, M. F. Satchwell, M. Pellam, J. Jones, J. Vasile, A. Bouchard, and R. Bonham (2005) 2002 Phytoplankton community composition and cyanobacterial toxins in Lake Champlain, U.S.A. Verh. Internat. Verein. Limnol. 39:328-333
63. Rinta-Kanto, J. M., A. J. A. Ouellette, M. R. Twiss, G. L. Boyer, T. Bridgeman, and S. W. Wilhelm (2005) Quantification of toxic Microcystis spp. during the 2003 and 2004 blooms in western Lake Erie using quantitative real-time PCR. Environ. Sci. Technol. 39:4198-4205.
64. Zou, G., and G. L. Boyer (2005) Synthesis and Properties of different metal Complexes of the siderophore desferriferricrocin. Biometals, 18:63-74
65. Boyer, G. (2006) Toxic Cyanobacteria in Large Lake Ecosystems. LakeLine.26(2):36-39 66. Boyer, G. L. (2006) Introduction. In: GLRC Great Lakes Research Review. 7:1. 67. Boyer, G. L. (2006) Toxic Cyanobacteria in the Great Lakes: More than just the Western Basin of
Lake Erie. GLRC Great Lakes Research Review. 7:2-7. 68. Becker, R., M. Sultan, G. Boyer, and E. Konopko (2006) Mapping variations of algal blooms in the
Lower Great Lakes. GLRC Great Lakes Research Review. 7:14-17. 69. Makarewicz, J. C., G. L. Boyer, W. Guenther, M. Arnold, and T. W. Lewis (2006) The occurrence
of cyanotoxins in the nearshore and coastal embayments of Lake Ontario. GLRC Great Lakes Research Review. 7:25-31.
70. Mihuc, T. B., G. L. Boyer, J. Jones, M. F. Satchwell, and M. C. Watzin (2006) Lake Champlain phytoplankton and algal toxins: past and present. GLRC Great Lakes Research Review. 7:18-21.
71. Boyer, G. L. (2007) The occurrence of Cyanobacterial toxins in New York lakes: Lessons for the MERHAB-Lower Great lakes program. Lake Reservoir Management. 23: 153-160.
72. Boyer, G. L., E. Konopko, and H. Gilbert (2007) Rapid field-based monitoring systems for the detection of Toxic cyanobacteria blooms, ImmunoStrips and Fluorescence-based monitoring systems. In: "Proceedings, 12th International Conference Harmful Algae" Moestrup et al., Ed., Springer, pp. 341-343.
73. Gobler, C. J., T. W. Davis, K. J. Coyne, and G. L. Boyer (2007) Interactive influences of toxin expression, nutrient loading and zooplankton grazing on the growth and toxicity of cyanobacteria blooms in eutrophic Lake Agawam, New York. Harmful Algae, 6:119-133.
74. Hotto, A. M., M. F. Satchwell, and G. L. Boyer (2007) Characterization of Lake Ontario Embayments for potential microcystin production reveals a unique mcyA genotype. Appl. Environ. Microbiol. 73(14):4570-4578
75. Howard, K. L., and G. L. Boyer (2007) Adduct simplification in the analysis of cyanobacterial toxins by matrix-assisted laser desorption/ionization mass spectrometry. Rapid Comm. Mass Spectrom. 21:699-706
76. Howard, K. L., and G. L. Boyer (2007) Quantitative analysis of cyanobacterial toxins by Matrix-assisted Laser Desorption/Ionization mass spectrometry. Analytical Chemistry. 79:5980-5986
77. Richardson, L. L., R. Sekar, J. L. Myers, M. Gantar, J. D. Voss, L. Kaczmarsky, E. R. Remily, G. L. Boyer, and R. V. Zimba (2007) Production of the cyanobacterial toxin microcystin in black band disease of corals. FEMS Microbiology Letters. 272: 182-187
78. Boyer, G. L. (2008) Cyanobacterial Toxins in New York and the Lower Great Lakes Ecosystems. In: "Proceedings of the Interagency International Symposium on Cyanobacterial Harmful Algal Blooms" H. K. Hudnell, Ed., Adv. Exp. Med. Biol., Vol 619 pp 151-163.
79. Fristachi, A., J. L. Sinclair, J. A. Hambrook-Berkman, G. Boyer, J. Burkholder, J. Burns, W. Carmichael, A. du Four, W. Frazier, S. L. Morton, E. O'Brien, and S. Walker (2008) Occurrence of Cyanobacterial Harmful Algal Blooms working group report. In: "Proceedings of the Interagency International Symposium on Cyanobacterial Harmful Algal Blooms" H. K. Hudnell, Ed., Adv. Exp. Med. Biol., Vol 619 pp. 37-97
80. Gouvea, S. P., G. L. Boyer, and M. R. Twiss (2008) Influence of ultraviolet radiation, copper, and zinc on microcystin content in Microcystis aeruginosa (Cyanobacteria). Harmful Algae.7:194-205.
81. Hotto, A. M., M. F. Satchwell, D. L. Berry, C. J. Gobler, and G. L. Boyer (2008) Spatial and temporal diversity of microcystins and microcystin-producing genotypes in Oneida Lake, NY. Harmful Algae. 7: 671-681.
82. Lehman, P., G. L. Boyer, M. F. Satchwell, and S. Waller (2008) The influence of environmental conditions on the seasonal variation of Microcystis aeruginosa cell density and microcystins concentration in the San Francisco Estuary. Hydrobiology, 600:187-204.
83. Mihuc, T. B., C. Pershyn, S. Thomas, G. Boyer, M. Satchwell, J. Jones, E. Allen, and M. Greene (2008) Cyanobacteria and the sixth Great lake: community dynamics of toxic algal blooms in Lake Champlain, USA. Verh. Internat. Verein. Limnol. 30:312-317.
84. Smith, J. L., G. L. Boyer, E. Mills, and K. L. Schulz (2008) Toxicity of microcystin-LR, a cyanobacterial toxin, to multiple life stages of the burrowing mayfly, Hexagenia, and possible implications for recruitment. Aquat. Toxicol., 23(4) 499-506
85. Smith, J. L., G. L. Boyer, and P. V. Zimba (2008) A review of cyanobacterial odorous and bioactive metabolites: Impacts and management alternatives in aquaculture. Aquaculture. 280:5-20.

86. Watson, S. B., G. Boyer, and J. Ridal (2008) Taste and odour and cyanobacterial toxins: Impairment, prediction and management in the Great Lakes. Can J Fish Aquat Sci., 65(8): 1779-1796.
87. Allender, C. J., G. R. LeCleir, J. M. Rinta-Kanto, R. L. Smith, M. F. Satchwell, G. L. Boyer, and S. W. Wilhelm (2009) Identifying the source of unknown microcystin genes and predicting microcystin variants by linking multiple genes within uncultured cyanobacterial cells. Appl. Environ. Microbiol. 75:3598-3604.
88. Becker, R.H., Sultan, M.I., Boyer, G.L., Twiss. M.R., and Konopko, E. (2009) Mapping cyanobacterial blooms in the Great Lakes using MODIS, J. Great Lakes Res. 35(3):447-453.
89. Boyer, G. L. (2009) Algal Toxins and their Detection. In: "Shellfish Safety" S. Shumway and G.E. Rodrick, Eds., Woodhead Publishing, New York NY, p. 129-161.
90. Cusick, K. D., G. L. Boyer, S. W. Wilhelm, and G. S. Sayler (2009) Transcriptional profiling of Saccharomyces cerevisiae upon exposure to saxitoxin. Environ. Sci. Technol. 43(15) 6039-6045.
91. Davis, T. W., D. L. Berry, G. L. Boyer, and C. J. Gobler (2009) The effects of temperature and nutrients on the growth and dynamics of toxic and non-toxic strains of Microcystis during cyanobacteria blooms. Harmful Algae, 9:715-725
92. Giner, J., H. Zhao, G. L. Boyer, M. F. Satchwell, and R. A. Anderson (2009) Sterol chemotaxonomy of marine Pelagophyte algae. Chemistry & Biodiversity, 6:1111-1130.
93. Makarewicz, J. C., G. L. Boyer, T. W. Lewis, W. Guenther, J. Atkinson and M. Arnold (2009) Spatial and temporal distribution of the cyanotoxin microcystin in Lake Ontario ecosystem: Coastal embayments, rivers, nearshore and offshore and upland lakes. J. Great Lakes Res. 35(supp 1) 83-89
94. Rinta-Kanto, J. M., E. A. Konopko, J. M. DeBruyn, R. A. Bourbonniere, G. L. Boyer, and S. W. Wilhelm (2009) Lake Erie Microcystis: relationship between microcystin production, dynamics of genotypes and environmental parameters in a large lake. Harmful Algae 8:665-673
95. Rinta-Kanto, J. M., M. A. Saxton, J. M. DeBruyn, J. L. Smith, C. H. Marvin, K. A. Krieger, G. L. Boyer, and S. W. Wilhelm (2009) The diversity and distribution of toxigenic Microcystis spp. in present day and archived pelagic and sediment samples from Lake Erie. Harmful Algae. 8:385-394.
96. Smith, J. L., and G. L. Boyer (2009) Standardization of microcystin extraction from fish tissues: A novel internal standard as a surrogate for polar and non-polar variants. Toxicon. 53(2) 238-245.
97. Lehman, P. W., S. J. Teh, G. L. Boyer, M. L. Nobriga, E. Bass, and C. Hogle (2009) Initial impacts of Microcystis aeruginosa blooms on the aquatic food web in the San Francisco Estuary. Hydrobiologia. 637:229-248.
98. Smith, J. L., K. L. Schulz, P. V. Zimba, and G. L. Boyer (2010) Possible mechanism for the foodweb transfer of covalently-bound microcystins. Ecotoxicology and Environm. Safety. 73:757-761
99. Rogers, E. D., T. B. Henry, M. J. Twiner, J. S. Gouffon, J. T. McPherson, G. L. Boyer, G. S. Sayler, and S. W. Wilhelm (2011) Global gene expression profiling in larval zebrafish exposed to microcystin-LR and Microcystis reveals endocrine disrupting effects of cyanobacteria. Environ. Sci. Technol. 45(5) 1962-1969.
100. Wilhelm, S. W., S. E. Farnsley, G. R. LeCleir, A. C. Layton, M. F. Satchwell, J. M. DeBruyn, G. L. Boyer, G. Zhu, and H. W. Paerl (2011) The relationships between nutrients, cyanobacterial toxins and the microbial community in Taihu (Lake Tai), China. Harmful Algae, 10:207-215.
101. Wilhelm SW and GL Boyer (2011) Healthy competition. Nature Climate Change 1: 300-301. 102. Thessen, A. E., L. Clough, A. Whiting, H. Bowers and G. L. Boyer (2012) A recurring bloom of
toxic marine cyanobacteria above the Arctic Circle. Harmful Algal News, 46 (June):12-15.

103. Pavlac, M. M., T. T. Smith, S. P. Thomas, J. C. Makarewicz, T. W. Lewis, W. J. Edwards, C. M. Pennuto, C. P. Basiliko, J. F. Atkinson, and G. L. Boyer (2012) Assessment of phytoplankton distribution in the nearshore zone using continuous in situ fluorometry. J. Great Lakes Res. 38(suppl 4) 78-84.
104. Makarewicz, J. C., T. W. Lewis, W. J. Edwards, C. Pennuto, G. L. Boyer, and G. Thomas (2012) Physical and chemical characteristics of the nearshore zone of Lake Ontario. J. Great Lakes Res. J. Great Lakes Res. 38(suppl 4) 21-3.
105. Makarewicz, J. C., T. W. Lewis, G. L. Boyer and W.J. Edwards (2012) The influence of streams on nearshore water chemistry, Lake Ontario. J. Great Lakes Res. 38(suppl 4) 62-71.
106. Makarewicz, J. C., T. W. Lewis, and G. L. Boyer (2012) Nutrient enrichment and depletion on the shoreside of the spring thermal front. J. Great Lakes Res. 38(suppl 4) 72-76.
107. Steffen, M. M., Z. Li., T. C. Effler, L. J. Hauser, G. L. Boyer, and S. Wilhelm (2012) Comparative metagenomics of toxic freshwater cyanobacteria bloom communities on two continents. PLoS ONE. 7(8) e44002.
108. Allan, J. D., P. B. McIntyre, S. D. P. Smith, B. S. Halpern, G. Boyer, A. Buchsbaum, A. Burton, L. Campbell, L. Chadderton, J. Ciborowski, P. Doran, T. Eder, D. M. Infante, L. B. Johnson, C. G. Joseph, A. L. Marino, A. Prusevich, J. Read, J. Rose, E. Rutherford, S. Sowa, and A. Steinman (2013) Joint analysis of stressors and ecosystems services to enhance restoration effectiveness. Proc. Natl Acad. Sci (USA). 110(1) 372-377.
109. Schmidt, J.R., M. Shaskus, F, F. Estenik, C. Oesch, R. Khidekel, and G. L. Boyer (2013) Variations in the microcystin content of different fish species collected from a eutrophic lake. Toxins 5:992-1009
110. Lehman, P. W., K. Marr, G.L. Boyer, S. Acuna, and S. J. Teh (2013) Long term trends and causal factors associated with Microcystis abundance and toxicity in San Francisco Estuary and implications for climate change impacts. Hydrobiologia 718:141-158.
111. Kring, S. A. S.E. Figary, G. L. Boyer, S. B. Watson, and M. R. Twiss (2014) Rapid in situ measures of phytoplankton communities using the bbe FluoroProbe: evaluation of spectral calibration, instrument intercompatibility and performance range. Can J Fish Aquat Sci 71(7): 1087-1095. doi 10.1139/cjfas-2013-0599
112. Steffen, M. M., B. S. Belisle, S. B. Watson, G. L. Boyer, and S.W. Wilhelm (2014) Status, Causes, and Controls of Cyanobacterial Blooms in Lake Erie. J. Great Lakes Research 40 (2014) 215–225. (Corrigendum 40:466-467)
113. Davis, T.W., P. T. Orr, G. L. Boyer, M. A. Burford (2014) Investigating the production and release of cylindrospermopsin and deoxy-cylindrospermopsin by Cylindrospermopsis raciborskii over a natural growth cycle. Harmful Algae, 31:18-25.
114. Lehman, P. W., C. Kendall, M. A. Guerin, M. B. Young, S. R. Silva, G. L. Boyer and S. J. Teh. (2014) Characterization of the Microcystis bloom and its nitrogen supply in San Francisco Estuary using stable isotopes. Estuaries and Coasts, doi 10.0007/S12237-014098811
115. Kapuscinski, K. L., J. M. Farrell, S. V. Stehman, G. L. Boyer, D. D. Fernando, M. A. Teece and T. J. Tschaplinski (2014) Selective herbivory by an invasive cyprinid, the Rudd Scardinius erythrophthalmus. Freshwater Biology, 59: 2315-2327. doi 10.1111/fwb.12433.
116. Smith S. D.P., P.B. McIntyre, B. S. Halpern, R. M. Cooke, A.L. Marino, G. L. Boyer, A. Buchsbaum, G.A. Burton Jr., L. M. Campbell, J.J.H. Ciborowski, P. J. Doran, D. M. Infante, L. B. Johnson, J. G. Read, J. B. Rose, E. S. Rutherford, A. D. Steinman, and J. D. Allan (2014) Rating

impacts in a multi-stressor world: a quantitative assessment of 50 stressors affecting the Great Lakes, Ecological Applications, 25(3), 717–728. http://dx.doi.org/10.1890/14-0366.1
117. Schmidt, J.R., S.W. Wilhelm and G.L. Boyer (2014) The fate of microcystins in the environment and challenges for monitoring. Toxins 6:3354-3387.
118. Steffen, M.M., B S Belisle, S.B. Watson, G.L. Boyer, R.A. Bourbonniere, and S.W. Wilhlem (2015) Metatranscriptomic evidence for co-occurring top-down and bottom-up controls on toxic cyanobacterial communities. Appl. Environ. Microbiol. 81(9):3268-3276.
119. Cale, J.A., S.A. Teale, M.T. Johnson, G.L. Boyer, K.A. Perri and J.D. Castello (2015) New ecological and physiological dimensions of beech bark disease development in aftermath forests. Forest Ecology and Management 336:99–108.
120. Perri, K. A., J. M. Sullivan and G. L. Boyer (2015) Harmful Algal blooms in Sodus Bay, Lake Ontario: a comparison of nutrients, shoreline use and cyanobacterial toxins. J Great Lake Res. 41(2), 326-337.
121. Boyer, G, S. Kishbaugh, M. Perkins and N. Mueller (2015) The New York State citizen-based monitoring program for cyanobacteria toxins. In: A. Lincoln MacKenzie [Ed]. Marine and Freshwater Harmful Algae 2014. Proceedings of the 16th International Conference on Harmful Algae, October 24th, 2014, Wellington New Zealand, pp250-253.
122. Perri K, S. B. Watson and G.L. Boyer (2015) Production of Siderophores by Freshwater Cyanobacteria in the Lower Laurentian Great Lakes. In: A. Lincoln MacKenzie [Ed]. Marine and Freshwater Harmful Algae 2014. Proceedings of the 16th International Conference on Harmful Algae, October 24th, 2014, Wellington New Zealand, pp122-125.
123. Bullerjahn, G. S., R.M. McKay, T.W. Davis, D.B. Baker, G.L. Boyer, L.V. D’Anglada, G.J. Doucette, J.C. Ho, E.G. Irwin, C.L. Kling, R.M. Kudela, R.Kurmayer, J.D. Ortiz, T.G. Otten, H.W. Paerl, B. Qin, B.L. Sohngen, R.P. Stumpf, P.M. Visser and S.W. Wilhelm (2016) Global solutions for regional problems: collecting global expertise to address the problem of harmful algal blooms. A Lake Erie case study. Harmful Algae, 54:223-238
124. Carmichael, W.W. and G.L. Boyer (2016) Health impacts from cyanobacteria harmful algae blooms: Implications for the North American Great Lakes, Harmful Algae, 54:194-212
125. Watson S.B., C. Miller, G. Arhonditsis, G.L. Boyer, W. Carmichael, M. Charlton, R. Confesor, D. C. Depew, T.O. Höök, S. Ludsin, G. Matisoff, S.P. McElmurry, M.W. Murray, P. Richards, Y. R. Rao, M. Steffen, and S. Wilhelm (2016) The re-eutrophication of Lake Erie: Harmful algal blooms and hypoxia. Harmful Algae, 56 (2016) 44–66.
126. Belisle, B.S, M.M. Steffen, L. L. Pound, J. M DeBeBruyn, S.B. Watson, R.A. Bourbonniere, G.L. Boyer and S.W. Wilhelm (2016) Urea in Lake Erie: Organic nutrient sources as potentially important drivers of phytoplankton biomass? J. Great Lake Res., 42 (2016) 599–607.
127. Watson, S. B., A. Zastepa, G.L. Boyer, R. Yang, E. Matthews, and B. Newbold (2016) Algal Bloom Response and risk management: on-site response tools. submitted to Toxicon
128. Krausfeldt, L.E., X. Tang, J. van de Kamp, G. Gao, L. Bodrossy, G.L. Boyer, and S.W. Wilhelm (2016) Spatial and temporal variability in the phylogeny and function of nitrogen cyclers in Lake Taihu. for submission to: FEMS Microbiology Ecology.
129. Jones D. N., M. M. Woller-Skar, G. L. Boyer, J. Lankton, and A.L. Russell (20--) Trophic Transfer of Microcystin from a Freshwater Lake to Little Brown Bats (Myotis lucifugus). for submission to: PLOS one.

TECHNICAL REPORTS: 1. Watson, S.B., G. Boyer, M. Charlton, J. Ridal (2007) Biological metabolite impairments in Great
Lakes Areas of Concern, Technical Report Prepared for the Bay of Quinte, Area of Concern, 15p. 2. Watson, S.B. and G.L. Boyer (2011) Harmful Algal Blooms (HABS) in the Great Lakes: current
status and concerns, Technical report prepared for the International Joint Commission. 3. Watson, S.B., Boyer, G.L., Newbold, B., Matthews, E., Yang, R., 2012. Algal Bloom Response and
risk management: evaluation of on-site toxin kits in Hamilton Harbour. In: RAP Report, Hamilton Harbour. NWRI Report. Canadian Centre for Inland 1896 Waters, Burlington, ON, pp. 24.
4. Watson, S. and G. Boyer (2014) Indicator 3.4.5 Harmful and Nuisance Algae pp 46-48 In: Great Lakes Ecosystem Indicator Project Report, International Joint Commission, available online at http://www.ijc.org/files/publications/Ecosystem%20Indicators%20-Final.pdf .
5. Watson, S.B. and G.L. Boyer (2011) Harmful Algal Blooms (HABS). pp 296-305, In: State of the
Great Lakes, 2011, Indicators to assess the status and trends of the Great Lakes Ecosystem, Environment Canada and the U.S. Environmental Protection Agency, 2014), available online at http://binational.net/wp-content/uploads/2014/11/sogl-2011-technical-report-en.pdf
6. International Joint Commission, Science Advisory Board (2013) Taking Action on Lake Erie, A Science Summary Report prepared by the TAcLE Work Group as part of the Lake Erie Ecosystem Priority (LEEP). S.B. Watson and D Carpenter, Co-chairs, Available online at: http://www.ijc.org/files/tinymce/uploaded/TAcLE%20Summary%20Report%20FINAL.pdf
7. Watson, S.B. and G.L. Boyer (2016) Harmful and Nuisance Algal Blooms (HABS). In: State of the Great Lakes, 2016, Indicators to assess the status and trends of the Great Lakes Ecosystem, Environment Canada and the U.S. Environmental Protection Agency, 2017), available online at http://binational.net/.
8. Watson, S. and G. Boyer (2016) Indicator Harmful and Nuisance Algae Blooms (HABS) In: Great Lakes Ecosystem Indicator Project Report, International Joint Commission, accepted.

Exhibit B

Author's personal copy
The effects of temperature and nutrients on the growth and dynamics of toxic andnon-toxic strains of Microcystis during cyanobacteria blooms
Timothy W. Davis a, Dianna L. Berry a, Gregory L. Boyer b, Christopher J. Gobler a,*a School of Marine and Atmospheric Sciences, Stony Brook University, Southampton, NY, United Statesb Chemistry Department, State University of New York, College of Environmental Science and Forestry, Syracuse, NY, United States
1. Introduction
Blooms of toxic cyanobacteria are a global public health andenvironmental concern. Toxic blooms are most commonly formedby Microcystis, a well-known producer of the hepatotoxin,microcystin (Carmichael, 1992, 1994; Fleming et al., 2002; Chorusand Bartram, 1999; Pearl, 2008). Long term exposure to micro-cystin has been associated with severe human health effects,including liver and colorectal cancers (Falconer et al., 1988;Carmichael and Falconer, 1993; Bell and Codd, 1994; Carmichael,1994; Ito et al., 1997; Chorus and Bartram, 1999; Zegura andSedmak, 2003). One complexity in field studies of harmfulcyanobacteria blooms has been the existence and often co-existence of toxic and non-toxic strains of the same species within
a genus that are morphologically and taxonomically indistinguish-able (Otsuka et al., 1999; Fastner et al., 2001; Kurmayer et al.,2002). While it is clear that the occurrence of toxic cyanobacteriablooms around the world have increased during recent decades(Chorus and Bartram, 1999; Hudnell and Dortch, 2008), theunderlying causes of such blooms and the factors influencing thedynamics of toxic and non-toxic strains within them are poorlyunderstood.
Cyanobacteria blooms are typically associated with eutrophicand poorly flushed waters (Paerl, 1988; Paerl et al., 2001; Philippet al., 1991; Carmichael, 1994; Rapala et al., 1997; Oliver and Ganf,2000). Due to increases in human population density, agriculture,and industrial activities, nutrient loading rates into many fresh-water ecosystems has increased (Carpenter et al., 1998). As surfacewaters become enriched in nutrients, particularly phosphorus (P),there is often a shift in the phytoplankton community towardsdominance by cyanobacteria (Smith, 1986; Trimbee and Prepas,1987; Watson et al., 1997; Paerl and Huisman, 2008). Higher
Harmful Algae 8 (2009) 715–725
A R T I C L E I N F O
Article history:Received 26 November 2008Received in revised form 13 February 2009Accepted 14 February 2009
Keywords:MicrocystisMicrocystinEutrophicationClimate changeGlobal warmingNutrient loadingMcyMicrocystin synthetaseHarmful algal bloom
A B S T R A C T
In temperate latitudes, toxic cyanobacteria blooms often occur in eutrophied ecosystems during warmmonths. Many common bloom-forming cyanobacteria have toxic and non-toxic strains which co-occurand are visually indistinguishable but can be quantified molecularly. Toxic Microcystis cells possess asuite of microcystin synthesis genes (mcyA–mcyJ), while non-toxic strains do not. For this study, weassessed the temporal dynamics of toxic and non-toxic strains of Microcystis by quantifying themicrocystin synthetase gene (mcyD) and the small subunit ribosomal RNA gene, 16S (an indicator of totalMicrocystis), from samples collected from four lakes across the Northeast US over a two-year period.Nutrient concentrations and water quality were measured and experiments were conducted whichexamined the effects of elevated levels of temperatures (+4 8C), nitrogen, and phosphorus on the growthrates of toxic and non-toxic strains of Microcystis. During the study, toxic Microcystis cells comprisedbetween 12% and 100% of the total Microcystis population in Lake Ronkonkoma, NY, and between 0.01%and 6% in three other systems. In all lakes, molecular quantification of toxic (mcyD-possessing)Microcystis was a better predictor of in situ microcystin levels than total cyanobacteria, total Microcystis,chlorophyll a, or other factors, being significantly correlated with the toxin in every lake studied.Experimentally enhanced temperatures yielded significantly increased growth rates of toxic Microcystisin 83% of experiments conducted, but did so for non-toxic Microcystis in only 33% of experiments,suggesting that elevated temperatures yield more toxic Microcystis cells and/or cells with more mcyDcopies per cell, with either scenario potentially yielding more toxic blooms. Furthermore, concurrentincreases in temperature and P concentrations yielded the highest growth rates of toxic Microcystis cellsin most experiments suggesting that future eutrophication and climatic warming may additivelypromote the growth of toxic, rather than non-toxic, populations of Microcystis, leading to blooms withhigher microcystin content.
! 2009 Published by Elsevier B.V.
* Corresponding author. Tel.: +1 631 632 5043.E-mail address: [email protected] (C.J. Gobler).
Contents lists available at ScienceDirect
Harmful Algae
journa l homepage: www.e lsev ier .com/ locate /ha l
1568-9883/$ – see front matter ! 2009 Published by Elsevier B.V.doi:10.1016/j.hal.2009.02.004

Author's personal copy
phosphorus levels have been shown to yield higher microcystincontent per cell in some cyanobacteria (Utkilen and Gjølme, 1995;Rapala et al., 1997). However, nitrogen (N) may be equallyimportant in the occurrence of toxic, non-N fixing cyanobacteriablooms, such as Microcystis sp. Laboratory studies have indicatedthat increasing N loads increases the growth and toxicity of thisspecies (Watanabe and Oishi, 1985; Orr and Jones, 1998; Codd andPoon, 1988). Moreover, previous laboratory research suggests toxicstrains of Microcystis are able to outgrow non-toxic strains at highnitrogen levels (Vezie et al., 2002). However, no field study hasexamined how nutrients directly affect the growth of toxic andnon-toxic strains of cyanobacteria within wild populations.
The burning of fossil fuels and subsequent rise in atmosphericcarbon dioxide has caused the earth’s surface temperature toincrease by approximately 1 8C during the 20th century, with mostof the increase having occurred during the last 40 years (IPCC,2001). In the current century, global temperatures are expected toincrease an additional 2–5 8C (Houghton et al., 2001). Frequently,cyanobacteria dominate phytoplankton assemblages in temperatefreshwater environments during the warmest periods of the year,particularly in eutrophic systems (Paerl, 1988; Paerl et al., 2001;Paerl and Huisman, 2008; Paul, 2008). Harmful cyanobacteria suchas Microcystis have been found to have an optimal temperature forgrowth and photosynthesis at, or above, 25 8C (Konopka and Brock,1978; Takamura et al., 1985; Robarts and Zohary, 1987; Reynolds,2006; Johnk et al., 2008; Paerl and Huisman, 2008). Furthermore,the cellular toxin content of multiple genera of cyanobacteriaincreases with increasing temperature to a maximum above 25 8C(Van der Westhuizen and Eloff, 1985; Codd and Poon, 1988;Sivonen, 1990; Rapala et al., 1997). However, the growth responseof toxic and non-toxic strains of cyanobacteria to increasing watertemperature in an ecosystem setting has yet to be explored.
The purpose of this study was to elucidate the conditions thatfavor the growth and proliferation of the toxic and non-toxicstrains of Microcystis. A two-year field study was established infour diverse lake systems across the Northeast US to determine thedynamics of toxic and non-toxic strains of Microcystis usingmolecular quantification of total Microcystis cells and Microcystiscells possessing the microcystin synthetase gene. Levels ofmicrocystin, nutrients, and other environmental parameters wereassessed concurrently. Experiments were conducted to examinethe impacts of elevated nutrient concentrations (N and P) andincreased temperature on the growth rates of toxic and non-toxicMicrocystis populations.
2. Materials and methods
2.1. Study sites
During this study, four sites within the Northeast US wereinvestigated. Lake Champlain lies between New York and Vermont,and is connected to the Richelieu River to the north and the HudsonRiver to the south. It is the largest lake in the Northeast UnitedStates other than the Great Lakes. Lake Champlain serves as adrinking water supply to millions of individuals, has beensubjected to eutrophication since the 1970s, and is dominatedby cyanobacteria in some regions during warm months (Myer andGruendling, 1979; Shambaugh et al., 1999; Boyer et al., 2004). Oursampling site was Missisquoi Bay (Latitude: 44.628N; Longitude:73.378W), a basin in the northeast extent of Lake Champlain thatexperiences annual toxic cyanobacteria blooms (Boyer et al., 2004).
Our other sampling sites were located on Long Island, NY, USA,which has recently seen its population expand beyond seven millionpeople. Lake Agawam (Latitude: 40.888N; Longitude: 72.398W) is asmall (0.5 km2), shallow (4 m maximum depth) system whichexperiences annual toxic cyanobacteria blooms dominated by
Microcystis (Gobler et al., 2007). Mill Pond (Latitude: 40.918N;Longitude: 72.368W) is a deeper (8m maximum depth), hypereu-trophic system (mean chlorophyll a = 200 mg L!1) which alsoexperiences dense cyanobacteria blooms dominated by Microcystiscells during summer months. Finally, Lake Ronkonkoma (Latitude:40.838N; Lon: 73.128W), is the largest body of freshwater on LongIsland (area = 1.5 km2, maximum depth = 27 m), and experiencessummer cyanobacteria blooms comprised of Microcystis. In allsystems sampled on Long Island, lake transects indicated thatblooms were spatially similar with regard to chlorophyll a,phycocyanin, and toxin concentrations (data not shown). As such,our sampling sites were representative of each system.
2.2. Water quality sampling
Field sampling was conducted bi-weekly before, during, and aftercyanobacteria blooms (May–November). In 2005, Lake Ronkonkomaand Lake Agawam were sampled whereas in 2006, Lake Champlain,Lake Agawam, and Mill Pond were studied. At each site, generalwater quality was evaluated using a handheld YSI 556 sonde todetermine surface and bottom temperatures and dissolved oxygen.Twenty liters of surface water was collected and taken to the labwhere triplicate chlorophyll a and in vivo phycocyanin (as a proxy fortotal cyanobacteria) were measured with Turner Designs fluorom-eters using standard techniques (Parsons et al., 1984; Watras andBaker, 1988; Lee et al., 1994). For microcystin analysis, whole waterwas filtered onto triplicate 47 mm GFF glass fiber filters and placedin 5 mL cryovials which were stored at!80 8C until analysis. Watersamples were filtered through 0.2 mm capsule filters to obtainsamples for dissolved nutrient analysis. Nitrate was analyzed byreducing the nitrate to nitrite using spongy cadmium as per Jones(1984). Nitrite, ammonium, phosphate, and silicate were analyzedusing techniques modified from Parsons et al. (1984). Duplicatewhole water samples were preserved with Lugol’s iodine solution(5% final concentration) to quantify phytoplankton assemblages. Formolecular analysis of cyanobacteria, bloom water was filtered ontotriplicate 0.22 mm polycarbonate filters, immediately placed inCTAB lysis buffer, and stored at !80 8C.
2.3. Impacts of nutrients and temperature on toxic and non-toxicMicrocystis
On selected dates (Table 3), experiments were conducted toassess the impact of increased nutrient concentrations andtemperature on toxic and non-toxic Microcystis populations. Foreach of the six experiments, two sets of 12 triplicate, 1 L bottles(n = 24) were filled with surface water from each experimental siteand were either left unamended to serve as a control, or amendedwith nitrogen (20 mM NO3
!), phosphorus (1.25 mM orthopho-sphate), or both N and P in order to determine which nutrient mayfavor the proliferation of toxic and non-toxic Microcystis. One set ofbottles (n = 12) was placed in an outdoor incubator receivingambient light and circulating in situ water. In order to maintain insitu water temperatures, ambient lake water was continuouslypumped through the incubation chamber throughout the durationof the experiment (48–72 h). The other set of bottles (n = 12) wasincubated at natural light levels and circulating water maintainedat elevated temperatures (+4 8C above ambient water tempera-ture) achieved with a coupled heater/chiller design usingcommercially available heaters and chillers (Aquatic Eco-systems,Inc., FL, USA), approximating levels projected for the comingcentury (+4 8C; Houghton et al., 2001). Exact water temperaturesadministered during experiments were monitored every minutewith in situ loggers (Onset Computer Corporation, MA, USA). At theend of the incubation period, aliquots from experimental bottleswere filtered for levels of chlorophyll a and analyzed for in vivo
T.W. Davis et al. / Harmful Algae 8 (2009) 715–725716

Author's personal copy
phycocyanin. Samples were also filtered at the end of theincubation period as described above to preserve samples fordetermination of densities of toxic and non-toxic Microcystis usingmolecular methods. Net growth rates of each population weredetermined as follows: m = ln[Nt/N0]/t where m is the rate ofpopulation growth (d!1), N0 and Nt are initial and final celldensities, and t is the duration of incubation in days.
2.4. Sample analysis
2.4.1. Microscopic analysisDensities of Microcystis and other co-occurring cyanobacteria
were quantified using gridded Sedgewick-Rafter and Utermohlcounting chambers. Utermohl chambers were used to quantifypopulations with cell densities that were low. For dense algalpopulations, a gridded Sedgewick-Rafter chamber allowed foraccurate assessment of cell densities without the layering of cellswhich can occur when high biomass samples are concentratedwithin an Utermohl chamber. For all samples, at least 200 cellswere enumerated. To quantify Microcystis as well as Anabaena, thenumber of colonies per chamber, as well as the number of cells in20 colonies, was determined. Such a counting approach providedgood reproducibility (<15% relative standard deviation) on liveand preserved samples, as well as precise comparability betweenlive and preserved samples. However, as individual trichomes ofAphanizomenon colonies are difficult to visually resolve, onlycolonies per chamber were counted.
2.4.2. Microcystin analysisFilters for microcystin analyses were extracted in 50% methanol
containing 1% acetic acid using ultrasound (four, 20 second burstswith a 20 second pause between bursts). Previous work has shownthat this extraction protocol gives 90% recovery of microcystin-LR(Boyer et al., 2004). Following extraction, the methanolic extractwas stored at!80 8C until analysis. Microcystin concentration wasmeasured using the protein phosphatase inhibition assay (PPIA;Carmichael and An, 1999). This analytical protocol does not allowfor specific congeners of microcystin to be distinguished but ratherprovides an indication of the potential biological impact of themicrocystins, specifically their ability to inhibit protein phospha-tases (Carmichael and An, 1999). A certified microcystin-LRstandard (Alexis Biochemicals, San Diego, USA) was used to createthe standards for this analysis. This assay yielded a 99.5 " 8.2%recovery of samples spiked with known amounts of microcystin, amethodological relative standard deviation of 9.4%, and a detectionlimit between 0.05 and 0.50 mg L!1.
2.4.3. Molecular analysesTotal cellular nucleic acids were extracted from field and
experimental samples using methods described in Coyne and Cary
(2005). Filtered environmental or experimental samples weresubmersed in CTAB buffer (Dempster et al., 1999), supplementedwith 20 mg L!1 pGEM-3z(f+) plasmid (Promega; Table 1) whichserved as an internal control for extraction efficiency and PCRinhibition (Coyne et al., 2005). The filters were then flash frozenand stored at !80 8C until extraction. Nucleic acids were extractedafter an initial heating step at 65 8C, followed by a doublechloroform extraction, and an isopropanol precipitation. Extractednucleic acids were resuspended in 20 mL of LoTE buffer. Thequantity and quality of nucleic acids was assessed with aNanoDrop 1000 UV spectrophotometer (NanoDrop Technologies,Wilmington, DE).
Two Microcystis-specific genetic targets were used during thisstudy, the 16S rRNA gene (16S rDNA) and mcyD gene. TheMicrocystis 16S rRNA gene is specific to the Microcystis genus whichallowed us to quantify the abundance of the total Microcystispopulation. The mcyD gene is found within the microcystinsynethtase gene operon which is responsible for the production ofmicrocystin and is only found in toxic strains of Microcystis (Tillettet al., 2000) allowing for the quantification of the toxic Microcystispopulation (Rinta-Kanto et al., 2005). QPCR was carried out using anABI 7300 Real Time PCR instrument using TaqMan1 labeled probes(Applied Biosystems) and Microcystis-specific mcyD and 16 s rDNAprimers (Table 1). Each 10 uL reaction included 5 uL of 2# TaqMan1
Master Mix (Applied Biosystems), 10uM each primer (IntegratedDNA Technologies), 10 uM Taqman1 probe (Table 1) and 1 mL of a1:25 dilution of the unknown DNA or standard. For amplification ofthe pGEM and 16S targets, the cycling conditions were 95 8C for10 min, followed by 55 cycles of 95 8C for 15 s and 60 8C for 1 min. Inorder to amplify the mcyD gene, the cycling conditions were 95 8C for10 min, followed by 55 cycles of 95 8C for 15 s, followed by 50 8C for1 min, then 60 8C for 1 min. To prepare standard samples, culturedMicrocystis aeruginosa, clone LE-3 (Rinta-Kanto et al., 2005), wasenumerated by standard microscopy and collected on polycarbo-nate filters which were prepared and extracted as outlined above. Astandard curve of dilutions of the extracted LE-3 genomic DNA wasrun with each analytical run to serve as a reference for numbers oftoxic Microcystis cells. Since some Microcystis cells may carrymultiple copies of the 16S rDNA gene and mcyD gene, data wasgenerally expressed as ‘‘cell equivalents’’ (Rinta-Kanto et al., 2005).The numbers of toxic and total Microcystis cells were determinedusing the DDCT method (Livak and Schmittgen, 2001; Coyne et al.,2005). The difference between the number of mcyD cell equivalents(toxic cells) and 16S rDNA cell equivalents (total cells) indicated thenumber of non-toxic cell equivalents (Rinta-Kanto et al., 2005). ToxicMicrocystis cell abundances were determined for all locations and onall dates. Total Microcystis cells (16S rDNA) were quantified for allsystems except Lake Agawam 2006 and Mill Pond 2006 when totalMicrocystis cells equivalents were only quantified on the days ofexperiments.
Table 1A list of primers (Integrated DNA Technologies, IA, USA) and probes (Applied Biosystems, Foster City, CA, USA) used in the qPCR analysis.
DNA target Primer Sequence (50–30) Reference
pGEM plasmid DNA M13F CCCAGTCACGACGTTGTAAAAACG Coyne et al. (2005)pGEMR TGTGTGGAATTGTGAGCGGA Coyne et al. (2005)pGEM probe (Taq) FAMa-CACTATAGAATACTCAAGCTTGCATGCCTGCA-BHQ-1b Coyne et al. (2005)
Microcystis 16S rDNA 184F GCCGCRAGGTGAAAMCTAA Neilan et al. (1997)431R AATCCAAARACCTTCCTCCC Neilan et al. (1997)Probe (Taq) FAM–AAGAGCTTGCGTCTGATTAGCTAGT-BHQ-lb Rinta-Kanto et al. (2005)
Microcystis mcyD F2 GGTTCGCCTGGTCAAAGTAA Kaebernick et al. (2000)R2 CCTCGCTAAAGAAGGGTTGA Kaebernick et al. (2000)Probe (Taq) FAM–ATGCTCTAATGCAGCAACGGCAAA-BHQ-lb Rinta-Kanto et al. (2005)
F: forward primer R: reverse primer.a 6-Carboxyfluorescein.b Black Hole Quencher-1 (quenching range 480–580 nm).
T.W. Davis et al. / Harmful Algae 8 (2009) 715–725 717

Author's personal copy
2.5. Statistical analysis
All time series data sets from each location (chlorophyll a,phycocyanin, toxic Microcystis cell densities, non-toxic Microcystisdensities, total Microcystis densities, total cyanobacteria cells,microcystin concentration, dissolved inorganic phosphorus (DIP),dissolved inorganic nitrogen (nitrate + ammonium = DIN), andtemperature) were statistically analyzed using a Pearson’scorrelation matrix to establish the degree to which individualvariables were correlated. Student’s t-tests were used to determineif the means of different populations (toxic and non-toxic) weresignificantly different from each other. The effects of nitrogen,phosphorus, and temperature on the net growth rate of toxic andnon-toxic Microcystis populations were analyzed with three-wayANOVAs with nitrogen, phosphorus, and temperature consideredtreatment effects (a = 0.05). Post-hoc comparisons of significantimpacts were elucidated with Tukey’s multiple comparison tests.For all results the standard variance presented is " one standarddeviation (SD).
3. Results
3.1. Dynamics of toxic Microcystis blooms
3.1.1. Lake Agawam, Long Island, NYDuring 2005, Lake Agawam hosted mixed cyanobacteria
blooms numerically dominated by Microcystis from June throughSeptember (Table 2). Blooms contained mean chlorophyll a levelsof 97 " 28 mg L!1 (mean " SD) and coincided with peaks of in vivophycocyanin (Fig. 1). Densities of non-toxic Microcystis ranged from3.9 # 106 to 1.0 # 108 cell equivalents L!1 during blooms with peakdensities achieved on 20 October (Fig. 1). Concurrently, toxicMicrocystis cell densities (possessing the Microcystis-specific mcyDgene) ranged from 5.0 # 102 to 5.0 # 105 cell equivalents L!1 (Fig. 1),peaking on 21 June and representing between 0.01% and 1.56% of totalMicrocystis cells. Microcystin was detectable in the water columnfrom May through October ranging from 0.86 to 11.8 mg L!1, with thehighest levels occurring at the peak in toxic Microcystis cellequivalents (Fig. 1). Concentrations of microcystin were significantlycorrelated with levels of toxic Microcystis cell equivalents (p < 0.05).DIN levels during the summer months (July–August) ranged from2.67 to 6.52 mM, while DIP concentrations never exceeded0.38 " 0.08 mM (mean = 0.25 " 0.06 mM; Fig. 1). During Septemberwhen algal biomass levels declined, DIN and DIP levels increased(Fig. 1). Temperatures in Lake Agawam during 2005 rose from 13 8C inMay to 29 8C in August, and then declined to 15 8C in late October.
During 2006, the temporal dynamics of cyanobacterial bloomsin Lake Agawam differed from 2005. Lake Agawam hostedcyanobacteria blooms dominated by Anabaena during Juneand early July with maximal concentrations reaching2.79 # 108 cells L!1 (Table 2). This bloom was succeeded by abloom of Microcystis during mid-July which remained dominantthrough October (Table 2). Aphanizomenon was present throughoutthe sampling period but was never dominant (Table 2). Cyano-bacteria blooms contained mean chlorophyll a levels of209 " 17.0 mg L!1 and coincided with peaks of in vivo phycocyanin(Fig. 2). Densities of toxic Microcystis ranged from 5.3 # 103 to3.5 # 106 cell equivalents L!1, peaking on 10 October (Fig. 2). Parti-culate microcystin was detectable throughout the study periodranging from 0.69 to 81.1 mg L!1, with the highest levels occurringconcurrently with the peak in toxic Microcystis cell equivalents(Fig. 2). In a manner similar to 2005, microcystin concentrations weresignificantly correlated with toxic Microcystis cell equivalents(p < 0.001). DIN levels during the bloom months (June–October)ranged from 3.03 to 48.81 mM and were inversely related tophycocyanin concentrations, being higher before and after bloom
events (Fig. 2). During June and early July DIP concentrations were1.54 " 0.44 mM but rose later in the sampling season (Fig. 2). Surfacetemperatures in 2006 ranged from 22 8C in June to 29 8C in July,declining to 13 8C by October.
3.1.2. Lake Ronkonkoma, Long Island, NYCompared to the other systems examined, Lake Ronkonkoma
was the only system which hosted cyanobacteria blooms that werefirst dominated by Microcystis and were succeeded by Anabaena(Table 2). Aphanizomenon was either absent, or at low densitiesin Lake Ronkonkoma (i.e. <50,000 colonies L!1; Table 2).Blooms (June–August) contained mean chlorophyll a levels of20.2 " 8.0 mg L!1 and coincided with peaks of in vivo phycocyanin(Fig. 3). May through June Microcystis-dominated blooms(Table 2) were comprised almost exclusively of toxic cells(1.98 # 108 cell equivalents L!1 maximum on 27 May; Fig. 3), untillate June bloom composition shifted toward dominance by non-toxiccells (peak densities 1.20 # 106 cell equivalents L!1 on 25 July) beforedeclining during the late summer (Fig. 3). Through the samplingperiod, toxic Microcystis cell equivalents comprised between 12% and100% of the total Microcystis population and microcystin levels rangedfrom 1.28 to 78.8 mg L!1 (Fig. 3). In a manner similar to Lake Agawam,there was a significant correlation between microcystin concentra-tions and toxic Microcystis cell equivalents (p < 0.001). Nutrientconcentrations during the bloom months (June–September) rangedfrom 4.17 to 11.1 mM DIN and 0.19 to 0.71 mM DIP (Fig. 3). Finally,surface temperatures ranged from 16 8C in May to 30 8C in August anddecreased to 25 8C by September.
3.1.3. Mill Pond, Long Island, NYCyanobacterial bloom dynamics within Mill Pond during the
summer of 2006 were similar to that of Lake Agawam during thesame year. Mill Pond hosted cyanobacteria blooms dominated byAnabaena and Aphanizomenon from June through early July (Table 2).This bloom subsided and a bloom of Microcystis occurred andremained dominant throughout the summer and early fall (Table 2).Blooms (June–October) contained mean chlorophyll a levels of96.9" 57.3 mg L!1 and coincided with peaks of in vivo phycocyanin(Fig. 4). Densities of toxic Microcystis ranged from 3.3 # 103 to4.1 # 106 cell equivalents L!1, achieving the highest concentrationon 12 October coinciding with the highest levels of microcystin(Fig. 4). Microcystin levels ranged from 5.50 to 154 mg L!1, and weresignificantly correlated with toxic Microcystis cell equivalents duringthe sampling period (p < 0.001). DIN concentrations varied widely(6.82–80.9 mM), with the highest concentrations present during latespring and fall (Fig. 4). DIP concentrations in Mill Pond were alsoelevated with a mean concentration of 4.93" 0.06 mM (Fig. 4). Surfacetemperatures in this system ranged from 22 8C in June to 28 8C in Julydeclining to 12 8C by October.
3.1.4. Lake ChamplainLake Champlain’s Missisquoi Bay was devoid of cyanobacteria
until July and was never numerically dominated by Microcystis in2006 (Table 2). A cyanobacteria bloom which occurred during latesummer contained mean chlorophyll a levels of 52.0 " 27.5 mg L!1,coincided with peaks of in vivo phycocyanin (mid-July through mid-October; Fig. 5), and was dominated by Anabaena at a density of4.91 " 0.21 # 107 cells L!1 on 1 August (Table 2). Microcystis waspresent in the water column from July through October (Table 2) withdensities of non-toxic Microcystis ranging from 1.4 # 104 to2.1 # 107 cell equivalents L!1 during blooms (peak densities on 1August; Table 2). Toxic Microcystis cells were detectable from Augustthrough September (0.24–9.79 # 105 cell equivalents L!1; Fig. 5)representing approximately 6% of total Microcystis cells. Microcystinwas present in the water column from May through October at levelsthat were lower than other systems (0.10–1.95 mg L!1, Fig. 5) and
T.W. Davis et al. / Harmful Algae 8 (2009) 715–725718

Author's personal copy
peaked on 1 August during the maximum densities of toxicMicrocystis cells (Fig. 5). As was found in other systems, microcystinconcentrations in Lake Champlain were significantly correlated withtoxic Microcystis cell equivalents L!1 (p < 0.05). Nutrient levels wereelevated before the onset of Microcystis blooms (May early JulyDIN = 11.95 " 4.97 mM; DIP = 0.32 " 0.08 mM), but were lowerduring the peak of the bloom (mid July–SeptemberDIN = 8.12 " 3.91 mM; DIP = 0.26 " 0.19 mM; Fig. 5). Nutrient levelsincreased again in October. The bloom peak also corresponded with
the highest temperatures of the sampling campaign (26 8C), withinitial and final sampling temperatures close to 10 8C.
3.2. Effects of increased temperature and nutrients on toxicand non-toxic strains of Microcystis
3.2.1. Lake AgawamDuring the July 2005 experiment in Lake Agawam, ambient water
temperature was 26.9" 1.7 8C while the elevated temperature
Table 2Mean cyanobacterial densities (cells* or colonies** L!1) (SD in parentheses) for all systems sampled. Counts were made using light microscopy. Dashed lines indicate sampleswere not available.
Microcystis* Anabaena* Aphanizomenon**
Lake Agawam 200526-May-05 68,666,000 (3,433,000) 1,100,000 (141,000) 0 (0)7-Jun-05 – 14,667,000 (1,604,000) 0 (0)21-Jun-05 28,300,000 (1,415,000) 700,000 (141,000) 0 (0)5-Jul-05 53,300,000 (2,665,000) 8,733,000 (2,810,000) 30 (0)18-Jul-05 58,700,000 (2,935,000) 17,400,000 (3,504,000) 0 (0)1-Aug-05 60,600,000 (3,030,000) 0 (0) 0 (0)12-Aug-05 201,300,000 (10,065,000) 3,467,000 (611,000) 140,000 (14,000)23-Aug-05 52,000,000 (2,600,000) 3,067,000 (1,007,000) 260,000 (30,000)20-Sep-05 2,000,000 (100,000) 1,700,000 (141,000) 0 (0)13-Oct-05 – – –20-Oct-05 – – –8-Nov-05 – – –
Lake Agawam 20062-Jun-06 76,945,000 (3,847,000) 279,000,000 (13,950,000) 520,000 (26,000)16-Jun-06 1,200,000 (60,000) 45,500,000 (2,275,000) 30,000 (2,000)22-Jun-06 55,491,000 (2,775,000) 201,500,000 (10,075,000) 0 (0)27-Jun-06 3,755,000 (188,000) 265,000,000 (13,250,000) 370,000 (19,000)6-Jul-06 14,850,000 (743,000) 60,000,000 (3,000,000) 30,000 (2,000)11-Jul-06 122,960,000 (6,148,000) 28,500,000 (1,425,000) 90,000 (5,000)19-Jul-06 693,000,000 (34,650,000) 50,000,000 (2,500,000) 390,000 (20,000)25-Jul-06 429,418,000 (21,471,000) 8,500,000 (425,000) 340,000 (17,000)10-Aug-06 1,483,227,000 (74,161,000) 15,000,000 (750,000) 570,000 (29,000)12-Sep-06 76,691,000 (3,835,000) 35,000,000 (1,750,000) 140,000 (7,000)28-Sep-06 625,527,000 (31,276,000) 12,500,000 (625,000) 150,000 (8,000)10-Oct-06 436,582,000 (21,829,000) 15,000,000 (750,000) 0 (0)24-Oct-06 332,000,000 (16,600,000) 16,500,000 (825,000) 40,000 (2,000)
Lake Ronkonkoma 200527-May-05 1,000,000 (0) 0 (0) 0 (0)8-Jun-05 113,000,000 (6,062,000) 0 (0) 0 (0)23-Jun-05 – – –5-Jul-05 67,667,000 (6,506,000) 8,000,000 (1,000,000) 0 (0)25-Jul-05 7,000,000 (2,000,000) 9,500,000 (1,000,000) 25,000 (7,000)5-Aug-05 2,000,000 (0) 2,500,000 (0) 50,000 (10,000)18-Aug-05 4,000,000 (0) 5,167,000 (764,000) 20,000 (10,000)15-Sep-05 – – –
Lake Champlain 200622-May-06 0 (0) 0 (0) 0 (0)19-Jun-06 293,000 (15,000) 0 (0) 0 (0)3-Jul-06 0 (0) 0 (0) 0 (0)17-Jul-06 953,000 (48,000) 1,067,000 (53,000) 0 (0)1-Aug-06 11,480,000 (574,000) 41,867,000 (2,093,000) 213,000 (11,000)19-Sep-06 1,027,000 (51,000) 2,400,000 (120,000) 5,893,000 (295,000)3-Oct-06 200,000 (10,000) 0 (0) 80,000 (4,000)17-Oct-06 60,000 (3,000) 0 (0) 0 (0)
Mill Pond 20062-Jun-06 9,082,000 (454,000) 27,000,000 (1,350,000) 1,050,000 (53,000)16-Jun-06 18,600,000 (930,000) 78,500,000 (3,925,000) 1,970,000 (99,000)22-Jun-06 22,636,000 (1,132,000) 46,000,000 (2,300,000) 620,000 (31,000)27-Jun-06 5,155,000 (258,000) 0 (0) 840,000 (42,000)6-Jul-06 61,600,000 (3,080,000) 3,000,000 (150,000) 13,970,000 (699,000)11-Jul-06 244,873,000 (12,244,000) 0 (0) 490,000 (25,000)19-Jul-06 268,736,000 (13,437,000) 0 (0) 2,370,000 (119,000)25-Jul-06 181,909,000 (9,095,000) 1500,000 (75,000) 4,410,000 (221,000)10-Aug-06 264,955,000 (13,248,000) 5,000,000 (250,000) 60,000 (3,000)12-Sep-06 158,782,000 (7,939,000) 69,000,000 (3,450,000) 1,630,000 (82,000)28-Sep-06 75,164,000 (3,758,000) 2,000,000 (100,000) 2,020,000 (101,000)10-Oct-06 529,200,000 (26,460,000) 0 (0) 390,000 (20,000)24-Oct-06 17,338,000 (867,000) 0 (0) 690,000 (35,000)
T.W. Davis et al. / Harmful Algae 8 (2009) 715–725 719

Author's personal copy
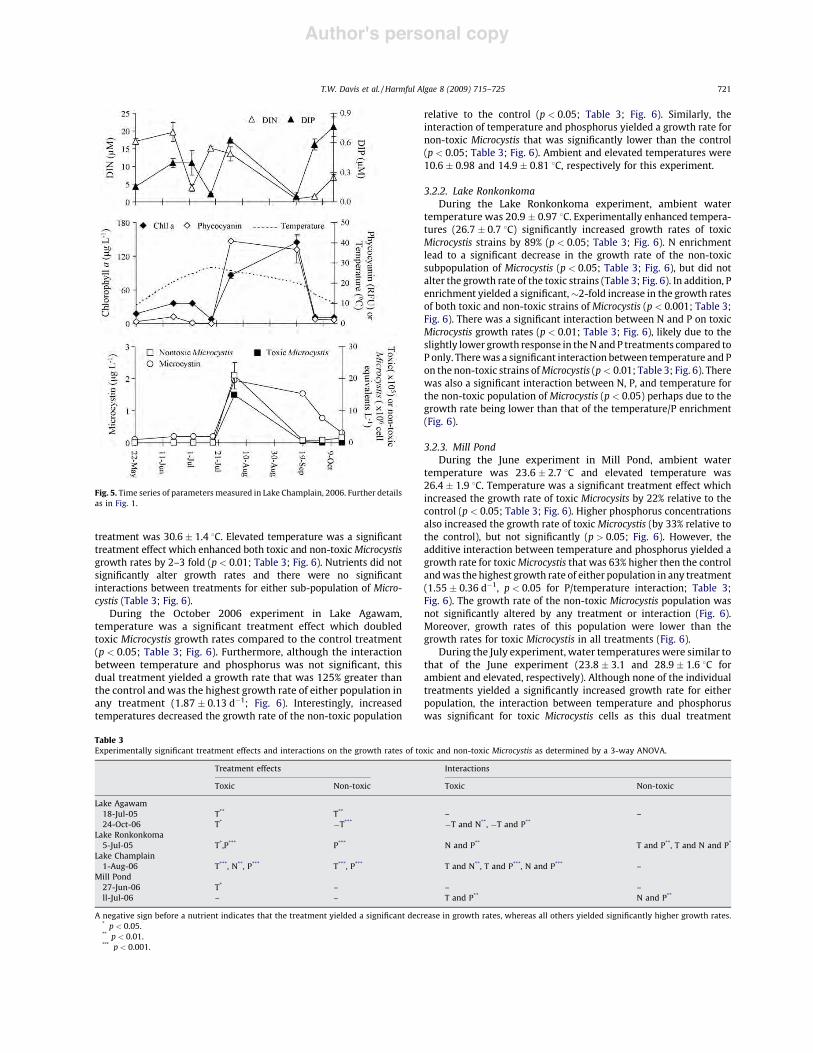
Fig. 1. Time series of parameters measured in the Lake Agawam, 2005. (A)Concentrations of dissolved inorganic nitrogen (DIN ~) and orthophosphate (DIP~). (B) Levels of total chl a ^, phycocyanin ^, and temperature (- - -). (C) Densitiesof toxic & and non-toxic Microcystis & as well as concentrations of microcystin *.Error bars represent "1SD of replicated samples.
Fig. 2. Time series of parameters measured in Lake Agawam, 2006. Further details asin Fig. 1
Fig. 3. Time series of parameters measured in Lake Ronkonkoma, 2005. Furtherdetails as in Fig. 1.
Fig. 4. Time series of parameters measured in Mill Pond, 2006. Further details as inFig. 1.
T.W. Davis et al. / Harmful Algae 8 (2009) 715–725720
Author's personal copy
treatment was 30.6" 1.4 8C. Elevated temperature was a significanttreatment effect which enhanced both toxic and non-toxic Microcystisgrowth rates by 2–3 fold (p < 0.01; Table 3; Fig. 6). Nutrients did notsignificantly alter growth rates and there were no significantinteractions between treatments for either sub-population of Micro-cystis (Table 3; Fig. 6).
During the October 2006 experiment in Lake Agawam,temperature was a significant treatment effect which doubledtoxic Microcystis growth rates compared to the control treatment(p < 0.05; Table 3; Fig. 6). Furthermore, although the interactionbetween temperature and phosphorus was not significant, thisdual treatment yielded a growth rate that was 125% greater thanthe control and was the highest growth rate of either population inany treatment (1.87 " 0.13 d!1; Fig. 6). Interestingly, increasedtemperatures decreased the growth rate of the non-toxic population
relative to the control (p < 0.05; Table 3; Fig. 6). Similarly, theinteraction of temperature and phosphorus yielded a growth rate fornon-toxic Microcystis that was significantly lower than the control(p < 0.05; Table 3; Fig. 6). Ambient and elevated temperatures were10.6 " 0.98 and 14.9 " 0.81 8C, respectively for this experiment.
3.2.2. Lake RonkonkomaDuring the Lake Ronkonkoma experiment, ambient water
temperature was 20.9 " 0.97 8C. Experimentally enhanced tempera-tures (26.7 " 0.7 8C) significantly increased growth rates of toxicMicrocystis strains by 89% (p < 0.05; Table 3; Fig. 6). N enrichmentlead to a significant decrease in the growth rate of the non-toxicsubpopulation of Microcystis (p < 0.05; Table 3; Fig. 6), but did notalter the growth rate of the toxic strains (Table 3; Fig. 6). In addition, Penrichment yielded a significant,$2-fold increase in the growth ratesof both toxic and non-toxic strains of Microcystis (p < 0.001; Table 3;Fig. 6). There was a significant interaction between N and P on toxicMicrocystis growth rates (p < 0.01; Table 3; Fig. 6), likely due to theslightly lower growth response in the N and P treatments compared toP only. There was a significant interaction between temperature and Pon the non-toxic strains of Microcystis (p < 0.01; Table 3; Fig. 6). Therewas also a significant interaction between N, P, and temperature forthe non-toxic population of Microcystis (p < 0.05) perhaps due to thegrowth rate being lower than that of the temperature/P enrichment(Fig. 6).
3.2.3. Mill PondDuring the June experiment in Mill Pond, ambient water
temperature was 23.6 " 2.7 8C and elevated temperature was26.4 " 1.9 8C. Temperature was a significant treatment effect whichincreased the growth rate of toxic Microcysits by 22% relative to thecontrol (p < 0.05; Table 3; Fig. 6). Higher phosphorus concentrationsalso increased the growth rate of toxic Microcystis (by 33% relative tothe control), but not significantly (p > 0.05; Fig. 6). However, theadditive interaction between temperature and phosphorus yielded agrowth rate for toxic Microcystis that was 63% higher then the controland was the highest growth rate of either population in any treatment(1.55 " 0.36 d!1, p < 0.05 for P/temperature interaction; Table 3;Fig. 6). The growth rate of the non-toxic Microcystis population wasnot significantly altered by any treatment or interaction (Fig. 6).Moreover, growth rates of this population were lower than thegrowth rates for toxic Microcystis in all treatments (Fig. 6).
During the July experiment, water temperatures were similar tothat of the June experiment (23.8 " 3.1 and 28.9 " 1.6 8C forambient and elevated, respectively). Although none of the individualtreatments yielded a significantly increased growth rate for eitherpopulation, the interaction between temperature and phosphoruswas significant for toxic Microcystis cells as this dual treatment
Fig. 5. Time series of parameters measured in Lake Champlain, 2006. Further detailsas in Fig. 1.
Table 3Experimentally significant treatment effects and interactions on the growth rates of toxic and non-toxic Microcystis as determined by a 3-way ANOVA.
Treatment effects Interactions
Toxic Non-toxic Toxic Non-toxic
Lake Agawam18-Jul-05 T** T** – –24-Oct-06 T* !T*** !T and N**, !T and P**
Lake Ronkonkoma5-Jul-05 T*,P*** P*** N and P** T and P**, T and N and P*
Lake Champlain1-Aug-06 T***, N**, P*** T***, P*** T and N**, T and P***, N and P*** –
Mill Pond27-Jun-06 T* – – –ll-Jul-06 – – T and P** N and P**
A negative sign before a nutrient indicates that the treatment yielded a significant decrease in growth rates, whereas all others yielded significantly higher growth rates.* p < 0.05.** p < 0.01.*** p < 0.001.
T.W. Davis et al. / Harmful Algae 8 (2009) 715–725 721

Author's personal copy
yielded toxic population growth rates that were 20% higher than thecontrol (p < 0.01; Table 3; Fig. 6). Furthermore, although notstatistically significant, concurrent enrichment of temperature, Nand P yielded a growth rate for toxic Microcystis that was 40% greaterthen the control and was the highest growth rate for either populationamong all the treatments (1.54 " 0.11 d!1; Fig. 6). On the other hand,the interaction between N and P was significant for the non-toxicpopulation yielding growth rates which were enhanced 3-fold overunamended controls (p < 0.01; Table 3; Fig. 6).
3.2.4. Lake champlainDuring the Lake Champlain experiment, ambient water
temperatures were 24.9 " 2.0 8C. Experimentally enhanced tem-
peratures (29.1 " 1.3 8C) significantly increased the growth rates ofboth toxic and non-toxic Microcystis populations by 80% and 101%respectively (p < 0.001; Table 3; Fig. 6). Increased nitrogen concen-trations stimulated growth rates of the toxic Microcystis population,increasing them 40% over the unamended controls (p < 0.01; Table 3;Fig. 6). Furthermore, phosphorus enrichment significantly increasedthe growth rates of both toxic and non-toxic populations by 60% and68%, respectively (p < 0.001; Table 3; Fig. 6). Finally, nutrients (N or P)interacted with temperature, to enhance toxic Microcystis growthrates (p < 0.01; Table 3; Fig. 6) with the enhanced P and temperaturetreatment yielding the highest growth rates of any population amongall treatments (1.17 " 0.03 d!1).
4. Discussion
Harmful cyanobacterial blooms have increased globally infrequency and intensity in recent decades. Eutrophication andwarmer temperatures are often cited as key factors which promotethese events (Paerl, 1988; Chorus and Bartram, 1999; Hudnell andDortch, 2008; Paerl and Huisman, 2008). Previous studies haveinvestigated the effects of singular environmental factors on thegrowth and/or abundance and/or photosynthesis of total Micro-cystis populations such as light (Codd and Poon, 1988; Wiedneret al., 2003; Kim et al., 2005), nutrient enrichment (Watanabe andOishi, 1985; Codd and Poon, 1988; Fujimoto et al., 1997; Orr andJones, 1998; Lee et al., 2000; Oh et al., 2000; Paerl et al., 2001; Vezieet al., 2002; Downing et al., 2005; Gobler et al., 2007), salinity(Tonk et al., 2007) and temperature (Konopka and Brock, 1978;Takamura et al., 1985; Robarts and Zohary, 1987). Other studieshave found that Microcystis can out-compete other species ofphytoplankton at high temperatures (%30 8C; Fujimoto et al.,1997). However, to our knowledge, this is the first field study toinvestigate the effects of increased temperature and nutrientconcentrations on the growth rates of toxic and non-toxicsubpopulations of Microcystis. Our ability to examine thisphenomenon along with the in situ dynamics of these twopopulations within four distinct ecosystems during two yearshas generated data set which provides new insight regarding theecology of toxic Microcystis blooms.
4.1. Seasonal dynamics of toxic and non-toxic Microcystis
Microcystin was detected in all four ecosystems studied onevery date analyzed (Figs. 1–5). Toxic Microcystis cells comprisedbetween 0.01% and 100% of the total Microcystis population amongthe four systems, a range larger than those found in prior studies(Kurmayer and Kutzenberger, 2003; Rinta-Kanto et al., 2005;Rinta-Kanto and Wilhelm, 2006; Yoshida et al., 2006; Hotto et al.,2008). However, there were notable differences, even among thesystems presented here. In Lake Ronkonkoma, toxic Microcystiscomprised between 12% and 100% of total cells, whereas the rangewas between 0.01% and 6% in other systems. The seasonaldynamics of toxic and non-toxic Microcystis observed in LakeRonkonkoma, the only stratified lake studied, were consistent withthe findings of Kardinaal et al. (2007) who also found toxic strainsof Microcystis were succeeded by non-toxic strains in a deepstratified lake. However, in the well-mixed systems we studied(Lake Agawam, northeastern Lake Champlain, Mill Pond), toxicstrains comprised a small portion of total cells where as Kardinaalet al. (2007) found the toxic strains dominated Microcystispopulations in the two unstratified lakes. The seasonal dynamicsof cyanobacterial blooms in general, and toxic and non-toxicstrains of Microcystis in particular, likely vary based on system-specific physical and/or environmental conditions.
The World Health Organization (WHO) currently recommendsmonitoring chlorophyll a concentrations and total cyanobacterial
Fig. 6. Net growth rates of toxic Microcystis (right half of figure) and nontoxicMicrocystis (left half of figure) during nutrient amendment experiments (t = 72 h)conducted in various systems during the 2005 and 2006 field seasons at ambient(white bars) and elevated (black bars) temperatures. C: control; N: nitrate; P: ortho-phosphate. Error bars represent " 1 SD of triplicate experimental bottles.
T.W. Davis et al. / Harmful Algae 8 (2009) 715–725722

Author's personal copy
cell counts to protect against human exposure to high levels ofmicrocystin (Chorus and Bartram, 1999). However, of the five fielddata sets generated by this study (Figs. 1–5), only two displayedmildly significant correlations between chlorophyll a concentra-tions and concentrations of microcystin (p < 0.05) while only threeshowed significant correlations between total cyanobacterial cellcounts and microcystin concentrations (p < 0.05). This is notsurprising as all phytoplankton contain chlorophyll a and nearlyevery major species of cyanobacteria has both toxic and non-toxicstrains (Chorus and Bartram, 1999). However, in all five of the timeseries data sets generated by this study, densities of toxicMicrocystis cells were significantly correlated with microcystinlevels (p < 0.05 for all; Figs. 1–5), often at a very high level ofsignificance (Lake Ronkonkoma, Lake Agawam, Mill Pond;p < 0.001). Obviously, the predominance of other microcystinproducing genera will influence the relationship between toxicMicrocystis cells and microcystin (Rantala et al., 2006; Rinta-Kantoand Wilhelm, 2006) and the presence of the mcyD gene does notnecessarily translate into the synthesis of microcystin in situ(Gobler et al., 2007). Despite this, our data demonstrates thatmcyD-containing Microcystis cells were a better predictor of pelagicmicrocystin concentrations than the total cell counts of cyano-bacteria, total Microcystis, or chlorophyll a and thus may be a betterpredictor of microcystin in aquatic ecosystems than parameterscurrently recommended to be monitored by the WHO.
4.2. Effects of temperature on the growth rates of toxic andnon-toxic strains of Microcystis
As seasonal temperatures increase from 10 to 30 8C in freshwaterecosystems, the phytoplankton group with the highest growth ratesgenerallyshifts fromdiatomstogreen algae tocyanobacteria (Canaleand Vogel, 1974; Reynolds, 1997). Furthermore, it has generally beenaccepted that cyanobacteria dominate phytoplankton assemblagesin temperate freshwater environments during the warmest periodsof the year, particularly in eutrophic systems (Canale and Vogel,1974; Reynoldsand Walsby,1975; Konopkaand Brock,1978;Tilmanand Kiesling, 1984; Paerl, 1988, 2008; Paerl and Huisman, 2008).Consistent with this idea, cyanobacteria in general, and Microcystis inparticular, dominated all of our study sites as temperatures reachedtheir annual pinnacle (Figs. 1–5). While toxic Microcystis cellsdensities also peaked during annual maximum temperatures in twoof our study sites (Lake Agawam, Lake Champlain; Figs. 1 and 5) theywere slightly off-set in two other sites (Mill Pond, Lake Ronkonkoma;Figs. 3 and 4) likely reflecting the additive role other factors, such asnutrients, can play in bloom dynamics (see Section 4.3). Moreimportantly, during five of the six (83%) experiments conducted, a$4 8C increase in experimental temperatures yielded significantlyhigher (22–115%) growth rates for toxic (mcyD-containing) Micro-cystis cells (Fig. 6). In contrast, the growth rates of non-toxicMicrocystis were significantly increased by higher temperature inonly a third of experiments conducted (Fig. 6). Furthermore, in five ofsix experiments, the growth rate of toxic Microcystis cells exceededthose of non-toxic cells within the enhanced temperature onlytreatment (Fig. 6). All experimentally elevated temperatures werebetween 15 and 30 8C the optimal range for Microcystis (Chorus andBartram, 1999), and in all but one experiment (Lake Agawam, 2006;temperature = 15 8C), the elevated temperatures fell between 25 and30 8C, a range which yields maximal cellular toxin content inMicrocystis (Van der Westhuizen and Eloff, 1985; Codd and Poon,1988). Kim et al. (2005) found that toxic Microcystis strains culturedat 25 8C had more mcyB transcripts than cultures reared at 20 or30 8C. Our observed increase in the abundance of ‘toxic’ Microcystisduring higher temperatures could represent more gene copies percell, more toxic cells, or both. However, any of these scenarios couldlead to higher levels of microcystin in aquatic ecosystems (Tillett
et al., 2000; Rinta-Kanto and Wilhelm, 2006). Hence, as surface watertemperatures continue to rise (Houghton et al., 2001), toxicMicrocystis may out-grow non-toxic Microcystis or may synthesizemore microcystin synthetase, yielding blooms that are comprised ofa larger proportion of toxic cells and/or have higher microcystinconcentrations. Moreover, as predicted by Paerl and Huisman(2008), our data also suggests future warming of temperate aquaticsystems could lead to toxic Microcystis dominating for longer timeperiods than they presently do.
4.3. The effects of nutrient enrichment on the growth rates oftoxic and non-toxic Microcystis
During two of the six experiments conducted (Lake Ronkon-koma, Lake Champlain), phosphorus loading yielded significantlyhigher growth rates for both toxic and non-toxic populations ofMicrocystis relative to control treatments, although growth rateswere not significantly different between these populations(Table 3; Fig. 6). These findings are contrary to those of Vezieet al. (2002) who found that at higher P concentrations the growthrates of toxic Microcystis exceeded non-toxic strains. However, ourresults were reasonable in light of the ambient nutrient levels asDIP was low (0.2 and 0.6 mM, respectively) and DIN concentrationswere greater than 11 mM during these experiments (Figs. 3 and 5).DIP levels were substantially higher within the two shallower andmore eutrophic systems we studied (Mill Pond, Lake Agawam;Figs. 1, 2 and 4) and P never affected Microcystis growth in thesesystems. Nitrogen loading significantly increased the growth rateof toxic Microcystis in Lake Champlain (Table 3; Fig. 6), a resultconsistent with Vezie et al. (2002) who found that increasing Nconcentrations in N-limited cultures significantly increased thegrowth rates of both toxic and non-toxic subpopulations ofMicrocystis. This result is also consistent with Gobler et al. (2007)who found that nitrogen can promote the growth and microcystinproduction of Microcystis during bloom events.
During many experiments we conducted, nutrients (N or P) andtemperature interacted to promote the growth of toxic Microcystis.In Lake Champlain, Mill Pond (June 2006), and Lake Agawam(2006), the concurrent enhancement of temperature and P yieldedgrowth rates for toxic Microcystis that not only increased 170%,125%, and 20%, respectively, relative to the controls but alsoyielded the highest growth rate of either population in anytreatment (Fig. 6). Similarly, during the Mill Pond experimentconducted during July 2006, the enrichment of N, P, andtemperature yielded a growth rate of toxic Microcystis that was40% greater than the control and was the highest growth rate ofeither population in all treatments (Fig. 6). These results aresomewhat consistent with the findings of Jiang et al. (2008), whodocumented that higher temperature and P yielded greaterabundance of total Microcystis cells. More importantly, theseresults suggest that future nutrient loading coupled with climaticwarming may promote toxic, rather than non-toxic, populations ofMicrocystis and thus may lead to more toxic blooms.
This study has demonstrated the manner in which temperatureand nutrients can interact to strongly influence the abundance andrelative dominance of toxic and non-toxic strains of Microcystiswithin bloom events across the Northeast US. However, ourprevious research has demonstrated that even toxic populations ofMicrocystis show seasonal changes in expression of the microcystinsynthetase gene (Gobler et al., 2007). As such, an important openquestion is the degree to which environmental factors such asnutrient loading and temperature changes influence microcystinsynthetase gene expression and cellular microcystin synthesiswithin an ecosystem setting. Moreover, whether other microcystinsynthesizing strains of other toxic cyanobacteria genera arepromoted by warming and eutrophication remains unknown.
T.W. Davis et al. / Harmful Algae 8 (2009) 715–725 723

Author's personal copy
In conclusion, we found that the portion of wild Microcystispopulations that were comprised of toxic cells varied seasonallyand by location from 0.01% to 100%. Molecularly quantifying toxic(mcyD-containing) Microcystis was a better predictor of in situmicrocystin levels than proxies currently recommended by theWHO to protect against human exposure to microcystin (totalcyanobacteria cell densities or chlorophyll a; Chorus and Bartram,1999). Warmer temperatures frequently (83% of experiments)shifted Microcystis toward populations comprised of a largerpercentage of toxic Microcystis and/or cells with more mcyD copiesper cell, scenarios which could yield more toxic blooms in anecosystem setting. Finally, this study demonstrated that highertemperatures coupled with elevated P concentrations frequentlyyielded growth rates of toxic Microcystis cells which exceeded allother treatments and populations. Therefore, continued climaticwarming and eutrophication could lead to a shift in cyanobacterialdominance toward blooms that contain a greater percentage oftoxic Microcystis cells and/or more microcystin synthetase genecopies and hence greater concentrations of microcystin.
Acknowledgements
We thank EPA-ECOHAB, New York Sea Grant, and the NewTamarind Foundation for financial support. We thank Charles Wall,Jen Goelski, Alison Citro, Michelle Weiss, Patrick Curran, AmandaBurson, Maria Alejandra Marcoval, Michael Satchwell, MatthewHarke, Colleen Norman, Justin Fischdicke and Lindsay Koza Moorefor field and laboratory assistance. We thank Tim Mihuc and theLake Champlain Research Institute for logistical support in LakeChamplain and the Stony Brook—Southampton Marine ScienceCenter for logistical support in Lake Agawam.[SS]
References
Bell, S.G., Codd, G.A., 1994. Cyanobacteria toxins and human health. Rev. Med.Microbiol. 5, 256–264.
Boyer, G.L., Matzin, M.C., Shambaugh, A.D., Satchwell, M.F., Rosen, B.H., Mihuc, T.,2004. The occurrence of cyanobacterial toxins in Lake Champlain. In: Manley, T.(Ed.), Partners hips Research in the New Millennium. Kluwer Academic/PlenumPublishers, pp. 241–257.
Canale, R.P., Vogel, A.H., 1974. Effects of temperature on phytoplankton growth. J.Environ. Eng. (American Society of Civil Engineers) 100, 229–241.
Carmichael, W.W., 1992. A status report on planktonic Cyanobacteria (Blue-GreenAlgae) and their Toxins. EPA/600/R-92/079, United States Environmental Pro-tection Agency, Cincinnati, OH.
Carmichael, W.W., Falconer, I.R., 1993. Diseases related to freshwater blue greenalgal toxins, and control measures. In: Falconer, I.R. (Ed.), Algal Toxins inSeafood and Drinking Water. Academic Press, pp. 187–209.
Carmichael, W.W., 1994. The toxins of cyanobacteria. Sci. Am. 270, 78–86.Carmichael, W.W., An, J.S., 1999. Using an enzyme linked immunosorbent assay
(ELISA) and a protein phosphatase inhibition assay (PPIA) for the detection ofmicrocystins and nodularins. Nat. Toxins 7, 377–385.
Carpenter, S.R., Caraco, N.F., Correll, D.L., Howarth, R.W., Sharpley, A.N., Smith, V.H.,1998. Nonpoint pollution of surface waters with phosphorus and nitrogen. Ecol.Appl. 8 (3), 559–568.
Chorus, I., Bartram, J., 1999. Toxic Cyanobacteria in Water: A Guide to Their PublicHealth Consequences, Monitoring and Management. World Health Organiza-tion/E&FN Spon/Routledge, London.
Codd, G.A., Poon, G.K., 1988. Cyanobacterial toxins. In: Rogers, L.J., Gallon, J.R.(Eds.), Biochemistry of the Algae and Cyanobacteria. Clarendon Press, Oxford,England, pp. 283–296.
Coyne, K.J., Handy, S.M., Demir, E., Whereat, E.B., Hutchins, D.A., Portune, K.J.,Doblin, M.A., Cary, S.C., 2005. Improved quantitative real-time PCR assays forenumeration of harmful algal species in field samples using an exogenous DNAreference standard. Limnol. Oceanogr.: Methods 3, 381–391.
Coyne, K.J., Cary, S.C., 2005. Molecular approaches to the investigation of viabledinoflagellate cysts in natural sediments from estuarine environments. J. Euk.Microbiol. 52, 90–94.
Dempster, E.L., Pryor, K.V., Francis, D., Young, J.E., Rogers, H.J., 1999. Rapid DNAextraction from ferns for PCR-based analyses. Biotechniques 27, 66–68.
Downing, T.G., Sember, C.S., Gehringer, M.M., Leukes, W., 2005. Medium N:P ratiosand specific growth rate comodulate microcystin and protein content inMicrocystis aeruginosa PCC7806 and M. aeruginosa UV027. Microb. Ecol. 49,468–473.
Falconer, I.R., Smith, J.V., Jackson, A.R.B., Jones, A., Runnegar, M.T.C., 1988. Oraltoxicity of a bloom of the cyanobacterium Microcystis aeruginosa administeredto mice over periods up to 1 year. J. Toxicol. Environ. Health 24, 291–305.
Fastner, J., Erhard, M., von Dohren, H., 2001. Determination of oligopeptide diversitywithin a natural population of Microcystis spp, (Cyanobacteria) by typing singlecolonies by matrix-assisted laser desorption ionization-time of flight massspectrometry. Appl. Environ. Microbiol. 67, 5069–5076.
Fleming, L.E., Rivero, C., Burns, J., Williams, C., Bean, J.A., Shea, K.A., Stinn, J., 2002.Blue green algal (cyanobacterial) toxins, surface drinking water, and livercancer in Florida. Harmful Algae 1, 157–168.
Fujimoto, N., Sudo, R., Sugiura, N., Inamori, Y., 1997. Nutrient-limited growth ofMicrocystis aeruginosa and Phormidium tenue and competition under variousN:P supply ratios and temperature. Limnol. Oceanogr. 42, 250–256.
Gobler, C.J., Davis, T.W., Coyne, K.J., Boyer, G.L., 2007. The interactive influences ofnutrient loading and zooplankton grazing on the growth and toxicity ofcyanobacteria blooms in a eutrophic lake. Harmful Algae 6, 119–133.
Hotto, A.M., Satchwell, M.F., Berry, D.L., Gobler, C.J., Boyer, G.L., 2008. Spatial andtemporal diversity of microcystins and microcystin-producing genotypes inOneida Lake, NY. Harmful Algae 7, 671–681.
Houghton, J.T., Ding, Y., Griggs, D.J., Noguer, M., Van der Lin-den, P.J., Dai, X., Maskell,K., Johnson, C.A., 2001. Climate Change 2001: The Scientific Basis. CambridgeUniversity Press, Cambridge, p. 881.
Hudnell, K.H., Dortch, Q., 2008, A synopsis of research needs identified at theinteragency, International symposium on cyanobacterial harmful algal blooms(ISOC-HAB). In: Hudnell, K.H. (Ed.), Cyanobacterial Harmful Algal Blooms: Stateof the Science and Research Needs Series: Advances in Experimental Medicineand Biology, vol. 619, 2008, XXIV, 950 pp.
IPCC, 2001. A report of working group I of the Intergovernmental Panel on ClimateChange. Summary for Policymakers and Technical Summary.
Ito, E., Kondo, F., Terao, K., Harada, K.-I., 1997. Neoplastic nodular formation inmouse liver induced by repeated intraperitoneal injections of microcystin-LR.Toxicon 35, 1453–1457.
Jiang, Y., Ji, B., Wong, R.N.S., Wong, M.H., 2008. Statistical study on the effects ofenvironmental factors on the growth and microcystins production of bloom-forming cyanobacterium-Microcystis aeruginosa. Harmful Algae 7, 127–136.
Johnk, K.D., Huisman, J., Sharples, J., Sommeijer, B., Visser, P.M., Strooms, J.M., 2008.Summer heatwaves promote blooms of harmful cyanobacteria. Global ChangeBiol. 14, 495–512.
Jones, M.N., 1984. Nitrate reduction by shaking with cadmium: Alternative tocadmium columns. Water Res. 18, 643–646.
Kaebernick, M., Neilan, B.A., Borner, T., Dittmann, E., 2000. Light and the transcrip-tional response of the microcystin biosynthesis gene cluster. Appl. Eviron.Microbiol. 66, 3387–3392.
Kardinaal, E.W., Tonk, L., Janse, I., Hol, S., Slot, P., Huisman, J., Visser, P.M., 2007.Competition for light between toxic and nontoxic strains of the harmfulcyanobacterium Microcystis. Appl. Environ. Microbiol. 73, 2939–2946.
Kim, H.R., Kim, C.K., Ahn, T.S., Yoo, S.A., Lee, D.H., 2005. Effects of temperature andlight on microcystin synthetase gene transcription in Microcystis aeruginosa.Key Eng. Mater. 277–279, 606–611.
Konopka, A., Brock, T.D., 1978. Effect of temperature on blue-green algae (cyano-bacteria) in Lake Mendota. Appl. Environ. Microbiol. 36, 572–576.
Kurmayer, R., Dittmann, E., Fastner, J., Chorus, I., 2002. Diversity of microcystingenes within a population of the toxic cyanobacterium Microcystis spp. in LakeWannsee (Berlin, Germany). Microb. Ecol. 43, 107–118.
Kurmayer, R., Kutzenberger, T., 2003. Application of real time PCR for quantificationof microcystin genotypes in a population of the toxic cyanobacterium Micro-cystis sp. Appl. Environ. Microbiol. 69, 6723–6730.
Lee, T., Tsuzuki, M., Takeuchi, T., Yokoyama, K., Karube, I., 1994. In vivo fluorometricmethod for early detection of cyanobacterial waterblooms. J. Appl. Phycol. 6,489–495.
Lee, S.J., Jang, M.-H., Kim, H.-S., Yoon, B.-D., Oh, H.M., 2000. Variation of microcystincontent of Microcystis aeruginosa relative to medium N:P ratio and growthstage. J. Appl. Microbiol. 89, 323–329.
Livak, K.J., Schmittgen, T.D., 2001. Analysis of relative gene expression data usingreal-time quantitative PCR and the 2-DDCt method. Methods 25, 402–408.
Myer, G.E., Gruendling, G.K., 1979. Limnology of Lake Champlain Lake ChamplainBasin Study. New England River Basins Commission, Burlington, VT.
Neilan, B.A., Jacobs, D., DelDot, T., Blackall, L.L., Hawkins, P.R., Cox, P.T., Goodman,A.E., 1997. rRNA sequences and evolutionary relationships among toxic andnontoxic cyanobacteria of the genus Microcystis. Int. J. Syst. Bacteriol. 47, 693–697.
Oh, H.-M., Lee, S.J., Jang, M.-H., Yoon, B.-D., 2000. Microcystin production byMicrocystis aeruginosa in a phosphorous-limited chemostat. Appl. Environ.Microbiol. 66, 176–179.
Oliver, R.L., Ganf, G.G., 2000. In: Whitton, B.A., Potts, M. (Eds.), Freshwater Blooms.The Ecology of Cyanobacteria, Their Diversity in Time and Space. KluwerAcademic, Dordrecht, The Netherlands, pp. 149–194.
Orr, P.T., Jones, G.J., 1998. Relationship between microcystin production and celldivision rates in nitrogen-limited Microcystis aeruginosa cultures. Limnol.Oceanogr. 43, 1604–1614.
Otsuka, S., Suda, S., Li, R., Watanabe, M., Oyaizu, H., Matsumoto, S., Watanabe, M.M.,1999. Phylogenetic relationships between toxic and non-toxic strains of thegenus Microcystis based on 16S to 23S internal transcribed spacer sequence.FEMS Microbiol. Lett. 172, 15–21.
Paerl, H.W., 1988. Nuisance phytoplankton blooms in coastal, estuarine, and inlandwaters. Limnol. Oceanogr. 33, 823–847.
T.W. Davis et al. / Harmful Algae 8 (2009) 715–725724

Author's personal copy
Paerl, H.W., Fulton, R.S., Moisander, P.H., Dyble, J., 2001. Harmful freshwater algalblooms with an emphasis on cyanobacteria. Sci. World 1, 76–113.
Paerl, H.W., Huisman, J., 2008. Blooms like it hot. Science 320, 57–58.Paerl, H.W., 2008. Nutrient and other environmental controls of harmful cyano-
bacterial blooms along the freshwater-marine continuum. In: Hudnell, K.H.(Ed.), Cyanobacterial Harmful Algal Blooms: State of the Science ResearchNeeds Series: Advances in Experimental Medicine and Biology, vol. 619. XXIV,950 pp.
Parsons, T.R., Maita, Y., Lalli, C.M., 1984. A Manual of Chemical and BiologicalMethods for Seawater Analysis. Pergomon Press, Oxford.
Paul, V.J., 2008. Global warming and cyanobacterial harmful algal booms. In:Hudnell, K.H. (Ed.), Cyanobacterial Harmful Algal Blooms: State of the ScienceResearch Needs Series: Advances in Experimental Medicine and Biology, vol.619. XXIV, 950 pp.
Philipp, R., Rowland, M.G.M., Baxter, P.J., McKenzie, C., Bell, R.H., 1991. Health risksfrom exposure to algae. CDR (London: England Rev.) 1, R67–R68.
Rantala, A., Rajaniemi-Wacklin, P., Lyra, C., Lepisto, L., Rintala, J., Mankiewiez-Boczek, J., Sivonen, K., 2006. Detection of microcystin-producing cyanobacteriain Finnish lakes with genus-specific microcystin synthetase gene E (mcyE) PCRand associations with environmental factors. Appl. Environ. Microbiol. 72,6101–6110.
Rapala, J., Sivonen, K., Lyra, C., Niemela, S.I., 1997. Variation of microcystin, cya-nobacterial hepatotoxins, in Anabaena spp as a function of growth stimulation.App. Environ. Microbiol. 63, 2206–2212.
Reynolds, C.S., Walsby, A.E., 1975. Waterblooms. Biol. Rev. 50, 437–481.Reynolds, C.S., 1997. Successional development, energetics, and diversity in plank-
tonic communities. In: Abe, T., Levin, S.A., Higashi, M. (Eds.), Biodiversity: AnEcological Perspective, Springer, 247 pp.
Reynolds, C.S., 2006. Ecology of Phytoplankton. Cambridge University Press, Cam-bridge, 550 pp.
Rinta-Kanto, J.M., Ouellette, A.J.A., Boyer, G.L., Twiss, M.R., Bridgeman, T.B., Wilhelm,S.W., 2005. Quantification of Toxic Microcystis spp. during the 2003 and 2004Blooms in Western Lake Erie using Quantitative Real-Time PCR. Environ. Sci.Technol. 39, 4198–4205.
Rinta-Kanto, J.M., Wilhelm, S.W., 2006. Diversity of microcystin-producing cyano-bacteria in spatially isolated regions of Lake Erie. Appl. Eviron. Micorbiol. 72,5083–5085.
Robarts, R.D., Zohary, T., 1987. Temperature effects on photosynthetic capacity,respiration, and growth rates of bloom-forming cyanobacteria. N. Z. J. Mar.Freshwater Res. 21, 391–399.
Shambaugh, A., Duchovany, A., McIntosh, A., 1999. A survey of Lake Champlain’splankton. Lake Champlain in Transition: From research toward restorationWater Science Application, vol. 1. American Geophysical Union, Washington,pp. 323–340.
Sivonen, K., 1990. Effects of light, temperature, nitrate, orthophosphate, and bac-teria on growth of and hepatotoxin production by Oscillatoria agardhii strains.Appl. Environ. Microbiol. 56, 2658–2666.
Smith, V.H., 1986. Light and nutrient effects on the relative biomass of blue-greenalgae in lake phytoplankton. Can. J. Fish. Aquat. Sci. 43, 148–153.
Takamura, N., Iwakuma, T., Yasuno, M., 1985. Photosynthesis and primary productionof Microcystis aeruginosa Ktitz. in Lake Kasumigaura. J. Plankton Res. 7, 303–312.
Tillett, D., Dittmann, E., Erhard, M., von Dohren, H., Borner, T., Neilan, B.A., 2000.Structural organization of microcystin biosynthesis in Microcystis aeruginosaPCC7806: an integrated peptide–polyketide synthetase system. Chem. Biol. 7,753–764.
Tilman, D., Kiesling, R.L., 1984. Freshwater algal ecology: taxonomic trade-offs in thetemperature dependence of nutrient competitive abilities. In: Klug, M.J., Reddy,C.A. (Eds.), Current Perspectives in Microbial Ecology. American Society forMicrobiology, Washington, DC, pp. 314–319.
Tonk, L., Boch, K., Visser, P., Huisman, J., 2007. Salt tolerance of the harmfulcyanobacterium Microcystis aeruginosa. Aquat. Microb. Ecol. 46, 117–123.
Trimbee, A.M., Prepas, E.E., 1987. Evaluation of total phosphorus as a predictor ofrelative biomass of blue-green algae with an emphasis on Alberta lakes. Can. J.Fish. Aquat. Sci. 44, 1337–1342.
Utkilen, H., Gjølme, N., 1995. Iron-stimulated toxin production in Microcystisaeruginosa. Appl. Eviron. Microbiol. 61, 797–800.
Van der Westhuizen, A.J., Eloff, J.N., 1985. Effect of temperature and light on thetoxicity and growth 6: 91-105. of the blue-green alga Microcystis aeruginosa(UV-006). Planta 163, 55–59.
Vezie, C., Rapala, J., Vaitomaa, J., Seitsonen, J., Sivonen, K., 2002. Effect of nitrogenand phosphorus on growth of toxic and nontoxic Microcystis strains and onintracellular microcystin concentrations. Microb. Ecol. 43, 443–454.
Watanabe, M.F., Oishi, S., 1985. Effects of environmental factors on toxicity of acyanobacterium (Microcystis aeruginosa) under culture conditions. Appl.Environ. Microbiol. 49, 1342–1344.
Watras, C.J., Baker, A.L., 1988. Detection of planktonic cyanobacteria by tandem invivo fluorometry. Hydrobiologia 169, 77–84.
Watson, S.B., McCauley, E., Downing, J.A., 1997. Patterns in phytoplankton taxo-nomic composition across temperate lakes of differing nutrient status. Limnol.Oceanogr. 42, 487–495.
Wiedner, C., Visser, P.M., Fastner, J., Metcalf, J.S., Codd, G.A., Mur, L.R., 2003. Effects oflight on the microcystin content of Microcystis strain PCC 7806. Appl. Environ.Microbiol. 69, 1475–1481.
Yoshida, T., Takashima, Y., Tomaru, Y., Shirai, Y., Takao, Y., Hiroisha, S., Nagasaki, K.,2006. Isolation and characterization of a cyanophage infecting the toxic Cya-nobacterium Microcystis aeruginosa. Appl. Environ. Microbiol. 72, 1239–1247.
Zegura, B., Sedmak, B., Filipic, M., 2003. Microcystin-LR induces oxidative DNAdamage in human hepatoma cell line HepG2. Toxicon 41, 41–48.
T.W. Davis et al. / Harmful Algae 8 (2009) 715–725 725

Exhibit C
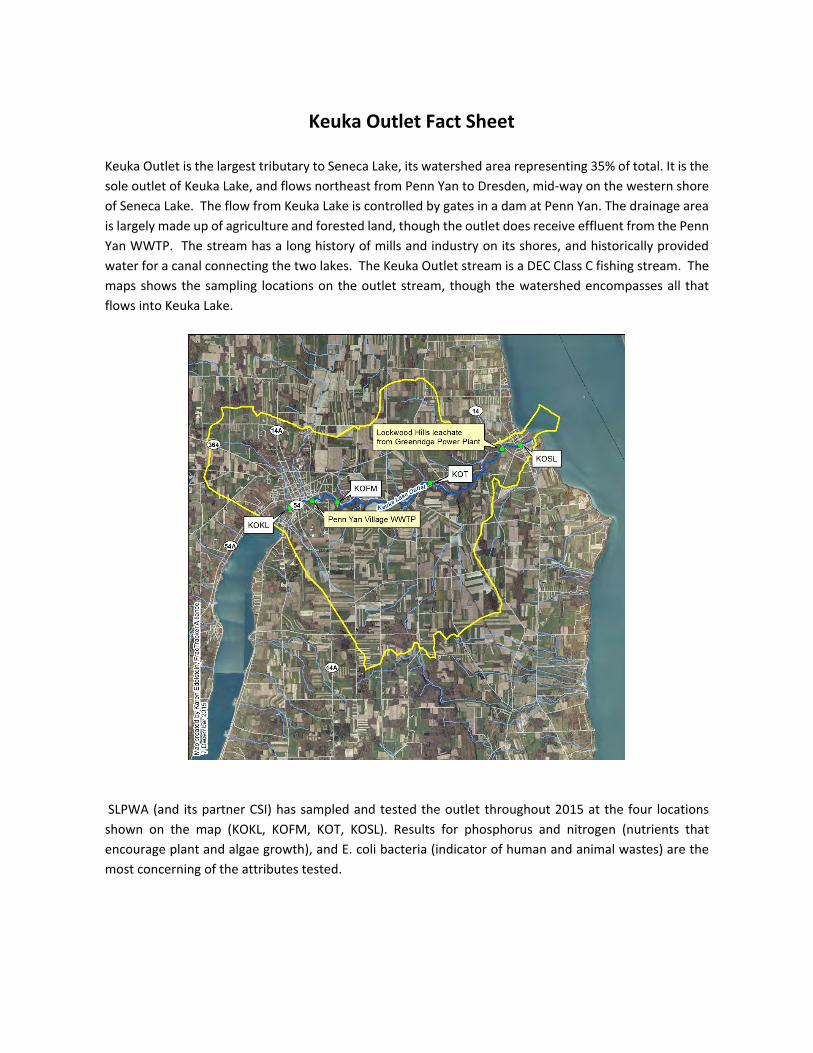
Keuka Outlet Fact Sheet Keuka Outlet is the largest tributary to Seneca Lake, its watershed area representing 35% of total. It is the sole outlet of Keuka Lake, and flows northeast from Penn Yan to Dresden, mid‐way on the western shore of Seneca Lake. The flow from Keuka Lake is controlled by gates in a dam at Penn Yan. The drainage area is largely made up of agriculture and forested land, though the outlet does receive effluent from the Penn Yan WWTP. The stream has a long history of mills and industry on its shores, and historically provided water for a canal connecting the two lakes. The Keuka Outlet stream is a DEC Class C fishing stream. The maps shows the sampling locations on the outlet stream, though the watershed encompasses all that flows into Keuka Lake.
SLPWA (and its partner CSI) has sampled and tested the outlet throughout 2015 at the four locations shown on the map (KOKL, KOFM, KOT, KOSL). Results for phosphorus and nitrogen (nutrients that encourage plant and algae growth), and E. coli bacteria (indicator of human and animal wastes) are the most concerning of the attributes tested.
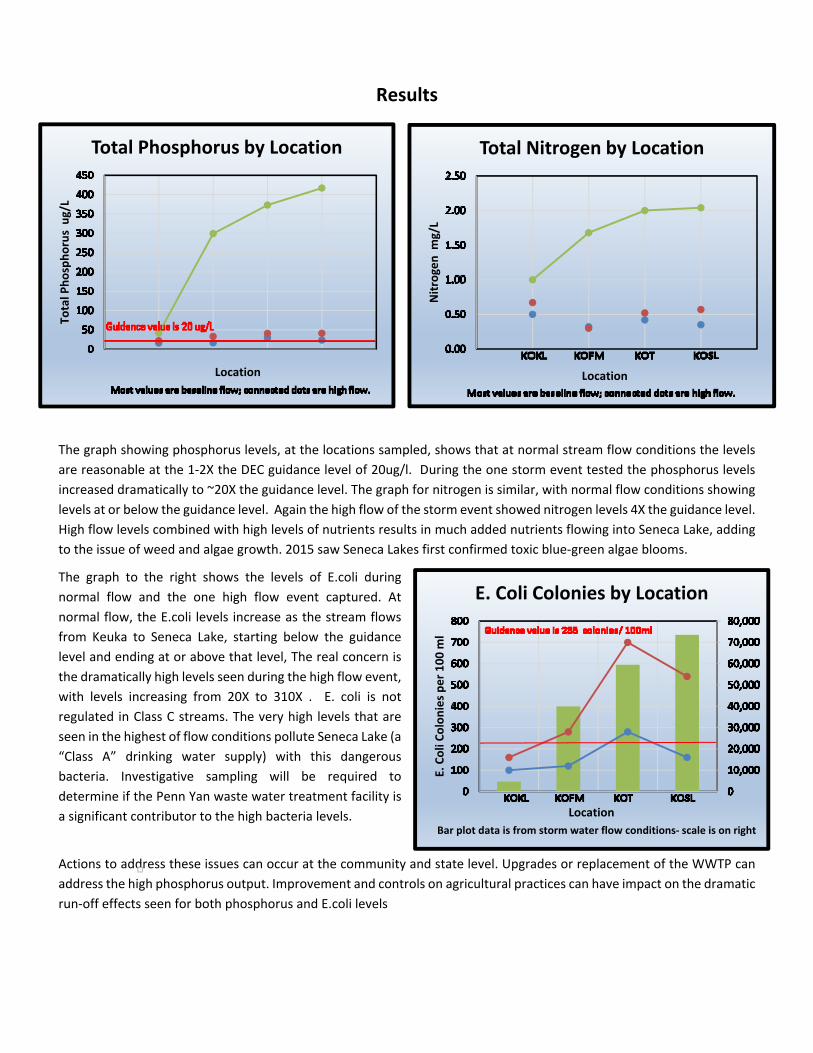
Results
The graph showing phosphorus levels, at the locations sampled, shows that at normal stream flow conditions the levels are reasonable at the 1‐2X the DEC guidance level of 20ug/l. During the one storm event tested the phosphorus levels increased dramatically to ~20X the guidance level. The graph for nitrogen is similar, with normal flow conditions showing levels at or below the guidance level. Again the high flow of the storm event showed nitrogen levels 4X the guidance level. High flow levels combined with high levels of nutrients results in much added nutrients flowing into Seneca Lake, adding to the issue of weed and algae growth. 2015 saw Seneca Lakes first confirmed toxic blue‐green algae blooms.
The graph to the right shows the levels of E.coli during normal flow and the one high flow event captured. At normal flow, the E.coli levels increase as the stream flows from Keuka to Seneca Lake, starting below the guidance level and ending at or above that level, The real concern is the dramatically high levels seen during the high flow event, with levels increasing from 20X to 310X . E. coli is not regulated in Class C streams. The very high levels that are seen in the highest of flow conditions pollute Seneca Lake (a “Class A” drinking water supply) with this dangerous bacteria. Investigative sampling will be required to determine if the Penn Yan waste water treatment facility is a significant contributor to the high bacteria levels.
Actions to address these issues can occur at the community and state level. Upgrades or replacement of the WWTP can address the high phosphorus output. Improvement and controls on agricultural practices can have impact on the dramatic run‐off effects seen for both phosphorus and E.coli levels
E. Coli C
olon
ies p
er 100
ml
Location
E. Coli Colonies by Location
Bar plot data is from storm water flow conditions‐ scale is on right
Total P
hospho
rus ug
/L
Location
Total Phosphorus by Location
Nitrog
en m
g/L
Location
Total Nitrogen by Location
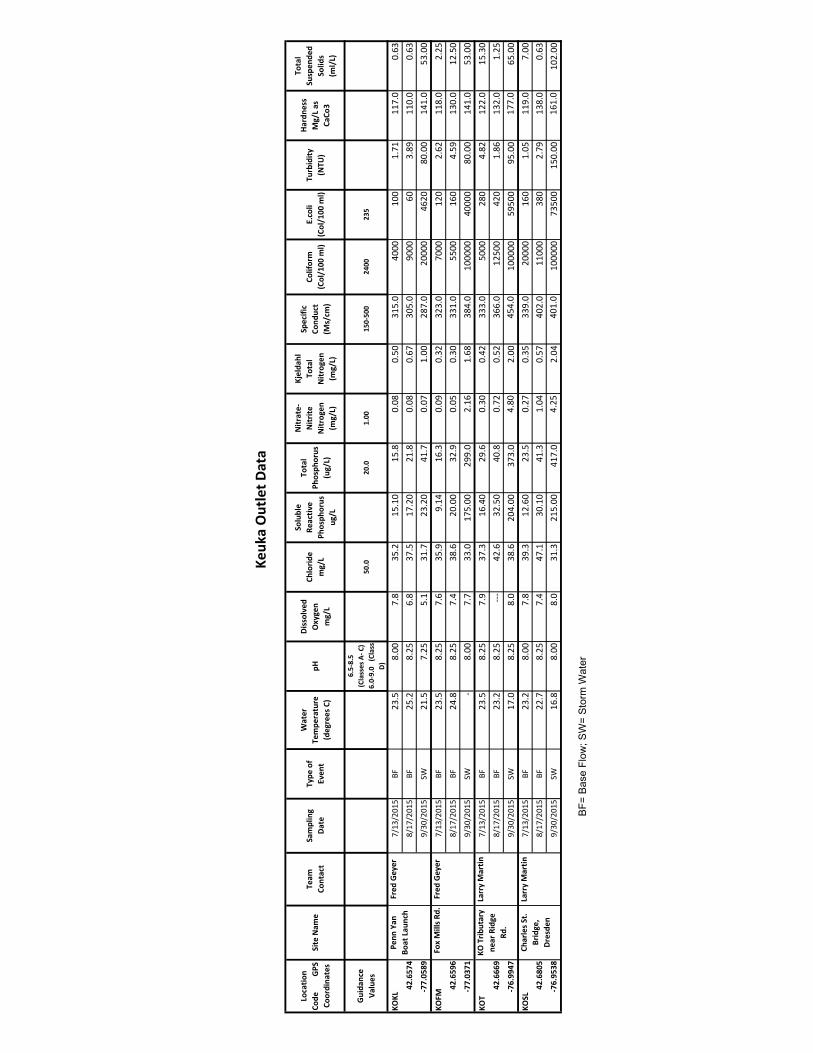
Locatio
n Co
de
PS
Coordina
tes
Site Nam
eTe
am
Contact
Sampling
ate
Type
of
Een
t
ater
Tempe
rature
degree
s Cp
issol
ed
Oygen
mg/L
Chlorid
e mg/L
Soluble
Reacti
e Ph
osph
orus
ug/L
Total
Phosph
orus
ug/L
Nitrate‐
Nitrite
Nitrog
en
mg/L
Kelda
hl
Total
Nitrog
en
mg/L
Specific
Cond
uct
s/cm
Coliform
Col/10
0 ml
E.coli
Col/10
0 ml
Turbidity
NT
ardn
ess
g/L a
s Ca
Co
Total
Suspen
ded
Solid
s ml/L
uida
nce
alue
s
.‐.
Classes
‐ C
.0‐.0
Class
0.0
0.0
1.00
10‐
0000
KOKL
/13/20
15F
23.5
.00
.35
.215
.10
15.
0.0
0.50
315.0
4000
100
1.1
11.0
0.3
./1
/201
5F
25.2
.25
.3
.51
.20
21.
0.0
0.30
5.0
000
03.
110.0
0.3
‐.0
/30/20
15SW
21.5
.25
5.1
31.
23.20
41.
0.0
1.00
2.0
2000
04
200.00
141.0
53.00
KOF
/13/20
15F
23.5
.25
.35
..14
1.3
0.0
0.32
323.0
000
120
2.2
11.0
2.25
./1
/201
5F
24.
.25
.43
.20
.00
32.
0.05
0.30
331.0
5500
10
4.5
130.0
12.50
‐.0
1/30/20
15SW
‐.00
.33
.01
5.00
2.0
2.1
1.3
4.0
1000
0040
000
0.00
141.0
53.00
KOT
/13/20
15F
23.5
.25
.3
.31
.40
2.
0.30
0.42
333.0
5000
20
4.2
122.0
15.30
./1
/201
5F
23.2
.25
‐‐‐42
.32
.50
40.
0.2
0.52
3.0
1250
042
01.
132.0
1.25
‐.
/30/20
15SW
1.0
.25
.03
.20
4.00
33.0
4.0
2.00
454.0
1000
005
500
5.00
1.0
5.00
KOSL
/13/20
15F
23.2
.00
.3
.312
.0
23.5
0.2
0.35
33.0
2000
01
01.05
11.0
.00
.0
/1/201
5F
22.
.25
.44
.130
.10
41.3
1.04
0.5
402.0
1100
03
02.
13.0
0.3
‐.
/30/20
15SW
1.
.00
.031
.321
5.00
41.0
4.25
2.04
401.0
1000
0035
0015
0.00
11.0
102.00
Keuk
a Outlet D
ata
Charles S
t. Bridge
resden
Larry
artin
Penn
an
Bo
at La
unch
Fred
ey
er
Fo
ills R
d.Fred
ey
er
KO Trib
utary
near Ridge
Rd
.
Larry
artin
BF=
Base
Flo
w; S
W=
Stor
m W
ater