bp-14 final rate proposal - bpa.gov · bp-14-fs-bpa-05 page iv fhfo funds held for others fors...
TRANSCRIPT
B O N N E V I L L E P O W E R A D M I N I S T R A T I O N
BP-14 Final Rate Proposal
Generation Inputs Study
BP-14-FS-BPA-05
July 2013


BP-14-FS-BPA-05
Page i
TABLE OF CONTENTS
Section Page
COMMONLY USED ACRONYMS AND SHORT FORMS ...................................................... iii
1. INTRODUCTION ...............................................................................................................1
1.1 Purpose of Study ......................................................................................................1
1.2 Summary of Study ...................................................................................................1
2. BALANCING RESERVE CAPACITY QUANTITY FORECAST ...................................3
2.1 Introduction ..............................................................................................................3
2.1.1 Purpose of the Balancing Reserve Capacity Quantity Forecast ................3
2.1.2 Overview ...................................................................................................3
2.2 Existing and Future Generation Projects for the Rate Period ..................................4
2.3 Wind Scheduling Commitment and Service Elections ............................................7
2.4 Balancing Reserve Capacity Requirements Methodology ......................................7
3. OPERATING RESERVE REVENUE FORECAST .........................................................11
3.1 Introduction ............................................................................................................11
3.2 Applicable Regional Reliability Standards for Operating Reserve .......................11
3.3 Calculating the Quantity of Operating Reserve Using the Proposed Standard BAL-002-WECC-1 .................................................................................13
3.4 Operating Reserve Revenue Forecast ....................................................................15
4. SYNCHRONOUS CONDENSING...................................................................................17
4.1 Introduction ............................................................................................................17
4.2 Synchronous Condenser Costs ...............................................................................17
4.3 General Methodology to Determine Energy Consumption ...................................18
4.3.1 Grand Coulee Project ..............................................................................19
4.3.2 John Day, The Dalles, and Dworshak Projects .......................................20
4.3.3 Palisades Project .....................................................................................20
4.3.4 Willamette River Projects .......................................................................21
4.3.5 Hungry Horse Project .............................................................................21
4.4 Costs Allocated to Transmission Services .............................................................21
5. GENERATION DROPPING .............................................................................................23
5.1 Introduction ............................................................................................................23
5.2 Generation Dropping .............................................................................................23
5.3 Forecast Amount of Generation Dropping ............................................................23
5.4 General Methodology ............................................................................................24
5.5 Generation Dropping Cost .....................................................................................24
5.6 Equipment Deterioration, Replacement, or Overhaul............................................25
5.7 Costs to be Allocated to Transmission Services ....................................................26
BP-14-FS-BPA-05
Page ii
6. REDISPATCH ...................................................................................................................27
6.1 Introduction ............................................................................................................27
6.2 Discretionary Redispatch .......................................................................................29
6.3 NT Firm Redispatch ...............................................................................................30
6.4 Emergency Redispatch...........................................................................................31
6.5 Revenue Forecast for Attachment M Redispatch Service .....................................31
7. SEGMENTATION OF U.S. ARMY CORPS OF ENGINEERS AND U.S. BUREAU OF RECLAMATION TRANSMISSION FACILITIES ..................................33
7.1 Introduction ............................................................................................................33
7.2 Generation Integration ...........................................................................................33
7.3 Integrated Network ................................................................................................34
7.4 Utility Delivery ......................................................................................................34
7.5 COE Facilities ........................................................................................................34
7.6 Reclamation Facilities ............................................................................................34
7.6.1 Columbia Basin Transmission Investment .............................................36
7.7 Annual Cost of the COE and Reclamation Facilities allocated to Transmission Services ...........................................................................................37
8. STATION SERVICE .........................................................................................................39
8.1 Introduction ............................................................................................................39
8.2 Overview of Methodology .....................................................................................39
8.3 Assessment of Installed Transformation ................................................................40
8.4 Assessment of Station Service Energy Use ...........................................................40
8.5 Calculation of Average Load Factor ......................................................................41
8.6 Calculating the Total Quantity of Station Service .................................................41
8.7 Determining Costs to Allocate to Station Service .................................................41
TABLES Table 1: Power Services' Generation Inputs Revenue Forecast for FY 2014–2015 ...................45
Table 2: Rates for Reserve-Based Ancillary and Control Area Services for FY 2014–2015 .........................................................................................................46
BP-14-FS-BPA-05
Page iii
COMMONLY USED ACRONYMS AND SHORT FORMS
AAC Anticipated Accumulation of Cash AGC Automatic Generation Control ALF Agency Load Forecast (computer model) aMW average megawatt(s) AMNR Accumulated Modified Net Revenues ANR Accumulated Net Revenues ASC Average System Cost BiOp Biological Opinion BPA Bonneville Power Administration Btu British thermal unit CDD cooling degree day(s) CDQ Contract Demand Quantity CGS Columbia Generating Station CHWM Contract High Water Mark COE, Corps, or USACE U.S. Army Corps of Engineers Commission Federal Energy Regulatory Commission Corps, COE, or USACE U.S. Army Corps of Engineers COSA Cost of Service Analysis COU consumer-owned utility Council or NPCC Northwest Power and Conservation Council CP Coincidental Peak CRAC Cost Recovery Adjustment Clause CSP Customer System Peak CT combustion turbine CY calendar year (January through December) DDC Dividend Distribution Clause dec decrease, decrement, or decremental DERBS Dispatchable Energy Resource Balancing Service DFS Diurnal Flattening Service DOE Department of Energy DSI direct-service industrial customer or direct-service industry DSO Dispatcher Standing Order EIA Energy Information Administration EIS Environmental Impact Statement EN Energy Northwest, Inc. EPP Environmentally Preferred Power ESA Endangered Species Act e-Tag electronic interchange transaction information FBS Federal base system FCRPS Federal Columbia River Power System FCRTS Federal Columbia River Transmission System FELCC firm energy load carrying capability

BP-14-FS-BPA-05
Page iv
FHFO Funds Held for Others FORS Forced Outage Reserve Service FPS Firm Power Products and Services (rate) FY fiscal year (October through September) GARD Generation and Reserves Dispatch (computer model) GEP Green Energy Premium GRSPs General Rate Schedule Provisions GTA General Transfer Agreement GWh gigawatthour HDD heating degree day(s) HLH Heavy Load Hour(s) HOSS Hourly Operating and Scheduling Simulator (computer model) HYDSIM Hydrosystem Simulator (computer model) ICE Intercontinental Exchange inc increase, increment, or incremental IOU investor-owned utility IP Industrial Firm Power (rate) IPR Integrated Program Review IRD Irrigation Rate Discount IRM Irrigation Rate Mitigation IRMP Irrigation Rate Mitigation Product JOE Joint Operating Entity kW kilowatt (1000 watts) kWh kilowatthour LDD Low Density Discount LLH Light Load Hour(s) LRA Load Reduction Agreement Maf million acre-feet Mid-C Mid-Columbia MMBtu million British thermal units MNR Modified Net Revenues MRNR Minimum Required Net Revenue MW megawatt (1 million watts) MWh megawatthour NCP Non-Coincidental Peak NEPA National Environmental Policy Act NERC North American Electric Reliability Corporation NFB National Marine Fisheries Service (NMFS) Federal Columbia River
Power System (FCRPS) Biological Opinion (BiOp) NLSL New Large Single Load NMFS National Marine Fisheries Service NOAA Fisheries National Oceanographic and Atmospheric Administration Fisheries NORM Non-Operating Risk Model (computer model) Northwest Power Act Pacific Northwest Electric Power Planning and Conservation Act
BP-14-FS-BPA-05
Page v
NPCC or Council Pacific Northwest Electric Power and Conservation Planning Council
NPV net present value NR New Resource Firm Power (rate) NT Network Transmission NTSA Non-Treaty Storage Agreement NUG non-utility generation NWPP Northwest Power Pool OATT Open Access Transmission Tariff O&M operation and maintenance OATI Open Access Technology International, Inc. OMB Office of Management and Budget OY operating year (August through July) PF Priority Firm Power (rate) PFp Priority Firm Public (rate) PFx Priority Firm Exchange (rate) PNCA Pacific Northwest Coordination Agreement PNRR Planned Net Revenues for Risk PNW Pacific Northwest POD Point of Delivery POI Point of Integration or Point of Interconnection POM Point of Metering POR Point of Receipt Project Act Bonneville Project Act PRS Power Rates Study PS BPA Power Services PSW Pacific Southwest PTP Point to Point Transmission (rate) PUD public or people’s utility district RAM Rate Analysis Model (computer model) RAS Remedial Action Scheme RD Regional Dialogue REC Renewable Energy Certificate Reclamation or USBR U.S. Bureau of Reclamation REP Residential Exchange Program RevSim Revenue Simulation Model (component of RiskMod) RFA Revenue Forecast Application (database) RHWM Rate Period High Water Mark RiskMod Risk Analysis Model (computer model) RiskSim Risk Simulation Model (component of RiskMod) ROD Record of Decision RPSA Residential Purchase and Sale Agreement RR Resource Replacement (rate) RRS Resource Remarketing Service

BP-14-FS-BPA-05
Page vi
RSS Resource Support Services RT1SC RHWM Tier 1 System Capability RTO Regional Transmission Operator SCADA Supervisory Control and Data Acquisition SCS Secondary Crediting Service Slice Slice of the System (product) T1SFCO Tier 1 System Firm Critical Output TCMS Transmission Curtailment Management Service TOCA Tier 1 Cost Allocator TPP Treasury Payment Probability TRAM Transmission Risk Analysis Model Transmission System Act Federal Columbia River Transmission System Act TRL Total Retail Load TRM Tiered Rate Methodology TS BPA Transmission Services TSS Transmission Scheduling Service UAI Unauthorized Increase ULS Unanticipated Load Service USACE, Corps, or COE U.S. Army Corps of Engineers USBR or Reclamation U.S. Bureau of Reclamation USFWS U.S. Fish and Wildlife Service VERBS Variable Energy Resources Balancing Service (rate) VOR Value of Reserves VR1-2014 First Vintage rate of the BP-14 rate period WECC Western Electricity Coordinating Council (formerly WSCC) WIT Wind Integration Team WSPP Western Systems Power Pool

BP-14-FS-BPA-05
Page 1
1. INTRODUCTION 1
The Federal Columbia River Power System (FCRPS) hydroelectric projects support BPA’s 2
transmission system and are instrumental in maintaining its reliability. In the context of this 3
Generation Inputs Study (Study), FCRPS is used to refer to only generation assets. The uses of 4
the FCRPS to support the transmission system and maintain reliability are generally referred to 5
as generation inputs. 6
7
1.1 Purpose of Study 8
On May 15, 2013, the Administrator issued a Record of Decision (Generation Inputs ROD) on 9
the Settlement Proposal for Generation Inputs and Transmission Ancillary and Control Area 10
Services Rates. Consistent with that decision, this Study provides documentation for the revenue 11
forecasts associated with the Ancillary and Control Area Services rates that were adopted in the 12
Generation Inputs ROD. It also provides documentation for certain generation inputs and inter-13
business line allocations not addressed by the Settlement Proposal. The revenues that are 14
forecast in this Study are applied in ratesetting as revenue credits in the Power Rates Study, 15
BP-14-FS-BPA-01, section 4. 16
17
Generation inputs include energy and balancing reserve capacity from the FCRPS that BPA uses 18
to provide Ancillary and Control Area Services and to maintain the reliability of the transmission 19
system. 20
21
1.2 Summary of Study 22
Section 2 of the Study describes the forecast of balancing reserve capacity needed for the 23
provision of Regulating Reserve, Following Reserve, Variable Energy Resource Balancing 24
Service (VERBS) Reserve, and Dispatchable Energy Resource Balancing Service (DERBS) 25
BP-14-FS-BPA-05
Page 2
Reserve. See also Generation Inputs ROD, BP-14-A-01, for the rates applied to those forecast 1
quantities to create the revenue forecast. Section 3 of the Study addresses Operating Reserve 2
(Contingency Reserve) and details the methodology for determining the forecast need. Other 3
generation inputs, including Synchronous Condensing, Generation Dropping, Redispatch 4
Service, and Station Service, are discussed in sections 4, 5, 6, and 8. Segmentation of U.S. Army 5
Corps of Engineers and U.S. Bureau of Reclamation Integrated Network and Delivery Facilities 6
costs is discussed in section 7. 7
8
A summary of the revenue forecast for supplying these generation inputs is shown in Table 1 of 9
the Study. The Ancillary and Control Area Services rates are shown in Study Table 2. 10
11
12
13
14
15
16
17
18
19
20
21
22
23
24
25 26

BP-14-FS-BPA-05
Page 3
2. BALANCING RESERVE CAPACITY QUANTITY FORECAST 1
2.1 Introduction 2
2.1.1 Purpose of the Balancing Reserve Capacity Quantity Forecast 3
The Balancing Reserve Capacity Quantity Forecast estimates the amount of balancing reserve 4
capacity needed for BPA to provide certain Ancillary and Control Area Services during the rate 5
period. The forecast described in this section focuses on the balancing reserve capacity needed 6
to provide regulating reserves, following reserves, and imbalance reserves, collectively called 7
balancing services. The quantity of balancing reserve capacity is an essential input for the 8
revenue credit associated with providing the balancing reserve capacity. See Table 1. 9
10
2.1.2 Overview 11
As a balancing authority, BPA must maintain load-resource balance in its balancing authority 12
area at all times. All generators within the BPA balancing authority area provide hourly 13
generation schedules to BPA that estimate the average amount of energy they expect to generate 14
in the coming hour. Based on these schedules, BPA estimates the average amount of load to be 15
served in the BPA balancing authority area in the coming hour. 16
17
Transmission customers submit hourly transmission schedules, identifying all energy to be 18
transmitted across or within the BPA balancing authority area in the coming hour. BPA uses the 19
transmission schedules to match generation inside the BPA balancing authority area and imports 20
of energy from other balancing authority areas with loads served inside the BPA balancing 21
authority area and exports to other balancing authority areas. The transmission schedules 22
identified with each adjacent balancing authority area are netted to determine interchange 23
schedules. The interchange schedules are netted for the BPA balancing authority area to 24
determine controller totals. 25
BP-14-FS-BPA-05
Page 4
Controller totals are the sum of all energy transactions to and from the BPA balancing authority 1
area. The BPA Automatic Generation Control (AGC) system calculates the deviation between 2
the (i) actual interchange flows and the (ii) controller totals plus dynamic schedules that affect 3
the controller total amount. The AGC system regulates the output of some specified FCRPS 4
generators in the BPA balancing authority area in response to changes in load, system frequency, 5
and other factors to maintain the scheduled system frequency and interchanges with other 6
balancing authority areas. The interchange schedules and controller totals do not change when a 7
generator deviates from its scheduled generation or a load deviates from the average hourly 8
estimate. The balancing authority area uses generation resources, assigned for balancing service 9
and connected to the AGC system, to offset differences between scheduled and actual generation 10
and to maintain within-hour load-resource balance in the balancing authority area. 11
12
BPA’s AGC system adjusts the generation of projects on automatic control based on the 13
differences between scheduled and actual load and generation. If load increases or generation 14
decreases, the AGC system increases (incs) output of balancing resources. If load decreases or 15
generation increases, the AGC system decreases (decs) output of balancing resources. The 16
cumulative inc and dec generation required to maintain load-resource balance within the hour 17
forms the basis for the balancing reserve capacity that BPA must maintain to provide balancing 18
services. 19
20
2.2 Existing and Future Generation Projects for the Rate Period 21
Developing the Balancing Reserve Capacity Quantity Forecast required to provide balancing 22
services during the rate period requires an estimate of the amount of generation that will be 23
online during that period. This estimate includes both the actual generating projects that are 24
online as of the time of the Study based on BPA records and a forecast of the projects that are 25

BP-14-FS-BPA-05
Page 5
expected to come online before or during the FY 2014–2015 rate period. Generation Inputs 1
Study Documentation, BP-14-FS-BPA-05A (Documentation), Table 2.1. 2
3
The forecast of projects that are expected to come online before or during the FY 2014–2015 rate 4
period is based on a review of the pending requests in BPA’s generator interconnection queue, 5
information provided for the requests under BPA’s Large Generator Interconnection Procedures 6
(LGIP), and the application of certain criteria. References to “future” or “planned” projects 7
throughout this Study indicate expectations with respect to the interconnection of certain 8
generating projects based on the assessment of the circumstances and information available at 9
the time but are not intended to convey certainty about interconnection of a particular generating 10
project. 11
12
To forecast which future generating projects will interconnect and the timing of such 13
interconnections, BPA considers the status of interconnection requests in BPA’s interconnection 14
queue in April 2013. For the evaluation of the interconnection queue, the requested 15
interconnection date in each interconnection request is only one of several factors considered to 16
assess a potential interconnection date for a project. Prior to interconnecting, each future project 17
must go through the LGIP study process, under which BPA completes a series of studies prior to 18
offering an interconnection agreement and interconnection date. This can be an extended 19
process, and the timing for the completion can vary substantially; therefore, the evaluation of 20
certain objective factors is necessary to make projections about the status of future projects. 21
Some of the factors include: 22
1. The status of the interconnection study process. Requests in the earlier 23
stages of the study process are less likely to interconnect in the near term 24
and thus are more likely to be relevant to future rate periods. 25
BP-14-FS-BPA-05
Page 6
2. The status of the environmental review process and interconnection 1
customer permitting process for the request. As a Federal agency, BPA 2
must conduct a review under the National Environmental Policy Act 3
(NEPA) and other Federal laws before deciding whether to interconnect a 4
particular generator. This review can take a substantial amount of time, 5
and BPA typically coordinates its review to coincide with the customer’s 6
state or county environmental permitting process. Requests that are not 7
far along in those processes are less likely to interconnect in the FY 2014–8
2015 rate period. 9
3. Interconnection and network project additions that affect the time required 10
to complete an interconnection. As studies progress, BPA and the 11
customer develop a more definite plan of service, and the time to construct 12
is better defined. The particular network additions and interconnection 13
facilities required to interconnect the generator and the time it would take 14
to construct those facilities are taken into account. 15
4. Information received in direct discussions with each developer about its 16
plans (e.g., project scheduling, financing, Federal and state incentives, 17
turbine ordering commitment). A significant factor that affects the 18
interconnection forecast is the date when a customer executes an 19
engineering and procurement agreement, which allows BPA to incorporate 20
the project in BPA’s construction program schedule, begin work on the 21
necessary interconnection facilities design, and begin ordering materials 22
and equipment with a long procurement lead time. 23
5. The execution of an interconnection agreement and commitment by the 24
customer to fund all BPA facilities necessary for the interconnection. A 25

BP-14-FS-BPA-05
Page 7
firm construction program schedule is included in the agreement. 1
Executing an interconnection agreement usually occurs just prior to the 2
construction phase of a project. 3
4
Documentation Table 2.1 identifies the amount of installed capacity that BPA forecasts will be 5
online during the FY 2014–2015 rate period for each type of generation accounted for in the 6
Balancing Reserve Capacity Quantity Forecast. The forecast of installed wind capacity is an 7
average of 4,587 MW; installed solar capacity is an average of 23 MW; non-AGC controlled 8
hydroelectric capacity is an average of 2,529 MW; non-Federal thermal capacity is an average of 9
4,297 MW; and Federal thermal capacity is 1,276 MW. 10
11
2.3 Wind Scheduling Commitment and Service Elections 12
Wind facilities in BPA’s balancing authority area made scheduling commitment and service 13
elections in April 2013. In their elections, they chose between participation in Self Supply, Self 14
Supply of the Imbalance portion of their Balancing Reserve Capacity only, committed 30-minute 15
persistence on 15-minute schedules (when and if available), committed 30-minute persistence on 16
30-minute schedules, committed 30-minute persistence on 60-minute schedules, or uncommitted. 17
The April 2013 elections are shown in Documentation Table 2.2. These elections, along with the 18
installed capacity forecast described in section 2.2 and the rates established in the Generation 19
Inputs ROD, BP-14-A-01, are used to determine the revenue credit to Power Services for 20
provision of balancing reserve capacity. See Study Table 1. 21
22
2.4 Balancing Reserve Capacity Requirements Methodology 23
In accordance with the Generation Inputs ROD, BPA will use a 99.5 percent planning standard 24
to determine the total balancing reserve capacity requirement. BP-14-A-01. The methodology 25

BP-14-FS-BPA-05
Page 8
for forecasting the balancing reserve capacity requirements uses the following one-minute 1
average datasets: actual balancing authority area load, balancing authority area load forecast, the 2
total hydroelectric generation, the total hydroelectric schedule, the total Federal thermal 3
generation (i.e., Columbia Generating Station or CGS), the total Federal thermal schedule, the 4
total non-Federal thermal generation, the total non-Federal thermal schedule, total solar 5
generation, total solar generation forecast, actual total wind generation, and total wind generation 6
forecast. Using these datasets, the actual load net generation is determined on a minute-by-7
minute basis. Then the load net generation forecast is determined on a minute-by-minute basis. 8
For purposes of the forecast, the total balancing reserve capacity requirement is the difference 9
between the minute-by-minute variations and the forecast schedules of the load net generation 10
dataset, also known as Station Control Error (SCE). The inc and dec amounts are calculated for 11
the amounts of wind penetration and load for FY 2014–2015. 12
13
Using a percentile distribution, values from the upper and lower 0.25 percent are discarded for 14
each component, leaving 99.5 percent of the values for calculating the capacity requirements of 15
the BPA balancing authority area. The result is a forecast of the balancing reserve capacity that 16
BPA needs to meet its balancing requirements 99.5 percent of the time. Using 99.5 percent of 17
values for the load net generation dataset, the balancing reserve capacity requirement forecast is 18
calculated for the total balancing reserve capacity requirement. The equations below describe 19
these calculations. 20
21
Total Reserve Requirement 22
Total inc = p9975(Total SCE) 23
Total dec = p0025(Total SCE) 24
BP-14-FS-BPA-05
Page 9
where p9975 is the 99.75% percentile distribution 1
p0025 is the 0.25% percentile distribution 2
Documentation Table 2.2, Columns L and M, identify the amount of total balancing reserve 3
capacity required under the 99.5 percent planning standard. 4
5
6
7
8
9
10
11
12
13
14
15
16
17
18
19
20
21
22
23
24
25

BP-14-FS-BPA-05
Page 10
This page intentionally left blank.
BP-14-FS-BPA-05
Page 11
3. OPERATING RESERVE REVENUE FORECAST 1
3.1 Introduction 2
Operating Reserve is the type of reserve that BPA is required to offer to transmission customers 3
pursuant to Schedules 5 and 6 of BPA’s Open Access Transmission Tariff (OATT). Operating 4
Reserve backs up resources in the BPA balancing authority area. Power rates are reimbursed 5
through revenue credits for the costs of providing Operating Reserve. Power Rates Study, 6
BP-14-FS-BPA-01, section 4.3. The reserve that BPA uses for Schedules 5 and 6 of the OATT 7
may be referred to in other contexts as “Contingency Reserve,” but for purposes of allocating 8
and assigning costs, BPA refers to such reserve as “Operating Reserve.” 9
10
In order to calculate the revenue forecast for Operating Reserves, this section describes (1) the 11
applicable Operating Reserve regional reliability standards that apply to the BPA balancing 12
authority area and (2) BPA’s methodology for forecasting the amount of Operating Reserve for 13
the rate period. 14
15
3.2 Applicable Regional Reliability Standards for Operating Reserve 16
BPA is obligated under the OATT to offer Operating Reserve, which includes both spinning 17
reserve capacity and non-spinning or supplemental reserve capacity. The OATT requires at least 18
half of the Operating Reserve to be spinning reserve. BPA determines the transmission 19
customer’s Spinning and Supplemental Operating Reserve requirement in accordance with 20
applicable North American Electric Reliability Corporation (NERC), Western Electricity 21
Coordinating Council (WECC), and Northwest Power Pool (NWPP) standards. 22
23
The current WECC standard requires each balancing authority area to maintain sufficient 24
Operating Reserve to meet the NERC Disturbance Control Standard BAL-STD-002-0. 25
BP-14-FS-BPA-05
Page 12
The amount must be equal to the greater of (1) the loss of generating capacity due to forced 1
outages of generation or transmission equipment that would result from the most severe single 2
contingency or (2) the sum of 5 percent of the load responsibility served by hydro generation and 3
7 percent of load responsibility served by thermal generation. At least half of the total 4
requirement must be spinning reserve. 5
6
Each NWPP member with variable generation (i.e., wind and solar) in its balancing authority 7
area must maintain Operating Reserve equal to 5 percent of the generation for which the 8
balancing authority has load responsibility. 9
10
On March 25, 2009, NERC submitted a petition to the Federal Energy Regulatory Commission 11
(Commission) seeking approval of a WECC-developed regional reliability standard designated 12
as BAL-002-WECC-1, Contingency Reserves, and the concomitant retirement of 13
BAL-STD-002-0. Version One Regional Reliability Standard for Resource and Demand 14
Balancing, FERC Docket No. RM09-15, Petition of NERC (Mar. 25, 2009). The proposed 15
WECC standard, BAL-002-WECC-1 (BAL-002), states that the minimum Operating Reserve 16
requirement would be the greater of (1) the most severe single contingency or (2) the sum of 17
3 percent of load (generation minus station service minus Net Actual Interchange) and 3 percent 18
of net generation (generation minus station service). At least half of the total requirement must 19
be spinning reserve. 20
21
On October 21, 2010, the Commission issued a remand for BAL-002 to NERC. Version One 22
Regional Reliability Standard for Resource and Demand Balancing, FERC Docket 23
No. RM09-15, Order No. 740, 133 FERC ¶ 61,063 (2010). In addressing concerns of the FERC 24
Order No. 740 remand, BAL-002 was resubmitted and passed in the March 2012 WECC 25
BP-14-FS-BPA-05
Page 13
Operating Committee by a member vote (117 affirmative, 31 negative, 10 abstain, 16 did not 1
vote), and subsequently approved by the WECC Board in June 2012. On April 12, 2013, NERC 2
submitted BAL-002 to FERC for approval. If approved, BAL-002 would become effective the 3
first day of the first calendar quarter that is six months beyond the date it is approved by the 4
Commission. 5
6
BPA must base its Operating Reserve forecast on the best information available regarding the 7
WECC standard for Operating Reserve. Based on BPA’s estimate of the timing of approval by 8
the Commission, plus the additional six-month requirement for implementation, BPA is 9
assuming that BAL-002 will be implemented at, or within a few months after, the start of the 10
FY 2014–2015 rate period. 11
12
3.3 Calculating the Quantity of Operating Reserve Using the Proposed 13 Standard BAL-002-WECC-1 14
The BPA balancing authority area Operating Reserve obligation under BAL-002 is determined 15
as follows. First, the BPA balancing authority area load is forecast using BPA balancing 16
authority area load in FY 2011 as the base year. The forecast of the loads through FY 2015 is 17
determined through the BPA Agency load forecast, resulting in balancing authority area load 18
growth of 0.87 percent in FY 2013, –0.35 percent in FY 2014, and 2.13 percent in FY 2015. 19
See Documentation Table 4.1. Second, BPA balancing authority area generation is forecast 20
based on a ratio of balancing authority area generation to balancing authority area load of 21
approximately 2:1 observed from FY 2010 through FY 2012. The generation forecast is then 22
adjusted for the forecast of two non-Federal thermal generators that are expected to leave the 23
BPA balancing authority area during the rate period. Third, the total BPA balancing authority 24
area Operating Reserve obligation is calculated by summing 3 percent of the forecast load and 25
3 percent of the forecast generation. The total BPA balancing authority area Operating Reserve 26

BP-14-FS-BPA-05
Page 14
obligation under the BAL-002 standard is forecast to be 560.1 MW in FY 2014 and 568.5 MW 1
in FY 2015 (564.3 MW average for FY 2014–2015). Documentation Table 3.1. 2
3
Operating Reserve obligation provided by self-supply and third-party supply is based on 4
customer elections for the FY 2014–2015 rate period made on May 1, 2013. To adjust that total 5
for the FY 2014–2015 rate period, two adjustments are made. First, the stated election is 6
adjusted to an expected provision basis. The hourly self-supply and third-party provision for 7
FY 2012 is analyzed using a cumulative probability function. Based on the historical data, BPA 8
expects that approximately 80 percent of the election amount will be self-supplied. Second, 9
because the proposed WECC standard is based on 3 percent of load and 3 percent of generation, 10
an additional step is needed to adjust the reserve obligation for third-party and self-suppliers. 11
This second adjustment accounts for the change in the Operating Reserve multiplier from 12
5.2 percent (the current Operating Reserve multiplier for BPA Federal generation mix based on 13
the weighted average of 7 percent for thermal resources and 5 percent for hydro and wind 14
resources) to 6 percent (3 percent of generation and 3 percent of load) pursuant to the proposed 15
change in the WECC standard. If the third-party and self-suppliers have both load and 16
generation in the BPA balancing authority area, the multiplier is adjusted from 5.2 percent to 6 17
percent. If either load or generation is outside the BPA balancing authority area, the multiplier is 18
adjusted from 5.2 percent to 3 percent. The FY 2014–2015 election amount of third-party supply 19
and self-supply is then multiplied by 80 percent (Eighty per cent is the FY 2012–2013 average 20
use of third-party supply and self-supply as compared to the election for that rate period.), which 21
results in a FY 2014–2015 forecast of 108.5 MW out of BPA’s total reserve obligation that will 22
be third-party and self-supplied. 23
24
BP-14-FS-BPA-05
Page 15
The difference between the total BPA balancing authority area Operating Reserve obligation and 1
the amount provided by self-supply and third-party supply yields BPA’s Operating Reserve 2
obligation. Assuming Commission approval of the proposed BAL-002 standard, the Power 3
Services Operating Reserve obligation would be 451.6 MW in FY 2014 and 460.0 MW in 4
FY 2015 (455.8 MW average for FY 2014–2015). Documentation Table 3.2. Shaped monthly 5
Operating Reserve amounts for FY 2014–2015, shown in Documentation Table 3.3, are based on 6
the monthly FY 2005–2011 percentage of BPA balancing authority area loads and BPA 7
balancing authority area generation. 8
9
3.4 Operating Reserve Revenue Forecast 10
The Spinning and Supplemental Operating Reserve rates were set in the Partial Settlement of 11
Generation Inputs and Transmission Ancillary and Control Area Services Rates, BP-14-A-01, 12
Attachment 1. Applying the settled rates to the forecast quantities yields a revenue forecast of 13
$21,680,947 for Operating Reserve – Spinning, and $19,864,220 for Operating Reserve – 14
Supplemental. Study Table 1, lines 14-15. 15
16
17
18
19
20
21
22
23
24

BP-14-FS-BPA-05
Page 16
This page intentionally left blank.
BP-14-FS-BPA-05
Page 17
4. SYNCHRONOUS CONDENSING 1
4.1 Introduction 2
A synchronous condenser is essentially a motor with a control system that enables the unit to 3
regulate voltage. These machines dynamically absorb or supply reactive power as necessary to 4
maintain voltage as needed by the transmission system. 5
6
Some FCRPS generators operate in synchronous condenser or “condense” mode for voltage 7
control and for other purposes (e.g., to accommodate operational constraints associated with 8
taking a unit offline). Generators operating in condense mode provide the same voltage control 9
function as they do when generating real power. As with any motor, a unit operating in 10
condense mode consumes real energy. Generators operating in condense mode in the FCRPS 11
consume energy supplied by other units in the FCRPS. 12
13
4.2 Synchronous Condenser Costs 14
Synchronous condensing costs are allocated to Transmission Services and recovered through 15
transmission rates. Synchronous condensing costs include the cost of (1) energy consumed by 16
FCRPS generators while operating in condense mode for voltage control; and (2) investments in 17
plant modifications at the John Day and The Dalles projects necessary to provide synchronous 18
condensing that were not part of the original design. This investment was made because adding 19
voltage support from these plants could best serve line loading concerns related to the Southern 20
Intertie. Because this investment and the operation of these synchronous condensers are 21
primarily to serve Southern Intertie needs, these costs are separated from other synchronous 22
condensers’ costs, which primarily serve the BPA Network. 23
24
BP-14-FS-BPA-05
Page 18
The investments in plant modifications at the John Day and The Dalles projects result in an 1
average cost of $287,000 per year. Documentation, Table 4.2, line 9; Power Revenue 2
Requirement Study Documentation, BP-14-FS-BPA-02A, Tables 2E and 2F. These costs are the 3
annual capital-related costs in the generation revenue requirement associated with the investment 4
that Power Services made in the plants at the request of Transmission Services to enable 5
synchronous condensing capability. 6
7
For the costs associated with the energy used in condense mode operations, the amount of 8
forecast energy is priced at an average annual market price, as described below. 9
10
4.3 General Methodology to Determine Energy Consumption 11
For the FY 2014–2015 rate period, the FCRPS generators capable of operating in condense mode 12
are identified, and the number of hours that the generators would operate in condense mode for 13
voltage control is forecast. The forecast is derived from historical synchronous condenser 14
operations, based on an average of the most recent three years of data available, which are fiscal 15
years 2007, 2008, and 2009. The average number of hours of use during these three years is 16
multiplied by the fixed hourly energy consumption for the generators to determine the amount of 17
energy consumed. The fixed hourly energy consumption is the motoring power consumption of 18
the specific generator units when they are operated in condense mode. Documentation 19
Table 4.1. Finally, the market price forecast shown in Table 4.1 is applied to the amount of 20
energy consumed to calculate the cost of synchronous condensing. The methodology for 21
assigning historical synchronous condenser operations to the voltage control function and 22
calculating the associated energy use for each of the FCRPS projects capable of operating in 23
condense mode is described below. 24
25

BP-14-FS-BPA-05
Page 19
4.3.1 Grand Coulee Project 1
Six generators (Units 19–24) at Grand Coulee are capable of operating as synchronous 2
condensers, although only three are typically operated in condense mode. The Study forecasts 3
the number of hours that the Grand Coulee units will operate in condense mode based on 4
historical condenser operations for the three-year historical period. The transmission system 5
typically needs additional voltage control from Grand Coulee during nighttime hours (generally 6
10 p.m. to 6 a.m.) when the lightly loaded transmission system generates excess reactive power 7
and causes voltage on the system to be high. If units online generating real power are 8
insufficient to provide the needed voltage control during the night, then units in condense mode 9
are assigned to voltage control. 10
11
For the forecast, the total measured reactive demand that the transmission system placed on the 12
six units during the nighttime hours is determined, based on reactive meter readings for the 13
historical three-year period. The total measured reactive demand represents the total reactive 14
support (i.e., megavolt amperes reactive) provided by the six units, regardless of whether the 15
units are condensing or generating real power. 16
17
For each hour, the total measured reactive demand is compared to the reactive capability of the 18
units online generating real power plus, if not operating, the reactive capability of the shunt 19
reactor (which absorbs reactive power and reduces voltage on the transmission system). If the 20
reactive capability of online units and the shunt reactor is less than the total measured reactive 21
demand for the hour, one or more units operating in condense mode are allocated to voltage 22
control for that hour. If a condensing unit is allocated to voltage control for a single nighttime 23
hour, the condensing operation of that unit is allocated to voltage control for the entire nighttime 24
period to reflect the fact that, in practice, a unit would not be started and stopped on an hourly 25

BP-14-FS-BPA-05
Page 20
basis. Condensing units are allocated to voltage control in whole increments until the total 1
measured reactive demand is met or exceeded. 2
3
The number of condensing hours for the three-year historical period is averaged, and energy 4
consumption is determined by multiplying the average annual condensing hours by the fixed 5
hourly energy consumption of the generators. The forecast of total energy consumed by the 6
Grand Coulee generators operating in synchronous condense mode for voltage control is 7
27,368 MWh. Documentation Table 4.1, line 4. 8
9
4.3.2 John Day, The Dalles, and Dworshak Projects 10
John Day has four generators (Units 11–14), The Dalles has five generators (Units 15–20), and 11
Dworshak has three generators (Units 1–3) capable of operating as synchronous condensers. 12
These three projects condense only when requested by Transmission Services, so all hours in 13
condense mode are for voltage control. The number of condensing hours using meter data for 14
the three-year historical period is averaged, and energy consumption is calculated by multiplying 15
the average annual condensing unit hours by the fixed hourly energy consumption of the 16
applicable hydro units. The forecast of total energy consumed by the generators operating in 17
condense mode for voltage control is 15,091 MWh for John Day and The Dalles (id. line 3) and 18
884 MWh for Dworshak. Id. lines 5 and 6. 19
20
4.3.3 Palisades Project 21
Palisades has four generators (Units 1–4) that are capable of synchronous condensing. Units are 22
operated in condense mode pursuant to standing instructions from Transmission Services based 23
on operational studies, so all hours in condense mode are for voltage control. The number of 24
condensing hours using meter data for the three-year historical period is averaged. Energy 25
BP-14-FS-BPA-05
Page 21
consumption is determined by multiplying the average annual condensing unit hours by the fixed 1
hourly energy consumption of the project. The forecast of energy consumption by the Palisades 2
generators operating in condense mode for voltage control is 1,054 MWh. Id. line 7. 3
4
4.3.4 Willamette River Projects 5
The Willamette River projects have seven generators capable of condensing, which include units 6
in Detroit (Units 1–2), Green Peter (Units 1–2), and Lookout Point (Units 1–3). Historically, 7
these units have been operated at times in condense mode. However, BPA studies indicate that 8
condensing is not required for voltage support except under rare conditions. Therefore, the 9
energy for condensing operation for voltage control is forecast to be zero for the Willamette 10
River projects. Id. lines 8-10. 11
12
4.3.5 Hungry Horse Project 13
Hungry Horse has four generators (Units 1–4) capable of condensing. Although capable of 14
condensing, Hungry Horse was not requested to operate in condense mode during the three-year 15
historical period. Therefore, the energy consumption for the Hungry Horse generators is forecast 16
to be zero. Id. line 11. 17
18
4.4 Costs Allocated to Transmission Services 19
The investments in plant modifications at John Day and The Dalles result in an average cost of 20
$288,000 per year. Documentation Table 4.2; Power Revenue Requirement Study 21
Documentation, BP-14-FS-BPA-02A, Tables 2E and 2F. 22
23
The energy forecast to be consumed by FCRPS generators operating in condense mode 24
totals 44,397 MWh. Documentation Table 4.1. The energy consumed for condensing operation 25
BP-14-FS-BPA-05
Page 22
is priced at the market price forecast as shown in the Power Risk and Market Price Study, 1
BP-14-FS-BPA-04, section 2.4. Applying the market price forecast of $28.85 per MWh to the 2
energy consumed results in a total cost of $1,280,853 per year. Documentation Table 4.1, 3
line 13. 4
5
Total synchronous condensing cost allocated to Transmission Services is $1,568,000 per year. 6
Documentation Table 4.3, line 5. This amount is made up of $435,000 per year in energy costs 7
(id. line 2), $288,000 per year in plant investments for the Southern Intertie (id. line 1), and 8
$845,000 in energy costs for the Network. Id. line 4. 9
10
11
12
13
14
15
16
17
18
19
20
21
22
23
24
25
BP-14-FS-BPA-05
Page 23
5. GENERATION DROPPING 1
5.1 Introduction 2
This section describes the method for allocating costs of Generation Dropping, including 3
identifying the assumptions used in the methodology and establishing the generation input cost 4
allocation that is applied to determine the annual revenue forecast for generation inputs. 5
6
5.2 Generation Dropping 7
The BPA transmission system is interconnected with several other transmission systems. To 8
maximize the transmission capacity of these interconnections while maintaining reliability 9
standards, Remedial Action Schemes (RAS) are developed for the transmission grids. These 10
schemes automatically make changes to the system when a contingency occurs to maintain 11
loadings and voltages within acceptable levels. Under one of these schemes, Power Services is 12
requested by Transmission Services to instantaneously drop (disconnect from the system) large 13
increments of generation (at least 600 MW). To satisfy this requirement, the generation must be 14
dropped virtually instantaneously from a certain region of the transmission grid. Under the 15
current configuration of the transmission grid and the individual generating plant controls, Power 16
Services can most expeditiously provide this service by dropping one of the Grand Coulee Third 17
Powerhouse hydroelectric units (each of which exceeds 600 MW capacity). 18
19
5.3 Forecast Amount of Generation Dropping 20
Historically, large generating units at Grand Coulee have been dropped 18 times over the last 21
17 years (1996–2012). Therefore, the estimate of “large generating units dropped” is an average 22
of approximately one drop per year. 23
24
25
BP-14-FS-BPA-05
Page 24
5.4 General Methodology 1
The valuation approach considers two factors. First, the desired Generation Dropping Service or 2
“forced outage duty” causes additional wear and tear on equipment that will decrease the life and 3
increase the maintenance of the unit. For each major component that is affected by this service, 4
Documentation Table 5.1 shows the cost associated with equipment deterioration, replacement, 5
and overhaul, and the cost associated with routine operation and maintenance. 6
7
Power Services previously contracted with Harza Engineering Company to work with 8
Reclamation and COE (which own and operate the Columbia River system plants) to evaluate 9
the costs of providing this “generation drop” service. The evaluation estimated the cost incurred 10
by a typical Reclamation or COE generating unit. These cost estimates are applied to a 11
generating unit at the Grand Coulee Third Powerhouse. The costs in the original engineering 12
study are updated using the Handy-Whitman Index to reflect price escalation of equipment and 13
labor costs. 14
15
Second, lost revenues resulting from the outages required during replacement or overhaul of the 16
equipment are computed. The market price forecast is applied to the energy amounts to 17
determine the costs. Power Risk and Market Price Study, BP-14-FS-BPA-04, section 2.4. 18
Documentation Table 5.1, columns H–K, shows the calculation of this lost revenue. 19
20
5.5 Generation Dropping Cost 21
Historical data for the Grand Coulee Third Powerhouse generating units and statistical data for 22
other hydroelectric units provide capital cost, operation and maintenance costs, and frequency of 23
operation information for the generation dropping analysis. Stresses on the equipment during 24
“forced outage duty” versus stresses during “normal operation” are compared. Through the 25
application of this data, the capital and operation and maintenance costs for the generation drop 26
BP-14-FS-BPA-05
Page 25
service are developed. The impacts are converted into a percentage change in equipment life for 1
each operation. Finally, the estimated costs and lost revenue for the most likely type of overhaul 2
or replacement that would need to be made are evaluated for a reduced life expectancy of the 3
equipment. Documentation Table 5.1, column B, shows the percentage reductions in life 4
expectancies per generation drop. These percentages are also used to determine the incremental 5
routine O&M cost. 6
7
In addition to capital and operation and maintenance costs, the revenue lost during outages for 8
the overhaul or replacement of equipment is significant for the large generating units with a 9
capacity exceeding 600 MW. Although some outages for routine maintenance could be 10
scheduled to avoid large revenue losses, other outages cannot be scheduled to avoid lost 11
revenues. Thus, such lost revenues are calculated based on the forecast market price averaged 12
over the rate period, FY 2014–2015. It is assumed that these outages are unpredictable or longer 13
than scheduled, and cannot be scheduled to avoid a loss in total project generation. 14
Documentation Table 5.1, columns H–K, shows the calculation of the lost revenue. 15
16
5.6 Equipment Deterioration, Replacement, or Overhaul 17
The effect of additional deterioration because of Generation Dropping is a reduced period of time 18
between major maintenance activities, such as major overhauls or replacements. For purposes of 19
this analysis, a “major overhaul” is defined as a maintenance activity for which at least partial 20
disassembly of the affected equipment is required. The analysis focuses on evaluating the costs 21
of additional, short-term deterioration of specific components or items for which statistical data 22
are readily available. The costs of a major overhaul are derived from estimates or similar work 23
performed in the past. The percentage life reductions are determined using industry standards or 24
BP-14-FS-BPA-05
Page 26
actual project records. For example, turbine overhaul is a major maintenance effort that will be 1
increased in frequency as a result of more frequent severe duty cycles. 2
3
5.7 Costs to be Allocated to Transmission Services 4
The factors described above are analyzed for their application on a single generating unit at the 5
Grand Coulee Third Powerhouse and their effects combined to produce a single, overall cost 6
associated with each generation drop. 7
8
From the analyses, the total cost associated with a single generator drop of one of the Grand 9
Coulee Third Powerhouse Units is calculated to be $333,061. Documentation Table 5.1, line 6. 10
Because the estimate of large generating units dropped is an average of one drop per year, the 11
annual cost is $333,061. This cost is assigned to Transmission Services for recovery in 12
transmission rates. The rate period annual average cost for Generation Dropping is a revenue 13
credit to the power rates. Power Rates Study, BP-14-FS-BPA-01, section 4.3. 14
15
16
17
18
19
20
21
22
23
24
25
BP-14-FS-BPA-05
Page 27
6. REDISPATCH 1
6.1 Introduction 2
Under Open Access Transmission Tariff (OATT) Attachment M, Transmission Services initiates 3
redispatch of Federal resources as part of congestion management efforts. Generally, redispatch 4
results in decrementing (dec) resources that can effectively relieve flowgates that are at or near 5
Operating Transfer Capability (OTC) limits and incrementing (inc) other resources to maintain 6
service to loads. Transmission Services is paid for the decrementing of resources and pays for 7
the incrementing of resources. This concept is intended to keep the incrementing and 8
decrementing resource whole financially. 9
10
In the case of a decrementing resource, the resource owner avoids certain costs associated with 11
generation, such as fuel costs and operation and maintenance costs, and decrementing the 12
resource also reduces the risk that a curtailment may be necessary to relieve the congestion. As a 13
result, the owner of the decrementing resource pays Transmission Services the equivalent of its 14
avoided costs and reduces the risk of curtailments. 15
16
In the case of an incrementing resource, the resource generates energy that it could have 17
otherwise sold. To keep the incrementing resource whole financially, Transmission Services 18
pays the resource owner for the value of that generation. In practice, under OATT 19
Attachment M, Power Services is the provider of both the inc and the dec resource. This 20
typically results in a net payment to Power Services for each redispatch event. In this document 21
the term “revenue” or “amount” refers to the net revenue associated with the Power Services inc 22
and dec redispatch activity. 23
24
25
BP-14-FS-BPA-05
Page 28
There are three levels of redispatch under OATT Attachment M that Transmission Services can 1
request from Power Services to relieve flowgate congestion: Discretionary Redispatch, NT Firm 2
Redispatch, and Emergency Redispatch. Power Services may provide redispatch under 3
Attachment M through redispatch of Federal generation, through purchases and/or sales of 4
energy, or through transmission purchases. The purposes of each of these types of redispatch are 5
discussed further below. The actual revenue Power Services receives from Transmission 6
Services for providing redispatch under Attachment M is calculated based on one of two sources, 7
depending on how the redispatch is provided, either (1) based on market prices for incrementing 8
and decrementing Federal generation at the time the redispatch is provided, for redispatch 9
provided from Federal generation, or (2) based on the actual cost to Power Services of 10
purchasing and/or selling power or purchasing transmission, for redispatch provided by 11
purchases and/or sales of energy or purchases of transmission. 12
13
This Study forecasts revenues Power Services expects to receive from Transmission Services for 14
the provision of redispatch under Attachment M. The revenue forecast for Power Services 15
providing redispatch for FY 2014–2015 is developed by identifying the costs from Power 16
Services providing redispatch in FY 2010–2011, the most recent rate period for which BPA has 17
actual data, and comparing this amount to the forecast for the same period. The forecast is 18
adjusted up or down based on this comparison and on the variables that drive the costs of 19
redispatch. The forecast may be adjusted upward to reflect potential increases due to increased 20
uncertainty or anticipated increases in market prices; or it may be adjusted downward to reflect 21
unusual redispatch events that are not expected to recur, increased constraints on Power 22
Services’ ability to provide redispatch, or anticipated decreases in market prices. 23
24
25

BP-14-FS-BPA-05
Page 29
6.2 Discretionary Redispatch 1
Under OATT Attachment M, Transmission Services may request bids for Discretionary 2
Redispatch from Federal resources to inc and dec generation prior to curtailment of any 3
transmission schedules. Power Services may respond to requests for Discretionary Redispatch 4
by offering, at each generating project, either no Discretionary Redispatch or any amount of 5
Discretionary Redispatch up to the amount requested. 6
7
For FY 2010 and FY 2011, Transmission Services forecast payments to Power Services for 8
Discretionary Redispatch of $175,000 per year. Actual Power Services revenues from the 9
Discretionary Redispatch that Power Services provided to Transmission Services totaled $46,439 10
in FY 2010 and $11,355 in FY 2011. Documentation Table 6.1, lines 28-29. Documentation 11
Table 6.1 provides the actual monthly Discretionary Redispatch revenues and other details for 12
FY 2010 and FY 2011. 13
14
As described above, the actual Power Services revenues for FY 2010 and FY 2011 were 15
considerably lower than the $175,000 per year forecast for the FY 2010–2011 rate period. 16
Power Services’ provision of Discretionary Redispatch and the resulting revenues have been 17
declining over time as the FCRPS becomes more constrained. Power Services’ provision of 18
Discretionary Redispatch and associated actual revenues in FY 2011 were much lower than 19
forecast costs due in part to an extremely high water year. High water conditions limit flexibility 20
on the FCRPS and thus limit Power Services’ ability to provide redispatch of Federal generation. 21
22
The forecast for FY 2014 and FY 2015 Discretionary Redispatch is $50,000 per year. This is a 23
reduction from previous years’ forecasts and is based on the lower-than-forecast actual revenues 24
in FY 2010 and FY 2011 and increasing constraints on Power Services’ ability to provide 25
Discretionary Redispatch on a monthly and seasonal basis. The forecast amount for FY 2014 26

BP-14-FS-BPA-05
Page 30
and FY 2015 is greater than actual average revenues in previous years to reflect the 1
unpredictable nature of transmission congestion and the need for Discretionary Redispatch, and 2
the risk inherent in forecasting Discretionary Redispatch costs. 3
4
6.3 NT Firm Redispatch 5
NT Firm Redispatch is provided under OATT Attachment M. Transmission Services requests 6
NT Firm Redispatch from Power Services to maintain firm NT schedules after all non-firm 7
Point-to-Point and secondary NT schedules are curtailed in a sequence consistent with NERC 8
curtailment priority. Power Services must provide NT Firm Redispatch when requested by 9
Transmission Services to the extent that it can do so without violating non-power constraints. 10
11
For FY 2010–2011, Transmission Services forecast payments to Power Services for NT Firm 12
Redispatch of $225,000 per year. Actual revenues to Power Services from NT Firm Redispatch 13
provided to Transmission Services totaled $49,261 in FY 2010 and $470,500 in FY 2011 14
(averaging $259,881 per year). Documentation Table 6.2, lines 26-27. This revenue represents 15
payments from Transmission Services to Power Services associated with NT Firm Redispatch 16
provided through transmission purchases only. There were no Power Services revenues 17
associated with Power Services providing NT Firm Redispatch through the redispatch of Federal 18
generation or through power purchases or sales over this time period. Documentation Table 6.2 19
provides, for FY 2010 and FY 2011, the actual monthly NT Firm Redispatch revenues, the 20
megawatthours redispatched, dollars per megawatthour, and the constrained path. 21
22
Given the increase in the need for NT Firm Redispatch in FY 2011, which is expected to 23
continue, the resulting higher-than-forecast average annual revenues in the FY 2010–2011 rate 24
BP-14-FS-BPA-05
Page 31
period, and the variability in transmission and power prices on a monthly and seasonal basis, the 1
forecast for NT Firm Redispatch in FY 2014–2015 is $350,000 per year. 2
3
6.4 Emergency Redispatch 4
Emergency Redispatch is provided under OATT Attachment M. Transmission Services requests 5
Emergency Redispatch from Power Services when Transmission Services declares a System 6
Emergency as defined by NERC. Power Services must provide Emergency Redispatch when 7
requested by Transmission Services even if Power Services may violate non-power constraints. 8
9
The forecast of costs from the provision of Emergency Redispatch by Power Services to 10
Transmission Services was $0 for the FY 2010–2011 and FY 2012–2013 rate periods. Actual 11
revenues from Emergency Redispatch provided by Power Services to Transmission Services for 12
FY 2010 totaled $1,510, resulting from one Emergency Redispatch event. No Emergency 13
Redispatch was provided in FY 2011. 14
15
Due to the unlikely nature of Emergency Redispatch and the low actual revenues of Emergency 16
Redispatch for FY 2010 and FY 2011, the cost of Emergency Redispatch is forecast to be $0 for 17
FY 2014–2015. 18
19
6.5 Revenue Forecast for Attachment M Redispatch Service 20
Based on the analysis above, a total of $400,000 per year is forecast for FY 2014–2015 for 21
redispatch services provided by Power Services to Transmission Services under OATT 22
Attachment M. 23
24
25

BP-14-FS-BPA-05
Page 32
This page intentionally left blank.

BP-14-FS-BPA-05
Page 33
7. SEGMENTATION OF U.S. ARMY CORPS OF ENGINEERS AND U.S. 1 BUREAU OF RECLAMATION TRANSMISSION FACILITIES 2
7.1 Introduction 3
The U.S. Army Corps of Engineers (COE) and U.S. Bureau of Reclamation (Reclamation) own 4
transmission facilities associated with their respective generating projects within the FCRPS. All 5
COE and Reclamation costs are assigned to the generation function in the Power Revenue 6
Requirement Study, BP-14-FS-BPA-02. Therefore, this study identifies COE and Reclamation 7
transmission-related investment so that the proper portion of the annual cost of these 8
transmission facilities may be assigned to Transmission Services. The annual cost of these 9
transmission facilities includes operations and maintenance (O&M) expenses, depreciation, 10
interest expense, and Minimum Required Net Revenue (MRNR). 11
12
The COE and Reclamation transmission-related investment is associated with three Federal 13
Columbia River Transmission System (FCRTS) segments: (1) Generation Integration, 14
(2) Integrated Network, and (3) Utility Delivery. The Generation Integration investment is 15
assigned to Power Services to be recovered through power rates. The average annual cost of the 16
Network and Utility Delivery investments over the rate period is allocated to Transmission 17
Services, with an offsetting revenue credit to the Power Services revenue requirement. The 18
definitions of these segments are consistent with the definitions used in the Transmission 19
Segmentation Study, BP-14-FS-BPA-06, section 2. The relevant segment definitions and cost 20
treatment are described below. 21
22
7.2 Generation Integration 23
Generation Integration facilities connect Federal generation to the BPA Network. This segment 24
includes generator step-up transformers (GSUs) and the substation terminals and lines that 25
BP-14-FS-BPA-05
Page 34
integrate the Federal generation into the network. The COE and Reclamation Generation 1
Integration costs are functionalized to the generation function. 2
3
7.3 Integrated Network 4
Integrated Network facilities provide for bulk transmission of electric power within the Pacific 5
Northwest and operate at voltages of 34.5 kilovolts (kV) and above. This Study identifies the 6
COE and Reclamation transmission costs that are associated with Network facilities and 7
allocates these costs to Transmission Services. 8
9
7.4 Utility Delivery 10
Utility Delivery facilities deliver power to BPA utility customers at voltages below 34.5 kV. 11
The COE and Reclamation transmission costs that are associated with Utility Delivery facilities 12
are allocated to Transmission Services. 13
14
7.5 COE Facilities 15
The transmission facilities owned by the COE are primarily GSUs and associated equipment at 16
the projects. These facilities are all associated with Generation Integration, which is 17
functionalized to the generation function. There is one exception at the Bonneville Project. At 18
Bonneville Powerhouse No. 1, the COE owns the switching equipment on the dam that performs 19
both Network and Generation Integration functions. This switching equipment is segmented 20
between Network and Generation Integration as described in Documentation Table 7.1. 21
22
7.6 Reclamation Facilities 23
Reclamation owns the lines and switchyards in the substations at its plants within the FCRPS. 24
The primary function of these facilities is to connect the generators to the Network, but at some 25
BP-14-FS-BPA-05
Page 35
substations there are facilities that perform Network and Utility Delivery functions. The 1
Documentation shows the information used to assign the lines and substation investment at each 2
Reclamation project to the appropriate segment. Documentation Tables 7.2 and 7.3 describe the 3
Columbia Basin project (Grand Coulee), and Table 7.5 describes the other Reclamation projects: 4
the Hungry Horse Project, the Roza and Kennewick Divisions of the Yakima Project, the Rogue 5
River (Green Springs) Project, the Minidoka and Palisades Divisions of the Minidoka-Palisades 6
Project, and the Boise Project (Anderson Ranch and Black Canyon). 7
8
The available Reclamation investment data does not disaggregate costs to the equipment level. 9
Therefore, to develop investment by segment(s), typical costs are used as a proxy for major 10
pieces of equipment. Documentation Tables 7.4 and 7.5. The proxy investment by segment is 11
divided by the total proxy investment for each switchyard or facility to develop a percentage for 12
each segment. These percentages are then multiplied by the actual total switchyard or facility 13
investment to estimate the actual investment for each segment. Id. The segment percentage is 14
multiplied by the total transmission investment for each facility to determine the segment 15
investment. Documentation Tables 7.3 and 7.5. 16
17
The investment related to the land associated with the Reclamation switchyard equipment is 18
included in the total investment. As shown on Reclamation financial statements, the total 19
investment related to the land associated with the switchyards at the Roza Division of the 20
Yakima Project, the Minidoka Division of the Minidoka-Palisades Project, and the Boise Project 21
totals $10,458, or about 0.06 percent of the combined $18,937,411 investment of these projects. 22
Documentation Table 7.5. 23
24
25

BP-14-FS-BPA-05
Page 36
7.6.1 Columbia Basin Transmission Investment 1
The Columbia Basin project includes generation equipment and associated switchyard 2
equipment. The Reclamation transmission facilities start at the generator side (low side) of the 3
step-up transformer and include the step-up transformers but not the powerhouse switching 4
equipment. The Columbia Basin project investment also includes the 115/12.5 kV facilities at 5
the Coulee Left Switchyard, which are used for station service and deliver power at 12.5 kV to 6
the Town of Coulee Dam, Nespelem Valley Electric Cooperative at Lone Pine, and Grant PUD. 7
Documentation Tables 7.3 and 7.4. Because these facilities serve both Generation Integration 8
and Utility Delivery functions, the investment at these facilities is segmented accordingly. 9
10
In calculating the investment for the Columbia Basin project, interest during construction (IDC) 11
and other general costs are allocated based on investment. The IDC allocated to each segment is 12
based on the IDC for the entire project divided by the total project investment, or an interest rate 13
of 11.6 percent, using FY 2011 data. Documentation Table 7.3, line 5. The investment in the 14
Columbia Basin project does not include construction work in progress. 15
16
The inclusion of land costs increases the Columbia Basin investment by $70,623, or 0.03 percent 17
of the total investment. Id. line 12. In accordance with Reclamation practice, IDC is not applied 18
to land associated with Columbia Basin transmission costs. 19
20
The Generation Integration segment comprises 67.8 percent of the transmission investment in the 21
Columbia Basin project; the Integrated Network segment comprises 31.1 percent; and the Utility 22
Delivery segment comprises 1.1 percent. Id. line 31. 23
24
25
26
BP-14-FS-BPA-05
Page 37
7.7 Annual Cost of the COE and Reclamation Facilities allocated to 1 Transmission Services 2
The investment for COE and Reclamation transmission facilities totals $200.9 million for 3
Generation Integration, $77.5 million for Integrated Network, and $2.4 million for Utility 4
Delivery. Documentation Table 7.6, line 7. The proportion of the investment associated with 5
Integrated Network and Utility Delivery facilities compared to the total hydro system investment 6
is used to develop the proportion of the total hydro system costs allocated to Transmission 7
Services. 8
9
For each facility, the annual forecast of total hydro system O&M expense is multiplied by the 10
ratio of the facility’s transmission investment (Integrated Network plus Utility Delivery) to the 11
total hydro system investment to determine the amount of the total hydro system O&M expense 12
that is allocated to Transmission Services. Power Revenue Requirement Study Documentation, 13
BP-14-FS-BPA-02A, Tables 2G and 2H. The O&M expense allocated to Transmission Services 14
at each facility is then further allocated between the Integrated Network and Utility Delivery 15
segments according to the allocated investment in each segment for the facility. The segmented 16
O&M costs across all the facilities are added to determine the annual total O&M costs allocated 17
to Transmission Services. 18
19
The depreciation expense for each facility is calculated based on the gross transmission 20
investment in the facility and the appropriate depreciation rates. Id. The depreciation at each 21
facility is allocated between the Integrated Network and Utility Delivery segments according to 22
the allocated investment in each segment for the facility. The segmented depreciation costs 23
across all the facilities are added to determine the annual total depreciation costs allocated to 24
Transmission Services. 25
26
BP-14-FS-BPA-05
Page 38
A portion of the general costs to be recovered from all power rates is included in the 1
transmission costs associated with the COE and Reclamation facilities, because they are part of 2
the FCRPS. This includes both the hydro system net interest expense and hydro system MRNR. 3
Id. These costs are multiplied by the ratio of the COE and Reclamation transmission net plant 4
investment to the hydro system net plant investment to calculate the portion of the hydro system 5
interest expense and MRNR allocated to Transmission Services. The costs allocated to 6
Transmission Services are further allocated to the Integrated Network and Utility Delivery 7
segments according to the investment allocated to each segment from all COE and Reclamation 8
facilities. 9
10
Adding the costs from each category results in a total annual cost allocated to Transmission 11
Services of $7.699 million for FY 2014 and $7.500 million for FY 2015. Id. The power revenue 12
requirement is reduced by these amounts, and the transmission revenue requirement is increased 13
by these amounts, for each respective year of the rate period. 14
15
16
17
18
19
20
21
22
23
24
25
BP-14-FS-BPA-05
Page 39
8. STATION SERVICE 1
8.1 Introduction 2
Station service refers to real power that Transmission Services takes directly off the BPA power 3
system for use at substations and other locations, such as facilities located on BPA’s Ross 4
Complex and Big Eddy/Celilo Complex. For purposes of this Study, station service does not 5
include power that BPA purchases from another utility or that is supplied by another utility for 6
station service purposes. Because there are locations on the system where BPA does not have 7
meters to measure station service use, the amount of energy use at BPA substations and other 8
facilities is estimated. The annual average forecast market price from the Power Risk and 9
Market Price Study, BP-14-FS-BPA-04, section 2.4, is applied to the estimated annual energy 10
use adjusted for transmission losses to yield the annual costs that are allocated to Transmission 11
Services for station service energy use. This section describes the station service energy use and 12
determines the costs that are allocated to Transmission Services for station service energy use. 13
14
8.2 Overview of Methodology 15
The station service costing methodology consists of the following steps. First, the amount of 16
installed transformation is established, measured in kilovolt amperes (kVA) at all BPA 17
substations served directly by the BPA power system. Second, the historical monthly average 18
station service energy use is determined for substations for which load data exists. Third, an 19
average load factor is derived based on the ratio of installed station service transformation and 20
energy use for those substations for which load data exists. Fourth, the station service energy use 21
for all facilities other than the Ross and Big Eddy/Celilo complexes is estimated by applying the 22
average load factor to the total installed station service transformer capacity. This energy use is 23
then added to the historical use for the Ross and Big Eddy/Celilo complexes to estimate total 24
average monthly energy use. The monthly amount is multiplied by 12 to yield an annual average 25
BP-14-FS-BPA-05
Page 40
estimated total energy use for all substations, which is then adjusted for transmission losses by 1
applying the BPA network loss factor, 1.9 percent. The annual average forecast market price 2
from the Power Risk and Market Price Study, BP-14-FS-BPA-04, section 2.4, is applied to the 3
estimated annual energy use adjusted for transmission losses to yield the annual costs that are 4
allocated to Transmission Services for station service energy use. 5
6
8.3 Assessment of Installed Transformation 7
The methodology begins by identifying the amount of installed transformation for all BPA 8
substations. Installed transformation transforms power to a lower voltage to supply power to the 9
buildings and equipment at the substations. The total installed transformation is 46,214 kVA. 10
Documentation Table 8.2, line 6. Of this amount, the total amount of installed transformation at 11
BPA substations for which load data exists is 15,456 kVA. Documentation Table 8.1, line 41. 12
13
8.4 Assessment of Station Service Energy Use 14
The historical average monthly use for the Ross Complex is 1,749,300 kWh and for the Big 15
Eddy/Celilo Complex is 1,822,937 kWh, for a total of 3,572,237 kWh. Documentation 16
Table 8.2, lines 4-5. 17
18
The total historical average monthly use for other BPA locations for which load data exists is 19
1,066,446 kWh. Documentation Table 8.1, line 41. Because not all use is metered, the total 20
average monthly use for BPA substations is estimated based on the historical average monthly 21
use multiplied by the average load factor. Documentation Table 8.2, lines 1-3. 22
23
24
25
BP-14-FS-BPA-05
Page 41
8.5 Calculation of Average Load Factor 1
The average monthly load factor is calculated by dividing the total historical monthly use for 2
BPA substations for which load data is available by the total installed station service 3
transformation for these BPA substations. This yields an average 9.45 percent load factor. 4
Documentation Table 8.1, line 41. 5
6
8.6 Calculating the Total Quantity of Station Service 7
The total installed transformation is multiplied by the average calculated load factor to yield the 8
calculated historical average monthly use for all facilities other than the Ross and Big 9
Eddy/Celilo complexes. Documentation Table 8.2, lines 1-3. The historical station service 10
energy use for the Ross Complex and Big Eddy/Celilo Complex is then added to the calculated 11
amount of energy use at all other BPA substations. Id. lines 4-5. The total quantity of station 12
service average use that Power Services supplies directly to BPA substations and other facilities 13
is then adjusted for transmission losses by multiplying the average use by the BPA Transmission 14
Network loss factor of 1.9 percent. BPA Open Access Transmission Tariff Schedule 11. The 15
adjusted quantity of station service average use supplied to BPA substations and other facilities 16
after adding in network losses is estimated to be 82,665,068 kWh per year. Id. line 6. 17
18
8.7 Determining Costs to Allocate to Station Service 19
The annual average forecast market price (Power Risk and Market Price Study, 20
BP-14-FS-BPA-04, section 2.4) applied to the estimated annual quantity of station service 21
energy yields the costs per year to be allocated to station service. The rate period annual average 22
cost for station service is $2,384,885. Documentation Table 8.2. 23
24
The rate period annual average cost for station service is a revenue credit to the power rates. 25
Power Rates Study, BP-14-FS-BPA-01, section 4.3. 26
BP-14-FS-BPA-05
Page 42
These costs are assigned to the Network, Southern Intertie, Eastern Intertie, Utility Delivery, DSI 1
Delivery, and Generation Integration transmission segments based on the allocation of three-year 2
average Operations & Maintenance segmentation. Transmission Revenue Requirement Study, 3
BP-14-FS-BPA-08. 4
5
6
7
8
9
10
11
12
13
14
15
16
17
18
19
20
21
22
23
24
25

BP-14-FS-BPA-05
Page 43
TABLES

BP-14-FS-BPA-05
Page 44
This page intentionally left blank.

BP-14-FS-BPA-05
Page 45
A B C D E
Generation Inputs Rate or Cost Unit
Annual Average for
FY 2014-2015
Forecast Quantity
Annual Average for
FY 2014-2015
Revenue Forecast
1 Regulating Reserve 0.12 mills/kWh/month 5,763 6,058,066$
2Variable Energy Resource Balancing Service
Reserve - 30/60 Committed Scheduling 1.20$ $/kW/month 1,067 15,364,800$
3Variable Energy Resource Balancing Service
Reserve - 40/15 Committed Scheduling 0.94$ $/kW/month - -$
4Variable Energy Resource Balancing Service
Reserve - 30/30 Committed Scheduling 0.87$ $/kW/month 25 261,000$
5Variable Energy Resource Balancing Service
Reserve - 30/15 Committed Scheduling 0.73$ $/kW/month - -$
6Variable Energy Resource Balancing Service
Reserve - Uncommitted Scheduling 1.48$ $/kW/month 2,104 37,367,040$
7
Variable Energy Resource Balancing Service
Reserve - Self-Supply of Generation
Imbalance
0.40$ $/kW/month 1,391 6,676,800$
8Adjustment for VERBS Mid-Rate Period
Elections Forecast(3,649,800)$
9Variable Energy Resource Balancing Service
for Solar 0.21$ $/kW/month 23 57,960$
10Dispatchable Energy Resource Balancing
Service Reserve inc18.15 mills/kW/month 150,317 2,728,254$
11Dispatchable Energy Resource Balancing
Service Reserve dec3.94 mills/kW/month 98,410 387,735$
12Dispatchable Energy Resource Balancing
Service Reserve Total 3,115,989$
13
Adjustment for Settlement for Generation
Inputs and Transmission Ancillary and
Control Area Service Rates
(3,769,249)$
14 Operating Reserve - Spinning 10.86 mills/kWh/month 227.9 21,680,947$
15 Operating Reserve - Supplemental 9.95 mills/kWh/month 227.9 19,864,220$
16 Operating Reserve Total 455.8 41,545,167$
17 Synchronous Condensing 28.85$ MWh + $288,000 44,397 1,572,849$
18 Generation Dropping 1 drop/year 333,061$
19 Redispatch 400,000$
20Segmentation of COE/Reclamation Network
and Delivery Facilities7,600,000$
21 Station Service 28.85$ MWh 82,665 2,384,885$
22 Generation Inputs Total 115,318,568$
Table 1
Power Services' Generation Inputs Revenue Forecast for FY 2014-2015
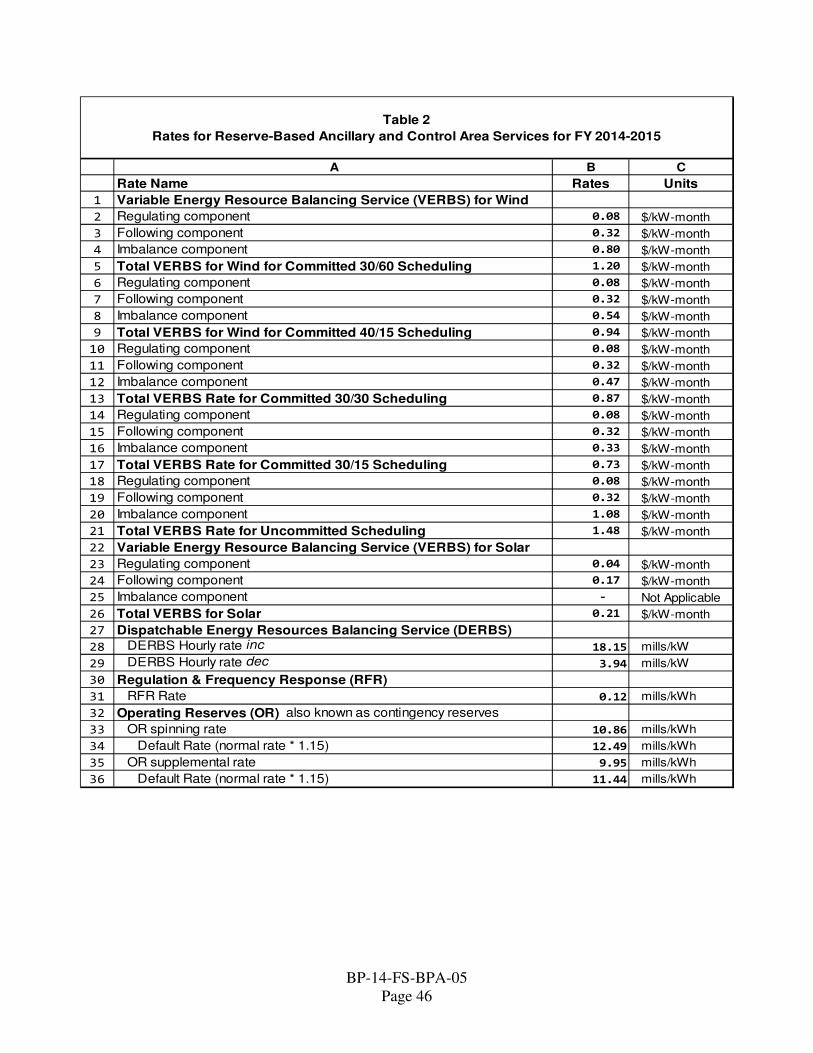
BP-14-FS-BPA-05
Page 46
A B C
Rate Name Rates Units
1 Variable Energy Resource Balancing Service (VERBS) for Wind
2 Regulating component 0.08 $/kW-month
3 Following component 0.32 $/kW-month
4 Imbalance component 0.80 $/kW-month
5 Total VERBS for Wind for Committed 30/60 Scheduling 1.20 $/kW-month
6 Regulating component 0.08 $/kW-month
7 Following component 0.32 $/kW-month
8 Imbalance component 0.54 $/kW-month
9 Total VERBS for Wind for Committed 40/15 Scheduling 0.94 $/kW-month
10 Regulating component 0.08 $/kW-month
11 Following component 0.32 $/kW-month
12 Imbalance component 0.47 $/kW-month
13 Total VERBS Rate for Committed 30/30 Scheduling 0.87 $/kW-month
14 Regulating component 0.08 $/kW-month
15 Following component 0.32 $/kW-month
16 Imbalance component 0.33 $/kW-month
17 Total VERBS Rate for Committed 30/15 Scheduling 0.73 $/kW-month
18 Regulating component 0.08 $/kW-month
19 Following component 0.32 $/kW-month
20 Imbalance component 1.08 $/kW-month
21 Total VERBS Rate for Uncommitted Scheduling 1.48 $/kW-month
22 Variable Energy Resource Balancing Service (VERBS) for Solar
23 Regulating component 0.04 $/kW-month
24 Following component 0.17 $/kW-month
25 Imbalance component - Not Applicable
26 Total VERBS for Solar 0.21 $/kW-month
27 Dispatchable Energy Resources Balancing Service (DERBS)
28 DERBS Hourly rate inc 18.15 mills/kW
29 DERBS Hourly rate dec 3.94 mills/kW
30 Regulation & Frequency Response (RFR)
31 RFR Rate 0.12 mills/kWh
32 Operating Reserves (OR) also known as contingency reserves
33 OR spinning rate 10.86 mills/kWh
34 Default Rate (normal rate * 1.15) 12.49 mills/kWh
35 OR supplemental rate 9.95 mills/kWh
36 Default Rate (normal rate * 1.15) 11.44 mills/kWh
Table 2
Rates for Reserve-Based Ancillary and Control Area Services for FY 2014-2015


BONNEVILLE POW ER ADMINISTRATION
DOE/BP-4541 • July 2013